track b summary jeff lennox emory university atlanta
DESCRIPTION
Track B Summary Jeff Lennox Emory University Atlanta. Special thanks to my fellow Track B Rapporteurs :. Annie Luetkemeyer San Francisco. Juergen Rockstroh Bonn. Trip Gulick New York. And to the wonderful people of Rome for their hospitality!. When to Start ART. - PowerPoint PPT PresentationTRANSCRIPT

Track B Summary
Jeff LennoxEmory University
Atlanta

Special thanks to my fellow Track B Rapporteurs:
Annie Luetkemeyer San Francisco
Trip GulickNew York
Juergen RockstrohBonn
And to the wonderful people of Rome for their hospitality!

When to Start ART

When to Start ART
Risk of progression to AIDS or death in relation to CD4 cell levels in patients with sustained viral response to ART: COHERE cohort
Results - event rates per 1000 years suppressed
Most recent CD4 cell count (cells/µL)
First new AIDS eventor death from any cause (no. of events)
Death from any cause(no. of events)
<50 94.9 (54) 64.8 (38)
50-<200 30.5 (489) 20.0 (325)
200-<350 12.0 (548) 6.9 (318)
350-<500 7.9 (487) 3.8 (240)
500 5.2 (679) 2.4 (315)
•Similar results in an analysis of 27,108 patients in 4 M.S.F. programs in Africa- Patients who achieved a CD4 of 350-499 had 1.69 AHR for mortality compared to those who achieved CD4 >500
WELB05 Heiner; TUBDP0106 Maman

Delayed
Immediate
DelayedImmediate
HR: 0.6 [ 0.4, 0.9 ], P=0.01
Number at risk
HPTN 052: Effects of early versus delayed initiation ofART on HIV clinical outcomes
1763 HIV-infected individuals were randomized to receive ART at a CD4 count of 350-550 (immediate arm) or after two consecutive CD4 counts< 250/μL>200 (delayed arm).
Death, WHO stage 4 clinical event, pulmonary TB or severe bacterial infection

New Drugs and New Strategies
7
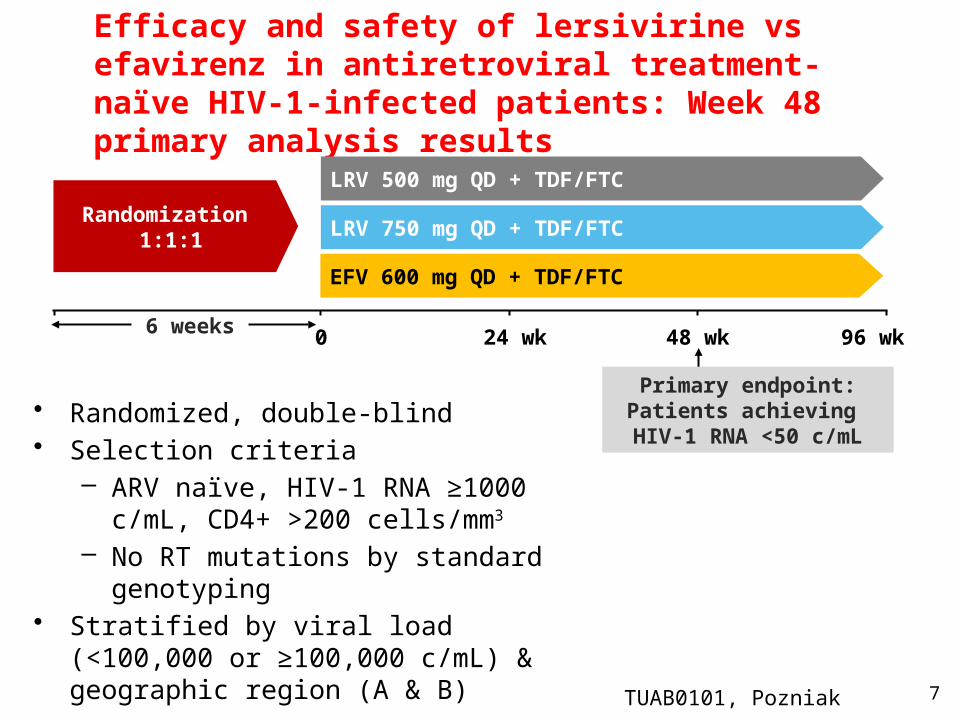
Efficacy and safety of lersivirine vs efavirenz in antiretroviral treatment-naïve HIV-1-infected patients: Week 48 primary analysis results
• Randomized, double-blind • Selection criteria
– ARV naïve, HIV-1 RNA ≥1000 c/mL, CD4+ >200 cells/mm3
– No RT mutations by standard genotyping• Stratified by viral load (<100,000 or ≥100,000
c/mL) & geographic region (A & B)
Randomization 1:1:1
EFV 600 mg QD + TDF/FTC
LRV 750 mg QD + TDF/FTC
0 48 wk 96 wk6 weeks 24 wk
Primary endpoint: Patients achieving
HIV-1 RNA <50 c/mL
LRV 500 mg QD + TDF/FTC
TUAB0101, Pozniak
0 2 4 8 16 24 32 40 48
0
10
20
30
40
50
60
70
80
90
100
Time (weeks)
% o
f subje
cts
with p
lasm
a
HIV
-1 R
NA
<50
c/m
L th
rough W
eek 4
8
LRV 500 mg
LRV 750 mg
EFV 600 mg
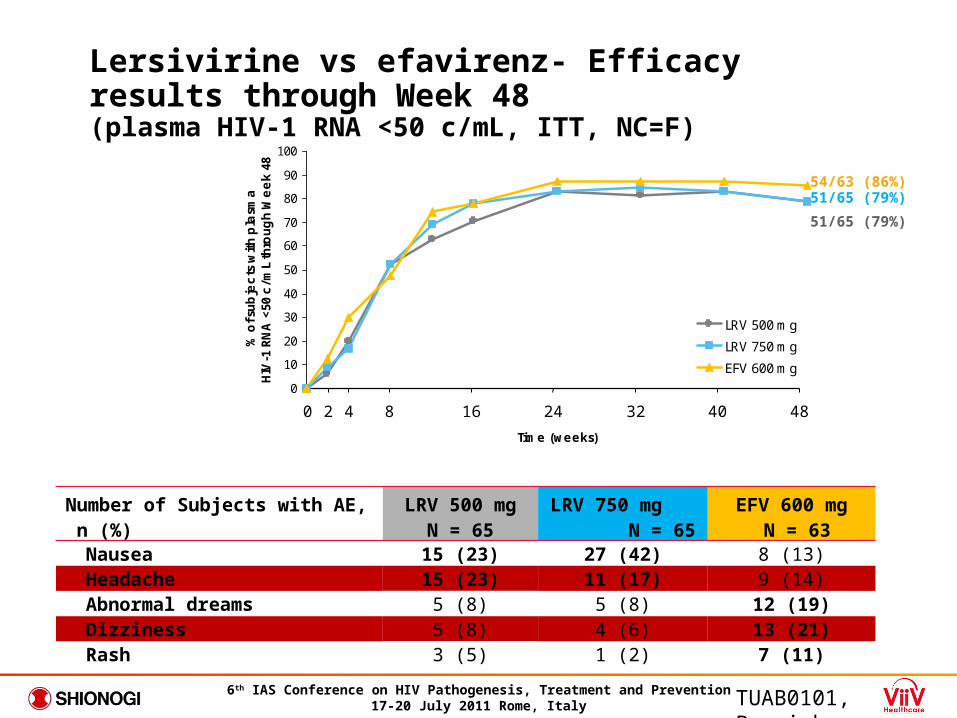
54/63 (86%)51/65 (79%)
51/65 (79%)
Lersivirine vs efavirenz- Efficacy results through Week 48(plasma HIV-1 RNA <50 c/mL, ITT, NC=F)
Number of Subjects with AE, n (%)
LRV 500 mgN = 65
LRV 750 mg N = 65
EFV 600 mg N = 63
Nausea 15 (23) 27 (42) 8 (13) Headache 15 (23) 11 (17) 9 (14) Abnormal dreams 5 (8) 5 (8) 12 (19) Dizziness 5 (8) 4 (6) 13 (21) Rash 3 (5) 1 (2) 7 (11)
TUAB0101, Pozniak
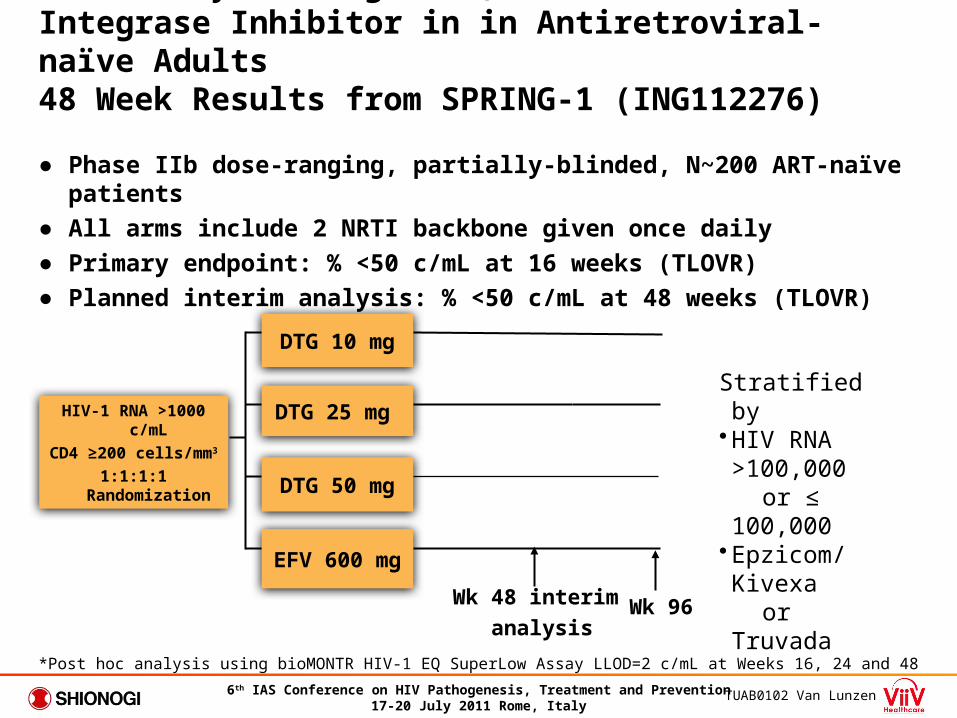
Once-daily Dolutegravir, a Next Generation Integrase Inhibitor in in Antiretroviral-naïve Adults 48 Week Results from SPRING-1 (ING112276)
● Phase IIb dose-ranging, partially-blinded, N~200 ART-naïve patients
● All arms include 2 NRTI backbone given once daily
● Primary endpoint: % <50 c/mL at 16 weeks (TLOVR)
● Planned interim analysis: % <50 c/mL at 48 weeks (TLOVR)
HIV-1 RNA >1000 c/mL
CD4 ≥200 cells/mm3
1:1:1:1 Randomization
EFV 600 mg
DTG 50 mg
DTG 25 mg
DTG 10 mg
Wk 48 interim
analysis
Stratified by•HIV RNA >100,000
or ≤ 100,000•Epzicom/Kivexa or Truvada
*Post hoc analysis using bioMONTR HIV-1 EQ SuperLow Assay LLOD=2 c/mL at Weeks 16, 24 and 48
Wk 96
TUAB0102 Van Lunzen

TUAB0102 Van Lunzen
DTG: Rapid and Sustained Antiviral ActivityWeek 48 Efficacy Analysis (%<50 c/mL)
Pro
po
rtio
n (
%)
<5
0 c
/mL
(T
LO
VR
)
91%
88%90%
82%
DTG 10mgDTG 25mg
DTG 50mgEFV 600mg
95% confidence intervals are derived using the normal approximation

Laboratory Findings
● > Grade 3 lab abnormalities were rare (DTG 12% vs. EFV 14%)● No Grade 3 or 4 ALT elevations in any subject● Changes (+/- SD) in serum creatinine over time
Note: no clinically relevant events nor discontinuations related to creatinineSee also abstract TUPE238 (Min et. al.)

QD maraviroc 150 mg in combination with ATV/r vs. FTC/TDF + ATV/r in treatment-naïve patients infected with R5 HIV-1 (Study A4001078): 48 week results
• Patient eligibility criteria – R5 HIV at screening– HIV-1 RNA ≥1000
copies/mL– CD4 ≥100 cells/mm3
– No evidence of resistance to ATV/r, TDF, or FTC
– Study is not powered to show a treatment difference and no formal comparative statistics will be performed
Randomization 1:1
N=121 MVC (150 mg QD) + ATV/r (300/100 mg QD)
FTC/TDF + ATV/r (300/100 mg QD)
0 24 wk 48 wkScreening(6 weeks) 16 wk
Interim analyses Primary analysis
TUAB0103, Mills
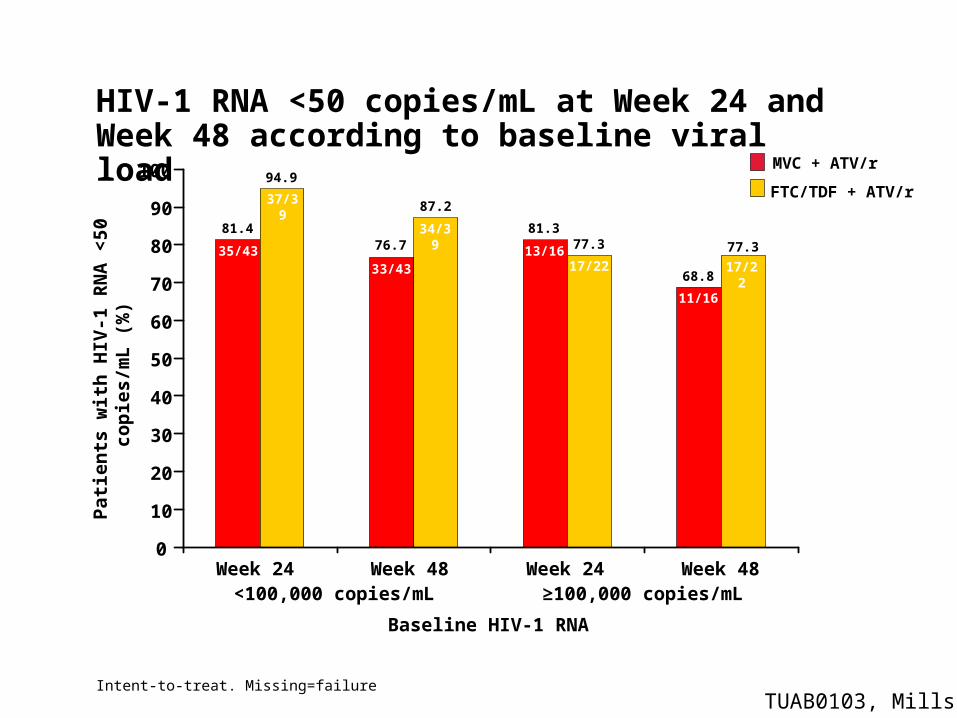
HIV-1 RNA <50 copies/mL at Week 24 and Week 48 according to baseline viral load
Week 24 Week 48 Week 24 Week 48
Pat
ien
ts w
ith
HIV
-1 R
NA
<50
co
pie
s/m
L (
%)
0
10
60
70
80
90
100
50
40
30
20
<100,000 copies/mL ≥100,000 copies/mL
Baseline HIV-1 RNA
34/39
33/43 17/22
11/16
76.7
87.2
68.8
77.3
37/39
35/43 13/1617/22
81.4
94.9
81.377.3
Intent-to-treat. Missing=failure
MVC + ATV/r
FTC/TDF + ATV/r
TUAB0103, Mills

Elvitegravir QD is non-inferior to raltegravir BID in treatment experienced patients:48 week results
WELBB05, Molina
• 702 Treatment-experienced patients, double blind, randomized • Background regimen (BR) based on resistance testing:
2nd Agent: fully active PI/r 3rd Agent: NRTI, ETR, MVC, T-20; If M184V/I, may add 3TC or FTC
• Non Inferiority Study with lower limit 95% CI at -10%

2011- The Year of (val)Acyclovir?
MOAC0201- Valacyclovir suppression reduces breast milk and plasma HIV-1 RNA postpartum: -results of a randomized clinical trial
TUAB0104- Impact of HSV-2 suppressive therapy with daily acyclovir on HIV-1 disease progression: a randomized placebo-controlled trial in Rakai, Uganda
TUAB0202- Peripartum valacyclovir improves markers of HIV-1 disease progression in women co-infected with HSV-2: a randomized trial
WEPDB0106- High-dose valacyclovir suppressive therapy results in greater reduction in plasma HIV-1 levels compared to standard dose acyclovir suppression among HIV-1/HSV-2 co-infected persons: a randomized, open-label, crossover trial
Complications
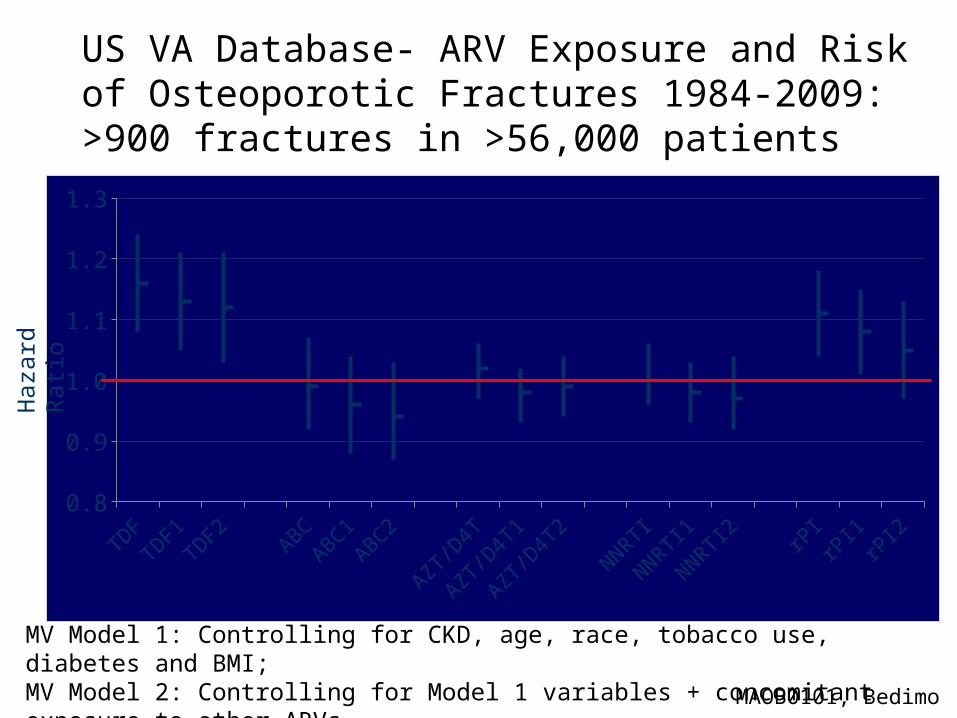
US VA Database- ARV Exposure and Risk of Osteoporotic Fractures 1984-2009: >900 fractures in >56,000 patients
MV Model 1: Controlling for CKD, age, race, tobacco use, diabetes and BMI; MV Model 2: Controlling for Model 1 variables + concomitant exposure to other ARVs.
TDFTD
F1TD
F2AB
CAB
C1AB
C2
AZT/
D4T
AZT/
D4T1
AZT/
D4T2
NNRTI
NNRTI1
NNRTI2 rP
IrP
I1rP
I20.8
0.9
1.0
1.1
1.2
1.3
Haz
ard
Rat
io
MAOB0101, Bedimo
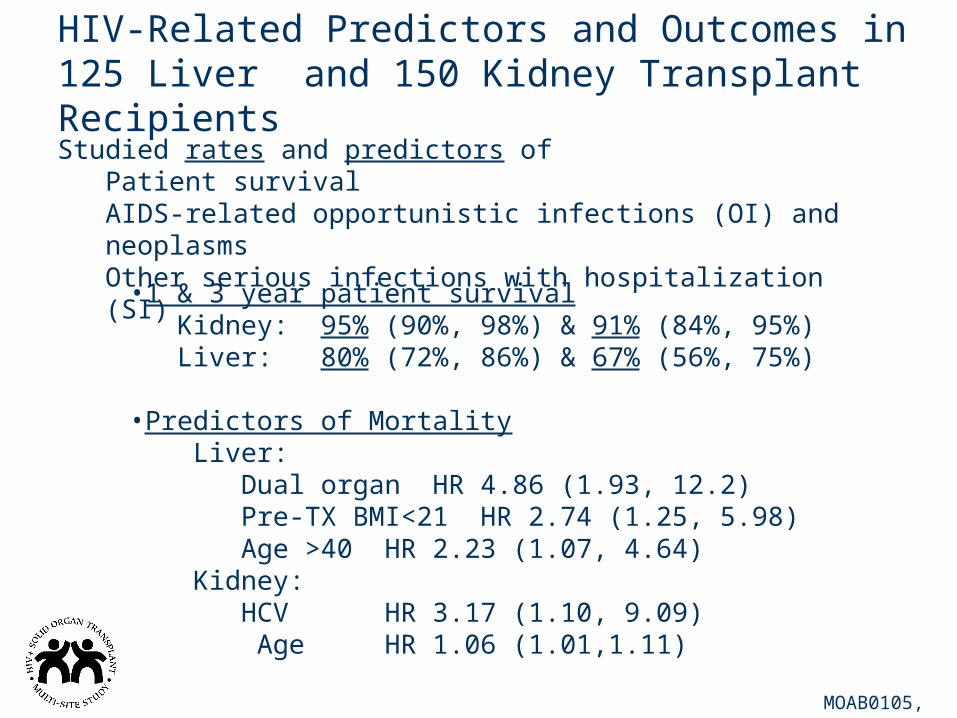
HIV-Related Predictors and Outcomes in 125 Liver and 150 Kidney Transplant Recipients
MOAB0105, Beatty
Studied rates and predictors ofPatient survivalAIDS-related opportunistic infections (OI) and neoplasmsOther serious infections with hospitalization (SI)
•1 & 3 year patient survivalKidney: 95% (90%, 98%) & 91% (84%, 95%)Liver: 80% (72%, 86%) & 67% (56%, 75%)
•Predictors of MortalityLiver:
Dual organ HR 4.86 (1.93, 12.2) Pre-TX BMI<21 HR 2.74 (1.25, 5.98)
Age >40 HR 2.23 (1.07, 4.64)Kidney:
HCV HR 3.17 (1.10, 9.09) Age HR 1.06 (1.01,1.11)
Infections

CARINEMO ANRS 12146
ART + RMP ART alone
•2NRTI + NVP 200mg BID vs EFV begun at 4-6 weeks of Rifampin containing therapy for TB•No difference in incidence of hepatitis or grade >2 rash between arms
Bhatt WELBX05
21
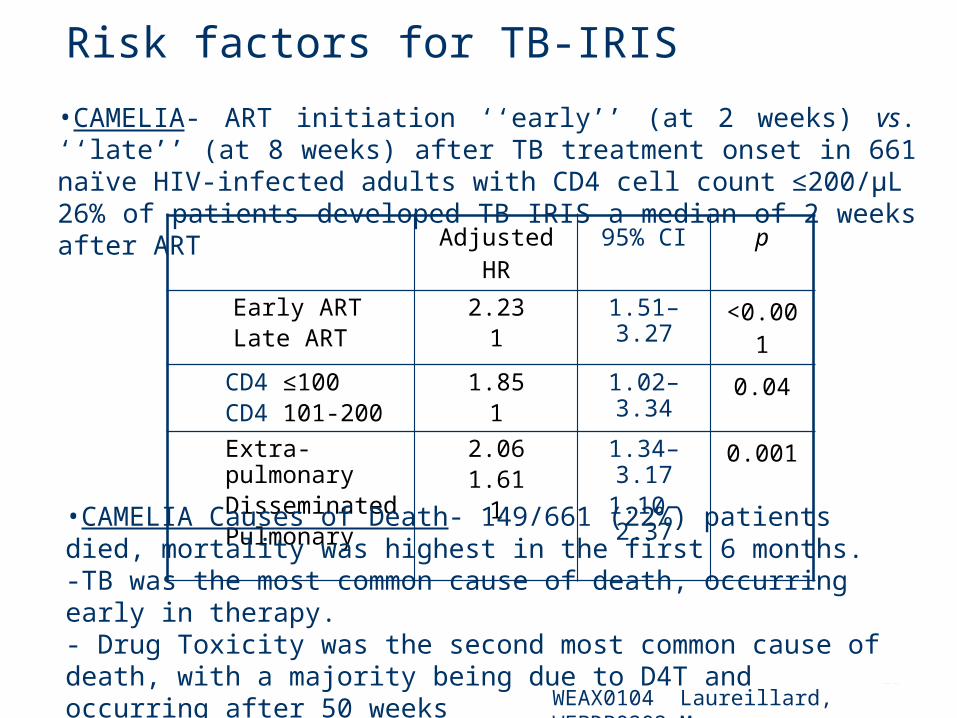
Risk factors for TB-IRIS
Adjusted HR 95% CI pEarly ARTLate ART
2.231
1.51–3.27 <0.001
CD4 ≤100CD4 101-200
1.851
1.02–3.34 0.04
Extra-pulmonary DisseminatedPulmonary
2.061.61
1
1.34–3.171.10–2.37
0.001
•CAMELIA- ART initiation ‘‘early’’ (at 2 weeks) vs. ‘‘late’’ (at 8 weeks) after TB treatment onset in 661 naïve HIV-infected adults with CD4 cell count ≤200/µL26% of patients developed TB IRIS a median of 2 weeks after ART
WEAX0104 Laureillard, WEPDB0202 Marcy
•CAMELIA Causes of Death- 149/661 (22%) patients died, mortality was highest in the first 6 months. -TB was the most common cause of death, occurring early in therapy.- Drug Toxicity was the second most common cause of death, with a majority being due to D4T and occurring after 50 weeks
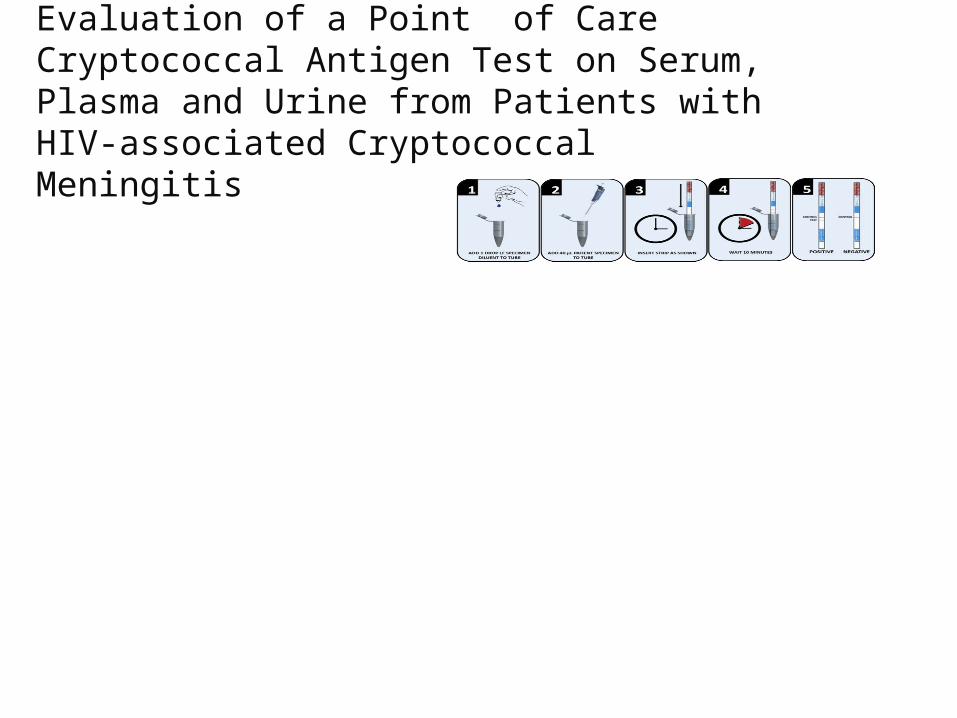
Evaluation of a Point of Care Cryptococcal Antigen Test on Serum, Plasma and Urine from Patients with HIV-associated Cryptococcal Meningitis
Serum Plasma Urine
CRAG LFA+ 61 61 61
CRAG LFA +/- 1 1 0
CRAG LFA - 0 0 1
Sensitivity of LFA 100% 100% 98%
95% CI* 94-100% 94-100% 91-100%
*95% confidence interval