traffic flow prediction during the holidays based on dft
TRANSCRIPT

Research ArticleTraffic Flow Prediction during the Holidays Based onDFT and SVR
Xianglong Luo ,1,2 Danyang Li,2 and Shengrui Zhang 1
1School of Highway, Chang’an University, Xi’an 710064, China2School of Information Engineering, Chang’an University, Xi’an 710064, China
Correspondence should be addressed to Xianglong Luo; [email protected]
Received 15 May 2018; Revised 6 September 2018; Accepted 2 October 2018; Published 20 January 2019
Academic Editor: Grigore Stamatescu
Copyright © 2019 Xianglong Luo et al. This is an open access article distributed under the Creative Commons Attribution License,which permits unrestricted use, distribution, and reproduction in any medium, provided the original work is properly cited.
With the implementation of the freeway free policy during the holidays, traffic congestion in the freeway becomes a commonphenomenon. In order to alleviate traffic pressure, traffic flow prediction during the holidays has become a problem of greatconcern. This paper proposes a hybrid prediction methodology combining discrete Fourier transform (DFT) with supportvector regression (SVR). The common trend in the traffic flow data is extracted using DFT by setting an appropriate threshold,which is predicted by extreme extrapolation of the historical trend. The SVR method is applied to predict the residual series.The experimental results with measured data collected from the toll stations in Jiangsu province of China show that theproposed algorithm has higher accuracy compared with the traditional method, and it is an efficient method for traffic flowprediction during the holidays.
1. Introduction
With the rapid development of the social economy, the pres-ent massive road infrastructure still fails to meet people’straveling demands [1–5] and traffic congestion has becomea common phenomenon in the freeway. Especially, freewaysoften turn into parking lots during the holidays. To solve theproblem of traffic congestion during the holidays, intelligenttransportation systems (ITS) have been widely implemented.Traffic flow prediction is fundamental for ITS, and it requiresthe following preconditions: traffic guidance, planning, andcontrol. Traffic flow is affected by people’s willingness to goto a trip, the weather, and many other factors. The imple-mentation of some policies also results in more dramaticchanges in traffic flow, such as free charge for cars under 7seats during important holidays in China, which makes traf-fic flow prediction more difficult. Moreover, people’s travel ismore for leisure and tourism during the holidays, whichmakes some changes in the composition of traffic flow. Thepassenger car flow increases obviously, while the truck flowdecreases to some extent. Especially, traffic flow around
scenic spots is increasing dramatically, and occasional trafficcongestions often occur, which results in traffic flow databecoming more stochastic. Traffic flow distribution duringthe holidays is obviously different from those during work-days. However, most of the existing prediction models aremainly aimed at workdays, and there are relatively few pre-diction models aimed at the holidays. To improve transpor-tation operation efficiency, accurate traffic flow predictionduring the holidays has become a problem of great concern.
Traffic flow prediction is a complex issue. A largenumber of algorithms have been proposed in the pastfew years. Existing prediction methods can be basicallyclassified into the following three categories: parametricapproach, nonparametric approach, and hybrid approach.The parametric approach includes the historical average(HA) method, autoregressive moving average method(ARIMA) [6, 7], seasonal autoregressive integrated movingaverage method (SARIMA) [8–10], and Kalman filter (KF)[11, 12]. The nonparametric approach includes artificial neu-ral networks (ANNS) [13–17], k-nearest neighbor (KNN)[18–22], support vector regression (SVR) [23, 24], and the
HindawiJournal of SensorsVolume 2019, Article ID 6461450, 10 pageshttps://doi.org/10.1155/2019/6461450

Bayesian model [25, 26]. The hybrid approach mainlycombines the parametric approach with the nonparametricapproach [27–35]. Vlahogianni et al. [36] summarizedexisting traffic flow prediction algorithms, and readersinterested in details of the models that apply to the fieldof traffic prediction could refer to their review paper as areference.
Traffic flow data presents a certain regularity, whichmakes it possible to predict the traffic flow. In order toimprove the accuracy of traffic flow prediction, it is a veryeffective method to decompose the traffic flow data into dif-ferent components. There are various methods to retrievethe different components in traffic flow data, including thesimple average trend [37], principle component analysis[38], empirical mode decomposition (EMD) [39, 40], waveletmethods [41], spectral analysis method [42, 43], and the low-pass filter [44]. Since traffic flow data is characterized bystochastic and highly nonlinear patterns during the holidays,the existing traffic flow decomposition methods cannotachieve good performance, and it is difficult to apply tra-ditional prediction methods to traffic prediction. Due tothe impact of the economic environment, the traffic flowdata is almost increasing year by year. Although theannual growth rate is not the same and there is a certainstochastic fluctuation, the trend component of traffic flowdata changes under the same law but slightly increasesyear by year. In order to improve the accuracy of the traf-fic flow prediction, it is very necessary to extract the trendcomponent in traffic flow data. Li et al. [45, 46] have dis-cussed the trend modeling for traffic time series andexplained the benefit of detrending.
Although Dai et al. [47] have specifically studied the traf-fic flow during the holidays, they focused on the investigationof holiday traffic flow from the spatial and temporal aspects.The ANN model was used to predict the traffic flow, but thismethod did not aim at the characteristics of traffic flow dur-ing the holiday, it still belonged to the traditional predictionmodel, and it could not meet the requirement of practicalengineering. This paper proposes a hybrid predictionmethodology combining discrete Fourier transform (DFT)with support vector regression (SVR). Traffic flow time seriesare decomposed into a common trend and a high-frequencyresidual time series. The common trend is extracted with theDFT algorithm through setting the appropriate threshold.The common trend reflects the endogenous characteristics,which are approximately stationary. By extreme extrapola-tion of the historical trend, the common trend of trafficflow time series is predicted. The residual series, whichincludes fluctuations and bursts, reflects environment-dependent characteristics. As shown in Chen et al. [48]and Li et al. [49], the existence of bursts brings difficultiesfor prediction models. This paper proposes a method toidentify and preprocess bursts, and the prediction of theresidual series is estimated by SVR. Finally, the traffic flowin the next holidays is predicted by combining the predic-tion result of the common trend with the residual series.The tested results with traffic data collected from the tollstations in Jiangsu province of China, show that proposedalgorithm has superior accuracy.
The rest of this paper is organized as follows. Section 2gives details on a hybrid traffic prediction method based onhybrid DFT and SVR. In Section 3, the dataset used for ournumerical experiments is introduced, and the results withdifferent prediction algorithms are presented. Finally, con-clusions and the direction for future research are given inSection 4.
2. Methodology
Traffic flow data changes more violently and stochastically,which makes predictions more difficult. In this paper, ahybrid prediction method during the holidays is proposedbased on DFT and SVR. The traffic flow data is composedof the common trend and high-frequency residual timeseries. The traffic flow time series are transformed from thetime domain into the frequency domain with DFT, and thetrend is extracted through setting the appropriate threshold.Except for the natural growth of the traffic flow during theholiday, the change of the trend component is basically thesame. Therefore, the trend component is predicted byextreme extrapolation of the historical trend. For the resid-ual, the fluctuation and burst are defined at first. The meanand variance of the fluctuation are stable, but the burst hasgreat randomness. The burst in the residual component ispreprocessed, and then the residual is predicted with SVR.The final prediction result can be obtained by combiningthe trend with residual prediction result. Our approach issummarized in Figure 1.
2.1. Decomposition of Traffic Flow Time Series with DFT. Thepurpose of traffic flow time series decomposition is to extractthe trend and residual, which can improve the prediction
Original traffic flow data
Decomposition with DFT
Set threshold Residual component
Preprocessing forburst
Residual predictionwith SVR
Periodic trend
Trend prediction byextreme extrapolation
Prediction result
Figure 1: Prediction flowchart for the proposed method.
2 Journal of Sensors

accuracy. Suppose the sampled traffic flow data on D dayholidays can be written as a time series:
XN = xt1 , xt1+Δt , xt1+2Δt ,… , xt1+ n−1 Δt ,… ,
xtD , xtD+Δt , xtD+2Δt ,… , xtD+ n−1 Δt ,1
where Δt is the sample time interval, n is the data size in aday, and if Δt is 1h, then n = 24. N = nD is the sample datalength on D day holidays.
The spectrum of the time series XN of the traffic data byDFT can be represented as
x̂k = 〠N−1
m=0xme
−j2πkm/N , 0 ≤ k ≤N − 1, 2
where xm is the mth sample of XN , x̂k is the frequency spec-trum of xm, and j is the imaginary unit.
Set a threshold α to remove the high-frequency varia-tions, and the common trend of traffic flow data XT can beextracted.
xk =x̂k, x̂k > α,0, x̂k ≤ α,
3
xTm= 1N
〠N−1
k=0xke
j2πkm/N , 0 ≤m ≤N − 1, 4
where xTmis the mth sample value of the common trend XT .
Then, traffic flow data is decomposed into the sum of thecommon trend XT and the residual Xr :
XN = XT + Xr 5
2.2. Prediction of the Common Trend. The trend componentrepresents the regular variations of traffic flow data. Com-muters are more and more conscientious of the ecologicalimpacts of their trip, and a change of trend in forthcom-ing years has attracted more attention. For holidays, thetrend component of traffic flow data changes under thesame law but slightly increases year by year. The incre-ment is also basically the same, although there is a littledifference in western countries. Therefore, the trendcomponent is predicted by extreme extrapolation of thehistorical trend in this paper.
Suppose that XTM = XT1, XT2,… , XTM is a commontrend in consecutive M years, the maximum value XTmax
ofthe trend component in M year can then be represented as
XTmax= max XT1 , max XT2 ,… , max XTM
= xT1max, xT2max
,… , xTMmax
6
The increment of the maximum value ΔxTmaxcan be com-
puted with (7) as
ΔXTmax=
xT2max
xT1max
,xT3max
xT2max
,… ,xTMmax
xT M−1 max
7
The regression analysis is carried out on ΔXTmax, and the
regression equation is obtained as
CΔxT= β1t + β2, 8
where β1 and β2 are regression coefficients, t is the time var-iable, and CΔxT
is the ratio coefficient of the trend componentmaximum value compared to that of last year.
The predicted trend component in M + 1 year is cal-culated directly with observed traffic flows in consecutiveM years.
XT M+1 = CΔxTXTM , 9
where CΔxTis the ratio coefficient calculated by (8) and
xTM is the trend component in M year.
2.3. Prediction of the Residual Component
2.3.1. Prediction Preprocessing. The residual series includesfluctuations and bursts. Suppose that the standard deviationσ is obtained from the square root of the variance for theentire residual time series. As demonstrated in Li et al. [45],a point is defined as a “burst” if the entire residual com-ponent is twice larger than the standard deviation σ. Mostexisting prediction models assume that model inputs havea certain smooth mapping relationship with model out-puts. Therefore, the predicted value is near the positiveand negative variance σ away from the trend component.That is, existing prediction models have a difficulty inforecasting the bursts. The intraday trend is an M-shaped curve that represents the regular variations ofdaily traffic flow. The morning and evening rush hoursresult in the two peaks, while one shallow valley and onedeep valley, respectively, appear at noon and midnight.This paper extracts the trend component using DFT,which results in the M-shaped curve being smoothed intoa number of sine functions, and traffic flow value beingslightly enlarged at noon. In order to improve the accu-racy of prediction, a strategy is introduced to preprocessthe residual component.
xr =2σ, xr > 2σ,xr , xr < −2σ
10
In the expression in (10), the positive bursts are pre-processed only twice the standard variance σ, and the neg-ative bursts are not changed, which is different from theexisting processing methods. The experiments show thatthe processing algorithm can help suppress the influenceof burst disturbance and improve prediction performance.
2.3.2. Support Vector Regression (SVR). SVR is widely used todeal with nonlinear problems and large-scale prediction
3Journal of Sensors

algorithms. In this paper, the SVR method is applied to pre-dict the preprocessed residual series. For a given training setT = xi, yi , i = 1, 2,… , l, xi ∈ Rn, yi ∈ Rn , where xi is adimensional input variable, yi is the corresponding outputvalue, and l represents the size of the training data.
Through a nonlinear mapping function ϕ , xi ismapped to a high-dimensional feature space, in which theoptimal decision function is constructed as follows:
f x =wTϕ x + b, w ∈ Rn, b ∈ R, 11
wherew is the weight vector and b is the bias value. SVRmin-imizes the following objective function:
min 12 w 2 + C〠
l
i=1ξi + ξ∗i
s t wxi + b − yi ≤ ε + ξi
yi − wxi + b ≤ ε + ξ∗i
ξi ≥ 0, ξ∗i ≥ 0, ε ≥ 0,
12
where 1/2 w 2 is the expression for the complexity of thedecision function, C is a penalty coefficient, and ξi is the
upper training error (ξ∗i is lower) subject to the ε insensitivefactor.
This optimization problem can be transformed into adual problem, and its solution is given by (13), where a∗i , aiare the Lagrange multipliers that can be acquired by solvingthe dual problem and K xi, x is the Mercer kernel functionthat equals the inner product of ϕ xi with ϕ x .
f x = 〠l
i=1a∗i − ai K xi, x + b,
s t 0 ≤ a∗i ≤ C, 0 ≤ ai ≤ C
13
The most frequently used Mercer kernel functions areinstance sigmoid, polynomial, and radial basis function(RBF). RBF is a common choice for the kernel functionbecause of the need to set very few parameters and excellentoverall performance. So, RBF is selected as the kernel func-tion in this paper.
2.4. Proposed Prediction Model. Suppose the sampled trafficflow data on D day holidays in consecutive M years can bewritten as the matrix XMN :
where Δt is the sample time interval, n is the data size in aday, and N = nD is the sample data length on D dayholidays.
According to (3), (4), and (5), the traffic flow data in con-secutive M years are decomposed into the sum of the trendcomponents and the residuals.
XMN = XT + XR =
XT1
XT2
⋮
XTM
+
XR1
XR2
⋮
XRM
, 15
where XT are the trend components in consecutive M yearsand XR are the residuals.
The predicted traffic flow during the holidays in M + 1year is calculated directly by adding the trend with residualprediction results.
X̂ M+1 = f1 XT + f2 XR , 16
where f1 XT is the prediction result of the trend componentwith (9) and f2 XR is the prediction result of the residualcomponent with SVR.
3. Case Study
3.1. Data Description. Jiangsu is a highly developed provincein China. In this paper, the data used to evaluate the perfor-mance of the proposed model are collected from the toll sta-tions in Jiangsu province on Tomb-sweeping Day andNational Day from 2011 to 2015. The length of the trafficflow data interval has an important influence on the predic-tion results. An excessively short time interval tends to leadto the instability of the prediction model, but an interval thatis too long will lose the inherent characteristics of traffic flowdata. As shown in Ma et al. [50], the prediction performanceimproves as the data aggregation level increases due to lessdata fluctuation as the time interval becomes longer. The pre-diction accuracy reaches its maximum when the aggregationlevel reaches one hour. Therefore, we selected one hour as thesampling time, which can also meet engineering manage-ment requirements. There are total of 1200 data points (50
XMN =
xt11 , xt11+Δt , xt11+2Δt ⋯ xt11+ n−1 Δt , ⋯, xt1D , xt1D+Δt , xt1D+2Δt ⋯ xt1D+ n−1 Δt
xt21 , xt21+Δt , xt21+2Δt ⋯ xt21+ n−1 Δt , ⋯, xt2D , xt2D+Δt , xt2D+2Δt ⋯ xt2D+ n−1 Δt
⋮ ⋮ ⋮ ⋮ ⋮ ⋮ ⋮ ⋮
xtM1, xtM1+Δt , xtM1+2Δt ⋯ xtM1+ n−1 Δt , ⋯, xtMD
, xt2D+Δt , xt2MD+2Δt ⋯ xtMD+ n−1 Δt
, 14
4 Journal of Sensors
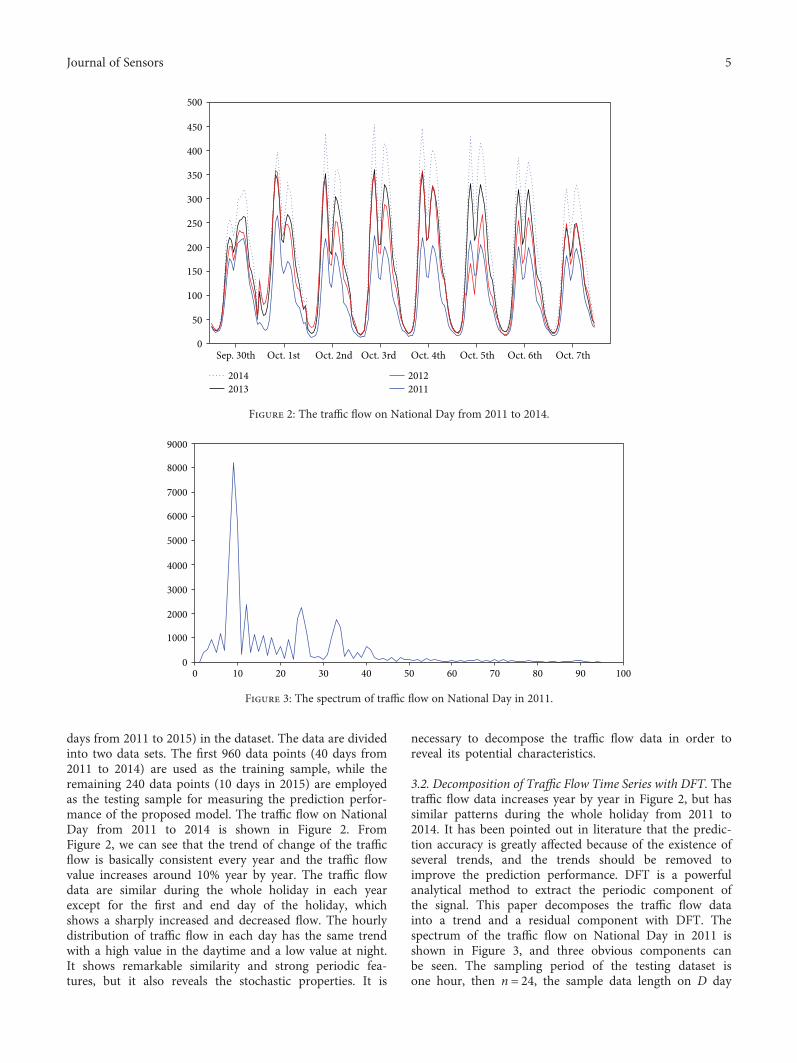
days from 2011 to 2015) in the dataset. The data are dividedinto two data sets. The first 960 data points (40 days from2011 to 2014) are used as the training sample, while theremaining 240 data points (10 days in 2015) are employedas the testing sample for measuring the prediction perfor-mance of the proposed model. The traffic flow on NationalDay from 2011 to 2014 is shown in Figure 2. FromFigure 2, we can see that the trend of change of the trafficflow is basically consistent every year and the traffic flowvalue increases around 10% year by year. The traffic flowdata are similar during the whole holiday in each yearexcept for the first and end day of the holiday, whichshows a sharply increased and decreased flow. The hourlydistribution of traffic flow in each day has the same trendwith a high value in the daytime and a low value at night.It shows remarkable similarity and strong periodic fea-tures, but it also reveals the stochastic properties. It is
necessary to decompose the traffic flow data in order toreveal its potential characteristics.
3.2. Decomposition of Traffic Flow Time Series with DFT. Thetraffic flow data increases year by year in Figure 2, but hassimilar patterns during the whole holiday from 2011 to2014. It has been pointed out in literature that the predic-tion accuracy is greatly affected because of the existence ofseveral trends, and the trends should be removed toimprove the prediction performance. DFT is a powerfulanalytical method to extract the periodic component ofthe signal. This paper decomposes the traffic flow datainto a trend and a residual component with DFT. Thespectrum of the traffic flow on National Day in 2011 isshown in Figure 3, and three obvious components canbe seen. The sampling period of the testing dataset isone hour, then n = 24, the sample data length on D day
2014
500
450
400
350
300
250
200
150
100
50
0Sep. 30th Oct. 1st Oct. 2nd Oct. 3rd Oct. 4th Oct. 5th Oct. 6th Oct. 7th
201320122011
Figure 2: The traffic flow on National Day from 2011 to 2014.
9000
8000
7000
6000
5000
4000
3000
2000
1000
00 10 20 30 40 50 60 70 80 90 100
Figure 3: The spectrum of traffic flow on National Day in 2011.
5Journal of Sensors

holidays is N = nD. If the data length is the power of 2, weuse DTF directly. Otherwise we will fill the data to make ita power of 2 by adding 0 in the end of the original trafficdata, which will not change the frequency resolution andalso conform to the calculation condition for DFT. FromFigure 3, we can see that there are several peaks in thetraffic flow spectrum and the intervals between the peaksare large enough to meet the frequency resolution require-ments. The main purpose of DFT is to extract the trend
components of traffic flow sequences. This indicates thatwe need to retain the low-frequency components and sup-press high-frequency components. Through experiments,we can extract the trend components of traffic flow dataeffectively by keeping only the highest peak value compo-nent. However, the highest peak is not really an impulsefunction, so we must set a large threshold to suppressother frequency components. When the threshold alphais set 0.7 times of the maximum frequency spectrum value,
120
100
80
60
40
20
−20
−40
−60
0
20142013
20122011
Sep. 30th Oct. 1st Oct. 2nd Oct. 3rd Oct. 4th Oct. 5th Oct. 6th Oct. 7th
Figure 4: The trend components on National Day from 2011 to 2014.
Sep. 30th
700
Original traffic flow seriesTrend component
Original residual seriesPreprocessed residual series
600
500
400
300
200
100
−100
0
Oct. 1st Oct. 2nd Oct. 3rd Oct. 4th Oct. 5th Oct. 6th Oct. 7th
Figure 5: The original traffic flow series, trend component, residual series, and preprocessed residual series on National Day in 2014.
6 Journal of Sensors

the trend components of the traffic flow sequences can beextracted efficiently according to (3) and (4). The trendcomponents on National Day from 2011 to 2015 areshown in Figure 4. Compared to Figure 2, the law of trend
components is more obvious year by year, so it becomeseasier to predict the trend component in traffic flow. Thetraffic flow sequence minus the trend component and theresidual series are obtained.
1st day 2nd day 3rd day0
100
200
300
400
500
600
700
Measured resultARIMASVR
EMD-SVRDFT-SVR
(a)
Oct. 1st Oct. 2nd Oct. 3rd Oct. 4th Oct. 5th Oct. 6th Oct. 7th0
100
200
300
400
500
600
700
Measured resultARIMASVR
EMD-SVRDFT-SVR
(b)
Figure 6: The prediction results by DFT-SVR, ARIMA, SVR, and EMD-SVR (a) on Tomb-sweeping Day and (b) on National Day.
7Journal of Sensors

3.3. Preprocessing of the Residual Series. The residual seriesincludes fluctuations and bursts, and it represents the sto-chastic component in the traffic flow, which is affected bythe weather, traffic incidence, roadway conditions, and otherfactors. Especially, because of the presence of large bursts, theaccuracy of traffic flow prediction is greatly affected. In orderto improve the accuracy of the prediction, the residual seriesare preprocessed according to (10). The original traffic flowseries, trend component, residual series, and preprocessedresidual series onNational Day in 2014 are shown in Figure 5.
3.4. Prediction Results and Performance Comparison
3.4.1. Measuring Performance of the Proposed PredictionMethod. Several standard evaluation measurements areadopted in the experiments to evaluate the proposed method,including the mean absolute error (MAE), mean absolutepercentage error (MAPE), and root mean square error(RMSE). Although these indicators are used to evaluate theprediction performance, each indicator has its emphasis onevaluation. In order to evaluate the performance of the pro-posed model accurately, we have adopted three indicatorsat the same time to represent the difference between theactual value and the predicted value.
MAE = 1N〠N
i=1x̂i − xi ,
MAPE = 1N〠N
i=1
x̂i − xixi
× 100%,
RMSE = 1N〠N
i=1x̂i − xi
2,
17
where x̂i is the prediction value, xi is the actual observedvalue, and N is the length of the test series.
3.4.2. Prediction Results. In this section, the traffic flows onTomb-sweeping Day and National Day in 2015 are predictedwith the proposed DFT and SVR model using the traffic flowdata from 2011 to 2014. Figures 6(a) and 6(b), respectively,exhibit the predicted and real traffic flow on Tomb-sweeping Day and National Day by 4 different models:DFT-SVR, ARIMA, SVR, and EMD-SVR. From this figure,it is apparent that the proposed DFT and SVR model hasthe best prediction performance, and the prediction valueof the proposed method is identical to the real value duringmost of the hours, especially during the rush hours. Theprediction results by ARIMA and EMD-SVR are worse thanthat of the proposed model. Because holidays are longer onNational Day compared to Tomb-sweeping Day, the trafficflow is relatively smooth on National Day. However,Tomb-sweeping Day is a traditional holiday for tomb-sweeping, and traffic flow data during this holiday is veryhigh with a more stochastic characteristic. The predictionaccuracy is higher on National Day than on Tomb-sweeping Day in Figure 6.
The prediction performances are shown on Tomb-sweeping Day and National Day in Tables 1 and 2. It canbe seen that the proposed DFT-SVR method has better pre-diction performance than ARIMA, SVR, and EMD-SVR onboth Tomb-sweeping Day and National Day. All algorithmshave better prediction accuracy on long holidays than onshort holidays, and the average prediction accuracy is higherat 15.04% on National Day than on Tomb-sweeping Day.The prediction performance of the proposed DFT-SVRmethod improved at least by 3.69% on National Day, but itimproved by at least 17.23% on Tomb-sweeping Day, indi-cating that the proposed method has more advantages fordealing with stochastic traffic flow data.
4. Conclusions
This paper presents a traffic flow prediction method for theholidays based on DFT and SVR. The trend componentsare extracted from holiday traffic flow data with DFT, andthe trend can be predicted by extreme extrapolation with his-torical data. The residual component is further analyzed by apreprocessing method and SVR. The final prediction result isobtained by combining the trend with the residual predictionresult. Real traffic data, collected from toll stations in Jiangsuprovince from 2011 to 2015, are used to evaluate predictionperformances of the proposed DFT-SVR model. The testresults show that the proposed DFT-SVR model has the bestperformance compared with ARIMA, SVR, and EMD-SVR,and prediction accuracy is higher on long holidays than onshort holidays. Since the traffic flow data during the holidaysis affected by weather and other factors, the impact ofweather factors on traffic flow will also be further studied,so as to improve the prediction accuracy.
Data Availability
The data used in this paper were collected from the toll sta-tions in Jiangsu province on Tomb-sweeping Day andNational Day from 2011 to 2015. The data are supplied bythe JiangSu Expressway Network Operation & ManagementCenter in China. Because the data involve license and
Table 1: The prediction performance on Tomb-sweeping Day.
MAE MAPE (%) RMSE
ARIMA 63.8955 53.2863 0.7967
SVR 43.8453 29.3454 0.3801
EMD-SVR 50.9304 43.6135 0.5995
DFT-SVR 28.004 12.1147 0.3700
Table 2: The prediction performance on National Day.
MAE MAPE (%) RMSE
ARIMA 37.0084 26.7927 0.4788
SVR 29.0494 13.3154 0.1496
EMD-SVR 32.9437 28.4532 0.4791
DFT-SVR 14.0734 9.6237 0.1386
8 Journal of Sensors

commercial confidentiality, these cannot be used freely. Ifany researcher requests for these data, he can send an emailto [email protected].
Conflicts of Interest
The authors declare that there is no conflict of interestregarding the publication of this paper.
Acknowledgments
This research was partly supported by the NationalKey R&D Program of China (2018YFC0808706) and theNational Natural Science Foundation of China (Grant no.5157081053). The authors are also grateful to the JiangSuExpressway Network Operation & Management Center forproviding the data.
References
[1] Y. Li, S. Xu, H. Liu, E. Ma, and L. Wang, “Displacement andstress characteristics of tunnel foundation in collapsible loessground reinforced by jet grouting columns,” Advances in CivilEngineering, vol. 2018, Article ID 2352174, 16 pages, 2018.
[2] J. Lai, S. He, J. Qiu et al., “Characteristics of seismic disastersand aseismic measures of tunnels in Wenchuan earthquake,”Environmental Earth Sciences, vol. 76, no. 94, pp. 1–19, 2017.
[3] J. Qiu, T. Yang, X. Wang, L. Wang, and G. Zhang, “Review ofthe flame retardancy on highway tunnel asphalt pavement,”Construction and Building Materials, vol. 195, pp. 468–482,2019.
[4] J. Lai, K. Wang, J. Qiu, F. Niu, J. Wang, and J. Chen, “Vibrationresponse characteristics of the cross tunnel structure,” Shockand Vibration, vol. 2016, Article ID 9524206, 16 pages, 2016.
[5] J. Lai, X. Wang, J. Qiu, J. Chen, Z. Hu, and H. Wang, “Extremedeformation characteristics and countermeasures for a tunnelin difficult grounds in southern Shaanxi, China,” Environmen-tal Earth Sciences, vol. 77, no. 706, Article ID 9183296, pp. 1–19, 2018.
[6] C. Han, S. Song, and C. H.Wang, “A real-time short-term traf-fic flow adaptive forecasting method based on ARIMAmodel,”Acta Simulata Systematica Sinica, vol. 16, no. 7, pp. 1530–1535, 2004.
[7] M. C. Tan, S. C. Wong, J. M. Xu, Z. R. Guan, and P. Zhang,“An aggregation approach to short-term traffic flow predic-tion,” IEEE Transactions on Intelligent Transportation Systems,vol. 10, no. 1, pp. 60–69, 2009.
[8] X. Luo, L. Niu, and S. Zhang, “An algorithm for traffic flowprediction based on improved SARIMA and GA,” KSCEJournal of Civil Engineering, vol. 22, no. 10, pp. 4107–4115, 2018.
[9] B. M. Williams and L. A. Hoel, “Modeling and forecastingvehicular traffic flow as a seasonal ARIMA process: theoret-ical basis and empirical results,” Journal of TransportationEngineering, vol. 129, no. 6, pp. 664–672, 2003.
[10] G. Shi, J. Guo, W. Huang, and B. M. Williams, “Modelingseasonal heteroscedasticity in vehicular traffic condition seriesusing a seasonal adjustment approach,” Journal of Transporta-tion Engineering, vol. 140, no. 5, article 04014012, 2014.
[11] L. L. Ojeda, A. Y. Kibangou, and C. C. de Wit, “AdaptiveKalman filtering for multi-step ahead traffic flow prediction,”
in 2013 American Control Conference, pp. 4724–4729, Wash-ington, DC, USA, 2013, IEEE.
[12] S. V. Kumar, “Traffic flow prediction using Kalman filteringtechnique,” Procedia Engineering, vol. 187, pp. 582–587, 2017.
[13] B. L. Smith and M. J. Demetsky, “Short-term traffic flow pre-diction: neural network approach,” Transportation ResearchRecord, vol. 1453, pp. 98–104, 1994.
[14] T. Zhou, G. Han, X. Xu et al., “δ-Agree AdaBoost stacked auto-encoder for short-term traffic flow forecasting,” Neurocomput-ing, vol. 247, pp. 31–38, 2017.
[15] H. F. Yang, T. S. Dillon, and Y. P. P. Chen, “Optimized struc-ture of the traffic flow forecasting model with a deep learningapproach,” IEEE Transactions on Neural Networks and Learn-ing Systems, vol. 28, no. 10, pp. 2371–2381, 2017.
[16] T. Ma, Z. Zhou, and B. Abdulhai, “Nonlinear multivariatetime–space threshold vector error correction model for shortterm traffic state prediction,” Transportation Research Part B:Methodological, vol. 76, pp. 27–47, 2015.
[17] Z. Ma, G. Luo, and D. Huang, “Short term traffic flow predic-tion based on on-line sequential extreme learning machine,” in2016 Eighth International Conference on Advanced Compu-tational Intelligence (ICACI), pp. 143–149, Chiang Mai,Thailand, 2016, IEEE.
[18] M. Bernaś, B. Płaczek, P. Porwik, and T. Pamuła, “Segmenta-tion of vehicle detector data for improved k-nearestneighbours-based traffic flow prediction,” IET IntelligentTransport Systems, vol. 9, no. 3, pp. 264–274, 2015.
[19] Y. Cai, H. Huang, H. Cai, and Y. Qi, “A K-nearest neighborlocally search regression algorithm for short-term traffic flowforecasting,” in 2017 9th International Conference onModelling, Identification and Control (ICMIC), pp. 624–629,Kunming, China, 2017.
[20] S. Wu, Z. Yang, X. Zhu, and B. Yu, “Improved k-nn for short-term traffic forecasting using temporal and spatial informa-tion,” Journal of Transportation Engineering, vol. 140, no. 7,article 04014026, 2014.
[21] P. Dell'Acqua, F. Bellotti, R. Berta, and A. De Gloria, “Time-aware multivariate nearest neighbor regression methods fortraffic flow prediction,” IEEE Transactions on IntelligentTransportation Systems, vol. 16, no. 6, pp. 3393–3402, 2015.
[22] B. Sun, W. Cheng, P. Goswami, and G. Bai, “Short-termtraffic forecasting using self-adjusting k-nearest neighbours,”IET Intelligent Transport Systems, vol. 12, no. 1, pp. 41–48,2018.
[23] M. Castro-Neto, Y. S. Jeong, M. K. Jeong, and L. D. Han,“Online-SVR for short-term traffic flow prediction under typ-ical and atypical traffic conditions,” Expert Systems with Appli-cations, vol. 36, no. 3, pp. 6164–6173, 2009.
[24] Y. Sun, B. Leng, and W. Guan, “A novel wavelet-SVM short-time passenger flow prediction in Beijing subway system,”Neurocomputing, vol. 166, pp. 109–121, 2015.
[25] W. Zheng, D.-H. Lee, and Q. Shi, “Short-term freeway trafficflow prediction: Bayesian combined neural networkapproach,” Journal of Transportation Engineering, vol. 132,no. 2, pp. 114–121, 2006.
[26] Q. P. Wang and H. Sun, “Traffic structure optimization inhistoric districts based on green transportation and sustainabledevelopment concept,” Advances in Civil Engineering,vol. 2019, Article ID 9196263, 16 pages, 2019.
[27] Z. Shen, W. Wang, Q. Shen, and Z. Li, “Hybrid CSAoptimization with seasonal RVR in traffic flow forecasting,”
9Journal of Sensors

KSII Transactions on Internet and Information Systems,vol. 11, no. 10, pp. 4867–4887, 2017.
[28] Z. Hu, K. Du, J. Lai, and Y. Xie, “Statistical analysis of influenceof cover depth on loess tunnel deformation in NW China,”Advances in Civil Engineering, vol. 2019, Article ID 2706976,12 pages, 2019.
[29] D. Xia, B. Wang, H. Li, Y. Li, and Z. Zhang, “A distributed spa-tial–temporal weighted model on MapReduce for short-termtraffic flow forecasting,” Neurocomputing, vol. 179, pp. 246–263, 2016.
[30] F. Moretti, S. Pizzuti, S. Panzieri, and M. Annunziato, “Urbantraffic flow forecasting through statistical and neural networkbagging ensemble hybrid modeling,” Neurocomputing,vol. 167, pp. 3–7, 2015.
[31] J. Lai, J. Qiu, H. Fan et al., “Fiber bragg grating sensors-basedin situ monitoring and safety assessment of loess tunnel,” Jour-nal of Sensors, vol. 2016, Article ID 8658290, 10 pages, 2016.
[32] M. W. Li, D. F. Han, andW. L. Wang, “Vessel traffic flow fore-casting by RSVR with chaotic cloud simulated annealinggenetic algorithm and KPCA,” Neurocomputing, vol. 157,pp. 243–255, 2015.
[33] S. D. Oh, Y. J. Kim, and J. S. Hong, “Urban traffic flow predic-tion system using a multifactor pattern recognition model,”IEEE Transactions on Intelligent Transportation Systems,vol. 16, no. 5, pp. 2744–2755, 2015.
[34] S. He, L. Su, H. Fan, and R. Ren, “Methane ExplosionAccidents of Tunnels in SW China,” Geomatics, NaturalHazards and Risk, 2018.
[35] Z. Zhang, H. Zhang, Y. Tan, and H. Yang, “Natural wind uti-lization in the vertical shaft of a super-long highway tunneland its energy saving effect,” Building and Environment,vol. 145, pp. 140–152, 2018.
[36] E. I. Vlahogianni, M. G. Karlaftis, and J. C. Golias, “Short-termtraffic forecasting: where we are and where we’re going,”Trans-portation Research Part C: Emerging Technologies, vol. 43,pp. 3–19, 2014.
[37] W. Min and L. Wynter, “Real-time road traffic prediction withspatio-temporal correlations,” Transportation Research Part C:Emerging Technologies, vol. 19, no. 4, pp. 606–616, 2011.
[38] L. Qu, J. Hu, L. Li, and Y. Zhang, “PPCA-based missing dataimputation for traffic flow volume: a systematical approach,”IEEE Transactions on Intelligent Transportation Systems,vol. 10, no. 3, pp. 512–522, 2009.
[39] M. C. Chen and Y. Wei, “Exploring time variants for short-term passenger flow,” Journal of Transport Geography,vol. 19, no. 4, pp. 488–498, 2011.
[40] H. Wang, L. Liu, Z. (. S.). Qian, H. Wei, and S. Dong, “Empir-ical mode decomposition—autoregressive integrated movingaverage: hybrid short-term traffic speed prediction model,”Transportation Research Record: Journal of the TransportationResearch Board, vol. 2460, no. 1, pp. 66–76, 2014.
[41] D. Boto-Giralda, F. J. Díaz-Pernas, D. González-Ortega et al.,“Wavelet-based denoising for traffic volume time series fore-casting with self-organizing neural networks,” Computer-Aided Civil and Infrastructure Engineering, vol. 25, no. 7,pp. 530–545, 2010.
[42] T. T. Tchrakian, B. Basu, and M. O'Mahony, “Real-time trafficflow forecasting using spectral analysis,” IEEE Transactions onIntelligent Transportation Systems, vol. 13, no. 2, pp. 519–526,2012.
[43] H. Nicholson and C. D. Swann, “The prediction of traffic flowvolumes based on spectral analysis,” Transportation Research,vol. 8, no. 6, pp. 533–538, 1974.
[44] T. Otoshi, Y. Ohsita, M. Murata, Y. Takahashi, K. Ishibashi,and K. Shiomoto, “Traffic prediction for dynamic traffic engi-neering,” Computer Networks, vol. 85, pp. 36–50, 2015.
[45] L. Li, X. Su, Y. Zhang, Y. Lin, and Z. Li, “Trend modeling fortraffic time series analysis: an integrated study,” IEEE Transac-tions on Intelligent Transportation Systems, vol. 16, no. 6,pp. 3430–3439, 2015.
[46] Y. Li, Z. Li, and L. Li, “Missing traffic data: comparison ofimputation methods,” IET Intelligent Transport Systems,vol. 8, no. 1, pp. 51–57, 2014.
[47] H. Dai, F. Wang, Q. Liu, and C. Gong, “Investigation and pre-diction of traffic flow in holidays in Zhejiang section of Shen-hai freeway,” in 2015 International Conference onTransportation Information and Safety (ICTIS), pp. 195–201,Wuhan, China, 2015.
[48] C. Chen, Y. Wang, L. Li, J. Hu, and Z. Zhang, “The retrieval ofintra-day trend and its influence on traffic prediction,” Trans-portation Research Part C: Emerging Technologies, vol. 22,no. 5, pp. 103–118, 2012.
[49] L. Li, X. Su, Y. Wang, Y. Lin, Z. Li, and Y. Li, “Robust causaldependence mining in big data network and its applicationto traffic flow predictions,” Transportation Research Part C:Emerging Technologies, vol. 58, pp. 292–307, 2015.
[50] X. Ma, H. Yu, Y. Wang, and Y. Wang, “Large-scale transporta-tion network congestion evolution prediction using deeplearning theory,” PLoS One, vol. 10, no. 3, article e0119044,2015.
10 Journal of Sensors

International Journal of
AerospaceEngineeringHindawiwww.hindawi.com Volume 2018
RoboticsJournal of
Hindawiwww.hindawi.com Volume 2018
Hindawiwww.hindawi.com Volume 2018
Active and Passive Electronic Components
VLSI Design
Hindawiwww.hindawi.com Volume 2018
Hindawiwww.hindawi.com Volume 2018
Shock and Vibration
Hindawiwww.hindawi.com Volume 2018
Civil EngineeringAdvances in
Acoustics and VibrationAdvances in
Hindawiwww.hindawi.com Volume 2018
Hindawiwww.hindawi.com Volume 2018
Electrical and Computer Engineering
Journal of
Advances inOptoElectronics
Hindawiwww.hindawi.com
Volume 2018
Hindawi Publishing Corporation http://www.hindawi.com Volume 2013Hindawiwww.hindawi.com
The Scientific World Journal
Volume 2018
Control Scienceand Engineering
Journal of
Hindawiwww.hindawi.com Volume 2018
Hindawiwww.hindawi.com
Journal ofEngineeringVolume 2018
SensorsJournal of
Hindawiwww.hindawi.com Volume 2018
International Journal of
RotatingMachinery
Hindawiwww.hindawi.com Volume 2018
Modelling &Simulationin EngineeringHindawiwww.hindawi.com Volume 2018
Hindawiwww.hindawi.com Volume 2018
Chemical EngineeringInternational Journal of Antennas and
Propagation
International Journal of
Hindawiwww.hindawi.com Volume 2018
Hindawiwww.hindawi.com Volume 2018
Navigation and Observation
International Journal of
Hindawi
www.hindawi.com Volume 2018
Advances in
Multimedia
Submit your manuscripts atwww.hindawi.com