trans-acting hepatitis delta virus ribozyme: catalytic...
TRANSCRIPT

Trans-Acting Hepatitis Delta Virus Ribozyme: Catalytic Core and Global StructureAre Dependent on the 5′ Substrate Sequence†
Sohee Jeong, Jana Sefcikova, Rebecca A. Tinsley, David Rueda, and Nils G. Walter*
Department of Chemistry, The UniVersity of Michigan, 930 North UniVersity, Ann Arbor, Michigan 48109-1055
ReceiVed April 21, 2003; ReVised Manuscript ReceiVed May 10, 2003
ABSTRACT: The hepatitis delta virus (HDV), an infectious human pathogen affecting millions of peopleworldwide, leads to intensified disease symptoms, including progression to liver cirrhosis upon coinfectionwith its helper virus, HBV. Both the circular RNA genome of HDV and its complementary antigenomecontain a common cis-cleaving catalytic RNA motif, the HDV ribozyme, which plays a crucial role inviral replication. Previously, the crystal structure of the product form of the cis-acting genomic HDVribozyme has been determined, and the precursor form has been suggested to be structurally similar. Incontrast, solution studies by fluorescence resonance energy transfer (FRET) on a trans-cleaving form ofthe ribozyme have shown significant global conformational changes upon catalysis, while 2-aminopurine(AP) fluorescence assays have detected concomitant local conformational changes in the catalytic core.Here, we augment these studies by using terbium(III) to probe the structure of the trans-acting HDVribozyme at nucleotide resolution. We observe significant structural differences between the precursorand product forms, especially in the P1.1 helix and the trefoil turn in the single-stranded region connectingP4 and P2 (termed J4/2) of the catalytic core. We show, using terbium(III) footprinting and sensitizedluminescence spectroscopy as well as steady-state, time-resolved, and gel-mobility FRET assays on asystematic set of substrates, that the substrate sequence immediately 5′ to the cleavage site significantlymodulates these local as well as resultant global structural differences. Our results suggest a structuralbasis for the previously observed impact of the 5′ substrate sequence on catalytic activity.
The hepatitis delta virus (HDV)1 ribozyme is among a classof small endonucleolytic RNAs that catalyze a reversible self-cleavage reaction that is necessary for the replication andpropagation of their satellite RNA genomes. Specifically, theHDV ribozyme is a unique RNA motif found in the humanhepatitis delta virus (1). HDV is a satellite of its helper virus,hepatitis B virus (HBV); coinfection of HDV and HBVresults in intensification of the disease symptoms associatedwith HBV, including progression to liver cirrhosis, andaffects millions of people worldwide (2). The small circularRNA genome of HDV replicates through a double rolling-circle mechanism, whereby multimeric units of genomic andantigenomic RNA strands are produced, followed by self-cleavage and ligation into circular monomers (1, 3). Self-cleavage activity in the genomic and antigenomic RNAsresides within continuous 85-nucleotide sequences that bothform a nearly identical secondary structure consisting of anested double pseudoknot (4-6).
The genomic and antigenomic forms of the HDV ribozymecatalyze self-cleavage by a transesterification reaction, whichrequires deprotonation of the adjacent 2′-OH group and its
nucleophilic attack on the scissile phosphate and results information of 2′,3′-cyclic phosphate and 5′-OH termini (6).The reaction mechanism of the HDV ribozyme has beenextensively studied. The crystal structure of the self-cleavedproduct form of the genomic ribozyme reveals that aparticular cytosine, C75 in the genomic (C76 in the anti-genomic) ribozyme, is hydrogen bonded with the backboneof the closing loop of helix P3 and, thus, is in the proximityof the 5′-OH leaving group in the active site cleft (Figure 1)(4, 7). Therefore, C75 has been proposed to participate directlyin reaction chemistry (4, 7). Subsequent kinetic studies haveprovided evidence that C75 acts either as a general basecatalyst to activate the 2′-OH group as a nucleophile (8) oras a general acid catalyst to protonate the 5′-oxyanion leavinggroup (9-12). To be a reasonably effective proton acceptoror donor during catalysis at physiological pH, the pKa ofC75 has to be perturbed substantially from that of the freebase [pKa ≈ 4.2 (13)]. Indeed, kinetic analyses have yieldedestimates of∼6.1 for C75’s pKa during catalysis (9).Presumably, the local structure around the base, most notably,the hydrogen bond of its exocyclic amino group to thenegatively charged phosphate of C22 observed in the crystalstructure (Figure 1), provides for the electronic environmentthat is necessary to achieve such a significant, but notunprecedented (14-16), pKa change. This local structure isstabilized by the essential short helix P1.1 that comprisesand orients C22 and also buttresses the cleavage site G1‚U39
wobble pair through stacking interactions in the tightlypacked catalytic core (5, 17) (Figure 1). Surprisingly, NMR-
† This work was supported by NIH Grant GM62357 (N.G.W.) anda predoctoral University of Michigan Rackham Merit Fellowship(R.A.T.).
* To whom correspondence should be addressed. Telephone: (734)615-2060. Fax: (734) 647-4865. E-mail: [email protected].
1 Abbreviations: FRET, fluorescence resonance energy transfer;fwhm, full width at half-maximum; HDV, hepatitis delta virus; NLPB,nonlinear Poisson-Boltzmann; NMR, nuclear magnetic resonance; tr-FRET, time-resolved fluorescence resonance energy transfer.
7727Biochemistry2003,42, 7727-7740
10.1021/bi034627g CCC: $25.00 © 2003 American Chemical SocietyPublished on Web 06/04/2003

based13C chemical shift measurements found a pKa of <5.5for C75 in the product and precursor forms under allconditions that were tested, suggesting that the pKa is onlyfully shifted in an intermediate state of the transesterificationreaction (18).
Only a crystal structure of the self-cleaved product formof the genomic HDV ribozyme has been determined so far.On the basis of the functional importance of elementsidentified in this structure for the first time, such as thepossible role of C75 in catalysis and the existence of P1.1,the assumption has been made that the precursor form ofthe cleavage reaction may structurally be almost identicalto the product form (4). However, the product lacks the 5′product upstream of the cleavage site (Figure 1), the sequenceof which, although not base paired with the rest of theribozyme, has been shown to have a significant impact oncatalytic activity (11, 19). In fact, kinetic studies of a trans-acting HDV ribozyme have suggested that components ofthe substrate immediately 5′ to the cleavage site destabilizeground-state substrate binding and thereby lower the activa-tion free energy barrier of cleavage (11). This result, inconjunction with the observation that the active site cleft inthe product crystal structure is deep and tightly packed, thusnot obviously providing a trajectory for substrate exit, hasled to the proposal that the 5′ sequence may be accom-modated by straining (bending) of the substrate and/orloosening of the catalytic core (6, 20).
Recently, we and later others have shown that trans-actingHDV ribozymes indeed undergo a conformational changeupon catalysis (20-22). In particular, we have observedchanges in the distance between the termini of helices P4and P2 by fluorescence resonance energy transfer (FRET)as the precursor cleaves and the 5′ product dissociates (20).This global structural change is accompanied by a local
conformational rearrangement around C75, as probed byfluorescence spectroscopy of 2-aminopurine incorporated intothe neighboring position 76 (21). In addition, NMR spec-troscopy has provided evidence for structural differencesbetween the precursor and product forms of trans-actingHDV ribozymes (18, 22).
To better define these structural differences between theprecursor and product forms, we now have used terbium(III)-mediated footprinting as a probe of metal binding propertiesas well as secondary and tertiary structure. Low (micromolar)concentrations of terbium(III), one of the lanthanide transitionmetal ions quite close in ion radius (0.92 vs 0.72 Å) andligand preference to magnesium (23), displaces Mg2+ fromonly a few select sites on the RNA with the highest surfacecharge density. Higher (millimolar) concentrations of ter-bium(III) bind less specifically to RNA. Because its pKa isclose to neutrality (pKa ) 7.9), the aqueous Tb3+ complexis likely deprotonated under (near) physiological conditions,and the Tb(OH)(aq)2+ complex cleaves the phosphodiesterbackbone slowly close to its location on the RNA. At lowterbium(III) concentrations, this backbone scission thereforereveals high-affinity metal binding sites, while at highterbium(III) concentrations, it produces a footprinting patternof solvent accessible regions, mainly cleaving the RNAbackbone in a sequence-independent fashion (23-28).Among several metal ion-induced backbone cleavage tech-niques, terbium(III) has been especially favored because ofits additional luminescence characteristics (23, 24, 27, 29).In particular, energy transfer from nucleobases to terbium(III)allows one to monitor the binding kinetics and thermody-namics of the lanthanide ion to the RNA (24).
Using terbium(III) luminescence spectroscopy, we nowhave confirmed that there are structural differences betweenthe precursor and product forms of the trans-acting HDVribozyme. In addition, we have used terbium(III)-mediatedfootprinting to reveal details of these differences at nucleotideresolution. The global structures of the precursor and productforms are similar in that they share major helices P1-P4;however, their catalytic core structures are distinct in theextent to which the short P1.1 helix forms and in the affinityof the backbone around C75 for metal ion binding. Bysystematically changing the sequence immediately 5′ to thecleavage site, we observe modulations of these differencesin response to the identity and length of the 5′ sequence.These observations are supported by substantial differencesin the distance of the termini of helices P4 and P2, asmeasured for the various ribozyme-substrate complexes bysteady-state, time-resolved, and gel-mobility FRET assays.Our data are consistent with a more open catalytic core ofthe precursor form of the ribozyme depending on the 5′sequence, offering a structural explanation for the impactthat Been and co-workers observed for this sequence onsubstrate binding affinity and catalytic activity of the trans-acting HDV ribozyme (11).
MATERIALS AND METHODS
Preparation of RNA Oligonucleotides.RNA oligonucleo-tides were purchased with 2′ protection groups from Dhar-macon Research, Inc., or from the HHMI Biopolymer/KeckFoundation Biotechnology Resource Laboratory at the YaleUniversity School of Medicine (New Haven, CT) and were
FIGURE 1: Synthetic HDV ribozyme construct D1. The ribozymeportion is shown in bold, and consists of two separate RNA strandsA and B. For FRET studies, donor (fluorescein) and acceptor(tetramethylrhodamine) fluorophores were coupled to the terminiof strand B (20). The 3′ product (3′P) is shown outlined. Thesubstrate variant S3 contains eight additional nucleotides (gray) 5′of the cleavage site (arrow). Other substrates with varying 5′sequence as studied here are shown in the box. To generatenoncleavable substrate analogues, the 2′-OH groups of the under-lined nucleotides immediately 5′ of the cleavage site were modifiedto 2′-methoxy groups and the suffix “nc” was added to their name.Dashed lines represent tertiary structure hydrogen bonds of C75and the ribose zipper of A77 and A78 in joiner J4/2.
7728 Biochemistry, Vol. 42, No. 25, 2003 Jeong et al.
deprotected following the manufacturer’s recommendations.Deprotected RNA was purified by denaturing 20% poly-acrylamide, 8 M urea, gel electrophoresis, diffusion elutioninto 0.5 M NH4OAc, 0.1% SDS, and 0.1 mM EDTAovernight at 4°C, chloroform extraction, ethanol precipita-tion, and C8 reverse-phase HPLC with a linear acetonitrilegradient in triethylammonium acetate as described previously(30). For FRET measurements, the three-strand ribozyme(sequences given in Figure 1) was modified on the 5′ and 3′ends of strand B with fluorescein (donor) and tetramethyl-rhodamine (acceptor), respectively, as described previously(20, 30, 31). To obtain chemically blocked, noncleavable(nc) substrate analogues for structural analyses, substrateswere modified with a 2′-methoxy group at the cleavage site(Figure 1). The 3′ product (3′P) has the sequence 5′-GGGUCGG-3′. RNA concentrations were calculated fromtheir absorption at 260 nm and corrected for the additionalabsorption of fluorescein and tetramethylrhodamine by usingthe relationsA260/A492 ) 0.3 andA260/A554 ) 0.49, respec-tively.
Handling of Terbium(III) Stock Solutions.After ter-bium(III) chloride [purchased from Aldrich at the highestavailable purity (99.9%)] had been dissolved to concentra-tions of 1, 10, and 100 mM in 5 mM sodium cacodylate(pH 5.5) to prevent formation of terbium(III) hydroxideprecipitates at higher pH, small aliquots of these stocksolutions were kept at-20 °C, as previously described (24).
CleaVage Reactions. Cleavage activities of ribozymes withdifferent 5′ sequences were determined using the three-strandHDV ribozyme construct D1 depicted in Figure 1. The 3′32P-labeled substrate was prepared by ligation with [32P]pCpusing T4 RNA ligase, while the 5′ 32P-labeled substrate wasgenerated by phosphorylation with T4 polynucleotide kinaseand [γ-32P]ATP, both followed by desalting using a Cen-triSep spin column (Princeton Separations). All cleavagereactions were conducted under single-turnover (pre-steady-state) conditions. Standard conditions were 40 mM Tris-HCl(pH 7.5) and 11 mM MgCl2 at 25°C, unless otherwise stated.Ribozyme was preannealed from strand A and twice theconcentration of strand B in standard buffer, by heating to70 °C for 2 min and cooling to room temperature over thecourse of 5 min. After preincubation for 15 min at 25°C, atrace (<4 nM) amount of 3′ or 5′ 32P-labeled substrate (forsubstrate S3) in standard buffer was added to a final
concentration of 10-800 nM ribozyme (based on the strandA concentration). Aliquots (5µL) were taken at appropriatetime intervals and the reactions quenched with 10µL of 80%formamide, 0.025% xylene cyanol, 0.025% bromophenolblue, and 50 mM EDTA. The radiolabeled 3′ or 5′ cleavageproduct was separated from the uncleaved substrate bydenaturing 20% polyacrylamide, 8 M urea, gel electrophore-sis, and was quantified and normalized to the sum of thesubstrate and product bands using a PhosphorImager Storm840 with ImageQuant software (Molecular Dynamics). Timetraces of product formation were fit to the single-exponentialfirst-order rate equationy ) y0 + A1(1 - e-t/τ1), employingMarquardt-Levenberg nonlinear least-squares regression(Microcal Origin), whereA1 is the amplitude andτ-1 thepseudo-first-order rate constantkobs. Duplicates of at leastfour different ribozyme concentrations ([Rz]) were used toextract the catalytic rate constantkcleav under standardconditions, by fitting the ribozyme concentration dependenceof kobs to the binding equation:
in a manner similar to the described procedures (20). KM
describes the apparent ribozyme dissociation constant for thesubstrate associated with catalysis and is reported in Table1. Errors are obtained from the standard deviation of the fitparameters.
To study the inhibition of HDV ribozyme cleavage byterbium(III), separate solutions of 400 nM ribozyme and traceamounts of 5′ 32P-labeled S3 substrate were prepared instandard buffer as described above. After preincubation for15 min at 25°C, varying concentrations of Tb3+ were addedto both ribozyme and substrate. To initiate the reaction, thesubstrate solution was added to the ribozyme solution andreactions were quenched and analyzed as described above.The dependence of the observed cleavage rate constant onthe terbium(III) concentration was fit to the followingequation:
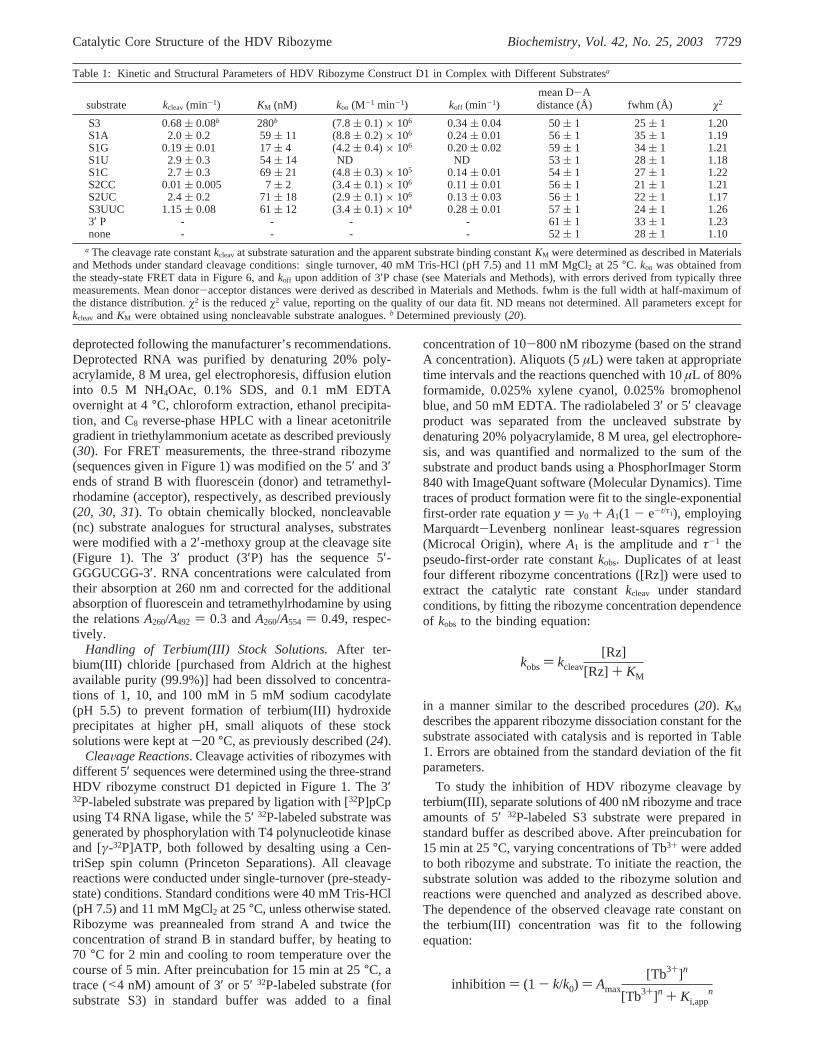
Table 1: Kinetic and Structural Parameters of HDV Ribozyme Construct D1 in Complex with Different Substratesa
substrate kcleav (min-1) KM (nM) kon (M-1 min-1) koff (min-1)mean D-Adistance (Å) fwhm (Å) ø2
S3 0.68( 0.08b 280b (7.8( 0.1)× 106 0.34( 0.04 50( 1 25( 1 1.20S1A 2.0( 0.2 59( 11 (8.8( 0.2)× 106 0.24( 0.01 56( 1 35( 1 1.19S1G 0.19( 0.01 17( 4 (4.2( 0.4)× 106 0.20( 0.02 59( 1 34( 1 1.21S1U 2.9( 0.3 54( 14 ND ND 53( 1 28( 1 1.18S1C 2.7( 0.3 69( 21 (4.8( 0.3)× 105 0.14( 0.01 54( 1 27( 1 1.22S2CC 0.01( 0.005 7( 2 (3.4( 0.1)× 106 0.11( 0.01 56( 1 21( 1 1.21S2UC 2.4( 0.2 71( 18 (2.9( 0.1)× 106 0.13( 0.03 56( 1 22( 1 1.17S3UUC 1.15( 0.08 61( 12 (3.4( 0.1)× 104 0.28( 0.01 57( 1 24( 1 1.263′ P - - - - 61( 1 33( 1 1.23none - - - - 52( 1 28( 1 1.10
a The cleavage rate constantkcleavat substrate saturation and the apparent substrate binding constantKM were determined as described in Materialsand Methods under standard cleavage conditions: single turnover, 40 mM Tris-HCl (pH 7.5) and 11 mM MgCl2 at 25°C. kon was obtained fromthe steady-state FRET data in Figure 6, andkoff upon addition of 3′P chase (see Materials and Methods), with errors derived from typically threemeasurements. Mean donor-acceptor distances were derived as described in Materials and Methods. fwhm is the full width at half-maximum ofthe distance distribution.ø2 is the reducedø2 value, reporting on the quality of our data fit. ND means not determined. All parameters except forkcleav andKM were obtained using noncleavable substrate analogues.b Determined previously (20).
kobs) kcleav
[Rz]
[Rz] + KM
inhibition ) (1 - k/k0) ) Amax
[Tb3+]n
[Tb3+]n + Ki,appn
Catalytic Core Structure of the HDV Ribozyme Biochemistry, Vol. 42, No. 25, 20037729
wherek is the cleavage rate constant in the presence of Tb3+,k0 is the cleavage rate constant in the absence of Tb3+, Ki,app
is the apparent terbium(III) inhibition constant, andn is thecooperativity coefficient (24). Similarly, the dependence ofthe observed cleavage rate constant on the Mg2+ concentra-tion in the presence of a constant background of 10µMterbium(III) was fit to the following equation:
wherek is the cleavage rate constant in the presence of 10µM Tb3+, k0 is the cleavage rate constant in the absence ofTb3+, KD,app is the apparent Mg2+ binding constant, andn isthe cooperativity coefficient (24).
Terbium(III)- and Magnesium(II)-Mediated Footprinting.To observe the slow backbone scission reaction mediatedby Tb(OH)(aq)2+, purified ribozyme strands A and B were5′ 32P-phosphorylated with T4 polynucleotide kinase and[γ-32P]ATP, desalted using a CentriSep spin column (Prin-ceton Separations), and repurified by denaturing 10% poly-acrylamide, 8 M urea, gel electrophoresis, followed bydiffusion elution into 1 mM EDTA, and ethanol precipitation.The labeled RNA strand (∼10000 dpm per 5µL reactionvolume) was preannealed with the two other unlabeledstrands in standard buffer [40 mM Tris-HCl (pH 7.5) and11 mM MgCl2] by heating to 70°C for 2 min and coolingto room temperature over the course of 5 min, followed byaddition of various TbCl3 concentrations (9µM to 9 mM)and a 2 hincubation at 25°C. Alternatively, to test the impact
of preincubation with terbium(III) on substrate binding forthe experiment whose results are depicted in Figure 3c,separate solutions of ribozyme (annealed from trace amountsof 5′ 32P-labeled and purified strand A and a final concentra-tion of 400 nM strand B) and noncleavable substrateanalogue ncS3 (800 nM) were prepared in standard buffersupplemented with micromolar TbCl3 concentrations. Afterpreincubation for 15 min at 25°C, the substrate and ribozymesolutions were mixed and incubated for 5 min, and 3 mMterbium(III) was added for footprinting. In all cases, the
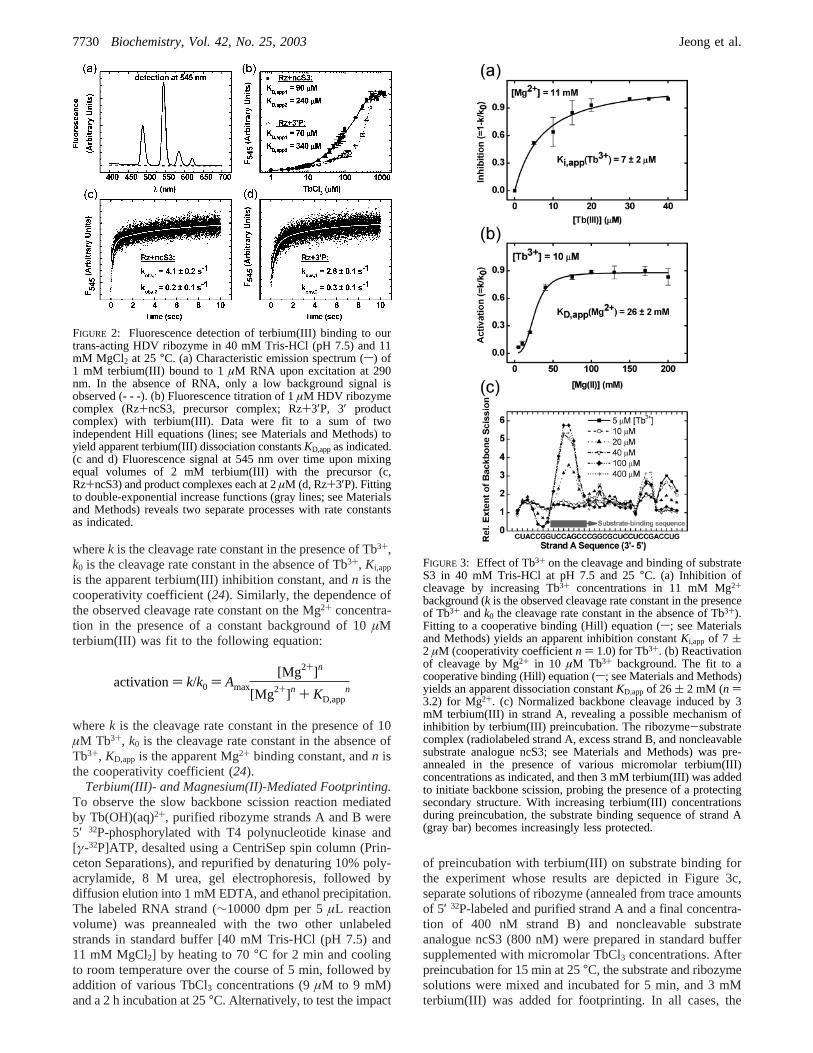
FIGURE 2: Fluorescence detection of terbium(III) binding to ourtrans-acting HDV ribozyme in 40 mM Tris-HCl (pH 7.5) and 11mM MgCl2 at 25°C. (a) Characteristic emission spectrum (s) of1 mM terbium(III) bound to 1µM RNA upon excitation at 290nm. In the absence of RNA, only a low background signal isobserved (- - -). (b) Fluorescence titration of 1µM HDV ribozymecomplex (Rz+ncS3, precursor complex; Rz+3′P, 3′ productcomplex) with terbium(III). Data were fit to a sum of twoindependent Hill equations (lines; see Materials and Methods) toyield apparent terbium(III) dissociation constantsKD,appas indicated.(c and d) Fluorescence signal at 545 nm over time upon mixingequal volumes of 2 mM terbium(III) with the precursor (c,Rz+ncS3) and product complexes each at 2µM (d, Rz+3′P). Fittingto double-exponential increase functions (gray lines; see Materialsand Methods) reveals two separate processes with rate constantsas indicated.
activation) k/k0 ) Amax
[Mg2+]n
[Mg2+]n + KD,appn
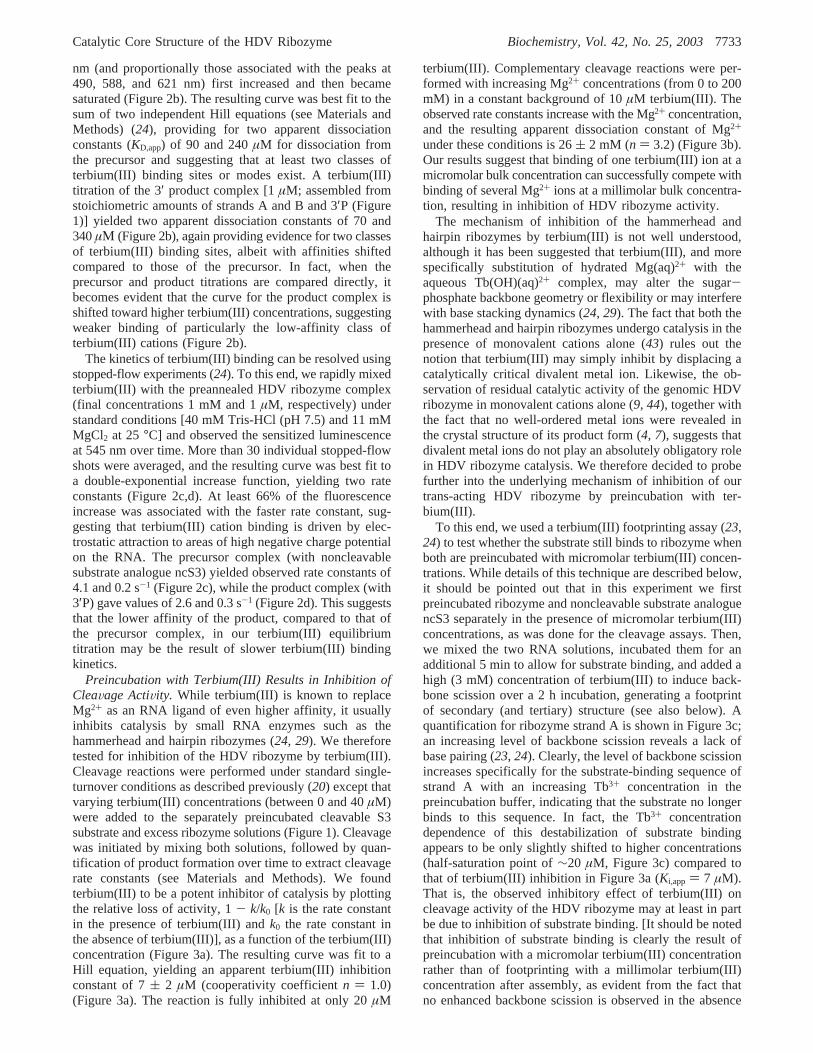
FIGURE 3: Effect of Tb3+ on the cleavage and binding of substrateS3 in 40 mM Tris-HCl at pH 7.5 and 25°C. (a) Inhibition ofcleavage by increasing Tb3+ concentrations in 11 mM Mg2+
background (k is the observed cleavage rate constant in the presenceof Tb3+ andk0 the cleavage rate constant in the absence of Tb3+).Fitting to a cooperative binding (Hill) equation (s; see Materialsand Methods) yields an apparent inhibition constantKi,app of 7 (2 µM (cooperativity coefficientn ) 1.0) for Tb3+. (b) Reactivationof cleavage by Mg2+ in 10 µM Tb3+ background. The fit to acooperative binding (Hill) equation (s; see Materials and Methods)yields an apparent dissociation constantKD,appof 26 ( 2 mM (n )3.2) for Mg2+. (c) Normalized backbone cleavage induced by 3mM terbium(III) in strand A, revealing a possible mechanism ofinhibition by terbium(III) preincubation. The ribozyme-substratecomplex (radiolabeled strand A, excess strand B, and noncleavablesubstrate analogue ncS3; see Materials and Methods) was pre-annealed in the presence of various micromolar terbium(III)concentrations as indicated, and then 3 mM terbium(III) was addedto initiate backbone scission, probing the presence of a protectingsecondary structure. With increasing terbium(III) concentrationsduring preincubation, the substrate binding sequence of strand A(gray bar) becomes increasingly less protected.
7730 Biochemistry, Vol. 42, No. 25, 2003 Jeong et al.

scission reaction was stopped by addition of an equal volumeof 80% formamide and 50 mM EDTA and analyzed on an8 M urea, 20% wedged polyacrylamide sequencing gel,beside sequencing ladders from partial digestion with ribo-nuclease T1 and alkali hydrolysis as described previously(23, 24). Product bands were either directly visualized usingautoradiography or quantified, using a Storm 840 Phosphor-Imager with ImageQuant software (Molecular Dynamics),and normalized by calculating a relative extent of cleavage(Π) from the following equation:
where y is the terbium(III) concentration in a particularcleavage reaction andx the analyzed nucleotide position ofthe RNA. Here, 0 mM [Tb3+] signifies a control reactionmixture incubated in the same fashion as the one containingterbium(III), except that no terbium(III) is added. AΠ valueof g2 indicates significant cleavage over backgrounddegradation (23).
For magnesium(II)-induced scission, the RNA was pre-pared as described above except that 250 mM CHES-NaOH(pH 9.5) and 50 mM MgCl2 were added instead of TbCl3,followed by a 2 h incubation at 37°C (32). Backbonescission was stopped, and the reaction products wereanalyzed as described above for terbium(III)-mediated foot-printing.
Terbium(III) Luminescence Measurements.Steady-stateluminescence spectra of terbium(III) bound to the pre-annealed and equilibrated precursor and product complexesof the HDV ribozyme (1µM) in standard reaction buffer[40 mM Tris-HCl (pH 7.5) and 11 mM MgCl2] at 25 °Cwere measured on an Aminco-Bowman Series 2 (AB2)spectrofluorometer (Thermo Spectronic), while slowly ti-trating TbCl3 over several orders of magnitude from ap-propriate stock solutions. After each terbium(III) addition,the solution was equilibrated for 5-10 min until the signalstabilized, before an emission spectrum was recorded.Excitation was at 290 nm (slit width of 4 nm), and steady-state emission was scanned with a slit width of 8 nm. Toextract the luminescence intensity of the major peak at 545nm, each peak was fit between 535 and 555 nm with aGaussian distribution function:
to yield the peak height as the pre-exponential factor, fromwhich the background value in the absence of Tb3+ wassubtracted. These signals were plotted over varying ter-bium(III) concentrations ([Tb3+]) and were fit to a Hillequation (24):
to yield an apparent terbium(III) dissociation constantKM
and a cooperativity or Hill constantn. For a fit over thecomplete terbium(III) titration range, a sum of two inde-pendent Hill equations produced the best result, as judgedby theø2 deviation and the residuals.
Stopped-flow kinetic experiments were performed usingthe Milli-Flow Reactor on the AB2 spectrofluorometer(Thermo Spectronic). A stock solution of 2 mM Tb3+ instandard reaction buffer was mixed with an equal volumeof 2 µM preannealed precursor or product complex instandard buffer at 25°C. Excitation was at 290 nm (slit widthof 8 nm) and emission at 545 nm (slit width of 8 nm), andchanges in steady-state luminescence intensity were recordedfor 10 s in 1 ms time intervals. The increase in the magnitudeof the signal was fit to a growth equation with twoexponentials,y ) y0 + A1(1 - e-t/τ1) + A2(1 - e-t/τ2), andrate constants were calculated fromτ-1 (24).
Steady-State FRET Measurements.Steady-state FRETmeasurements of HDV ribozyme doubly labeled withfluorescein and tetramethylrhodamine were performed on ourAB2 spectrofluorometer in a manner similar to that ofpreviously described experiments (20, 21, 30). Typically, 50nM annealed ribozyme [final concentration; with an at least2-fold (saturating) excess of the unlabeled strand A; lowerconcentrations of ribozyme were used if the substrateconcentration had to be lowered; see below] was incubatedat 25°C for at least 15 min in standard buffer supplementedwith 25 mM dithiothreitol as a radical quencher, and wasthen transferred to a 150µL cuvette. A noncleavablesubstrate analogue or the 3′ product was manually added toan at least 5-fold excess to initiate the reaction, unlessotherwise stated. Fluorescein was excited at 490 nm (4 nmbandwidth), and for kinetic experiments, fluorescence emis-sion over time was recorded simultaneously at the fluorescein(520 nm, 8 nm bandwidth) and tetramethylrhodamine (585nm, 8 nm bandwidth) wavelengths, by shifting the emissionmonochromator back and forth. A FRET ratioQ ()F585/F520) was calculated and normalized with its starting valueto obtain the relative FRET efficiency. The resulting timetraces were fit, in a manner similar to that described for thecleavage kinetics, to single-exponential increase and decreasefunctions of the formy ) y0 + A1(1 - e-t/τ) andy ) y0 +A1e-t/τ, respectively, yielding pseudo-first-order rate constantsfor substrate or 3′ product binding fromτ-1.
To obtain bimolecular substrate binding rate constants,typically five different excess concentrations of the non-cleavable substrate analogue were added. The resultingpseudo-first-order rate constants are linearly dependent onthe excess concentration of substrate, indicating that theobserved FRET increase is a direct result of substrate binding(20). The slope of this concentration dependence yields thesecond-order substrate binding rate constantskon of Table1. To obtain substrate dissociation rate constants, an at least5-fold excess of 3′P over substrate was added to anequilibrated ribozyme-substrate complex, assembled asdescribed above from 50 nM fluorophore-labeled strand B,100 nM strand A, and 400 nM noncleavable substrateanalogue. In each case, we observed a resultant single-exponential FRET decrease whose rate constant (derived asdescribed above) was independent of the excess 3′P chaseconcentration and which therefore reflects the substratedissociation rate constant reported in Table 1 (20).
Π )
( band intensity at nucleotidex
∑i
band intensity at nucleotidei)y[Tb3+]
( band intensity at nucleotidex
∑i
band intensity at nucleotidei)0mM[Tb3+]
y ) y0 + A
Wxπ/2e-2[(x-x0)2/w2]
y ) ymax
[Tb3+]n
[Tb3+]n + KD,appn
Catalytic Core Structure of the HDV Ribozyme Biochemistry, Vol. 42, No. 25, 20037731

Time-ResolVed FRET Measurements.The global structuresof the HDV ribozyme in complex with various substrates orthe 3′ product were studied by time-resolved FRET (tr-FRET) as previously described (20). Preannealed complexes(75 µL; typically 0.5 µM doubly labeled ribozyme strandB, 1.0µM strand A, and 2.5µM either noncleavable substrateanalogue or 3′ product; increasing the concentrations to 1,3, and 6µM, respectively, gave identical results, indicatingthat we are working under saturating conditions) wereincubated at 25°C for at least 15 min in standard buffer [40mM Tris-HCl (pH 7.5) and 11 mM MgCl2] supplementedwith 25 mM DTT, prior to collecting time-resolved donoremission profiles using time-correlated single-photon count-ing, in a manner similar to previously described procedures(20, 21). Briefly, a frequency-doubled Nd:YVO4 laser(Spectra-Physics Millenia Xs-P, operated at 9.0 W) pumpeda frequency-doubled, mode-locked Ti:sapphire laser (Spectra-Physics Tsunami, operated at 1 W) that excited fluoresceinat 490 nm by 2 ps width pulses, picked down to 4 MHz.Isotropic emission was detected at 520 nm (10 nm band-pass interference filter) in 4096 sampling channels, with atime increment of 12 ps/channel, up to>40000 peak countsand under magic angle polarizer conditions. To measuredonor-acceptor distances, two time-resolved fluorescencedecays were collected, with and without the acceptor in place.The effect of the acceptor on the decay of fluoresceinemission in the doubly labeled complex was then used toextract a three-dimensional Gaussian distance distributionbetween the two fluorophores as previously described indetail (20, 30, 33). In all cases, a single distance distributiongave a good fit, as judged by low reducedø2 values (<1.3,Table 1) and evenly distributed residuals. To calculate a meandistance, a value of 55 Å for the Fo¨rster distanceR0 offluorescein and tetramethylrhodamine was used (33), as-suming a value of2/3 for the orientation factor as experi-mentally supported by low fluorophore anisotropies (20).
FRET Gel Mobility Assays. FRET gel mobility assays wereconducted to test the homogeneity of the various ribozyme-substrate complexes, as previously described (20). Non-denaturing 10% polyacrylamide (19:1 acrylamide:bisacryl-amide ratio) gels containing 40 mM Tris-HCl (pH 7.5) and11 mM Mg(OAc)2 were assembled with the electrophoresisunit and equilibrated to 4°C for at least 2 h. Doublyfluorophore-labeled ribozyme strand B (10 pmol) wasannealed to strand A (20 pmol) by heating for 2 min to 70°C and cooling to room temperature over the course of 5min in 40 mM Tris-HCl (pH 7.5), 11 mM MgCl2, 25 mMDTT, and 10% glycerol. The ribozyme was equilibrated at25 °C for at least 15 min prior to addition of 50 pmol ofsubstrate, noncleavable substrate analogue, or 3′ product(total volume of 20µL). These samples were loaded on thegel, and an electric field of 8 V/cm was immediately applied.After electrophoresis for typically 20 h, the gel was scannedbetween its low-fluorescence glass plates in a FluorImagerSI fluorescence scanner with ImageQuant software (Molec-ular Dynamics) as described previously (20, 34). Briefly, alaser excited fluorescein at 488 nm, and the gel was scannedfor fluorescence emission using a photomultiplier tube witheither a 530 nm band-pass (for the donor fluorescein) or a610 nm long-pass filter (for the acceptor tetramethyl-rhodamine). RNAs labeled with only fluorescein and onlytetramethylrhodamine were included as color calibration
standards. From the volume reports, a measure of FRETefficiency of selected bands was calculated asFacceptor/Fdonor.Defining the readout ofFdonor as green andFacceptoras red,we superimposed the corresponding color images usingPhotoshop 7.0 (Adobe) to generate Figure 7.
Electrostatic Potential Calculations.Structural coordinatesof the postcleavage form of HDV ribozyme were obtainedfrom the Protein Data Bank (PDB entry 1CX0) (7), andatomic radii and charges were obtained from the Amber forcefield. Parts of helices P1, P2, and P4 were deleted usingInsight II (Accelrys Inc.) to generate a higher-resolution mapof the catalytic core. Hydrogen atoms were added using theBiopolymer module of Insight II. Electrostatic potentials werecalculated using the finite difference nonlinear Poisson-Boltzmann (NLPB) equation implemented in the programDelphi/Qnifft14 (35, 36), and two focusing processes wereperformed for a higher resolution (0.94 Å/grid). Three-dimensional structures and electrostatic potentials wererendered using GRASP (37).
RESULTS
The Precursor and Product Forms of the Trans-ActingHDV Ribozyme Bind Terbium(III) with Different Affinitiesand Kinetics.Metal ion interactions are crucial for the foldingand function of RNA as a polyanionic biopolymer (for arecent review, see ref38). Terbium(III) represents the moststable oxidation state of the lanthanide transition metalterbium. Because of their distinctive spectroscopic proper-ties, terbium(III) and its neighbor in the periodic table,europium(III), have been extensively used to substitute forand investigate the roles of metal ions of similar size,particularly Mg2+ and Ca2+, in protein enzymes (39-41).Although terbium has a small extinction coefficient for directabsorption, upon binding proximal to chromophores it canemit sensitized luminescence as a result of energy transferfrom the chromophores. Such a case occurs when ter-bium(III) binds to RNA where nearby excited guanine basestransfer their energy to the lanthanide ion. Using this uniqueproperty, the metal ion binding characteristics of the ham-merhead and hairpin ribozymes have recently been probed(24, 42). We therefore set out to examine, by sensitizedluminescence spectroscopy, the affinity and kinetics ofterbium(III) binding to the precursor and product forms ofour synthetic trans-acting HDV ribozyme D1 (Figure 1),which we have previously established as a suitable modelsystem for studying the structural dynamics and function ofthe HDV-derived RNA enzyme (20, 21).
To investigate a precursor form of construct D1, a 2′-O-methyl group was incorporated at the cleavage site thateliminates the nucleophilic properties of the 2′-OH groupresponsible for catalysis while not altering the sugar puckerpreference of the ribose. Upon addition of 1 mM terbium(III)(final concentration) to 1µM precursor HDV ribozyme(annealed from stoichiometric amounts of strands A and Band noncleavable substrate analogue ncS3; Figure 1) instandard buffer [40 mM Tris-HCl (pH 7.5) and 11 mMMgCl2] at 25 °C, the emission spectrum upon excitation at290 nm showed a terbium(III) specific signal with four peaks,the most intense of which is centered at 545 nm (Figure 2a).In the absence of RNA, no such spectrum was observed(Figure 2a). Upon terbium(III) titration, the emission at 545
7732 Biochemistry, Vol. 42, No. 25, 2003 Jeong et al.
nm (and proportionally those associated with the peaks at490, 588, and 621 nm) first increased and then becamesaturated (Figure 2b). The resulting curve was best fit to thesum of two independent Hill equations (see Materials andMethods) (24), providing for two apparent dissociationconstants (KD,app) of 90 and 240µM for dissociation fromthe precursor and suggesting that at least two classes ofterbium(III) binding sites or modes exist. A terbium(III)titration of the 3′ product complex [1µM; assembled fromstoichiometric amounts of strands A and B and 3′P (Figure1)] yielded two apparent dissociation constants of 70 and340µΜ (Figure 2b), again providing evidence for two classesof terbium(III) binding sites, albeit with affinities shiftedcompared to those of the precursor. In fact, when theprecursor and product titrations are compared directly, itbecomes evident that the curve for the product complex isshifted toward higher terbium(III) concentrations, suggestingweaker binding of particularly the low-affinity class ofterbium(III) cations (Figure 2b).
The kinetics of terbium(III) binding can be resolved usingstopped-flow experiments (24). To this end, we rapidly mixedterbium(III) with the preannealed HDV ribozyme complex(final concentrations 1 mM and 1µM, respectively) understandard conditions [40 mM Tris-HCl (pH 7.5) and 11 mMMgCl2 at 25°C] and observed the sensitized luminescenceat 545 nm over time. More than 30 individual stopped-flowshots were averaged, and the resulting curve was best fit toa double-exponential increase function, yielding two rateconstants (Figure 2c,d). At least 66% of the fluorescenceincrease was associated with the faster rate constant, sug-gesting that terbium(III) cation binding is driven by elec-trostatic attraction to areas of high negative charge potentialon the RNA. The precursor complex (with noncleavablesubstrate analogue ncS3) yielded observed rate constants of4.1 and 0.2 s-1 (Figure 2c), while the product complex (with3′P) gave values of 2.6 and 0.3 s-1 (Figure 2d). This suggeststhat the lower affinity of the product, compared to that ofthe precursor complex, in our terbium(III) equilibriumtitration may be the result of slower terbium(III) bindingkinetics.
Preincubation with Terbium(III) Results in Inhibition ofCleaVage ActiVity. While terbium(III) is known to replaceMg2+ as an RNA ligand of even higher affinity, it usuallyinhibits catalysis by small RNA enzymes such as thehammerhead and hairpin ribozymes (24, 29). We thereforetested for inhibition of the HDV ribozyme by terbium(III).Cleavage reactions were performed under standard single-turnover conditions as described previously (20) except thatvarying terbium(III) concentrations (between 0 and 40µM)were added to the separately preincubated cleavable S3substrate and excess ribozyme solutions (Figure 1). Cleavagewas initiated by mixing both solutions, followed by quan-tification of product formation over time to extract cleavagerate constants (see Materials and Methods). We foundterbium(III) to be a potent inhibitor of catalysis by plottingthe relative loss of activity, 1- k/k0 [k is the rate constantin the presence of terbium(III) andk0 the rate constant inthe absence of terbium(III)], as a function of the terbium(III)concentration (Figure 3a). The resulting curve was fit to aHill equation, yielding an apparent terbium(III) inhibitionconstant of 7( 2 µM (cooperativity coefficientn ) 1.0)(Figure 3a). The reaction is fully inhibited at only 20µM
terbium(III). Complementary cleavage reactions were per-formed with increasing Mg2+ concentrations (from 0 to 200mM) in a constant background of 10µM terbium(III). Theobserved rate constants increase with the Mg2+ concentration,and the resulting apparent dissociation constant of Mg2+
under these conditions is 26( 2 mM (n ) 3.2) (Figure 3b).Our results suggest that binding of one terbium(III) ion at amicromolar bulk concentration can successfully compete withbinding of several Mg2+ ions at a millimolar bulk concentra-tion, resulting in inhibition of HDV ribozyme activity.
The mechanism of inhibition of the hammerhead andhairpin ribozymes by terbium(III) is not well understood,although it has been suggested that terbium(III), and morespecifically substitution of hydrated Mg(aq)2+ with theaqueous Tb(OH)(aq)2+ complex, may alter the sugar-phosphate backbone geometry or flexibility or may interferewith base stacking dynamics (24, 29). The fact that both thehammerhead and hairpin ribozymes undergo catalysis in thepresence of monovalent cations alone (43) rules out thenotion that terbium(III) may simply inhibit by displacing acatalytically critical divalent metal ion. Likewise, the ob-servation of residual catalytic activity of the genomic HDVribozyme in monovalent cations alone (9, 44), together withthe fact that no well-ordered metal ions were revealed inthe crystal structure of its product form (4, 7), suggests thatdivalent metal ions do not play an absolutely obligatory rolein HDV ribozyme catalysis. We therefore decided to probefurther into the underlying mechanism of inhibition of ourtrans-acting HDV ribozyme by preincubation with ter-bium(III).
To this end, we used a terbium(III) footprinting assay (23,24) to test whether the substrate still binds to ribozyme whenboth are preincubated with micromolar terbium(III) concen-trations. While details of this technique are described below,it should be pointed out that in this experiment we firstpreincubated ribozyme and noncleavable substrate analoguencS3 separately in the presence of micromolar terbium(III)concentrations, as was done for the cleavage assays. Then,we mixed the two RNA solutions, incubated them for anadditional 5 min to allow for substrate binding, and added ahigh (3 mM) concentration of terbium(III) to induce back-bone scission over a 2 hincubation, generating a footprintof secondary (and tertiary) structure (see also below). Aquantification for ribozyme strand A is shown in Figure 3c;an increasing level of backbone scission reveals a lack ofbase pairing (23, 24). Clearly, the level of backbone scissionincreases specifically for the substrate-binding sequence ofstrand A with an increasing Tb3+ concentration in thepreincubation buffer, indicating that the substrate no longerbinds to this sequence. In fact, the Tb3+ concentrationdependence of this destabilization of substrate bindingappears to be only slightly shifted to higher concentrations(half-saturation point of∼20 µM, Figure 3c) compared tothat of terbium(III) inhibition in Figure 3a (Ki,app ) 7 µM).That is, the observed inhibitory effect of terbium(III) oncleavage activity of the HDV ribozyme may at least in partbe due to inhibition of substrate binding. [It should be notedthat inhibition of substrate binding is clearly the result ofpreincubation with a micromolar terbium(III) concentrationrather than of footprinting with a millimolar terbium(III)concentration after assembly, as evident from the fact thatno enhanced backbone scission is observed in the absence
Catalytic Core Structure of the HDV Ribozyme Biochemistry, Vol. 42, No. 25, 20037733

of terbium(III) during preincubation. That is, substratebinding in the absence of terbium(III) is not reversed uponaddition of terbium(III) for footprinting.] This conclusion isin contrast to the effect of terbium(III) on the catalytic activityof the hammerhead and hairpin ribozymes, where evidencefrom X-ray crystallography and fluorescence spectroscopy,respectively, shows that substrate is readily bound byribozyme in the presence of inhibitory terbium(III) concen-trations (24, 29). Our results therefore provide furtherevidence for a relatively low-affinity ribozyme-substrateinteraction in the trans-acting HDV ribozyme (11, 20).
Terbium(III) Footprints HDV Ribozyme Secondary Struc-ture at Nucleotide Resolution.High (millimolar) concentra-tions of terbium(III) have been used to cleave an RNAphosphodiester backbone in a largely sequence independentmanner preferentially in single-stranded or non-Watson-Crick base-paired regions, thus generating a footprint of theRNA’s secondary and tertiary structure at nucleotide resolu-tion (23-27). In addition, because of the strongly electro-static interaction of the highly charged Tb3+ with thepolyanionic RNA backbone, cleavage activity is particularlyenhanced on RNA surfaces of high local charge density,revealing potential metal binding sites (23, 28, 45). Becauseof its near-physiologic aqueous pKa of 7.9 and its Mg2+-and Ca2+-like coordination properties with a preference foroxygen ligands, terbium(III) has recently become popularas an alternative to Mg2+ and Pb2+ ion-induced footprinting(23). We therefore set out to probe and compare the structuresof our HDV ribozyme precursor and product complexes. Tothis end, trace amounts of radiolabeled strand A werepreannealed with a saturating excess of unlabeled strand Band either noncleavable substrate analogue ncS3 or 3′ product(3′P) under standard buffer conditions [40 mM Tris-HCl (pH7.5) and 11 mM MgCl2 at 25°C], followed by addition ofincreasing concentrations of terbium(III) to initiate slowbackbone scission at 25°C over the course of 2 h (underthese conditions, only a small fraction of RNA is cleaved toavoid secondary hits on an already cut RNA molecule).Above 300µM terbium(III), the concentration at which theRNA starts to become saturated in our equilibrium titration(Figure 2b), we observe terbium(III)-mediated backbonescission above background (Figure 4). The footprintingpatterns of both the precursor (ncS3) and product (3′P)complexes are strongly biased toward the unpaired loop 3(L3) region and the segments of helices P1 and P4 closestto P1.1. We performed similar experiments using radio-labeled strand B (data not shown), where the most intensebands appeared 3′ to the catalytic C75. A quantification ofbackbone scission at nucleotide resolution relative to back-ground degradation (see Materials and Methods) is shownfor the entire ribozyme in Figure 5.
The cleavage pattern of the product (3′P) complex isconsistent with the crystal structure (4); protection is observedin all five Watson-Crick base-paired stems, P1-P4 andP1.1, while the backbone of the L3 loop region and that 3′to C75 and G76 in the joiner between P4 and P2, calledJ4/2, are intensely cut (Figures 4 and 5). In contrast, theprecursor (ncS3) complex is distinct; while P1-P4 remainprotected, both the 5′ and 3′ segments of the P1.1 stem (aswell as U20, immediately upstream) are strongly hit, sug-gesting that this helix is formed to a lesser extent than inthe product complex (Figures 4 and 5). In addition, scission
in J4/2 extends to A77 and A78 (Figure 5), suggesting thatthe ribose zipper motif involving these nucleotides (Figure1) may not be fully formed in the precursor complex. Theseresults confirm that the trans-acting precursor complexundergoes a conformational change, especially in the catalyticcore region of P1.1 and J4/2, upon cleavage and conversioninto the product complex. While previous evidence fromfluorescence resonance energy transfer (20), 2-aminopurinefluorescence quenching (21), and NMR spectroscopy (18,22) have already hinted at structural differences between theprecursor and product forms of the trans-acting HDVribozyme, here we have derived specifics of these rearrange-ments at nucleotide resolution.
Magnesium(II) at pH 9.5 Produces a Structural FootprintSimilar to That of Terbium(III).In principle, it is conceivablethat the addition of 3 mM terbium(III) to the precursor(ribozyme-noncleavable substrate) complex for footprintingmay specifically alter the structure of this complex so that itno longer resembles that of the product complex. To testfor this possibility, we performed footprinting assays utilizing50 mM Mg2+ at pH 9.5 and 37°C instead; elevated pH andtemperature produce enough deprotonated Mg(OH)(aq)+
species (pKa ) 11.4) to act as a footprinting agent for sitesof enhanced metal binding. Previously, such assays have
FIGURE 4: Terbium(III)- and magnesium(II)-mediated footprint of5′ 32P-labeled HDV ribozyme strand A upon incubation withterbium(III) for 2 h in 40 mMTris-HCl (pH 7.5) and 11 mM MgCl2at 25°C. From left to right are shown, as indicated, strand A freshafter radiolabeling, incubated in buffer without Tb3+, incubated withexcess strand B in buffer without Tb3+, and incubated with excessstrand B and noncleavable substrate analogue ncS3 in buffer withoutTb3+, RNase T1 digest, alkali (OH-) ladder, footprint withincreasing Tb3+ concentrations in the presence of excess strand Band ncS3, incubated in buffer without Tb3+, incubated with excessstrand B in buffer without Tb3+, and footprint with increasing Tb3+
concentrations in the presence of excess strand B and 3′ product(3′P). As the terbium(III) concentration is increased, backbonescission becomes more intense. The 5′ and 3′ segments of P1.1(boxed) footprint very differently between the precursor and productcomplexes. At the far right is shown magnesium(II)-inducedcleavage at pH 9.5 and 37°C (see Materials and Methods); fromleft to right are shown the precursor (ncS3) complex incubated atpH 7.5 (control), the precursor complex footprinted at pH 9.5, theproduct complex incubated at pH 7.5 (control), and the productcomplex footprinted at pH 9.5.
7734 Biochemistry, Vol. 42, No. 25, 2003 Jeong et al.
revealed a metal binding site at the bottom of the P2 stemin catalytically active HDV ribozyme-substrate complexes(32). We were interested in comparing the footprintingpatterns in magnesium(II) and terbium(III); Figure 4 showsthat they are indeed very similar. In particular, magnesium(II)footprinting reveals strongly cut 5′ and 3′ segments of theP1.1 stem in the precursor (ncS3) complex, which becomehighly protected in the product (3′P) complex, just as theydo when using terbium(III) as the footprinting agent. Theseresults provide further evidence for structural differencesbetween the precursor and product complexes of the trans-acting HDV ribozyme and demonstrate the value of ter-bium(III) in providing unbiased information about RNAsecondary and tertiary structure.
The Terbium(III) Footprinting Pattern Is Modulated bythe Composition of the 5′ Substrate Sequence.The essentialactive site components of the HDV ribozyme are all proposedto reside in the sequence 3′ to the cleavage site since a singlenucleoside 5′ to the cleavage site is sufficient for catalytic
activity and does not participate in any base pairing interac-tions with the 3′ sequence (46, 47). Nevertheless, the 5′substrate sequence has been shown to have a significantimpact on catalytic activity (11, 19). Since the only differencebetween our precursor and product complexes is the presenceof this 5′ sequence, we decided to test variations of thissequence for their impact on the observed structural differ-ences. Guided by the catalytic studies of Been and co-workers (11), we chose a systematic set of substrates forour structural studies (Figure 1). First, we confirmed thatthe single-turnover cleavage activities of our ribozymeconstruct D1 vary significantly for these substrates (Table1), generally following the trends observed by Been and co-workers [although our rate constants at 25°C are typically3-8-fold faster than those reported by Been at 37°C in asimilar buffer (11)]. Next, we performed terbium(III) foot-printing assays on the noncleavable substrate analoguecontaining precursor complexes, and the quantified resultsare shown in Figure 5. All precursor complexes display
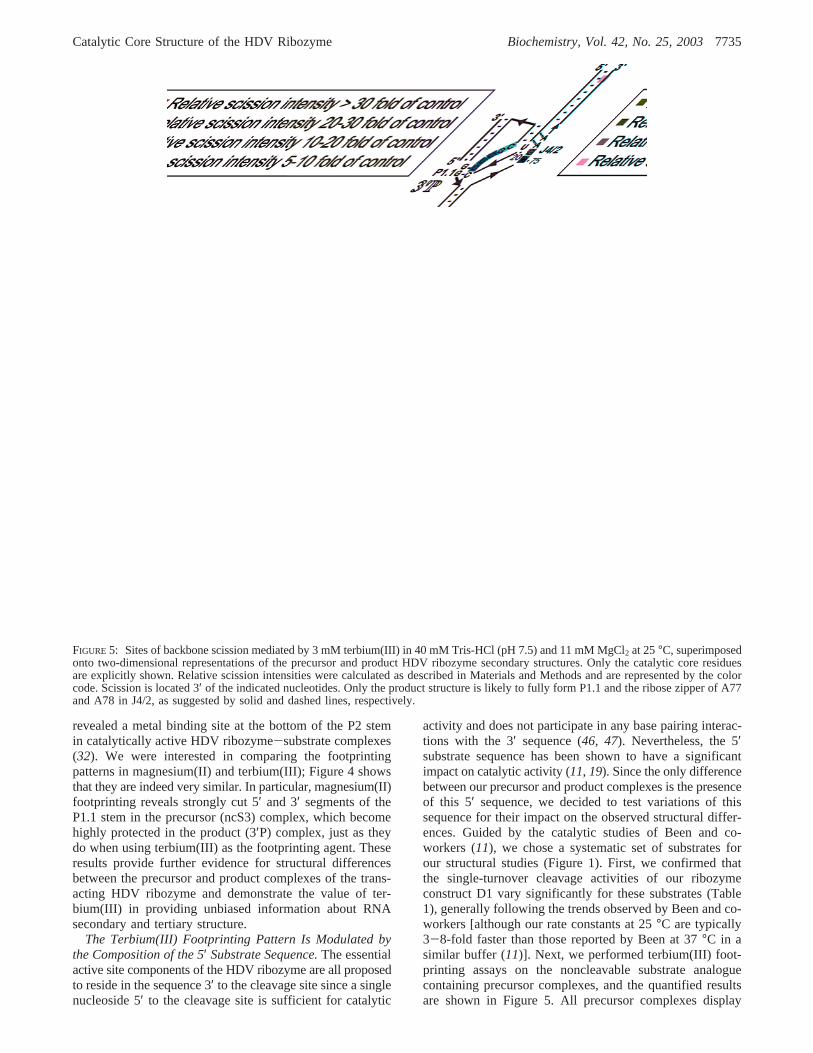
FIGURE 5: Sites of backbone scission mediated by 3 mM terbium(III) in 40 mM Tris-HCl (pH 7.5) and 11 mM MgCl2 at 25°C, superimposedonto two-dimensional representations of the precursor and product HDV ribozyme secondary structures. Only the catalytic core residuesare explicitly shown. Relative scission intensities were calculated as described in Materials and Methods and are represented by the colorcode. Scission is located 3′ of the indicated nucleotides. Only the product structure is likely to fully form P1.1 and the ribose zipper of A77and A78 in J4/2, as suggested by solid and dashed lines, respectively.
Catalytic Core Structure of the HDV Ribozyme Biochemistry, Vol. 42, No. 25, 20037735

cleavage patterns distinct from those of the 3′P complex,even if they only contain one additional nucleotide 5′ of thecleavage site. Consistently, the P1.1 stem and the ribosezipper motif in J4/2 are strongly cut and thus not fully formed(Figure 5). There are subtle differences among the precursorcomplexes; one that stands outs is that of the noncleavablesubstrate analogue ncS3UUC, which has the sequence UUC5′ to the cleavage site and displays a protected 3′ and anexposed 5′ segment of P1.1, presumably due to formationof an extended substrate binding helix P1. Remarkably,noncleavable substrate analogue ncS2UC, missing only theterminal nucleotide of the 5′ sequence of ncS3UUC, doesnot show evidence for such a P1 extension (Figure 5).
Steady-State Fluorescence Resonance Energy Transfer(FRET) Indicates that the Differences in Catalytic CoreStructure Translate into Differences in Global Structure.Previously, we have shown by steady-state FRET thatbinding of the noncleavable substrate analogue ncS3 by ourHDV ribozyme construct D1 leads to a slight decrease inthe distance (i.e., increase in FRET) between two fluoro-phores attached to the termini of stems P2 and P4. Thisobservation is in contrast to the large increase in distance(decrease in FRET) resulting from binding of the 3′ product,indicative of a substantial change in global structure uponcleavage (20). This change is accompanied by a significantrearrangement of the catalytic core as evidenced fromfluorescence dequenching of a 2-aminopurine incorporatedat position 76 of the trefoil motif in the J4/2 joiner (Figure1) (21). Given the variations in catalytic core structure, asprobed by terbium(III) footprinting, of our precursors withsystematically varied 5′ substrate sequence (Figure 5), weexpected potential differences between them in our steady-state FRET assay as well. This is indeed the case; Figure 6shows that the addition of a saturating 8-fold (400 nM) excessof each noncleavable substrate analogue to the fluorophore-labeled ribozyme leads to a FRET change of distinct rateand extent. Unlike ncS3, all shorter noncleavable substrateanalogues result in a slight to significant decrease in the
extent of FRET, but not to the same extent or rate as additionof the 3′ product (3′P) that lacks the 5′ substrate sequence.The only exception is ncS1G, with only a single G 5′ to thecleavage site, whose addition to the ribozyme leads to adecrease in the extent of FRET that is nearly as large as thatfor the addition of 3′P (Figure 6). However, it is importantto note that the corresponding cleavable S1G is a comparablypoor substrate [kcleav ) 0.19 min-1, ∼10-fold slower thanmost other substrates (Table 1)], suggesting that its precursorstructure is not optimal for catalysis, as has been observedpreviously (11). It also should be noted that we have evidencethat this particular substrate easily forms alternative, multi-meric structures, which we had to denature for all of ourstudies. Specifically, when we did not heat denature thenoncleavable substrate analogue ncS1G prior to its additionto the FRET-labeled ribozyme, we observed only a verysmall decrease in the extent of FRET. In contrast, the steady-state FRET time traces of all other substrates were not alteredby such heat denaturation (data not shown). Similarly, onlythe ncS1G substrate (and its cleavable version S1G) had tobe heat-denatured prior to purification by C8 reverse-phaseHPLC; otherwise, a much delayed and heterogeneous elutionprofile compared to those of the other substrates wasobserved (data not shown). Presumably, this substrate, withits six guanosines out of eight nucleotides, can form morestable G-quadruplexes (48), which need to be denatured priorto binding to ribozyme.
By fitting our steady-state FRET data with single-exponential increase or decrease functions as required, wewere able to measure the pseudo-first-order rate constantsof the FRET change upon formation of the ribozyme-noncleavable substrate analogue complex for all substratesexcept ncS1U (which exhibited a FRET change that was toosmall) (Figure 6). The bimolecular substrate binding rateconstantskon were then extracted as described previously (20)from the substrate concentration dependencies of the pseudo-first-order rate constants; results are reported in Table 1. Mostnotably, the ncS3UUC substrate binds considerably moreslowly (by 2 orders of magnitude) than nearly all othersubstrates. The ncS3UUC substrate also yields the mostdistinct terbium(III) footprinting pattern of all precursorcomplexes, suggesting the formation of an extended substratebinding helix P1 (see above and Figure 5). Perhaps competi-tion with a partially formed P1.1 helix leads to the observeddeceleration of substrate binding (Figure 1).
Next, we performed steady-state FRET assays in whichwe added a large excess of 3′P as a chase to the preformedribozyme-noncleavable substrate analogue complex (seeMaterials and Methods). We have previously shown that thisassay directly reports the dissociation rate constantkoff ofthe substrate (20), and the results of our analysis aresummarized in Table 1. As expected, substrates that can haveadditional interactions between their 5′ sequence and the GGsequence of the 3′ segment of the P1.1 stem, such as S1C,S1CC, and S2UC (Figure 1), have slower dissociation rateconstants than most other substrates [0.1 min-1 comparedto 0.2-0.3 min-1 (Table 1)]. However, the S3UUC substrateagain is an exception to this rule since its dissociation rateconstant (0.28 min-1) groups with that of the faster dis-sociating substrates.
Time-ResolVed FRET ReVeals the Global Architecture ofthe Precursor Complexes, while a FRET Gel Mobility Assay
FIGURE 6: Relative steady-state FRET changes upon addition ofour noncleavable substrate analogues (400 nM each) with varied5′ sequence and of 3′ product (3′P) to 50 nM fluorescein-tetramethylrhodamine doubly labeled HDV ribozyme D1 in 40 mMTris-HCl (pH 7.5), 11 mM MgCl2, and 25 mM DTT at 25°C. Datawere fit (s) with single-exponential increase or decrease functionsas required, yielding the following rate constants: 2.61 min-1 forncS3, 0.14 min-1 for ncS1U, 0.3 min-1 for ncS1C, 1.05 min-1 forncS2UC, 1.16 min-1 for ncS2CC, 3.65 min-1 for ncS1A, 0.05 min-1
for ncS3UUC, 3.1 min-1 for ncS1G, and 11 min-1 for 3′P.
7736 Biochemistry, Vol. 42, No. 25, 2003 Jeong et al.

Reports on Their Homogeneity.To quantify the globalstructural differences between the various precursor com-plexes and the product complex, we used time-resolvedFRET (tr-FRET) to measure the distance distribution betweenthe donor and acceptor fluorophores attached to the terminiof P4 and P2, respectively, as previously described (20, 21).Our tr-FRET data analysis yielded a single distance distribu-tion for each complex that was studied, as judged by thelow ø2 values and residuals of our fits (see Materials andMethods). This confirms our result from steady-state FRETwhich shows there are significant differences in the globalarchitectures of the precursor complexes, which are alldistinct from the 3′ product complex (Table 1). For example,a significant increase in the mean donor-acceptor distanceof 11 Å is observed upon conversion of the ncS3-containingprecursor complex into the product complex, as describedpreviously (20). In contrast, the slowly cleaving S1Gsubstrate forms a precursor (ncS1G) complex with a meandonor-acceptor distance only 2 Å shorter than that of theproduct complex (Table 1), consistent with our steady-stateFRET results (Figure 6). In general, the mean donor-acceptor distances measured by tr-FRET are consistent withthe pattern of steady-state FRET changes in Figure 6, in thata smaller distance correlates with an increase in the extentof FRET and a larger distance with a decrease in the extentof FRET compared to the substrate-free ribozyme (Table 1).This demonstrates that the 5′ substrate sequence has asurprisingly significant effect on the global structure of theprecursor complex, presumably resulting from the rearrange-ment of the catalytic core observed by terbium(III)-mediatedfootprinting. In addition, the full widths at half-maximum(fwhms) of the distance distributions vary significantly withthe 5′ substrate sequence, perhaps indicative of changes inthe overall flexibility of the complex (Table 1).
We also utilized a previously described FRET gel mobilityassay (20, 21) to examine the homogeneity and FRET ratiosof our precursor complexes. To this end, we electrophoresedour doubly labeled HDV ribozyme construct D1 on anondenaturing polyacrylamide gel alone and in complex witheach of our noncleavable substrate analogues as well as the3′ product (see Materials and Methods). The results of aquantitative Fluorimager analysis are shown in Figure 7. Allbut two precursor complexes exhibit a single band (whereany alternate band contributes less than 15% of the majorone), and each precursor complex shows a distinct FRET(acceptor:donor fluorescence) ratio or color in the gel. Theobserved colors are largely consistent with our analysis bysteady-state and time-resolved FRET, in that a red-shiftedgel band with respect to that of the free D1 ribozymecorrelates with a steady-state increase in the extent of FRET(Figure 6) and a decrease in the donor-acceptor distancemeasured by tr-FRET (Table 1), while a green-shifted bandcorrelates with a steady-state decrease in the extent of FRETand an increase in the donor-acceptor distance. However,the ability of a nondenaturing gel to separate RNA confor-mations on the basis of hydrodynamic radius (49) reveals asignificant alternate conformer (band) for the precursorcomplexes containing the ncS1G and ncS1U noncleavablesubstrate analogues (having∼56 and∼68%, respectively,of the intensity of their major bands). In both cases, thesecondary band has a lower gel mobility and is red-shiftedcompared to the major band (Figure 7). Interestingly, we
did not find any evidence for such defined alternateconformers in our tr-FRET analysis, where a single distancedistribution in both cases gaveø2 values of 1.21 and 1.18,respectively, comparable to those of any other complex thatwas studied (Table 1). It is possible that the sieving andcaging effects of the polyacrylamide gel matrix or the lowtemperature (4°C) during electrophoresis in these cases eitherslow the interconversion of existing conformers or inducenovel RNA conformations that are resolved as separatebands. Nonetheless, all of our observations highlight the largeinfluence that a single or few nucleotides of the 5′ substratesequence, with no known interaction with the remainder ofthe RNA, have on the catalytic core and global structure, aswell as the catalytic activity, of the HDV ribozyme.
DISCUSSION
Biological catalysis depends on the proper juxtapositionof functional groups from both the substrate and enzyme inthe catalytic core of the enzyme to increase their effectiveconcentration and lower the entropic cost of their interaction(50). Catalytic RNAs are no exception, as they are alsobelieved to use this strategy to enhance their ability asenzymes (for a review, see ref6). As one example, the crystal
FIGURE 7: Nondenaturing gel electrophoresis of fluorescein-tetramethylrhodamine doubly labeled HDV ribozyme D1 free andin complex with our set of noncleavable substrate analogues withvarying 5′ sequence and 3′ product (3′P) as indicated. Thecomplexes exhibit not only different gel mobilities which arereflective of their hydrodynamic radii but also distinct colors andthus acceptor (tetramethylrhodamine):donor (fluorescein) ratios[bottom panel, white bars, FRET ratios of slower migrating (upper)secondary bands]. Electrophoresis and quantitative analysis wereperformed as described in Materials and Methods.
Catalytic Core Structure of the HDV Ribozyme Biochemistry, Vol. 42, No. 25, 20037737

structure of the self-cleaved product of the genomic HDVribozyme shows a tightly interwoven nested double-pseudoknot structure with five Watson-Crick base-pairedstems (P1, P1.1, and P2-P4) (4, 7). It also reveals a trefoilturn buttressed by a downstream ribose zipper in the single-stranded region connecting P4 and P2 (J4/2), which positionsthe catalytic C75 into a tight catalytic core at the junctionof the five stems (Figure 1). However, absent from theproduct crystal structure is the sequence immediately 5′ tothe cleavage site, and while it is not predicted to directlybase pair with any downstream elements, it must contributeto the architecture of the adjacent active site in the transitionstate. Consistent with this notion, the 5′ sequence has beenfound to strongly influence both substrate binding affinityand catalytic activity of the trans-acting HDV ribozyme (19);presumably, the HDV ribozyme utilizes intrinsic substratebinding energy to lower the energetic barrier of catalysis (6,11). Here, we show that there is a structural basis for theseobservations as a systematic set of substrates leads to catalyticcore structures, particularly with regard to P1.1 and J4/2,that all are substantially different from that of the productcomplex and where each translates into a distinct globalarchitecture. Specifically, we have used terbium(III), whichwe show to bind rapidly and with two gross affinities (Figure2), to probe the local structure of the various ribozyme-noncleavable substrate (precursor) complexes at nucleotideresolution (Figure 4). The 5′ substrate sequence subtlymodulates the terbium(III) footprinting pattern, but in general,we find that P1.1 and the nucleotides involved in the ribosezipper of J4/2 only become protected in the product complex(Figure 5). The relatively subtle differences in catalytic corestructure among the various precursor complexes translateinto surprisingly significant changes in FRET efficiencybetween two fluorophores attached to the termini of P4 andP2, as evident from steady-state, time-resolved, and gel-mobility FRET assays (Figure 6, Table 1, and Figure 7,respectively). In light of such differences in HDV ribozymeprecursor structure at both the local and global level,depending on the 5′ substrate sequence, it may be lesssurprising that their catalytic activities vary so widely (Table1).
We find terbium(III) to be a versatile probe of HDVribozyme secondary and tertiary structure. As detected bysensitized terbium(III) luminescence and observed before forthe hairpin ribozyme, the lanthanide ion binds to the RNAwith rapid, electrostatically driven, multiexponential kinetics(Figure 2c,d) and with multiple binding affinities (Figure 2b).Clearly, the ncS3-containing precursor and 3′ productcomplexes show distinct terbium(III) binding kinetics andaffinities, consistent with their distinct local and globalstructures. Backbone scission with 3 mM terbium(III) at pH7.5 over the course of 2 h at room temperature producesdistinct footprinting patterns of the precursor and productsecondary and tertiary structures, very similar to the patternsobserved upon magnesium(II)-induced footprinting (Figure4). Like hydroxyl radicals (51), terbium(III) preferentiallycuts non-Watson-Crick base-paired regions which are thekey to RNA function, but is simple to set up (see Materialsand Methods), making it a powerful and easy-to-use struc-tural probe. To induce backbone scission in a specificlocation, the aqueous Tb(OH)(aq)2+ complex has to depro-tonate the adjacent 2′-OH group which then nucleophilically
attacks the 3′,5′-phosphodiester bond to form 2′,3′-cyclicphosphate and 5′-hydroxyl termini. Therefore, a long resi-dency time of the terbium(III) complex and ample access tothe ribose 2′-OH group will result in a specific backbonecut (23, 24, 27). A long residency time of the cationicterbium(III) complex in the proximity of the polyanionicRNA backbone, in turn, depends at least in part on theelectrostatic surface potential of the RNA. The crystalstructure of the product form of the genomic HDV ribozyme(4, 7) allows us to calculate the electrostatic surface potentialusing the nonlinear Poisson-Boltzmann equation imple-mented in the program Delphi/Qnifft14 (35, 36) so that wecan compare it with the terbium(III) scission sites in ourproduct complex. Figure 8 shows that we indeed observestrongly hit 2′-OH and phosphodiester groups (right panels,color coded as in Figure 5), for example, in loop 3 and aroundC75, that coincide with a high local surface charge potentialof the RNA (left panels, colored in red).
FIGURE 8: Comparison of the electrostatic surface charge potential,calculated using the NLPB equation on the crystal structure of the3′ product form of the genomic HDV ribozyme [PDB entry 1CX0(7)], with the observed backbone scission sites at 3 mM terbium(III).(a) Front view of the catalytic core. The surface charge potential iscolored using the depicted scale ranging from-30 to 10 kT/e. The5′ end is deeply buried in the catalytic pocket between P1.1 andloop L3 that is characterized by a high negative charge potential.(b) Phosphate and 2′-hydroxyl groups involved in terbium(III)-mediated backbone scission. The viewpoint is the same as in panela, and relative scission intensities are colored as in Figure 5: redfor >30-fold of control, orange for 20-30-fold of control, greenfor 10-20-fold of control, and blue for 5-10-fold of control.Regions close to the catalytic core, especially in loop L3, arestrongly cut. (c) Surface charge potential from the back view ofthe molecule to highlight the joiner J4/2 that contains C75. Thecolor code is the same as in panel a. (d) Phosphate and 2′-hydroxylgroups involved in terbium(III)-mediated backbone scission fromthe same viewpoint as panel c and with the color code of panel b.C75 is particularly strongly cut. All three-dimensional structuresand electrostatic potentials were rendered using the program GRASP(37).
7738 Biochemistry, Vol. 42, No. 25, 2003 Jeong et al.

Interestingly, we confirm here our previous finding (24)that terbium(III) can interfere with the formation of asecondary structure element such as the substrate-bindinghelix P1 if added during preincubation, while it does notdisrupt structures already formed (Figure 3c). In the case ofthe hairpin ribozyme, this observation has enabled us to studyits folding pathway by order-of-addition experiments (24).In the case of the HDV ribozyme, it allows us to proposethat the mechanism of inhibition of catalytic activity bymicromolar terbium(III) concentrations (Figure 3a) is simplyinterference with substrate binding. However, we cannot ruleout the possibility that other, more specific mechanisms arealso at work, since there are slight differences in theterbium(III) dependencies of catalytic [Ki,app ) 7 µM Tb3+
(Figure 3a)] and substrate binding inhibition [Ki,app closer to∼20 µM Tb3+ (Figure 3c)]. Such more specific mechanismsmay include the distortion or suppression of the dynamicsof essential tertiary structure elements, as suggested for thehairpin and hammerhead ribozymes (24, 29), or the interfer-ence with binding of a catalytically important divalent metalion. In each case, an increase in the competing Mg2+
concentration is expected to recover catalytic activity, asexperimentally observed (Figure 3b). The fact that we donot observe terbium(III)-mediated backbone scission atcatalytically inhibiting low micromolar concentrations (Fig-ure 4 and data not shown) does not provide evidence againstthe involvement of a specific terbium(III) binding site ininhibition since scission may simply not occur due to thelack of access to a nearly 2′-OH group (23, 24, 27).
In the absence of a high-resolution structure of theprecursor of the HDV ribozyme cleavage reaction, it has notbeen evident whether and how the substrate sequence 5′ tothe cleavage site influences the overall structure. We nowhave several lines of experimental evidence from ter-bium(III)-mediated footprinting (this work), FRET (this workand ref20), and 2-aminopurine fluorescence spectroscopy(21) that the HDV ribozyme, at least in its trans-acting form,undergoes dramatic changes in both the catalytic core andglobal structure upon substrate cleavage and dissociation ofthe 5′ sequence. It has previously been pointed out that the5′-OH leaving group in the product crystal structure of thegenomic HDV ribozyme is deeply buried within the catalyticcleft (see also Figure 8a) and that accommodation of asequence 5′ to the cleavage site may be sterically strenuous(6, 20, 21). Consistent with this notion, Been and co-workershave found that in their HDV ribozyme construct thesequence components immediately 5′ to the cleavage sitedestabilize ground-state substrate binding. This ground-statedestabilization appears to contribute up to 2 kcal/mol towardthe total 8.5 kcal/mol reduction in activation free energy forRNA cleavage (11). It has therefore been tempting tospeculate that a sharp bend in the backbone trajectory aroundthe scissile phosphate, the energetic cost of which is expectedto be dependent on the length and composition of thesequence 5′ to the cleavage site, accompanies formation ofthe transition state (6, 20, 21). According to this model, thescissile phosphate becomes positioned between helices P1and P1.1 and exposed to the catalytic C75, which isbuttressed by the J4/2 ribose zipper motif, only in theconstrained transition state. Cleavage activity may there-fore be controlled by the probability of access to such atransition state, which in turn is likely to be dependent on
the 5′ substrate sequence, explaining our experimentalobservations.
We were interested in more quantitatively comparing ourresults with those of Been and co-workers. In particular, wewanted to test whether we find the same correlation betweensubstrate catalytic activation and binding free energies (11).Our substrate dissociation and binding rate constants,koff andkon, respectively (Table 1), allow us to directly calculatedissociation equilibrium constantsKD from KD ) koff/kon.Surprisingly, when plotting the activation free energy (∆∆Gq)of our substrates, as calculated fromkcleav (Table 1), overthe free energy of substrate binding (∆∆Gbind), as calculatedfrom the dissociation equilibrium constantKD, we observeonly a very weak linear correlation (correlation coefficientr ) 0.3) with a small negative slope (-0.3) compared tothe strong linear correlation (r ) 0.9) with a negative slopeof -1 noted by Been and co-workers (Figure 9). This partialloss of correlation between destabilized ground-state substratebinding (less negative values on thex-axis of Figure 9) andreduction in activation free energy of substrate cleavage(more negative values on they-axis of Figure 9) may haveto do with the fact that the cleavage activity of our trans-acting HDV ribozyme is generally higher than that of Been’sconstruct [with rate constants at 25°C typically 3-8-foldfaster than those reported by Been at 37°C (11)]. In addition,the cleavage rate constants of our substrates are generallyseveralfold larger than their dissociation rate constants (Table1), while Been’s substrates follow a Briggs-Haldane typeof mechanism in that their dissociation rate constants arecomparable to those of cleavage. Our loss in correlation maytherefore be due to a shift of our rate-limiting step awayfrom ground-state substrate binding toward actual reactionchemistry. In that case, substrate cleavage would be expectedto be faster and less determined by the binding step, asobserved.
The terbium(III) footprinting patterns of our variousprecursor complexes give us a low-resolution picture of theirground-state structures. The enhanced access that terbium(III)generally has to the backbone of their P1.1 stem and J4/2ribose zipper nucleotides A77 and A78 suggests that thesestructural elements are formed to a lesser extent than in the
FIGURE 9: Test of a linear correlation between the substrate catalyticactivation and binding free energies. The Gibbs activation (∆∆Gq)and substrate binding free energies (∆∆Gbind) were calculated asdescribed previously (11) from the relations∆∆Gq ) -RT ln(kcleav/kuncat) and∆∆Gbind ) -RT ln(1/KD) ) -RT ln(kon/koff), whereR isthe gas constant (1.98 cal K-1 mol-1), T is the reaction temperature[310 K (Been’s data) and 298 K (our data)],kuncatis the backgroundcleavage rate in the absence of the ribozyme (10-6 min-1) (11),andkcleav, kon, andkoff are the values reported in ref11 and Table1 for Been’s and our data, respectively: (0 and - - -) Been’sdata (11) and (b ands) our data. Slopes and correlation coefficientsr for the two linear fits are as indicated.
Catalytic Core Structure of the HDV Ribozyme Biochemistry, Vol. 42, No. 25, 20037739

product complex. A plausible notion is that these motifs formonly sporadically while the precursor dynamically exploresconformational space. Hence, the typical (“average”) ground-state structure of the precursor may resemble the molecularmodel for the HDV ribozyme precursor derived by Westhofand co-workers in 1994, prior to the advent of the productcrystal structure (52). This model predicts all four majorhelices (P1-P4) but lacks P1.1 and the J4/2 ribose zipper,just as suggested by our terbium(III) footprints of theprecursor structure. In the event of transient formation ofthe key factors believed to be required for catalysis, such asP1.1, the J4/2 ribose zipper, and perhaps a substrate bendpositioning the scissile phosphodiester within hydrogenbonding distance of a protonated C75, the transition statecan be reached and substrate cleavage can occur. Thisscenario would explain why the pKa of C75 appears to onlyfully shift toward neutrality in the transition state of thetransesterification reaction (18). It may also explain theobservation that catalysis by cis-acting ribozymes is generally∼10-fold faster than by trans-acting ribozymes (6), if weassume that their additional strand crossover between P1 andP2 (Figure 1) helps restrict the dynamics of P1 to a degreethat the transition state can be reached with 10-fold higherprobability. Only further experimental and modeling studieswill reveal whether this prediction is correct.
ACKNOWLEDGMENT
We thank Vinod Misra for helpful discussions on theNLPB calculations, all members of the Walter laboratoryfor stimulating discussions, and Tom Kerppola for makinghis FluorImager available to us for gel-mobility FRET assays.
REFERENCES
1. Lai, M. M. (1995)Annu. ReV. Biochem. 64, 259-286.2. Hadziyannis, S. J. (1997)J. Gastroenterol. Hepatol. 12, 289-
298.3. Macnaughton, T. B., Shi, S. T., Modahl, L. E., and Lai, M. M.
(2002)J. Virol. 76, 3920-3927.4. Ferre-D’Amare, A. R., Zhou, K., and Doudna, J. A. (1998)Nature
395, 567-574.5. Wadkins, T. S., Perrotta, A. T., Ferre-D’Amare, A. R., Doudna,
J. A., and Been, M. D. (1999)RNA 5, 720-727.6. Shih, I. H., and Been, M. D. (2002)Annu. ReV. Biochem. 71, 887-
917.7. Ferre-D’Amare, A. R., and Doudna, J. A. (2000)J. Mol. Biol.
295, 541-556.8. Perrotta, A. T., Shih, I., and Been, M. D. (1999)Science 286,
123-126.9. Nakano, S., Chadalavada, D. M., and Bevilacqua, P. C. (2000)
Science 287, 1493-1497.10. Nakano, S., and Bevilacqua, P. C. (2001)J. Am. Chem. Soc. 123,
11333-11334.11. Shih, I., and Been, M. D. (2001)EMBO J. 20, 4884-4891.12. Oyelere, A. K., Kardon, J. R., and Strobel, S. A. (2002)
Biochemistry 41, 3667-3675.13. Scheit, K. H. (1980)Nucleotide Analogues: Synthesis and
Biological Function, John Wiley & Sons, New York.14. Wang, C., Gao, H., Gaffney, B. L., and Jones, R. A. (1991)J.
Am. Chem. Soc. 113, 5486-5488.15. Legault, P., and Pardi, A. (1997)J. Am. Chem. Soc. 119, 6621-
6628.16. Ravindranathan, S., Butcher, S. E., and Feigon, J. (2000)Bio-
chemistry 39, 16026-16032.
17. Nishikawa, F., and Nishikawa, S. (2000)Nucleic Acids Res. 28,925-931.
18. Luptak, A., Ferre-D’Amare, A. R., Zhou, K., Zilm, K. W., andDoudna, J. A. (2001)J. Am. Chem. Soc. 123, 8447-8452.
19. Deschenes, P., Lafontaine, D. A., Charland, S., and Perreault, J.P. (2000)Antisense Nucleic Acid Drug DeV. 10, 53-61.
20. Pereira, M. J., Harris, D. A., Rueda, D., and Walter, N. G. (2002)Biochemistry 41, 730-740.
21. Harris, D. A., Rueda, D., and Walter, N. G. (2002)Biochemistry41, 12051-12061.
22. Tanaka, Y., Tagaya, M., Hori, T., Sakamoto, T., Kurihara, Y.,Katahira, M., and Uesugi, S. (2002)Genes Cells 7, 567-579.
23. Harris, D. A., and Walter, N. G. (2003)Curr. Protocols NucleicAcid Chem. 6.8, Wiley, New York, in press.
24. Walter, N. G., Yang, N., and Burke, J. M. (2000)J. Mol. Biol.298, 539-555.
25. Hargittai, M. R., and Musier-Forsyth, K. (2000)RNA 6, 1672-1680.
26. Hargittai, M. R., Mangla, A. T., Gorelick, R. J., and Musier-Forsyth, K. (2001)J. Mol. Biol. 312, 985-997.
27. Sigel, R. K., Vaidya, A., and Pyle, A. M. (2000)Nat. Struct. Biol.7, 1111-1116.
28. Saito, H., and Suga, H. (2002)Nucleic Acids Res. 30, 5151-5159.29. Feig, A. L., Scott, W. G., and Uhlenbeck, O. C. (1998)Science
279, 81-84.30. Walter, N. G. (2001)Methods 25, 19-30.31. Walter, N. G., and Burke, J. M. (2000)Methods Enzymol. 317,
409-440.32. Lafontaine, D. A., Ananvoranich, S., and Perreault, J. P. (1999)
Nucleic Acids Res. 27, 3236-3243.33. Walter, N. G., Burke, J. M., and Millar, D. P. (1999)Nat. Struct.
Biol. 6, 544-549.34. Ramirez-Carrozzi, V. R., and Kerppola, T. K. (2001)Methods
25, 31-43.35. Sharp, K. A., and Honig, B. (1990)Annu. ReV. Biophys. Biophys.
Chem. 19, 301-332.36. Misra, V. K., and Draper, D. E. (2000)J. Mol. Biol. 299, 813-
825.37. Nicholls, A., Sharp, K. A., and Honig, B. (1991)Proteins 11, 281-
296.38. Pyle, A. M. (2002)J. Biol. Inorg. Chem. 7, 679-690.39. Horrocks, W. D., Jr. (1993)Methods Enzymol. 226, 495-538.40. Frey, M. W., Frey, S. T., Horrocks, W. D., Jr., Kaboord, B. F.,
and Benkovic, S. J. (1996)Chem. Biol. 3, 393-403.41. Dickeson, S. K., Bhattacharyya-Pakrasi, M., Mathis, N. L.,
Schlesinger, P. H., and Santoro, S. A. (1998)Biochemistry 37,11280-11288.
42. Feig, A. L., Panek, M., Horrocks, W. D., Jr., and Uhlenbeck, O.C. (1999)Chem. Biol. 6, 801-810.
43. Murray, J. B., Seyhan, A. A., Walter, N. G., Burke, J. M., andScott, W. G. (1998)Chem. Biol. 5, 587-595.
44. Wadkins, T. S., Shih, I., Perrotta, A. T., and Been, M. D. (2001)J. Mol. Biol. 305, 1045-1055.
45. Ciesiolka, J., Marciniec, T., and Krzyzosiak, W. (1989)Eur. J.Biochem. 182, 445-450.
46. Perrotta, A. T., and Been, M. D. (1990)Nucleic Acids Res. 18,6821-6827.
47. Perrotta, A. T., and Been, M. D. (1992)Biochemistry 31, 16-21.48. Hardin, C. C., Perry, A. G., and White, K. (2000)Biopolymers
56, 147-194.49. Orr, J. W., Hagerman, P. J., and Williamson, J. R. (1998)J. Mol.
Biol. 275, 453-464.50. Fersht, A. (1999)Structure and Mechanism in Protein Science,
Freeman, New York.51. Brenowitz, M., Chance, M. R., Dhavan, G., and Takamoto, K.
(2002)Curr. Opin. Struct. Biol. 12, 648-653.52. Tanner, N. K., Schaff, S., Thill, G., Petit-Koskas, E., Crain-
Denoyelle, A. M., and Westhof, E. (1994)Curr. Biol. 4, 488-498.
BI034627G
7740 Biochemistry, Vol. 42, No. 25, 2003 Jeong et al.