trends in business continuity program maturity -cheyene haase bc management, inc
TRANSCRIPT
Trends in Business Continuity Program Maturity
-Cheyene HaaseBC Management, Inc.

Topics of Presentation
• Progression to Today’s BCM Planning• Awareness Trends• What Distinguishes “Very Mature”• Present Findings for “Very Mature” and “Very
Immature” Programs• Stay Ahead of the Game?

Progression – Today’s BCM
Technology Focus1970’s – 1998– “Disaster Recovery”– Data Processing/ Data
Center Focus– Isolated– Lacking Controls/
Standards
Enterprise Focus1998 – Current– “Enterprise Contingency/
Resilience Planning”– Risk Management/
Enterprise Focus– Integrated– Increasing
Controls/Standards

Awareness Trends
Reporting Structure• - Placement of Program• - Increased Visibility• - Executive Support
Awareness Trends
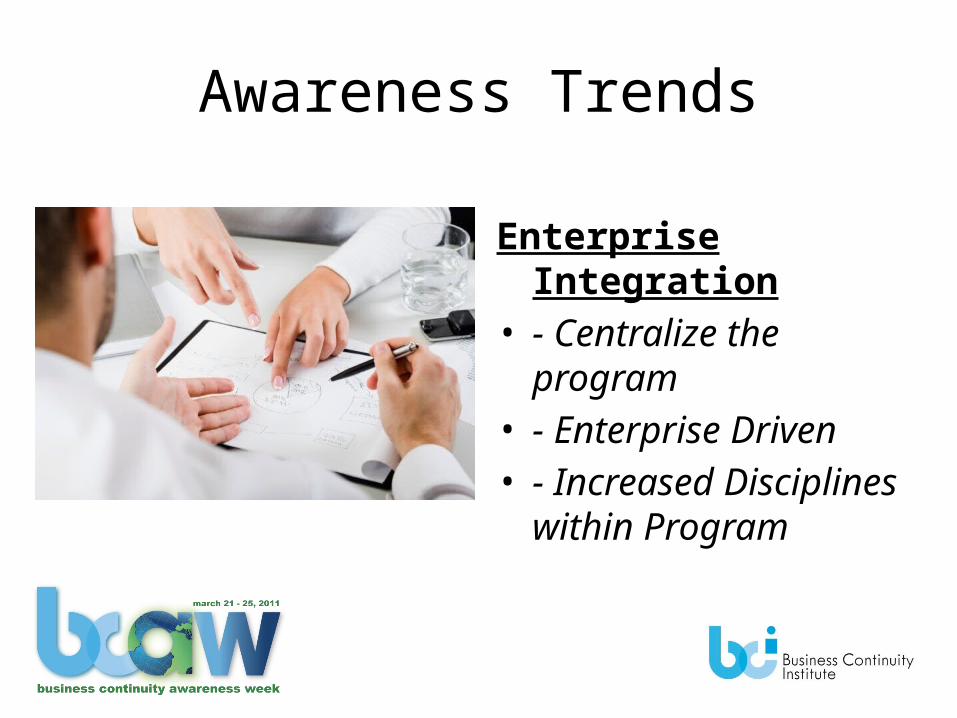
Enterprise Integration• - Centralize the program• - Enterprise Driven• - Increased Disciplines
within Program

Awareness Trends
Assessment and Audit• - Frequency• - Comprehensive• - Leverage Outcome
Awareness Trends
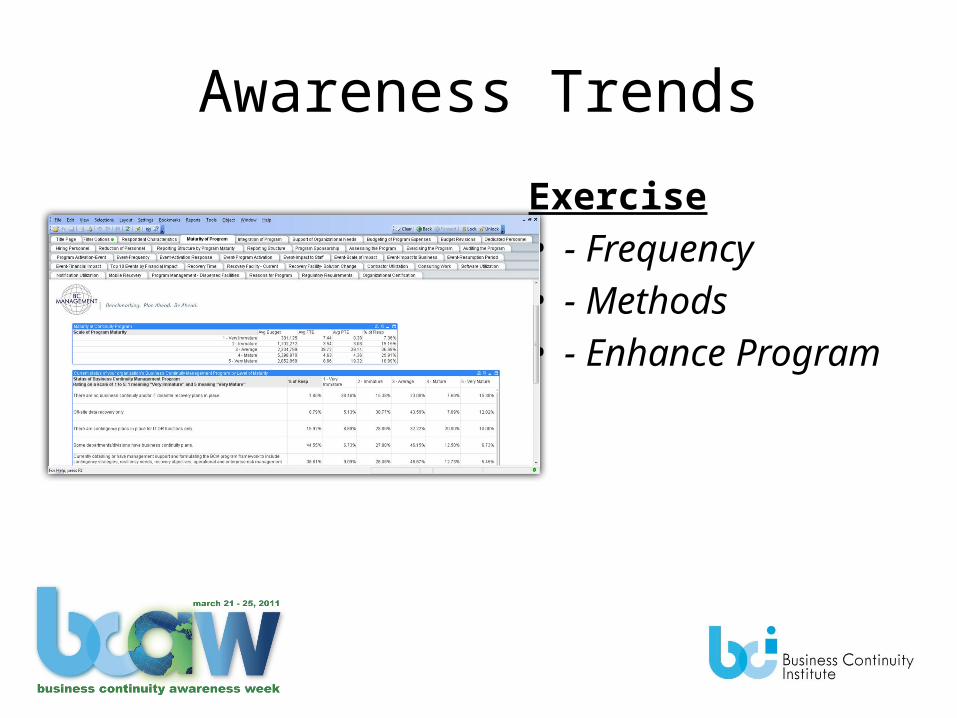
Exercise• - Frequency• - Methods• - Enhance Program

Awareness Trends
Certify• - Controls• - Standardization• - Measurement

Mature Programs -Distinguishing Factors
• Multiple Disciplines• Highly Integrated• Enterprise Focused• Executive Driven• Corporate Culture• Frequent Assessments/
Audits/Exercises• Organizational
Certification
Behind the Numbers
• 3,223 study participants from 73 countries• Study is composed of 2 sections – Compensation & Program Management• Compensation: 2,907 complete studies from 57 countries.• Program Management: 912 complete studies from 39 countries.

Data Findings
0%20%40%60%80%
100%120%140%160%180%200%
Very Immature
Immature Average Mature Very Mature
Do IT/ Disaster Recovery & Business Continuity Strategies Adequately Support the Needs of Your Organization?
BC Strategies No
BC Strategies Yes
DR Strategies No
DR Strategies Yes
Data Findings
0%
10%
20%
30%
40%
50%
60%
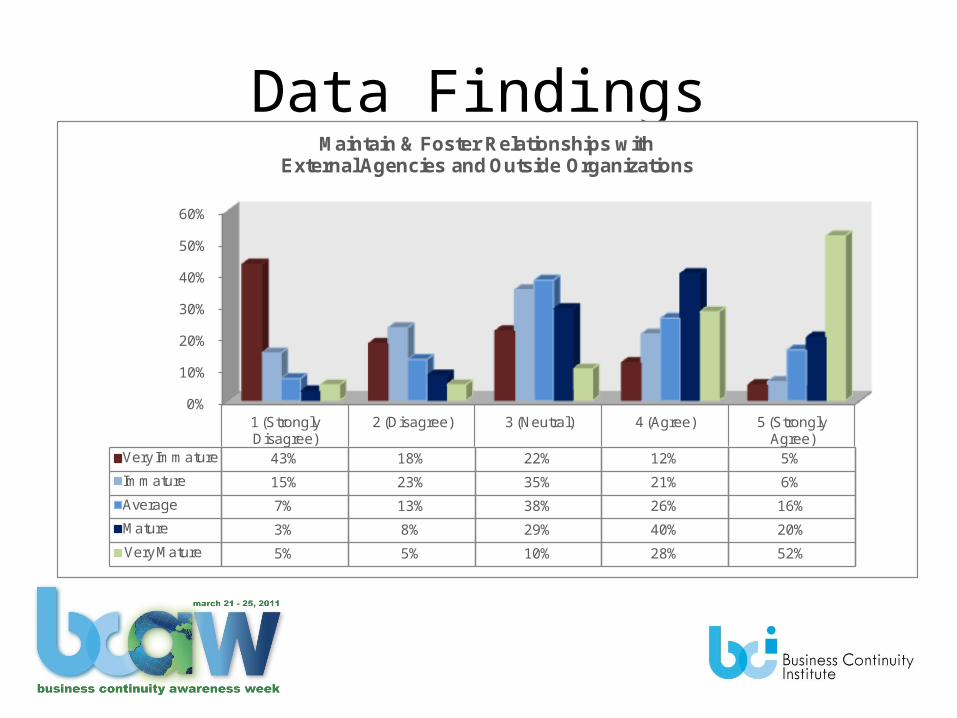
1 (Strongly Disagree)
2 (Disagree) 3 (Neutral) 4 (Agree) 5 (Strongly Agree)
Very Immature 43% 18% 22% 12% 5%
Immature 15% 23% 35% 21% 6%
Average 7% 13% 38% 26% 16%
Mature 3% 8% 29% 40% 20%
Very Mature 5% 5% 10% 28% 52%
Maintain & Foster Relationships with External Agencies and Outside Organizations
Data Findings
0%
10%
20%
30%
40%
50%
60%
70%
Very Immature
Immature Average Mature Very Mature
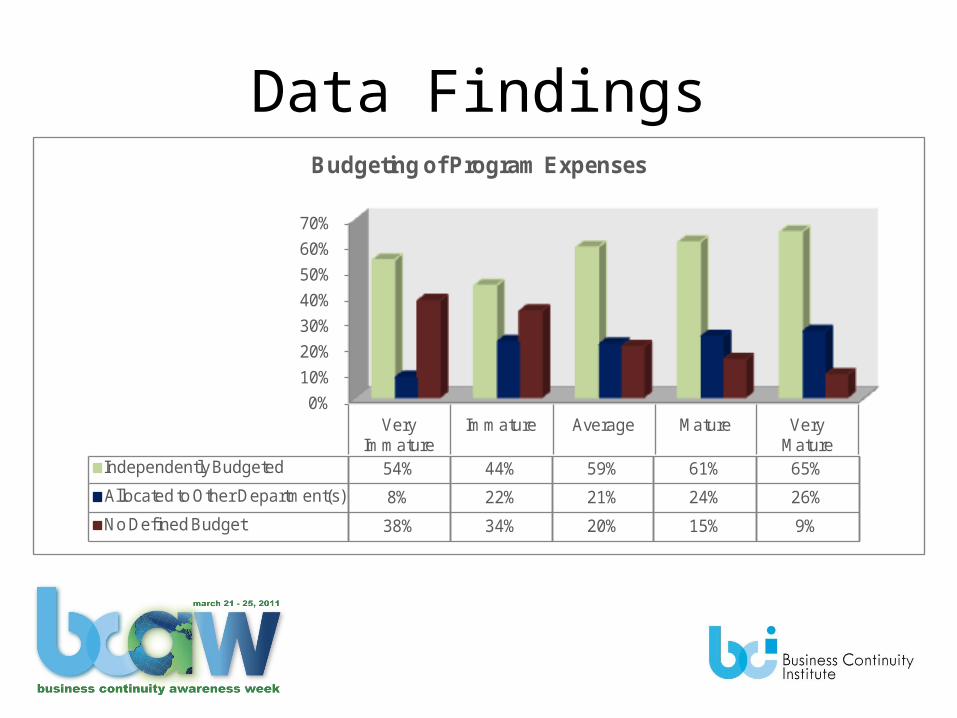
Independently Budgeted 54% 44% 59% 61% 65%
Allocated to Other Department(s) 8% 22% 21% 24% 26%
No Defined Budget 38% 34% 20% 15% 9%
Budgeting of Program Expenses
Data Findings
0%
10%
20%
30%
40%
50%
60%
70%
Every Six Months
Annually Every Other Year
Every Three Years
Less Often than
Three Years
Never Every Six Months
Annually Every Other Year
Every Three Years
Less Often than
Three Years
Never
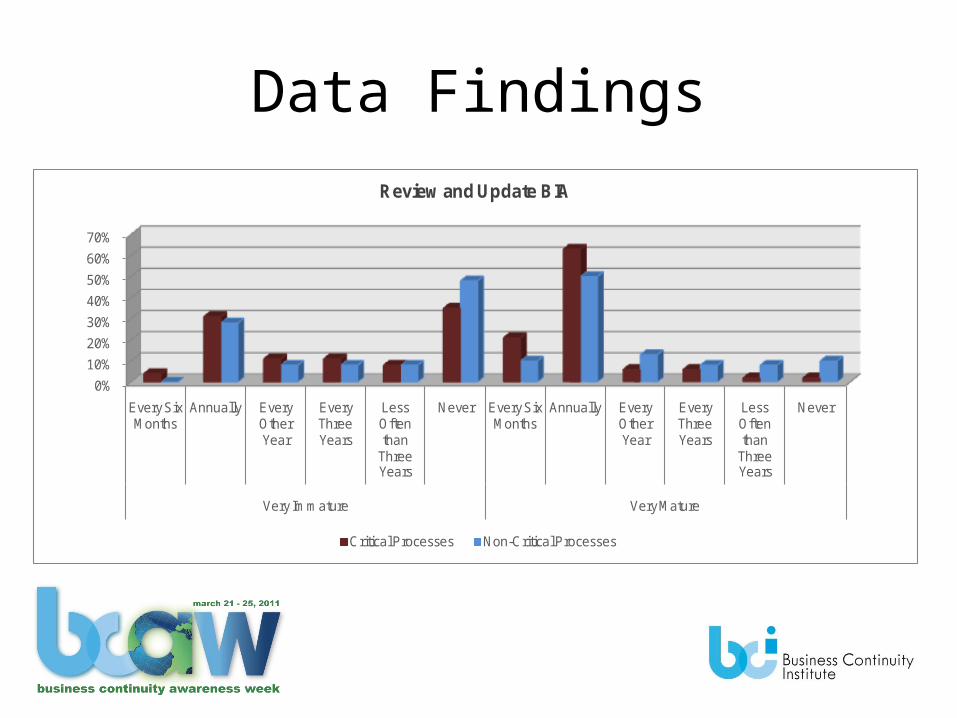
Very Immature Very Mature
Review and Update BIA
Critical Processes Non-Critical Processes
Data Findings
0%5%
10%15%20%25%30%35%40%45%
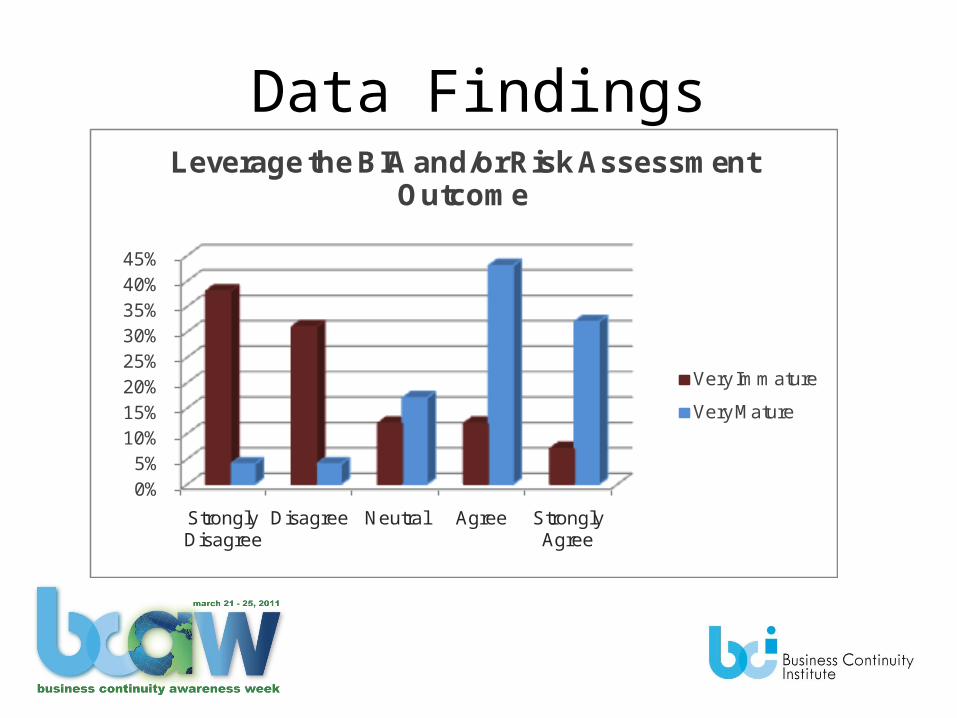
Strongly Disagree
Disagree Neutral Agree Strongly Agree
Leverage the BIA and/or Risk Assessment Outcome
Very Immature
Very Mature

Data Findings
0%10%20%30%40%50%60%70%80%
Dai
ly
Wee
kly
Mon
thly
Qua
rterly
Twic
e a
Year
Annu
ally
Ever
y O
ther
Yea
r
Less
Tha
n Ev
ery
Oth
er Y
ear Nev
er
Dai
ly
Wee
kly
Mon
thly
Qua
rterly
Twic
e a
Year
Annu
ally
Ever
y O
ther
Yea
r
Less
Tha
n Ev
ery
Oth
er Y
ear Nev
er
Very Immature Very Mature
How Often Do You Exercise Your Plans?
Mission Critical IT Less Critical IT Mission Critical Business Less Critical Business
Data Findings
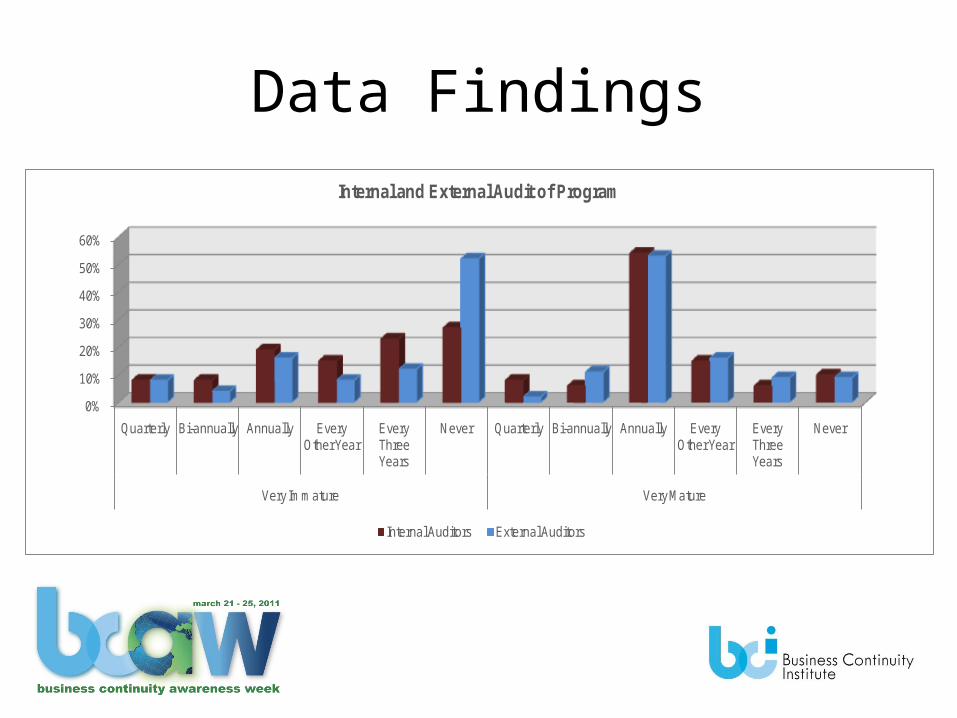
0%
10%
20%
30%
40%
50%
60%
Quarterly Bi-annually Annually Every Other Year
Every Three Years
Never Quarterly Bi-annually Annually Every Other Year
Every Three Years
Never
Very Immature Very Mature
Internal and External Audit of Program
Internal Auditors External Auditors
Data Findings
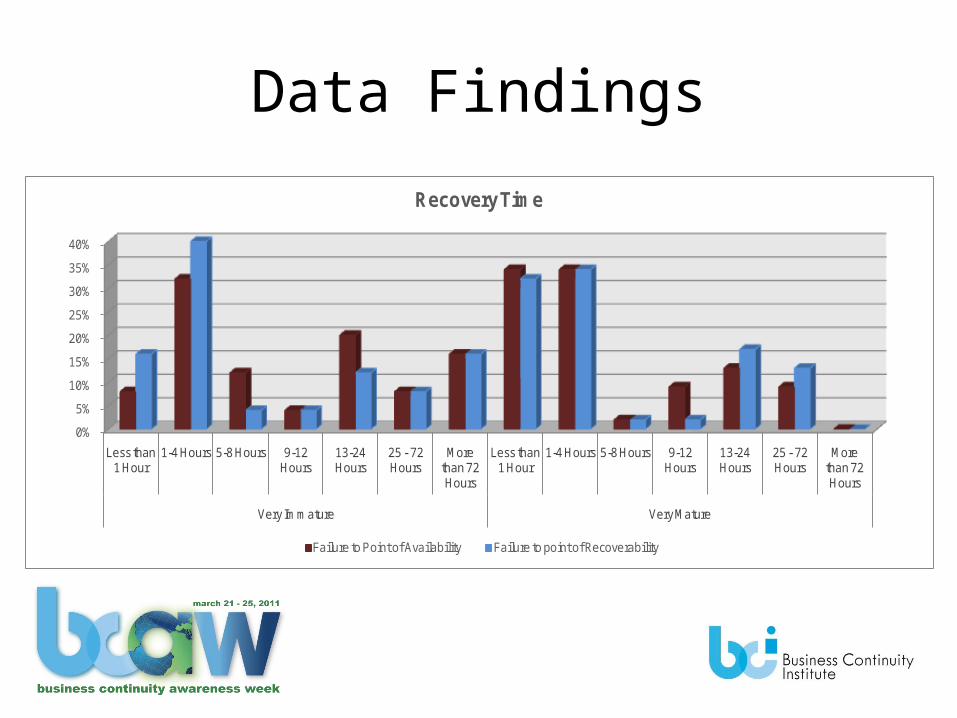
0%
5%
10%
15%
20%
25%
30%
35%
40%
Less than 1 Hour
1-4 Hours 5-8 Hours 9-12 Hours
13-24 Hours
25 - 72 Hours
More than 72 Hours
Less than 1 Hour
1-4 Hours 5-8 Hours 9-12 Hours
13-24 Hours
25 - 72 Hours
More than 72 Hours
Very Immature Very Mature
Recovery Time
Failure to Point of Availability Failure to point of Recoverability

Data Findings
0%10%20%30%40%50%60%70%
Software Notification Alerts
Mobile Recovery
Consulting Software Notification Alerts
Mobile Recovery
Consulting
Currently Use Considering for 2009
Vendor Utilization
Very Immature Very Mature

Data Findings
0%
5%
10%
15%
20%
25%
30%
Very Immature
Immature Average Mature Very Mature
Yes , Certified - Indicated by Maturity Rating
Is Your Organization Certified in a Standard?

Present Data Findings in Dashboard
Data Findings for:– Integration– Reporting Structure– Program Sponsor

Integration

Integration
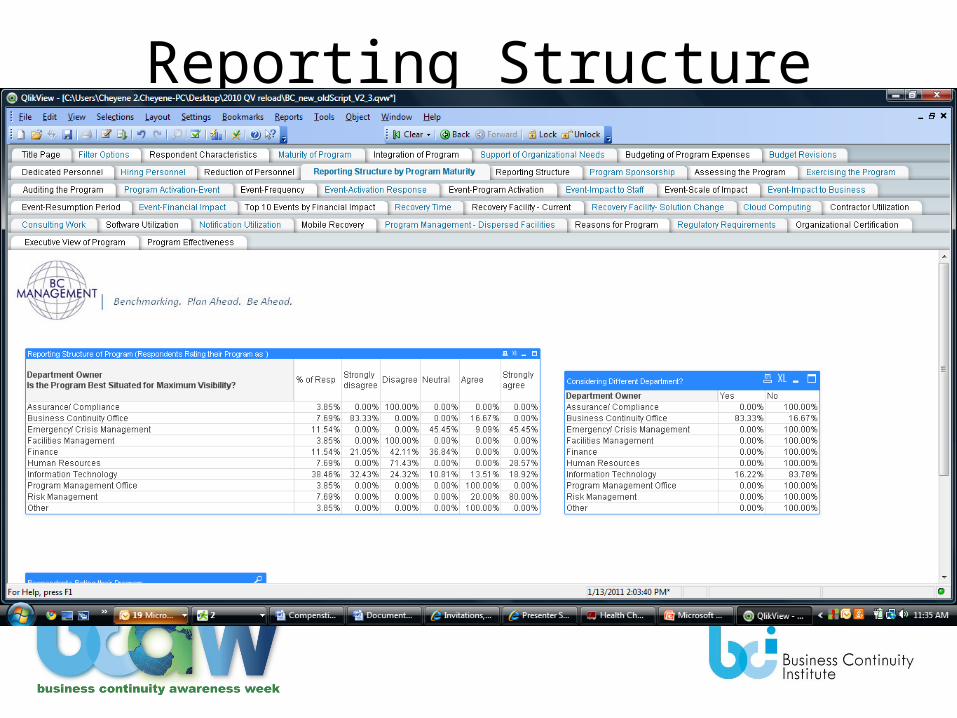
Reporting Structure
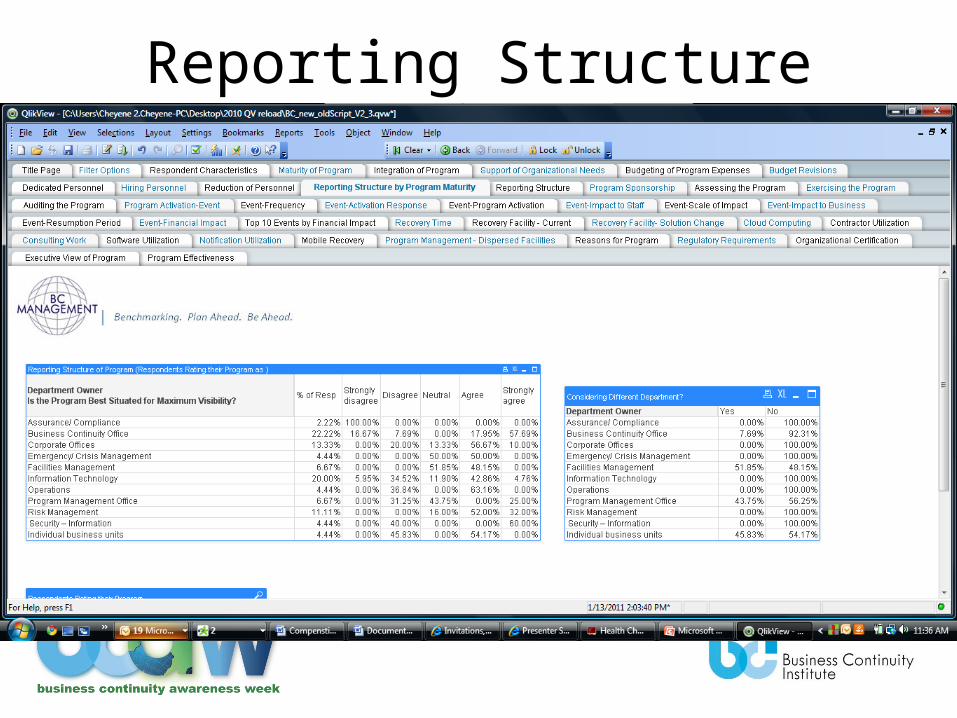
Reporting Structure
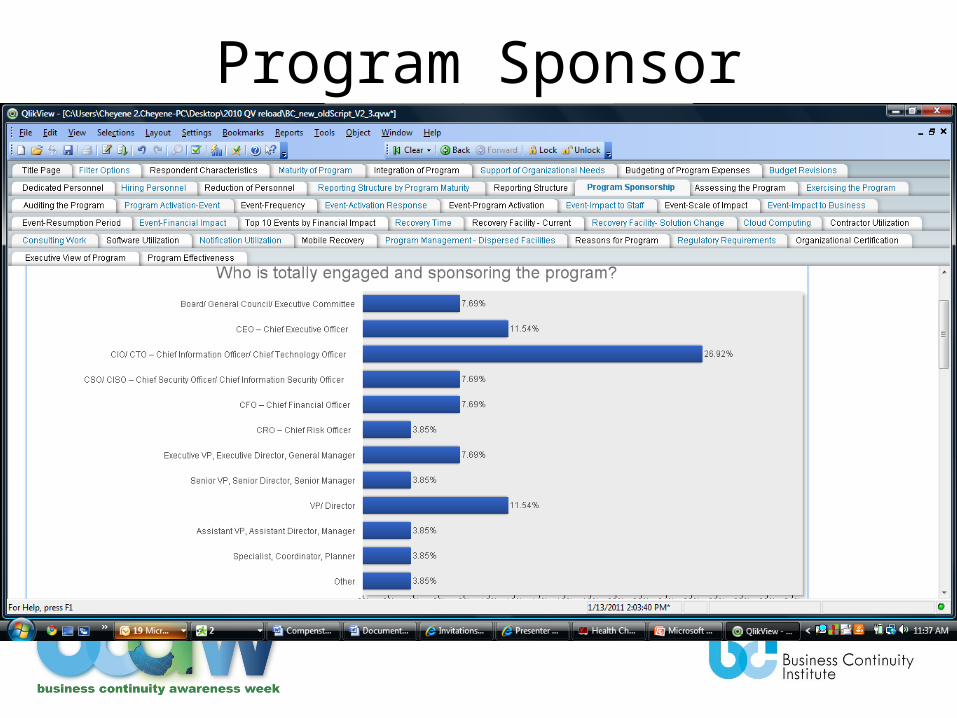
Program Sponsor

Program Sponsor

Stay Ahead of the Game• What Makes Sense for
Your Organization?• Be Strategic!• What will get their
focus?• Remember – Enterprise,
Highly Integrated, Executive Driven and Highly Visible.

Complimentary Reports
Available at www.bcmanagement.com
Click on Research DataSelect “Complimentary Reports”
