tri-state area school study council university of pittsburgh · tri-state area school study council...
TRANSCRIPT

Tri-State Area School Study CouncilUniversity of Pittsburgh
Leading Public Education in Complex Times
March 10, 2017
Sean Crampsie, Lobbyist / Social Media Outreach Manager, PSBAMark DiRocco, Executive Director, PASA

The New Political Realityin Harrisburg and Washington, D.C.

Federal Government
◦House: 238 Republicans, 193 Democrats, 4 Vacancies
◦Senate: 52 Republicans, 46 Democrats, 2 Independents
◦President: Republican
◦ New Presidential Party, new cabinet, and new promises
Washington, D.C.
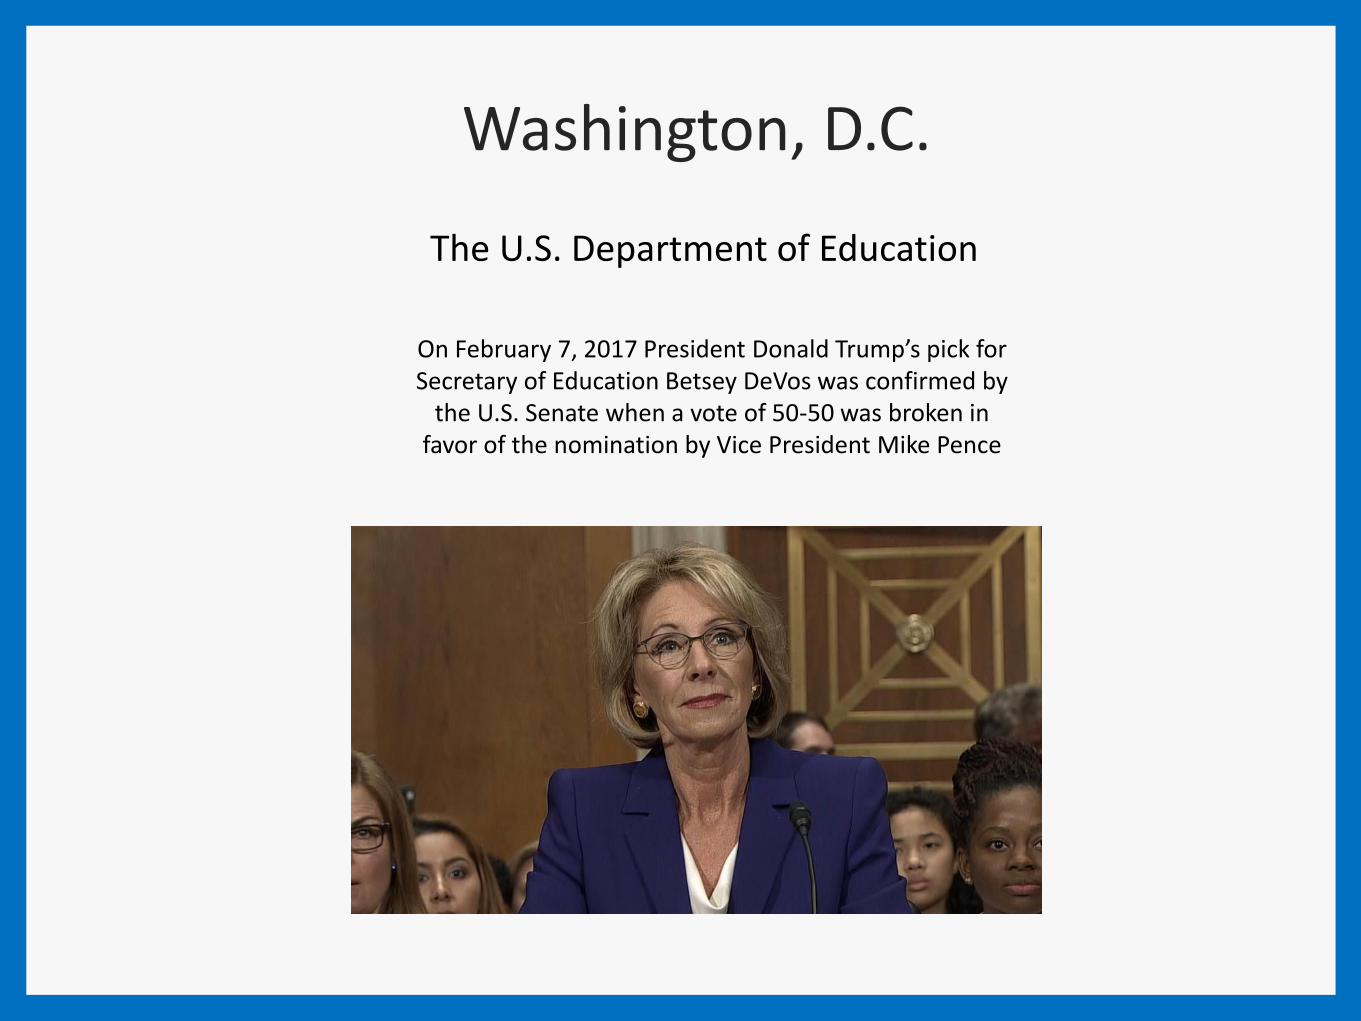
Washington, D.C.
The U.S. Department of Education
On February 7, 2017 President Donald Trump’s pick for Secretary of Education Betsey DeVos was confirmed by
the U.S. Senate when a vote of 50-50 was broken in favor of the nomination by Vice President Mike Pence

Republicans Now Control 32 State Legislatures

33 States have Republican Governors
Pennsylvania is a Republican target in 2018

Governor: Democrat
2018 Governor’s Race –
Incumbent Tom Wolf
Pennsylvania
The Field –
Announced – Senator Scott Wagner (R)
Rumored – Congressman Mike Kelly (R)
Senator Jake Corman (R)
Former Lt. Gov. Jim Cawley (R)
Speaker of the House Rep. Mike Turzai (R)
House Leader Rep. Dave Reed (R)
VS

Prior to 2016 Election –
31 Republicans
19 Democrats________________________________________
Post 2016 Election –
34 Republicans (Veto Proof Majority)
16 Democrats
• Republicans were able to flip Democratic held seats in Harrisburg area, Bedford/Cambria/Clearfield, and Erie County (Trump effect?)
• 25 Senators up for election in 2018 (7 Democrats and 18 Republicans)
The Pennsylvania Senate

The Pennsylvania Senate
Opened 2017-18 Session with –
• Paycheck Protection (SB 166 -Y:28 / N:22)
• Sanctuary Cities (SB 10 – Y:37 / N:12)
• Abortion Legislation (SB 3 – Y:32 / N:18)
• Statute of Limitations (SB 261 – Y:48 / N:0)
• Moved bills out of Senate Education dealing with Superintendent Contracts (SB 227) and Mandated Sick and Bereavement Leave (SB 229)
Waiting on –
• SB 76 Property Tax Elimination Legislation
• Pension Reform Legislation

The Pennsylvania Senate
Education Bills Currently in Senate Education –
• Active shooter Drills Bill (SB 35)• Student Religious Freedom Act (SB 68)• Grant Program for School-Based Child-Care
(SB 80)• Home schooling access to district resources
(SB 93)• Blood donation education (SB 152)• School Code Cleanup bill (SB 195)• Charter bills (SB 198, SB 199)• Student Immunizations (SB 217)• Economic Furloughs (SB 228)• Kindergarten Bill (SB 295)• ESSA (SB 363)• Financial Literacy (SB 364)• Legal Advertising (SB 374)

Prior to 2016 Election –
119 Republicans
84 Democrats_______________________________________
Post 2016 Election –
121 Republicans
81 Democrats (one seat open March 21 Special)
• Republicans were able to gain two seats, a Philadelphia Democratic seat is currently vacant
The Pennsylvania House

The Pennsylvania House
Opened 2017-18 Session with –
• School Safety Drills (HB 178) is in position for final vote week of March 13
• Graduation Requirement for CTE students (HB 202) is in position for final vote week of March 13
• Lots of committee action and setting bills up to run when the House returns Monday March 13
Waiting on –
• Property Tax Elimination Legislation from the House side
• Pension Reform Legislation from the House side
• Charter reform legislation
• Budget appropriations bill
• School code bill

The Pennsylvania House
Education Bills Currently in House Education –
• Distressed schools (HB 19)• Kindergarten (HB 24)• Busing issues (HB 49)• Parent program (HB 67)• Keystone Exams (HB 89)• Financial Literacy (HB 106)• Union Leave (HB 164)• Cyber Education (HB 184)• PSBA out of PSERS (HB 205)• 9/11 Curriculum (HB 207)• Mandate Relief (HB 208)• Students Transfers (HB 213)• Bus driver epi-pens (HB 224)• EITC & OSTC (HB 237 and HB 250)• Student religious freedoms (HB 255)• Truancy (HB 327)• Charter Funding (HB 328)• Transportation (HB 349)• Fund Balances (HB 351)• Substitute Teacher Shortage (HB 361)• Residency (HB 362)
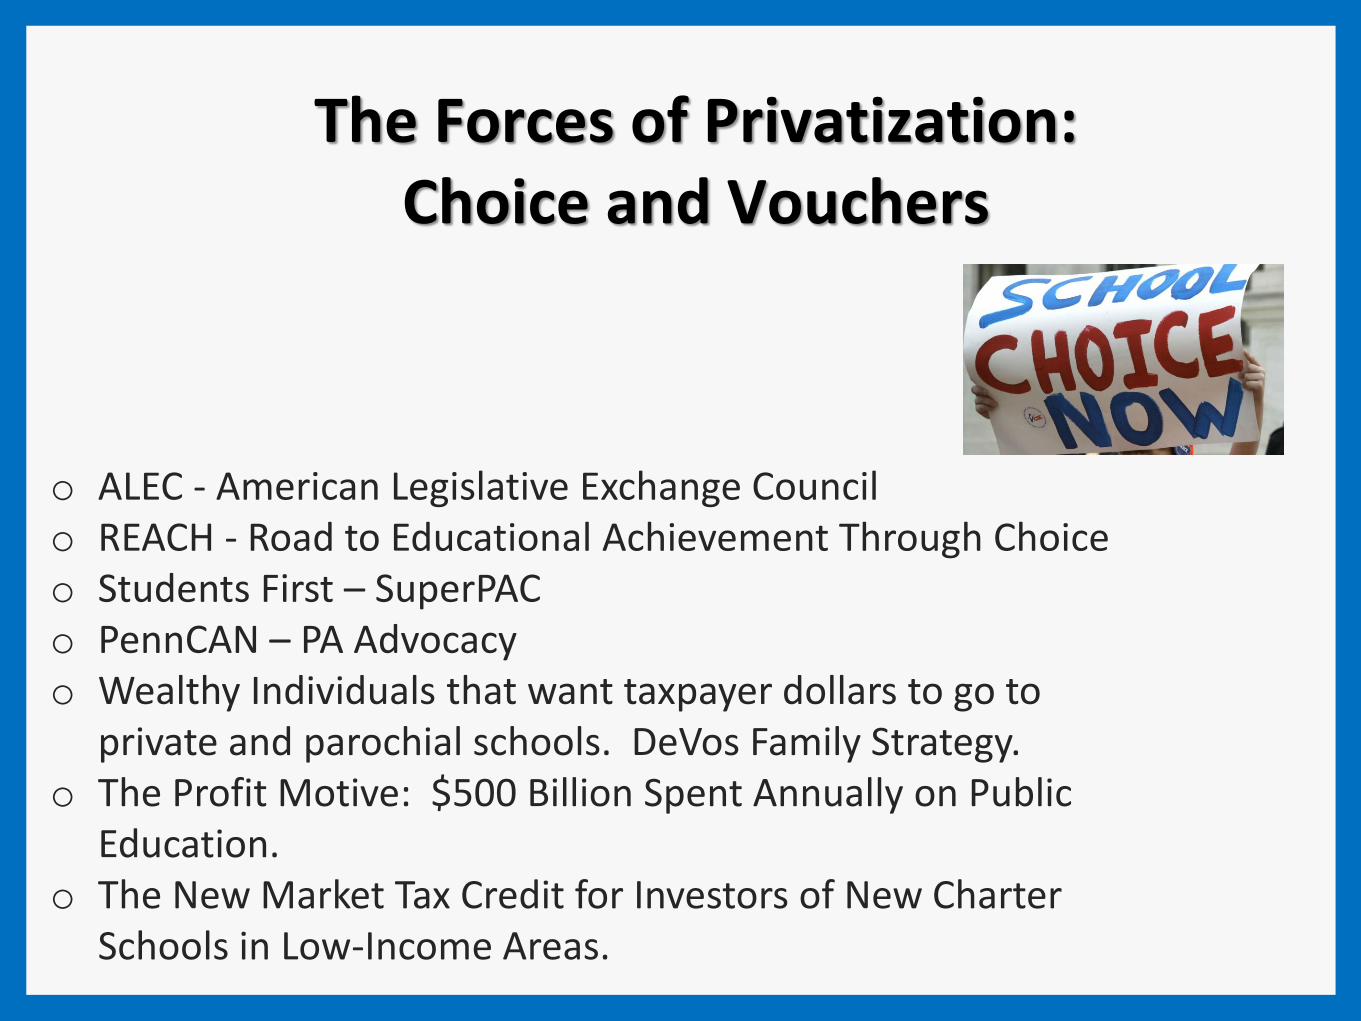
The Forces of Privatization:Choice and Vouchers
o ALEC - American Legislative Exchange Councilo REACH - Road to Educational Achievement Through Choiceo Students First – SuperPACo PennCAN – PA Advocacyo Wealthy Individuals that want taxpayer dollars to go to
private and parochial schools. DeVos Family Strategy.o The Profit Motive: $500 Billion Spent Annually on Public
Education.o The New Market Tax Credit for Investors of New Charter
Schools in Low-Income Areas.

ALEC - American Legislative Exchange Council Model Legislation

Big money funding the “movement”
• Vahan Gureghian (CEO CSMI Charter Management) –
- $336,000 to Governor Tom Corbett in 2014
• American Federation for Children –- As of 2015 donated $3.7 million to
candidates in PA• Students First PAC –
- From 2015-2017accounted for the third largest donor in PA giving over $6.6 million to candidates (gave $4.9 Million to Senator Anthony Williams (D) for his Philadelphia Mayoral campaign*
*Source – followthemoney.org and 2/2/15 Pennlive article entitled “Big for-profit schools, big donations: the influence of charter schools on Pennsylvania politics”

EITC and OSTC:The Backdoor Option of School Choice
EITC: Educational Improvement Tax Credit ◦ Tax credits to eligible businesses contributing to a Scholarship
Organization, an Educational Improvement Organization, and/or a Pre-Kindergarten Scholarship Organization.
OSTC: Opportunity Scholarship Tax Credit ◦ Provides tuition assistance in the form of scholarships to eligible
students residing within the boundaries of a low-achieving school to attend another public school outside of their district or nonpublic school.

1. What would school vouchers mean for your district?
2. What is the biggest legislative issue facing your district?

ESSA: National, State, and Local Update
◦ House of Representatives approved the Midnight Rule Relief Act to expedite the repeal of ESSA Regulations written by the Obama Administration through the Congressional Review Act. The Senate must also approve the legislation.
◦ Once blocked by the Congressional Review Act, executive branch agencies are prevented from issuing any similar regulations until another law is passed.
◦ States may have more flexibility, but less guidance, as they only have to meet what is written in the ESSA Statute absent regulations.

• Many aspects of Pennsylvania’s Assessment System, Accountability System, and Educator Evaluation System are in state statute.
• The PA ESSA Plan will need federal approval andchanges to the PA School Code by the legislature.
20
ESSA and PA Statute

Assessments Accountability
Educator
Preparation
Educator
Evaluation
Four Major Components of ESSA

What PDE is Considering:
• Can we reduce the amount of time students spend on statewide PSSA testing (grades 3-8)?
• Is it feasible to test students at multiple times across the school year instead of only once?
• Can we eliminate double testing for middle school Algebra I students (would need to add adv. math test in high school for those students)

What PDE is Considering:
Future Ready PA Index to replace SPPA tool to measure school success
• Increased weight on growth in test scores versus point-in-time achievement
• Local options for additional assessments
• Career ready indicators and meaningful postsecondary student engagement
• More holistic measures of student success
• Measures of both inputs (i.e., course offerings) and outcomes (achievement scores)

What PDE is Considering:
• Tailored to local context and school based needs assessment.• Intervention for lowest performing schools to include BOTH academic
and holistic strategies.• Level of state intervention to be responsive to student progress over
time.
• What are the best strategies to ensure effective, diverse educators and school leaders for all students?
• What changes in teacher preparation do we need to consider to improve the readiness of new teachers?
• How to promote alternative pathways to teacher certification?

What ESSA requires:
State and school report cards w/data publicly available and easily accessible (Dashboard vs. Report Card).
• Student performance data by subgroup
• Student access to high rigor coursework (AP/IB, dual enrollment)
• Student access to high quality pre-k
• Educator qualifications
• Per-pupil expenditures of federal, state and local funds by district and school including personnel
costs
• School climate/OCR data

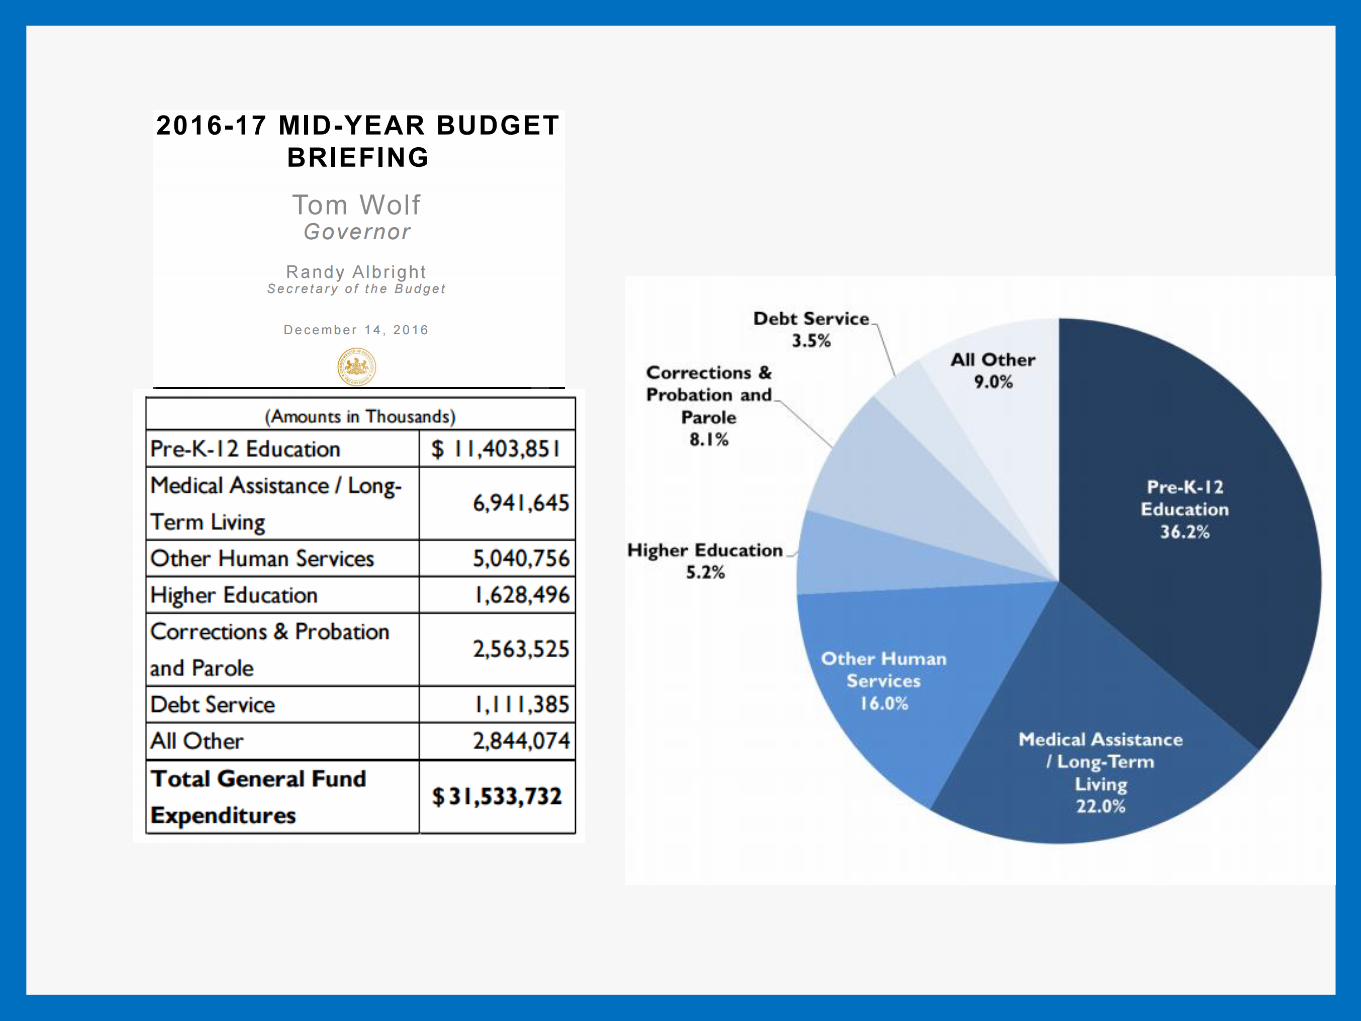
The Ongoing State Budget Crisis

Senate Budget Hearings
March 7 – 10:00 am Department of Education- Meeting focused on
CTE Education, Public School and Charter School accountability, State-Related University issues, Governor Wolf’s transportation funding change, Pre-K, PlanCon, Graduation Requirements
House Budget Hearings
March 6 – 10:00 am Department of Education- Meeting focused on
libraries, The State System of Higher Education, Pensions, Pre-K, Minimum Wage Increase. Graduation Requirements, Special Education Funding
PA Budget Hearing Schedule

Education Revenue Sources
State, 40.0%
Local, 60.0%
State/Local Shares: 1994-95
Difference - $2.3 billion
State, 38.7%
Local, 61.3%
State/Local Shares: 2014-15
Difference - $7.7 billion
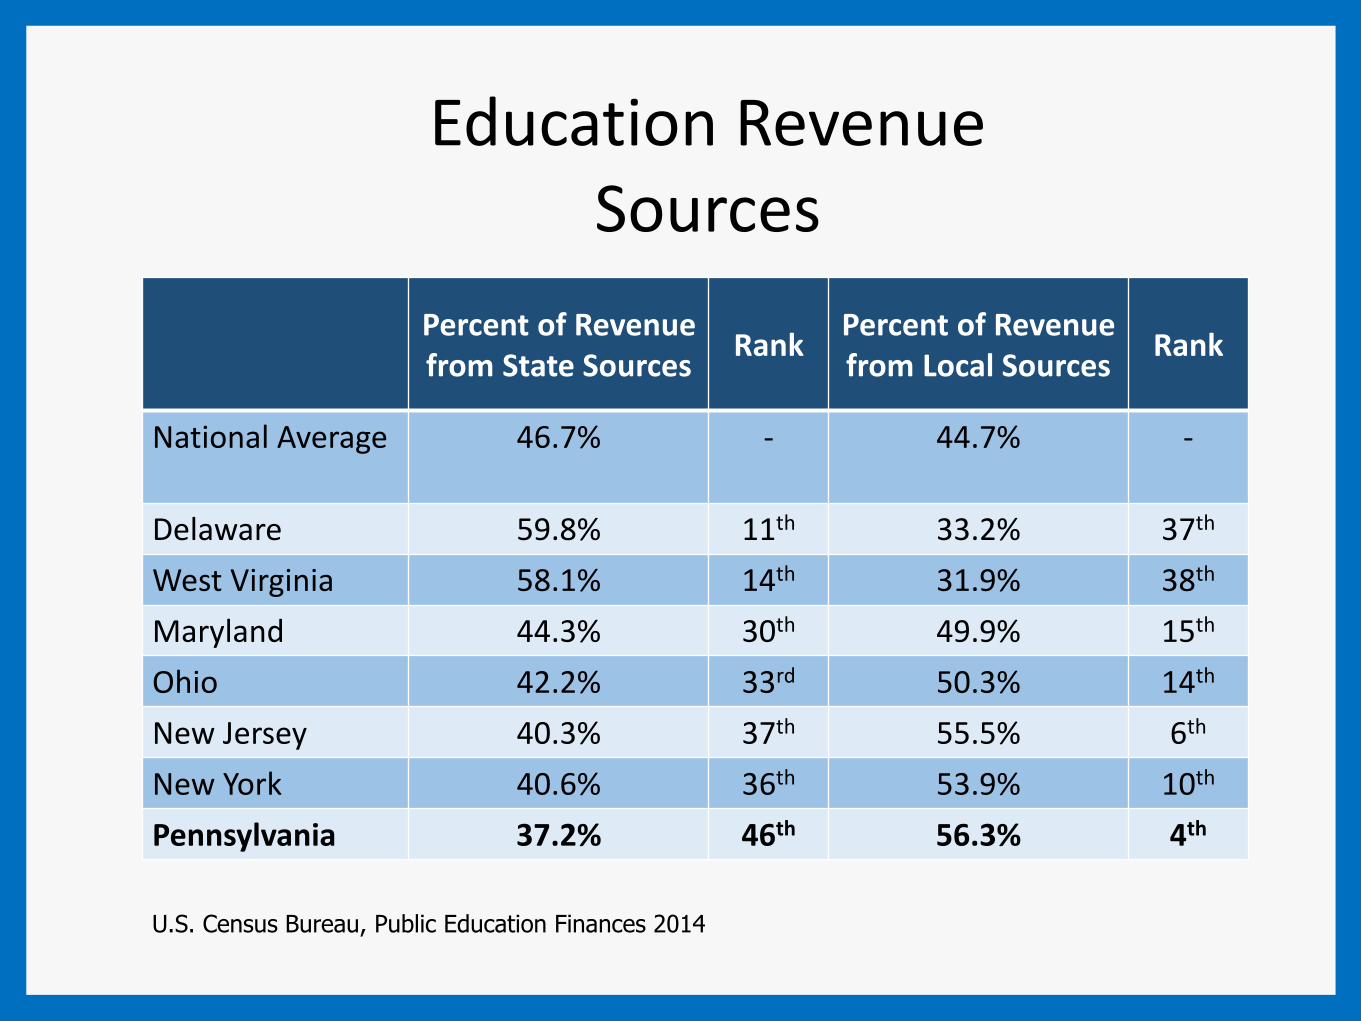
Education Revenue Sources
Percent of Revenue from State Sources
RankPercent of Revenue from Local Sources
Rank
National Average 46.7% - 44.7% -
Delaware 59.8% 11th 33.2% 37th
West Virginia 58.1% 14th 31.9% 38th
Maryland 44.3% 30th 49.9% 15th
Ohio 42.2% 33rd 50.3% 14th
New Jersey 40.3% 37th 55.5% 6th
New York 40.6% 36th 53.9% 10th
Pennsylvania 37.2% 46th 56.3% 4th
U.S. Census Bureau, Public Education Finances 2014


PROJECTED EMPLOYER CONTRIBUTION RATES AND TOTAL EMPLOYER CONTRIBUTIONS
*(Presumes a 7.25% rate of return)
Fiscal Year Ending June
Total Employer Contribution Rate %
Projected Total Employer Contribution (thousands) $
01/02 1.09
17/18 32.57 4,380,339
18/19 34.18 4,668,189
19/20 35.53 4,933,711
20/21 35.95 5,081,955
21/22 36.40 5,244,647

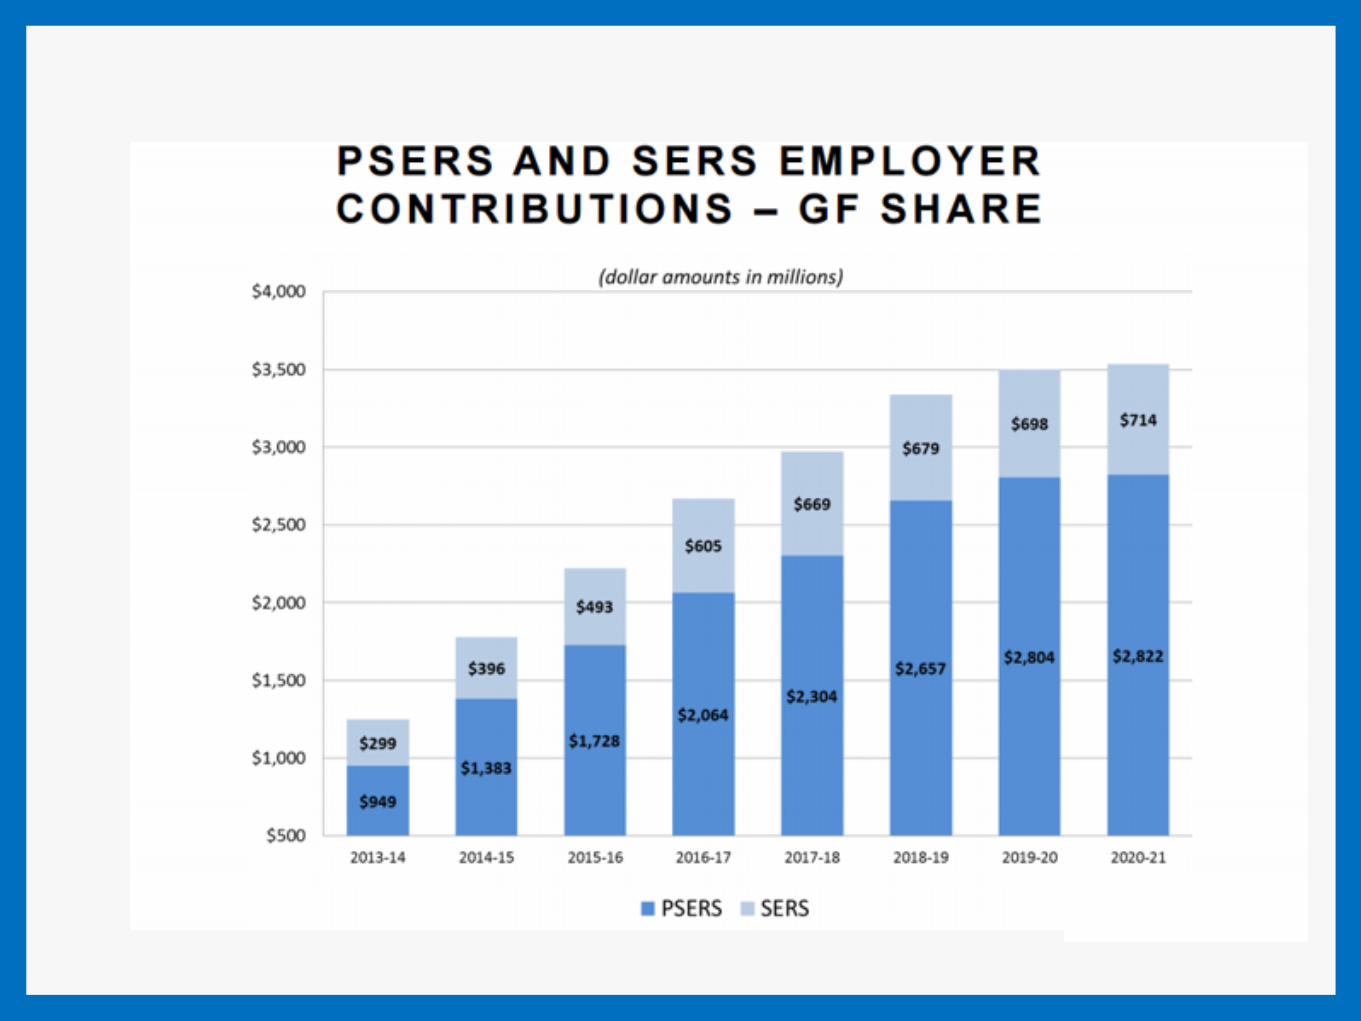
• Governor Wolf’s budget proposal• Additional $240 million in School Employees’
Retirement funding (an 11.6% increase).• Total of more than $2.3 billion
• Legislative update on pension reform efforts.• Any relief in sight?
*More info later in presentation
Pensions


Source January 2017Compared to
Estimate Year to Date
Compared to Estimate
General Fund $2.6 B -$49.8 M (1.8%) $16.1 B -$416.8 M (-2.5%)
PIT $1.3 B +$27.3 M $6.7 B -$98.6 M (-1.4%)
SUT $913.5 M -$5.1 M $5.9 B -$138.4 M (-2.3%)
Realty Transfer $37.7 M -$9.9 M $281.9 M -$44.6 M (-13.6%)
Corporation Tax $104.5 M -$60.4 M $1.4 B -$160.9 M (-10.5%)
Inheritance Tax $77.1 M +$1.7 M $530.1 M -$9.0 M (-1.7%)
All Other GF Tax $146.9 M +$5 M $1.1 B -$11.3 M (-1.1%)
Non-Tax Rev $73.4 M -$8.5 M $220.4 M +$45.9 (+26.3%)


5995079
3659537
2304000 20467001527602 1190876 1187718 1121815 960000 774429 755463 529500 499097 458680
MedicalAssistance -Capitation
StateCorrectionalInstitutions
County ChildWelfare
SpecialEducation
Mental HealthServices
SchoolEmployees'
Social Security
MedicalAssistance -
Fee-for-Service
Top 15 Line Items in the State Budget
The BEF line item is the largest in the budget and represents 18.5% of state
appropriations.

3.9
3.4
4.4
4.1
2.9
1.4
1.7 1.7
2.11.9
2.4 2.5
2006-07 2007-08 2008-09 2009-10 2010-11 2011-12 2012-13 2013-14 2014-15 2015-16 2016-17 2017-18
Act 1 Base Index % By FY

2018-19 2019-20 2020-21 2021-22
SAWW 3.2% 3.2% 3.2% 3.2%
ECI 2.8% 3.3% 3.3% 3.3%
Base Index 3.0% 3.3% 3.3% 3.3%
Indexes

2017-18 BEF and RTL
$100 Million in new dollars placed into the new BEF Formula ($452)
million total)BEF funding increases:
3% or higher--30 SDs
2% up to 3%--81 SDs
1% up to 2%--247 SDs
Up to 1%--142 SDs
No new dollars for Ready to Learn (remains at $250 million)
Ready to Learn remains a standalone grant in the governor’s budget
Governor Wolf’s budget proposal$100 million increase in BEF (a 1.7% increase).Total of nearly $6 billion.
Would mean $452 million in new money passed through new BEF Formula.
All districts would see an increase in BEF funding.Waiting for formula factors to be updated.
If $0 increase – some districts could see a reduction in BEF funding from last year.
Would not be less than 2013-14 BEF, but could be less than 2016-17.
Basic Education Funding
Spreadsheets and CaveatsSpreadsheets WILL change at final budget adoption, even if funded at proposed
levels
PDE has taken, quite literally, the term “most recently available data,” and will likely use updated ADMs, Current Expenditures and other data that is not
typically released until later in the spring
It appears that PDE has also used updated data in the 2016-17 BEF and SEF calculation. THIS WILL AFFECT THE AMOUNT OF BEF AND SEF YOU RECEIVE
THIS YEAR.
We do not believe this was the intention of how to implement these formulas and are raising those concerns.
UPDATE – On 3/7/17 Education Secretary Pedro Rivera informed the Senate Appropriations Committee that he is aware of this issue and will be calling on the leaders of the Basic Education Funding Commission to help address the problem. Senator Pat Browne recommended having the spreadsheets
locked by September
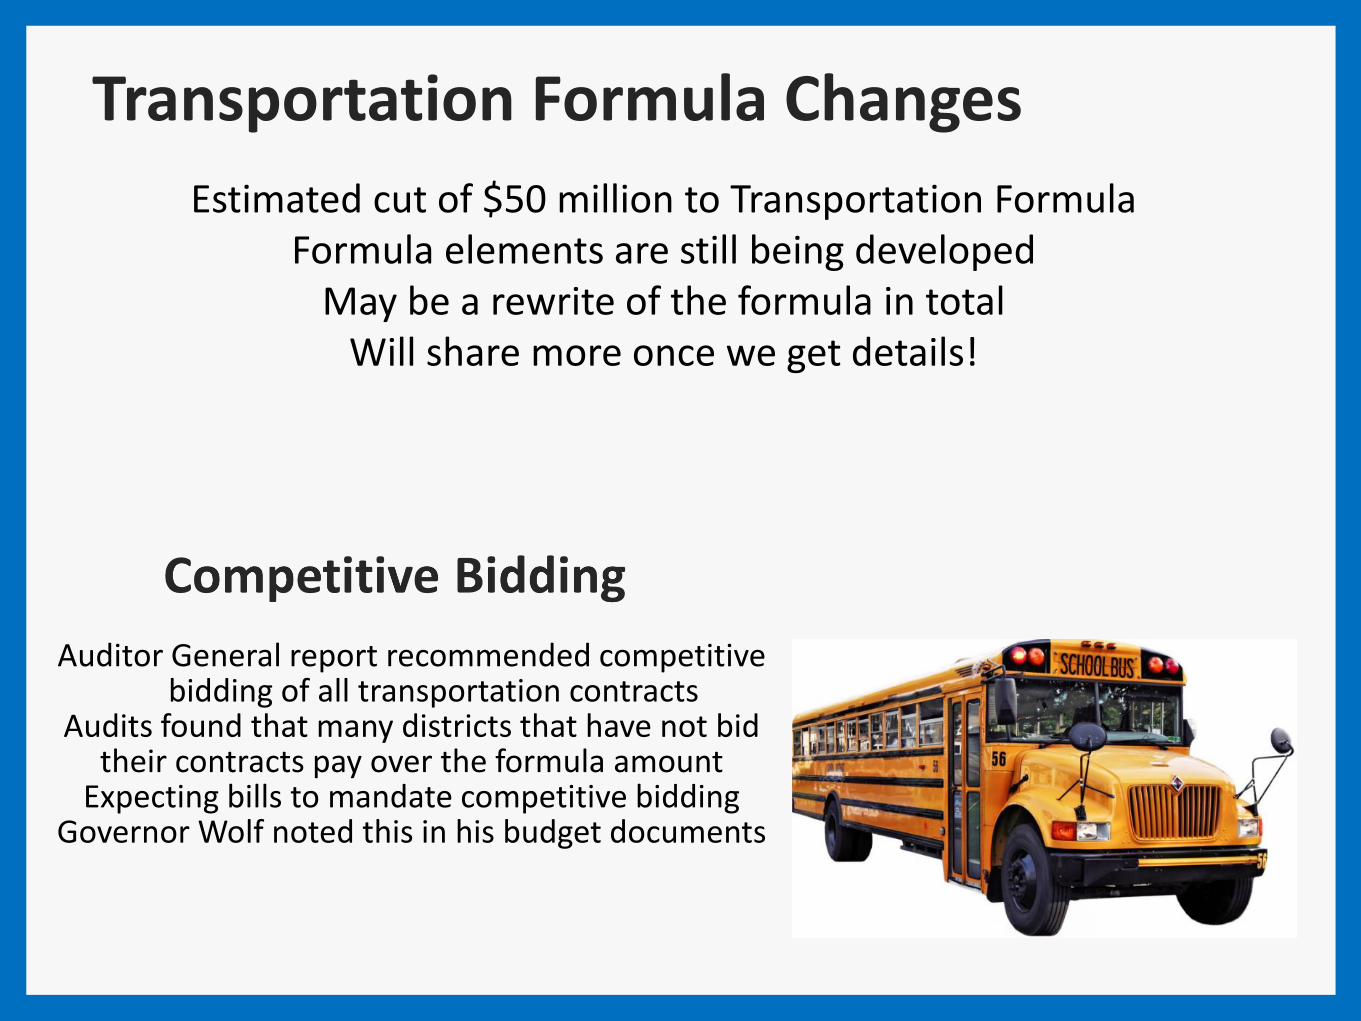
Transportation Formula Changes
Estimated cut of $50 million to Transportation FormulaFormula elements are still being developed
May be a rewrite of the formula in totalWill share more once we get details!
Auditor General report recommended competitive bidding of all transportation contracts
Audits found that many districts that have not bid their contracts pay over the formula amount
Expecting bills to mandate competitive biddingGovernor Wolf noted this in his budget documents

Special Education Funding
• $25 million increase proposed in 2017-18 (2%)• $90 million Distributed under the “new” special education funding
formula• The “new” special education funding formula:
o Recognizes that not every district has 16% special education population
o Directs additional resources to districts with higher cost special education students
• $11.7 million increase in early intervention

Special Education Funding
• Increasing costs have become a major cost drivero Special education expenditures have increased
44.6% since 2007-08o State special education funding has increased
8.6% since 2007-08

SEF Refresher
3 cost categories for special education students
Category 1: students costing <$25,000
Category 2: students costing $25,000-$49,999
Category 3: students costing $50,000 and upData is reported annually to PDE by school districts
through the Act 16 report (through PIMS)

SEF Refresher
Appropriate weights are applied to a district’s total number of students in each category:
Category 1 Weight: 1.51 (271,977 students)
Category 2 Weight: 3.77 (20,512 students)
Category 3 Weight: 7.46 (6,899 students)
SEF Refresher
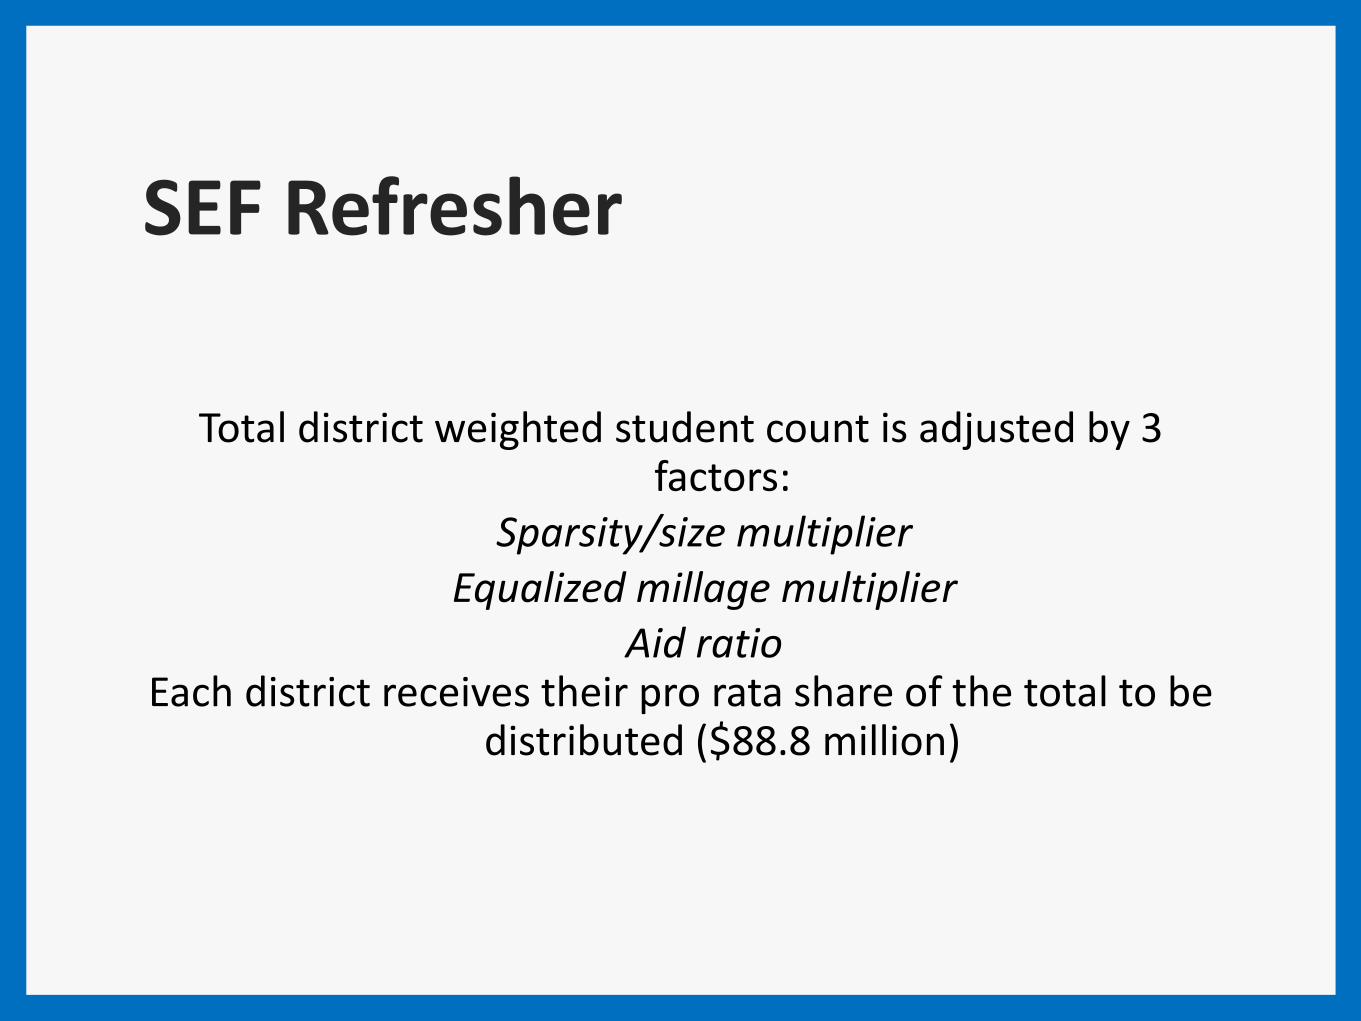
Total district weighted student count is adjusted by 3 factors:
Sparsity/size multiplier Equalized millage multiplier
Aid ratioEach district receives their pro rata share of the total to be
distributed ($88.8 million)

$1,027 $1,027 $1,027 $1,027 $1,027 $1,027
$1,047
$1,077
$1,097
$1,122
$960
$980
$1,000
$1,020
$1,040
$1,060
$1,080
$1,100
$1,120
$1,140
2008-09 2009-10 2010-11 2011-12 2012-13 2013-14 2014-15 2015-16 2016-17 2017-18
Mill
ion
s
State Special Education Funding
Up 6.8% in the last 5 years
Special Education

Special Education
$2,723$2,879 $3,085
$3,257 $3,320 $3,505$3,739
$3,936
$1,417 $1,436 $1,466 $1,453 $1,457 $1,462 $1,462 $1,504 $1,534 $1,567
$0
$500
$1,000
$1,500
$2,000
$2,500
$3,000
$3,500
$4,000
Mill
ion
s
IDEA & State Special Education Funding vs Special Education Expenditures
State Special Education Funding Federal IDEA Funding Special Education Expenditures

Other Issues
• PlanCon• Governor Wolf’s budget proposal includes $29.7 million in
PlanCon funding• PlanCon 2.0 in the works with the PlanCon commission
studying the issue
• Other decreases from Governor Wolf’s budget:• Adult and family literacy ($800,000) • Mobile science and math education programs (de-funded)• Educational access program (de-funded)• Job training and education programs (de-funded)
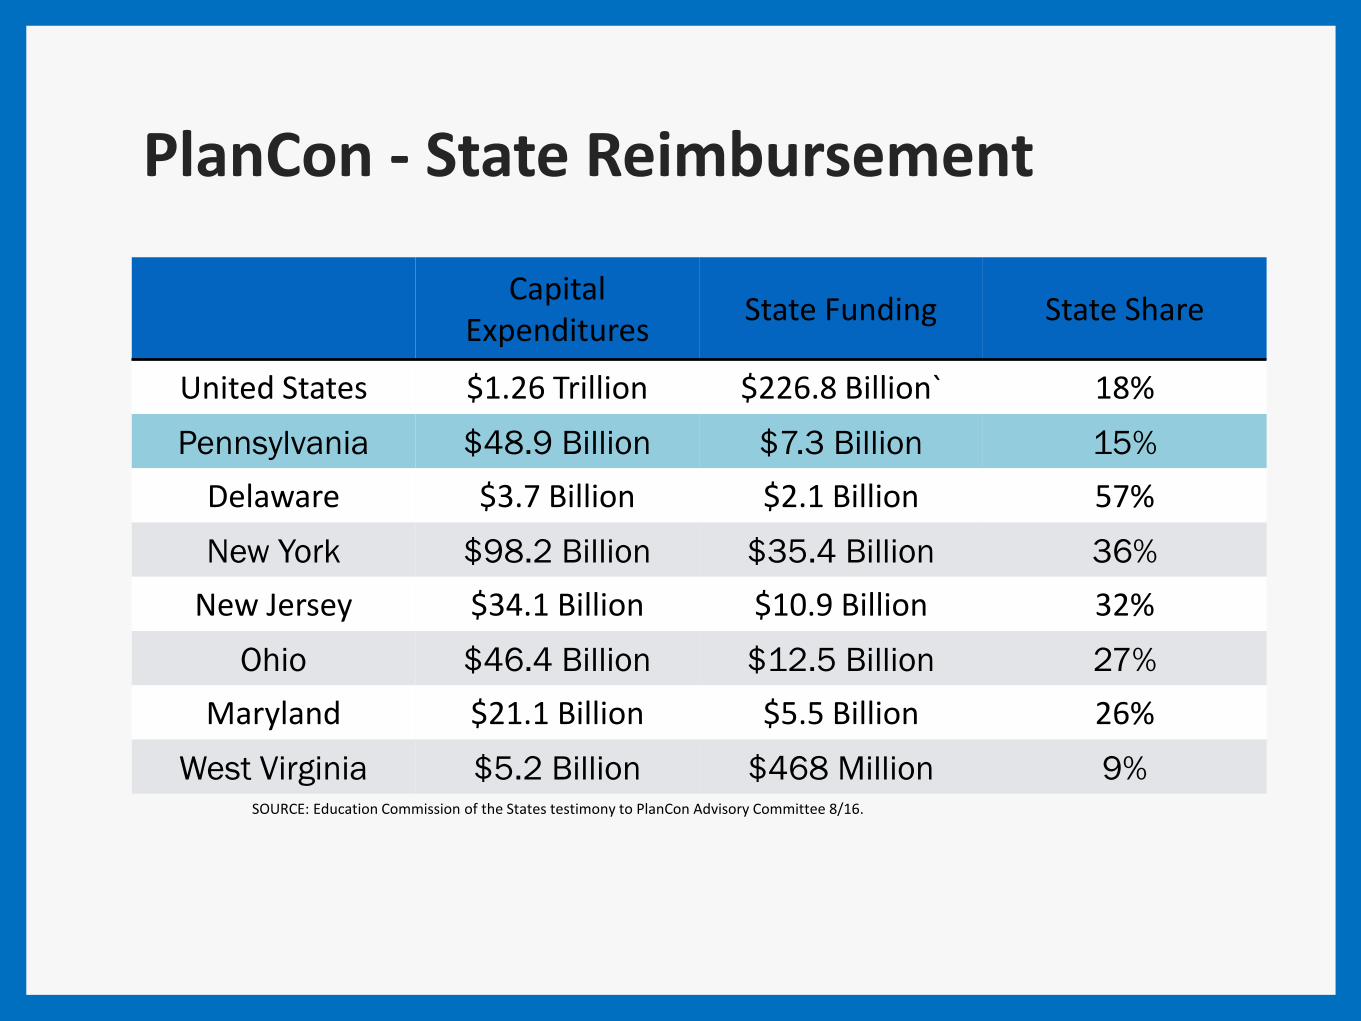
Capital Expenditures
State Funding State Share
United States $1.26 Trillion $226.8 Billion` 18%
Pennsylvania $48.9 Billion $7.3 Billion 15%
Delaware $3.7 Billion $2.1 Billion 57%
New York $98.2 Billion $35.4 Billion 36%
New Jersey $34.1 Billion $10.9 Billion 32%
Ohio $46.4 Billion $12.5 Billion 27%
Maryland $21.1 Billion $5.5 Billion 26%
West Virginia $5.2 Billion $468 Million 9%SOURCE: Education Commission of the States testimony to PlanCon Advisory Committee 8/16.
PlanCon - State Reimbursement

1. Could your district survive another budget impasse?
2. Has your district recovered from the 2015 budget impasse?
3. What are you expecting from the State on ESSA?

Money Matters: The New Funding Formula and The Need for Adequate
and Equitable Funding

Refresher—New Basic Ed Funding Formula Data Elements
New formula with new data elements:3 poverty weights (acute, moderate, concentrated)
ELL weightCharter School ADM weight
Sparsity/Size (small, rural districts)Median Household Income Index
Local Effort Capacity Index

Refresher—New Basic Ed Funding Formula

Refresher—New Basic Ed Funding Formula

Refresher—New Basic Ed Funding Formula

The Debilitating Effect on Property Tax Elimination Legislation on Public
Education
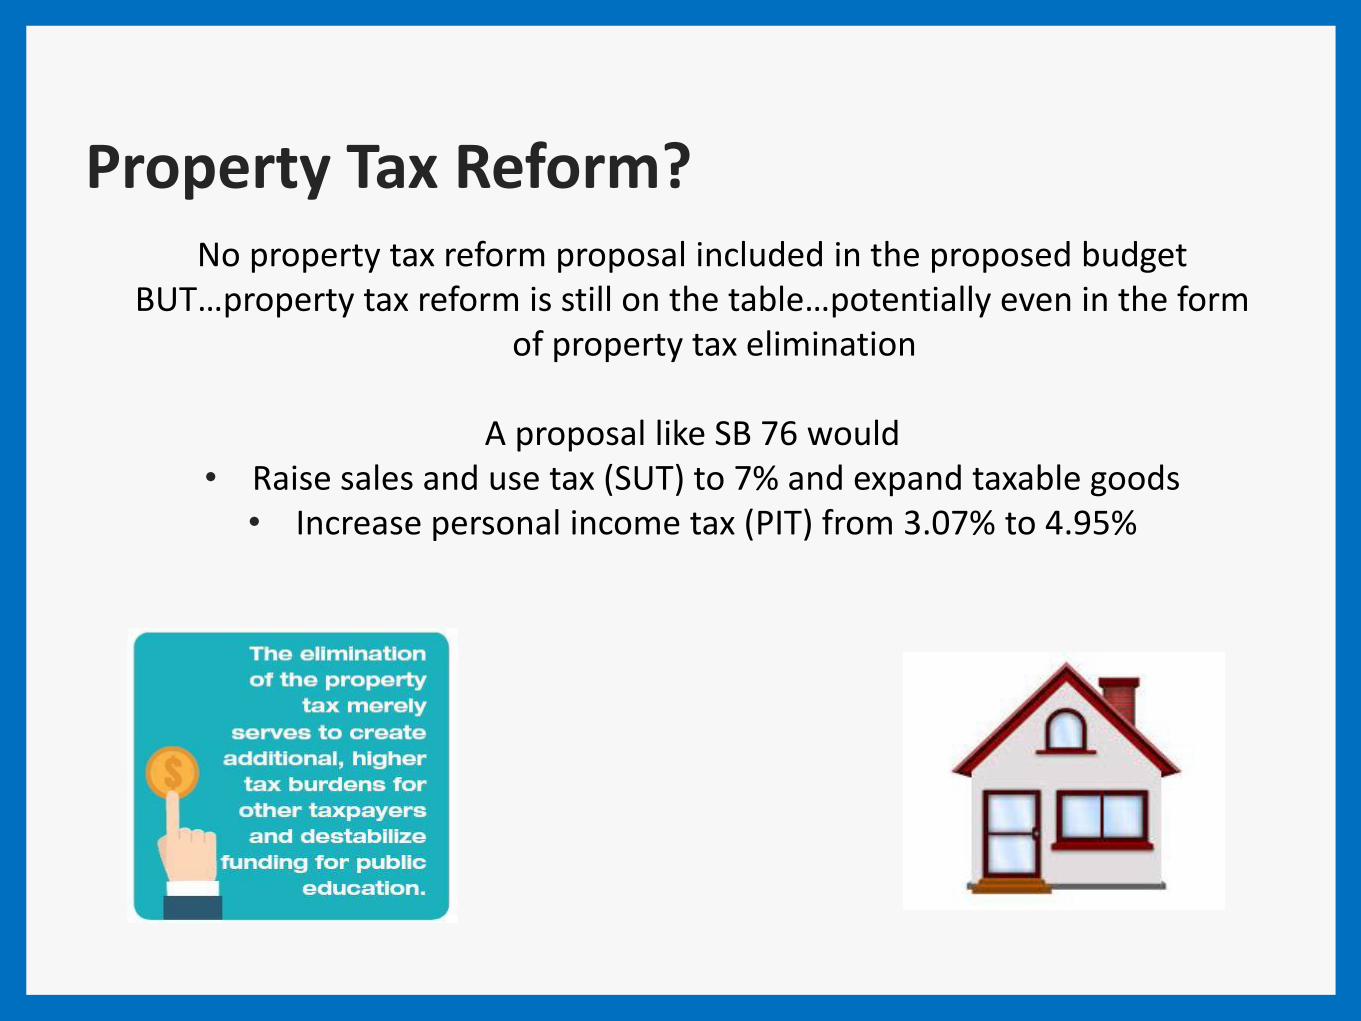
Property Tax Reform?No property tax reform proposal included in the proposed budget
BUT…property tax reform is still on the table…potentially even in the form of property tax elimination
A proposal like SB 76 would • Raise sales and use tax (SUT) to 7% and expand taxable goods
• Increase personal income tax (PIT) from 3.07% to 4.95%

Local Impacts
Total136.69%
0.37%
0% 20% 40% 60% 80% 100% 120% 140%
% G
row
thSi
nce
20
10
-20
11
% G
row
thSi
nce
20
10
-20
11
Growth in Mandatory Pension & Charter Costs vs All Other Expenses
Retirement Increases Charter Increases All Other Expenditure Increases

Impact on School Districts
Creates inequity in state funding across school districts• When ALL state funding is factored in, the state will be sending one
district $8,000 per student and another more than $27,000 per student
Impact on School Districts
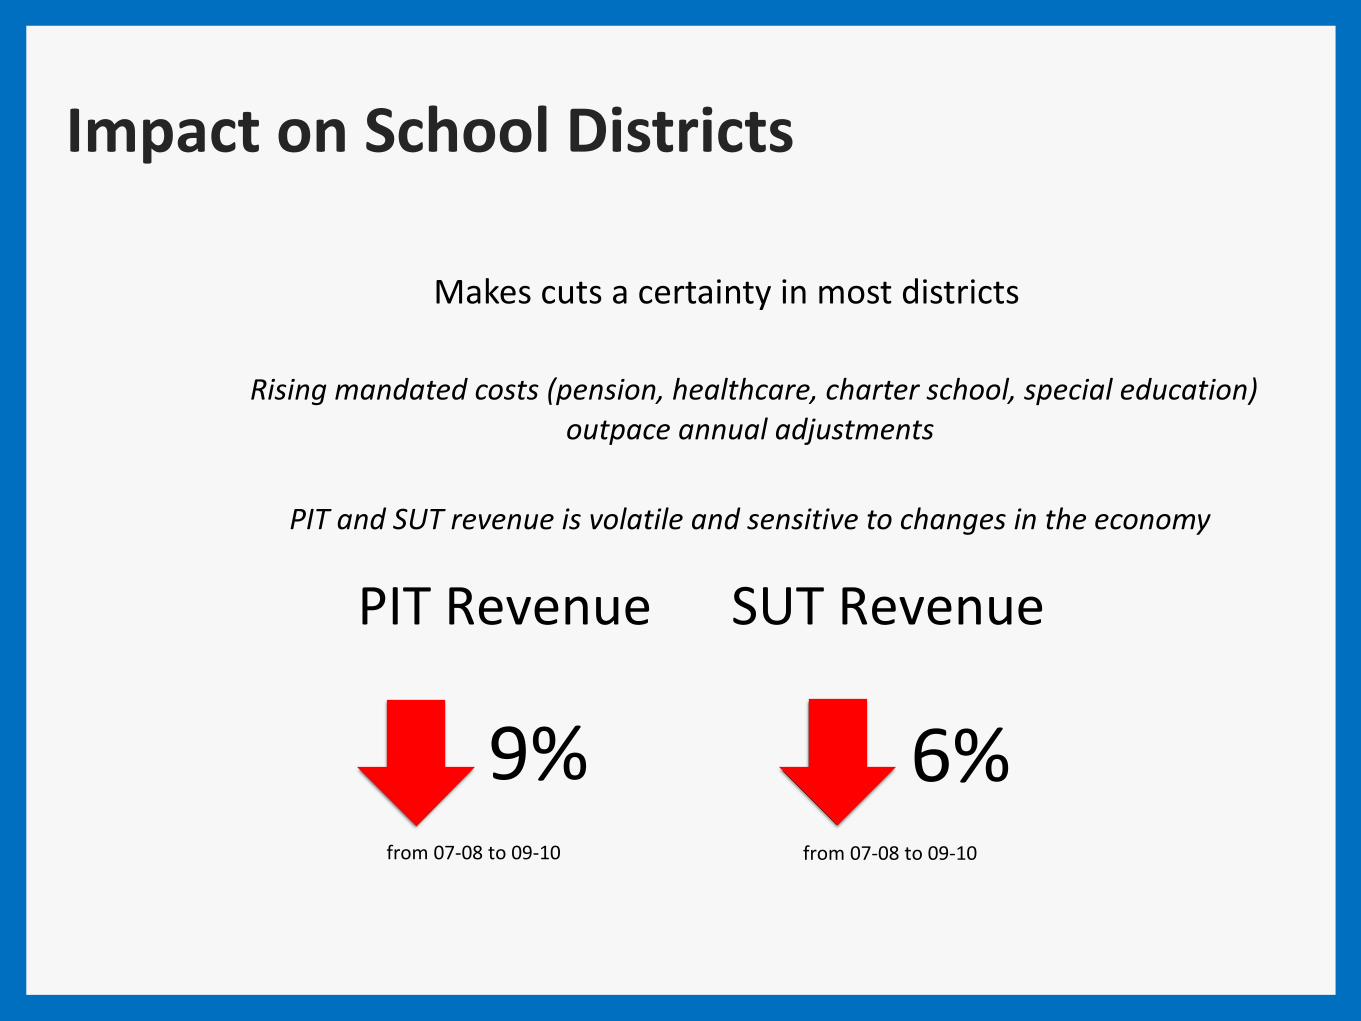
Makes cuts a certainty in most districts
Rising mandated costs (pension, healthcare, charter school, special education) outpace annual adjustments
PIT and SUT revenue is volatile and sensitive to changes in the economy
from 07-08 to 09-10
9% from 07-08 to 09-10
6%
PIT Revenue SUT Revenue

Impact on School Districts
Eliminates local control for education
• School boards will have no authority to make any decision that has any financial impact for the district—no hiring, no contract negotiations, no development or addition of new programs, no extracurricular activities, no facility upgrades or maintenance, no changes to respond to the needs of students and the community
• Harrisburg will call all the shots in 500 school districts
Impact on Taxpayers
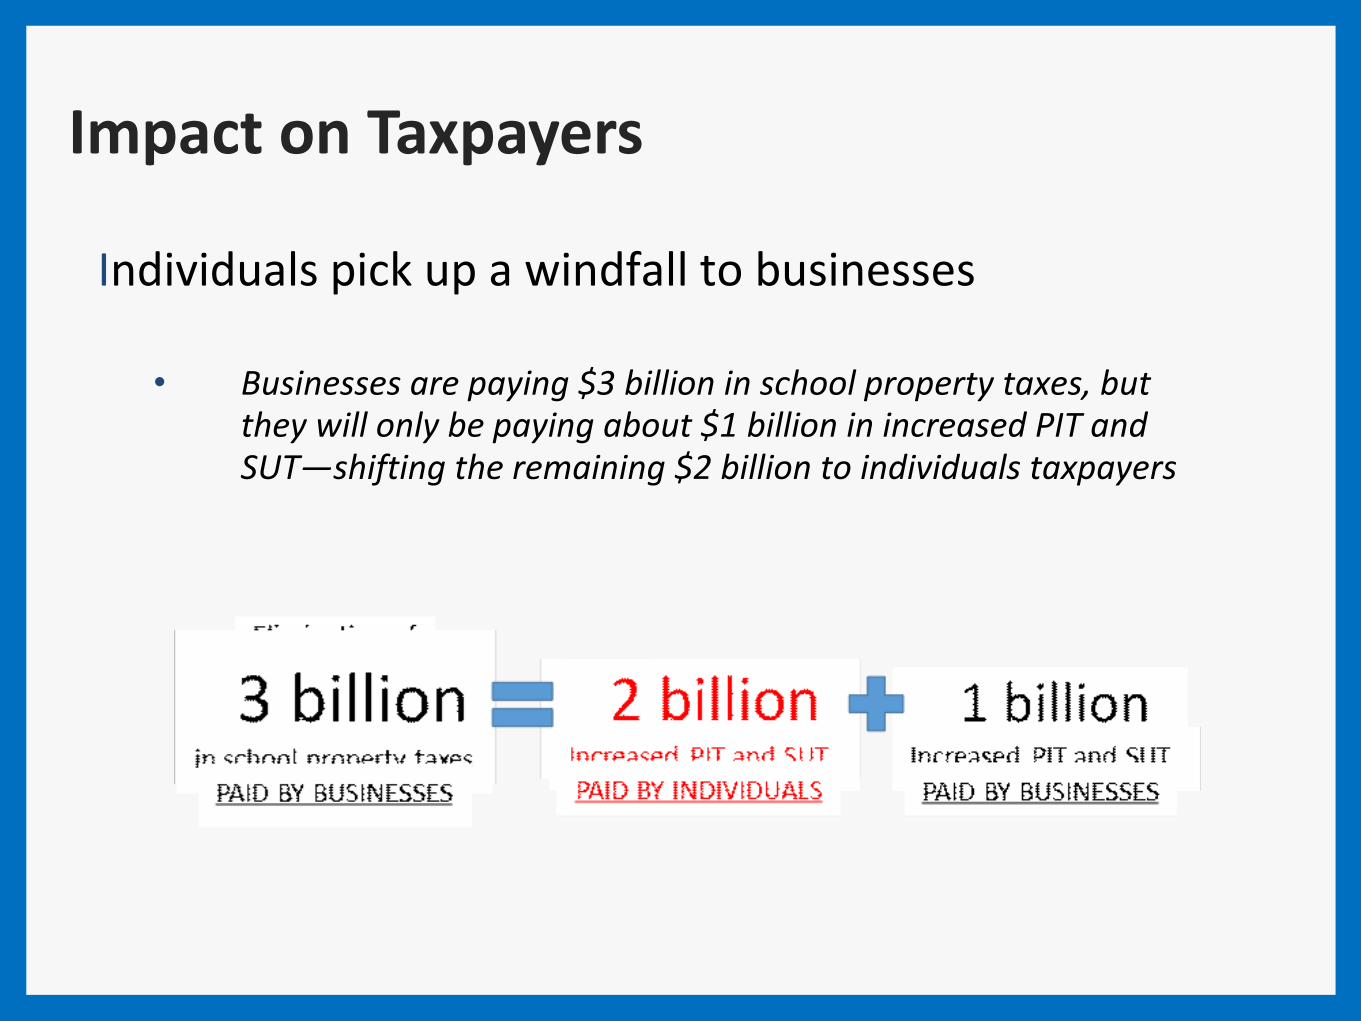
Individuals pick up a windfall to businesses
• Businesses are paying $3 billion in school property taxes, but they will only be paying about $1 billion in increased PIT and SUT—shifting the remaining $2 billion to individuals taxpayers

Impact on Taxpayers
Double taxation on many taxpayers• Because school property taxes aren’t eliminated in 98% of school
districts, residents will continue to pay school property taxes AND the increases in PIT and SUT
• 43% of school districts will maintain at least 20% of their real estate taxes to pay for existing debt
Many taxpayers will pay MORE after property tax elimination
After figuring in the increases in PIT and SUT, the loss of the federal income tax deduction, the result of the shift from businesses and the
remaining school property taxes, taxpayers in 449 school districts (90%) will pay MORE than they are paying now in school property taxes.

1. Are your residents educated on the impact of property tax elimination?
2. Does you feel your residents understand the Basic Education Funding Formula?

The Crushing Weight of PSERS

Pensions
• In a recent PSBA survey, nearly 85% of school districts said pension costs were the single biggest source of budget pressure
• Employer contributions are up 257% between 2010-11 and 2014-15
257.3%
2.5%
0% 50% 100% 150% 200% 250%
Pension Increases
All Other Expenditures

Pensions
4.76% 4.78% 5.64%
8.65%
12.36%
16.93%
21.40%
25.84%
30.03%
32.57%34.18%
35.53% 35.95% 36.40%
0%
5%
10%
15%
20%
25%
30%
35%
40%
2008-09 2009-10 2010-11 2011-12 2012-13 2013-14 2014-15 2015-16 2016-17 2017-18 2018-19 2019-20 2020-21 2021-22
PSERS Employer Contribution Rate
Pensions
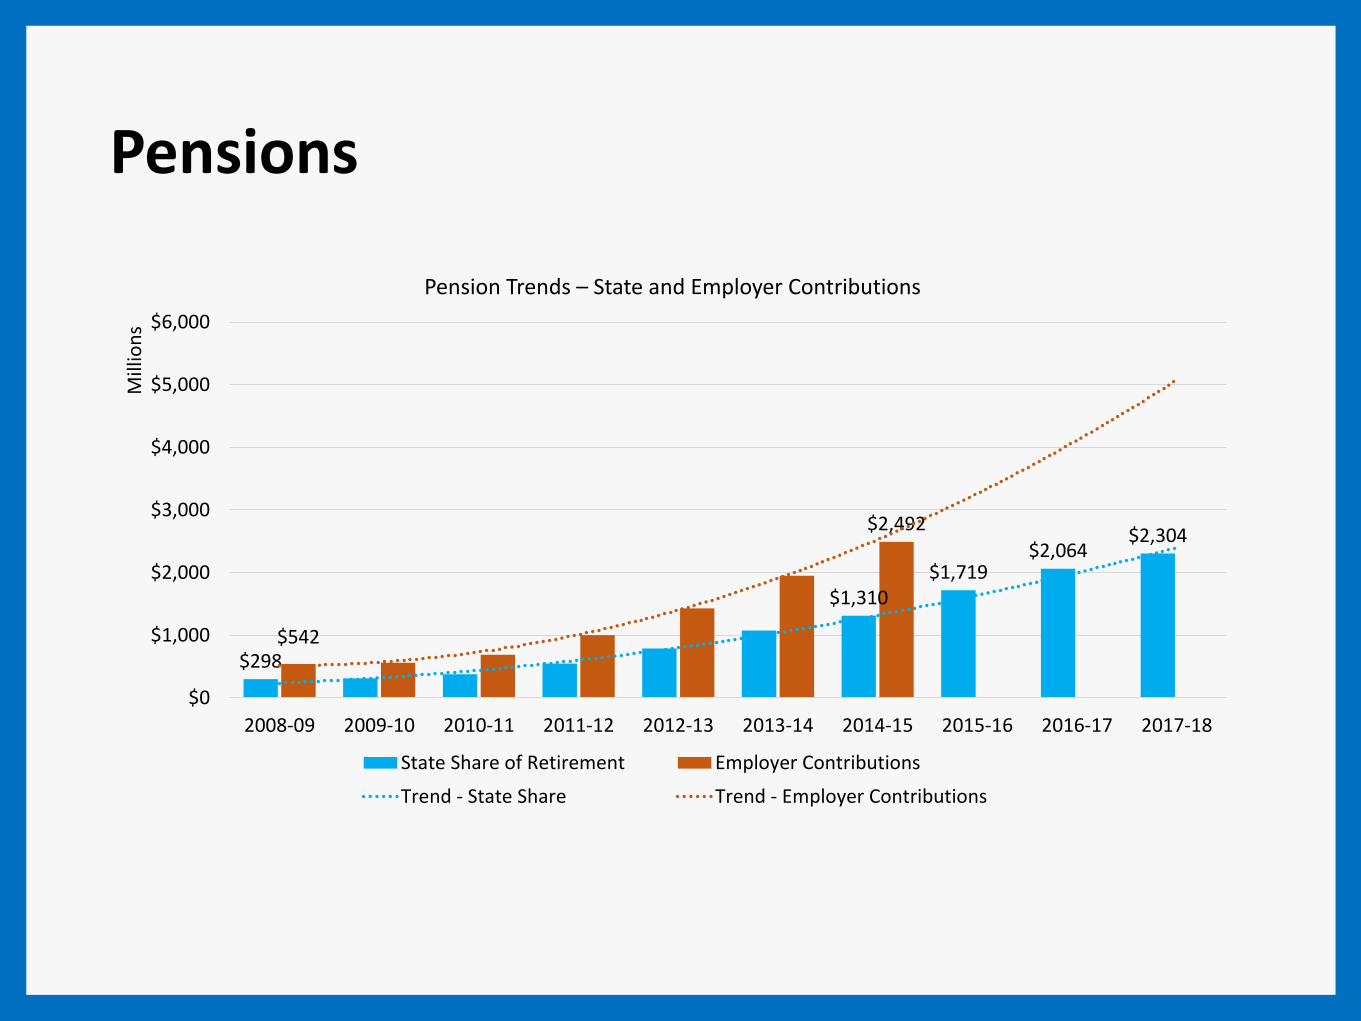
$298
$1,310$1,719
$2,064$2,304
$542
$2,492
$0
$1,000
$2,000
$3,000
$4,000
$5,000
$6,000
2008-09 2009-10 2010-11 2011-12 2012-13 2013-14 2014-15 2015-16 2016-17 2017-18
Mill
ion
s
Pension Trends – State and Employer Contributions
State Share of Retirement Employer Contributions
Trend - State Share Trend - Employer Contributions

Pensions
-$72.60
$250.58 $260.13
$460.56
$375.81
$128.53
$313.13
$425.08
$522.53 $541.04
-$201.13
-$62.55
-$164.95
-$61.97
-$165.23
-$300
-$200
-$100
$0
$100
$200
$300
$400
$500
$600
2010-2011 2011-2012 2012-2013 2013-2014 2014-2015
Mill
ion
s
Pension Increases vs State Revenue Increases
State Revenue Increases Pension Increases Difference

Pensions
• The state share is 50-55% of employer pension contributions
• A $240 million increase in state contributions could mean an increase of $108-$120 million for school districts

Pensions – Local Impacts
• Increases in BEF and special education (less a decrease in transportation) will be eaten up by increases in pension costs alone
• Bottom Line - A continued reliance on local revenue sources.
1. How has your district handled pension increases?
2. Can you share any good planning tips your district has implemented?
Why Good Governance is Imperative: The Importance of the Team of Ten


Govern as Partners
Board
Power Authority
DecisionMaking
PoliticallyAcceptable
TechnicallyFeasible
Superintendent

The Critical Role of the Superintendent

The Superintendent is the Steward of the VISION
◦ Focus the staff on the long–term perspective.
◦ Articulate the expectations for the school system.
◦ Promote high aspirations for the children.
◦ Describe the preferred future that will be achieved..
85

Setting Long-Term Expectations:Building a Caring, Learning Organization
• High Challenge and Low Threat for Students
• High Expectations and Strong Support for All Staff
• Keep the Focus on Teaching and Learning
• Expressions of Value and Worth for All Students and
Staff
• Provide a Safe and Secure Environment for All
• Provide Effective Leadership
• Develop Partnerships with the Community
• Inspire Excellence
86

Love Your Employees
If you build your organization by only focusing on your
customers (the students) and don’t make the same
commitment to your employees, you will not succeed.
The quality of any school system will not exceed the
quality of the staff.
Michael Fullan
The Six Secrets of Change
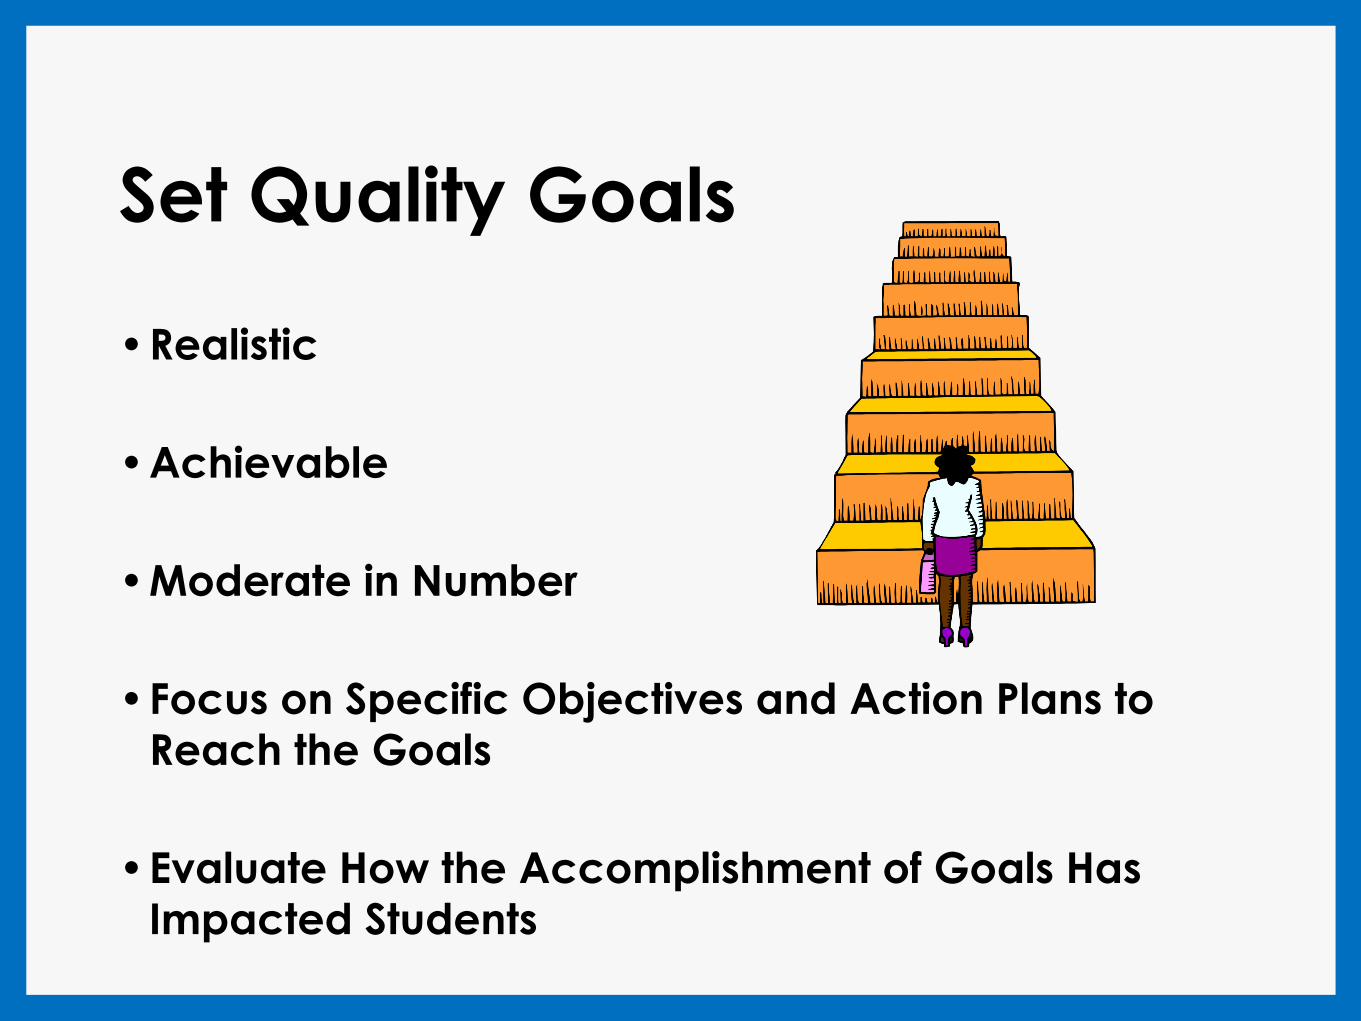
Set Quality Goals
•Realistic
•Achievable
•Moderate in Number
•Focus on Specific Objectives and Action Plans to
Reach the Goals
•Evaluate How the Accomplishment of Goals Has
Impacted Students

Promote Excellence
“Excellence is the full unleashing
of human potential.”
“The ability to communicate people’s worth and
potential so clearly that they are able to see
it in themselves.”
Stephen Covey
Inspire Others

Set Expectations for the System
•Promote Worthwhile Work
•Commitment to Shared Goals
•Promote Values to Guide Actions
•Establish Clearly Defined Roles
•Cheers Progress
•Constantly Identifies Those Responsible for Doing Things Right
(From Ken Blanchard’s, Gung Ho!)

Advocating for Your Students and Public Education through Compelling
Narratives

Campaign for Fair Education Funding
www.fairfundingpa.org
The Campaign for Fair Education Funding is a statewide non-partisan effort made up of organizations that, collectively, represent Pennsylvanians from every corner of the state. Our campaign includes
more than 50 education advocacy organizations; teachers and school administrators; representatives of charter schools and traditional public schools; urban and rural interests; business and organized
labor; faith-based groups; and community groups.

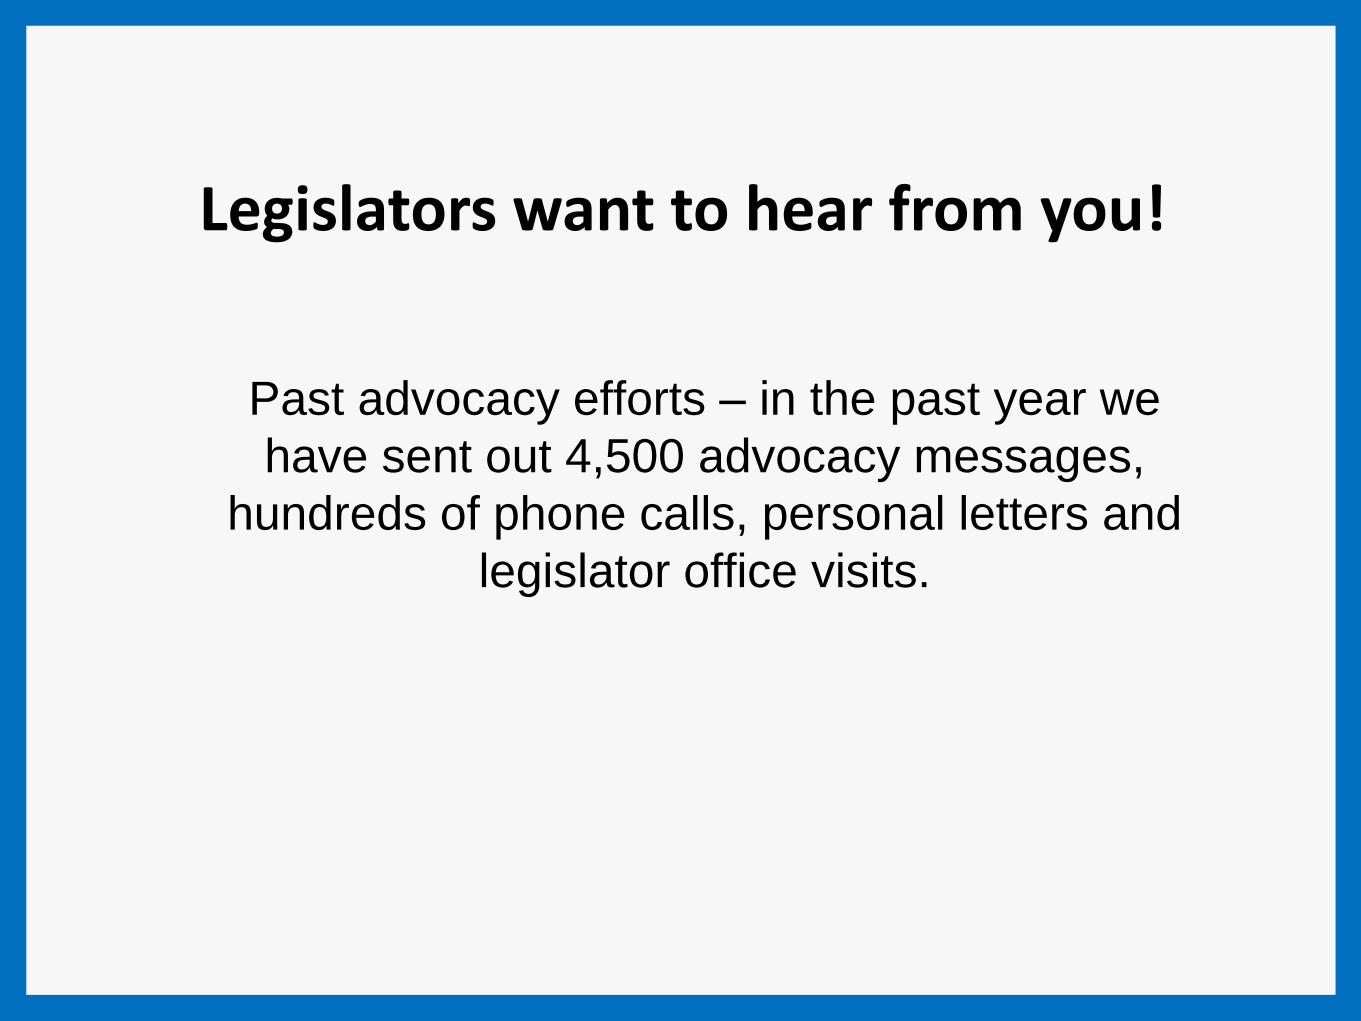
Legislators want to hear from you!
January 31, 2017 Senate Education Committee
Hearing –
“Sen. Brewster spoke against the legislation
and noted that he has not heard from any
school board members in his district that the current benefits under law is a serious issue.”
Legislators want to hear from you!
Past advocacy efforts – in the past year we
have sent out 4,500 advocacy messages,
hundreds of phone calls, personal letters and
legislator office visits.

Shameless Plug

1. What experiences has your team of 10 had (good or bad)?
2. Does your board work with your Superintendent?

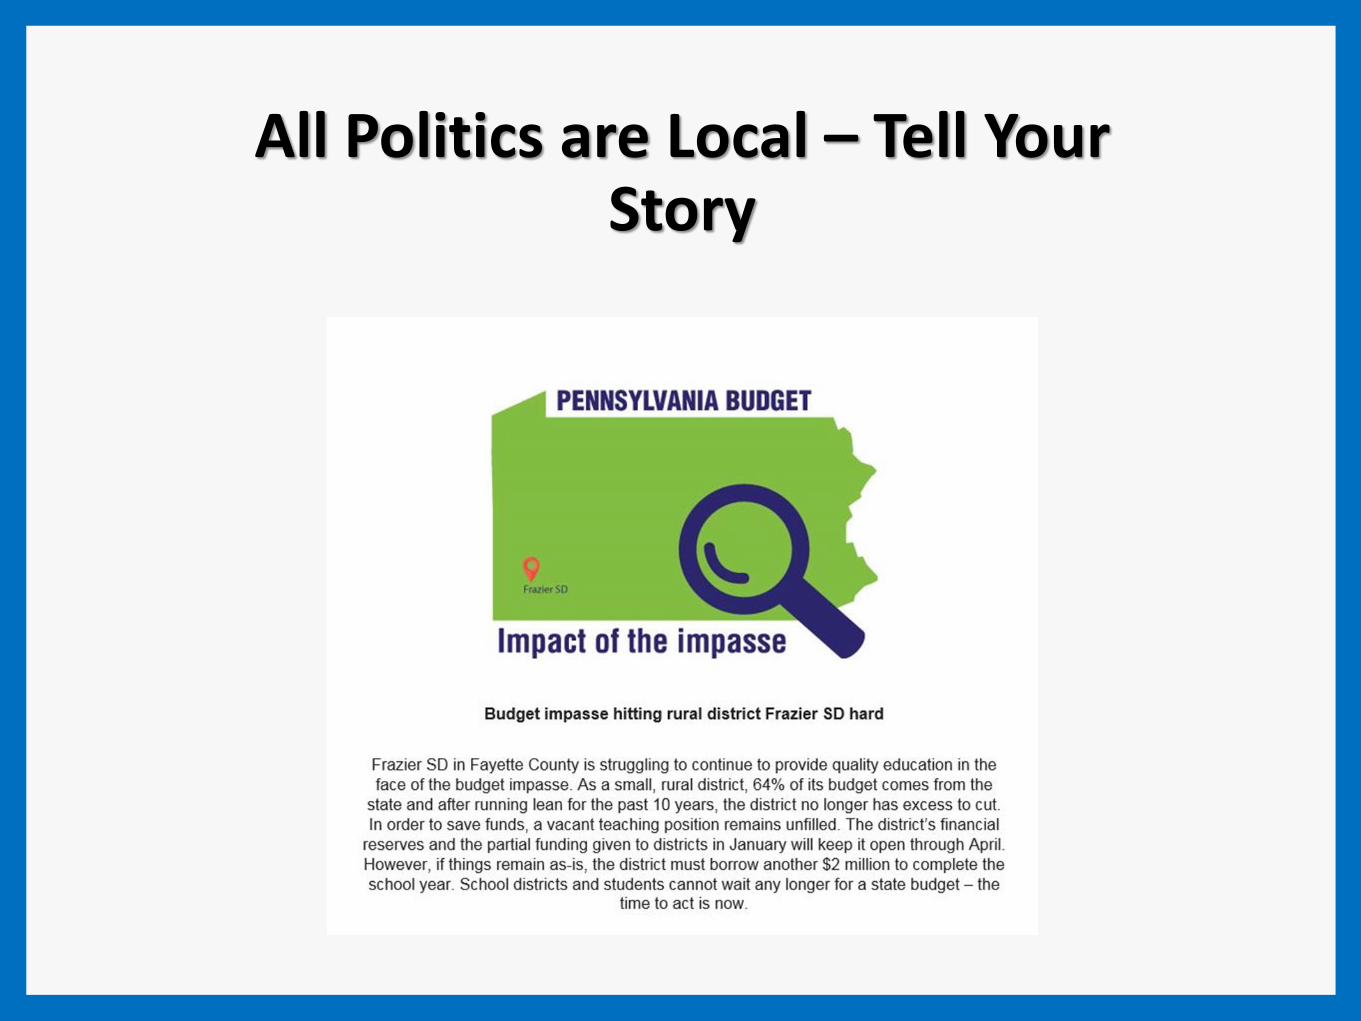
All Politics are Local – Tell Your Story
All Politics are Local – Tell Your Story

All Politics are Local – Tell Your Story

All Politics are Local – Tell Your Story

All Politics are Local – Tell Your Story
www.successstartshere.org

All Politics are Local – Tell Your Story

All Politics are Local – Tell Your Story
Success Starts Here Campaign –
• 120 school entities have had their stories posted (160 total stories)
• Billboard campaign in certain areas with a donated value of $175,000 for $30,00 spent
• 11 to 1 return on television ads w/ nearly $1 million in donated air time

1. Do you use local stories when talking with policy makers?
2. Do you regularly meet or talk to policy makers or staff?

Thank you for your time today and thank you for all you do for the students of
Pennsylvania!