tricon global restaurants - college of business at illinois
TRANSCRIPT

Cases in Strategic-Systems Auditing
The $20 Billion Start-Up
Robert F. Dahlstrom, Ph.D. University of Kentucky
James R. Duncan, Ph.D., CPA Ball State University
Robert J. Ramsay, Ph.D., CPA University of Kentucky
Terry L. Amburgey, Ph.D. University of Toronto
The authors acknowledge the valuable assistance of Tricon Global Restaurants, Inc. personnel and the Louisville, Kentucky office of KPMG for their assistance in developing this case.
KPMG /University of Illinois
The views and opinions are those of the authors and do not necessarily represent the views and opinions of KPMG LLP. ©2004 by KPMG LLP, the U.S. member firm of KPMG International, a Swiss cooperative. All rights reserved. KPMG and the KPMG logo are registered trademarks of KPMG International, a Swiss cooperative. This case was developed under a grant from the KPMG and University of Illinois Business Measurement Case Development & Research Program. Cases developed under this program and other program information can be obtained from the Web site http://www.cba.uiuc.edu/kpmg-uiuc.
Business Measurement Case Development and Research Program

KPMG /University of Illinois Business Measurement Case Development and Research Program November 2004
Introduction Throughout the 1990s companies used spin-offs
as a means to reorganize. In 1996 alone, some of
the larger such reorganizations included AT&T’s
spin-off of Lucent Technologies, Baxter’s spin-
off of Allegiance and 3M’s spin-off of Imation.
This case is set in 1997, the year that PepsiCo used a tax-free common stock distribution to spin-off its three restaurant brands into an independent, publicly owned company known as Tricon Global Restaurants, Inc. (On May 16, 2002, Tricon Global Restaurants, Inc. changed its name to Yum! Brands, Inc.)
In October 1997, PepsiCo announced a spin-off of its three chain-restaurant businesses—KFC,® Pizza
Hut® and Taco Bell®—and combining them into one new publicly owned company, Tricon Global
Restaurants, Inc. (Tricon). At the time of the spin-off, the marketing approaches of the three restaurant
units were quite different as were their operating styles and accounting systems. Although Tricon began
operations with projected annual system sales (system restaurants include franchised and company-owned
units) of $20 billion, a Wall Street Journal article heralding the spin-off highlighted one of the new
company’s immediate financial challenges.1 The article stated, “Tricon’s $4.7 billion debt is 10 times 1996
cash flow, and shareholders’ equity starts at a negative $740 million. And competition is intense.” Indeed,
the restaurant industry is particularly challenging because it is highly competitive and volatile.
Given this financial profile, it was crucial that Tricon immediately develop ways to maximize its cash
flow. One way to generate cash in the restaurant-chain business is to sell existing company-owned
restaurants to new and existing franchisees, a process known as refranchising. Refranchising began under
PepsiCo before the spin-off but became more critical with the creation of Tricon. Shortly after the spin-off,
Tricon announced that it would reduce restaurant ownership for the U.S. system to approximately 20 to 25
percent. No other company in the restaurant industry had ever attempted refranchising on the scale
envisioned by Tricon.
The Quick Service Restaurant (QSR) Industry Within the food services sector of the U.S. economy, there is a number of industries that differ primarily
with respect to methods of distribution—full-service restaurants, limited-service restaurants, cafeterias,
snack and nonalcoholic beverage bars, food service contractors, caterers, mobile food services and
1 See Gibson, R., “Fast Food Spinoff Enters Pepsi-free Era,” Wall Street Journal (October 7, 1997) pp. B1-B2.
©2004 by KPMG LLP, the U.S. member firm of KPMG International, a Swiss cooperative. 2 All rights reserved. KPMG and the KPMG logo are registered trademarks of KPMG International, a Swiss cooperative.

KPMG /University of Illinois Business Measurement Case Development and Research Program November 2004
alcoholic drinking establishments.2 In addition, food and beverage stores in the retail-trade sector, such as
grocery stores and convenience stores, compete in the sale of prepared foods. Within the limited-service
restaurant industry, also known as the quick service restaurant (QSR) industry, segments generally are
grouped by menu format. Examples of menu-segments are hamburgers, chicken, pizza, sandwiches,
Mexican food and Chinese food. Although the diverse distribution methods and menu formats define the
distinct industries within the food sector, when it comes to competing for consumer dollars in a battle for
stomach share all formats can be considered substitutes for one another.
Industry Revenue The QSR industry generated an estimated $160 billion in worldwide sales in 1996. Tricon garnered 13
percent of worldwide QSR sales in 1996 compared to 20 percent for McDonald’s, the world’s largest QSR
company based on system sales.
Intense competition characterizes
this industry, with restaurant units on
almost every corner of busy
thoroughfares in the United States
and many foreign countries. As
indicated in the chart, in 1997,
Tricon was the leading QSR system
in the world in terms of restaurant
unit quantity.
Industry Cost Structure Restaurant unit costs represent a
challenge for the QSR industry. In
1998, food costs were expected to increase 5 percent and labor costs to increase 3 to 5 percent. Industry
observers expected a significant increase in the cost of beef and weather patterns, driven by El Nino, to
create cost pressure on other food commodities. Labor and technology also represent the most significant
restaurant-level costs.
2 See the North American Industry Classification System developed in 1997 through the U.S. Office of Management and Budget
and described on the Web site of the U.S. Bureau of Labor Statistics (http://www.bls.gov/bls/naics.htm).
©2004 by KPMG LLP, the U.S. member firm of KPMG International, a Swiss cooperative. 3 All rights reserved. KPMG and the KPMG logo are registered trademarks of KPMG International, a Swiss cooperative.

KPMG /University of Illinois Business Measurement Case Development and Research Program November 2004
Labor3
From 1992 to 1997, the average hourly labor rate increased 2.8 percent per year. The total number of
workers 16 to 24 years of age, the primary entry-level age group, increased slightly during this period but
decreased from 58.4 to 55.8 people per restaurant unit. Projections for the period between 1996 and 2010
indicate that workers 16 to 24 years of age would increase 18 percent; however, the fastest growing age
groups will be those 55 to 64 years of age (54%) and ages 45 to 54 (33%).
Employee turnover is a consistent problem in the QSR industry. The turnover rate for 1996 was 116
percent, an improvement from the 130 percent in 1995. The decline in turnover was attributed to training
programs for hourly employees, competitive compensation and benefits, performance awards and treating
employees with more respect. Higher minimum wage, low unemployment and shrinking labor pools drive
labor cost increases.
The shrinking labor pool has brought diversity management to the forefront. The Industry of Choice report
released by the National Restaurant Association indicated that the already diverse labor force would
become more so as competition to attract and retain good employees intensifies.4 Also, researchers
examining U.S. Government statistics report that:5
Foodservice employees tend to be youthful and of diverse ethnicities, unlike other industries.
There are likely to be enough workers to fill the foodservice workforce through 2005 but competition for workers will be intense.
Worker diversity will continue to increase.
Technology According to Restaurants & Institutions magazine:
The improved technologies, from automated kitchen equipment to on-line inventory control, are increasing efficiency and restaurant profitability—and bottom lines. Half of QSR operators surveyed by the National Restaurant Association upgraded their computerized systems in 1997 and a similar number planned to do so in 1998.6
Efficient Foodservice Response (EFR), an integrated set of systems designed to make food purchasing
more efficient, involves changes in processing paperwork, products and cash. EFR elements include an
3 Statistical data in this section are from Restaurants USA (February 1998). 4 Foodservice Research Forum, The Industry Report: Catering to Employees (National Restaurant Association Educational
Foundation, October 15, 1998). 5 See Rousseau, R., “Employing the New America,” Restaurants & Institutions (March 15, 1997). 6 See Puzo, D. and J. Dulen, “Outlook ’98: The Numbers Game,” Restaurants & Institutions (January 1, 1998).
©2004 by KPMG LLP, the U.S. member firm of KPMG International, a Swiss cooperative. 4 All rights reserved. KPMG and the KPMG logo are registered trademarks of KPMG International, a Swiss cooperative.

KPMG /University of Illinois Business Measurement Case Development and Research Program November 2004
accurate paperless information system, just-in-time product flow and electronic funds transfer. Advantages
include increased freshness and lower cost for food, reduced inventories (less need for storeroom space),
fewer shipment errors, less stock checking and minimal internal theft.7 Other trends likely to have
increasing significance include:
meal solutions Innovations such as automatic-open (i.e., attendant-free) drive-thru windows and the ability to
order from multiple concepts at a gas-station pump are likely to continue the trend of selling
prepared meals and components to consumers.
food safety Dozens of new thermometers allow food preparers and servers to hold cooked foods at standard
temperatures. Labeling systems keep track of expiration dates. Color-coded cutting boards indicate
which board is to be used with which food. New equipment also targets employee cleanliness.
Automatic hand-washing systems and an infrared hand-wash monitoring system can help ensure
good hygiene.
point-of-sale technology Systems now are digital, allowing easy ordering for novice and experienced staff alike. Also,
customers can enter orders into systems at tables that are sent directly to the kitchen.
International Issues American restaurants face many hurdles when exporting concepts overseas. Unfamiliar political, social
and economic systems, cultural and taste differences and expensive labor and real estate are some of the
issues that can make the transition difficult. In many third-world countries, for example, people consider
QSR dining to be top of the line and a meal may represent a week’s wages. Drawn by the benefits of international expansion, huge growth opportunities, tremendous financial
infusion and worldwide exposure, many American restaurants are expanding outside the United States
despite the hurdles. International expansion is easier for large, well-financed chains that enjoy a strong
brand. Smaller, less recognizable concepts have difficulty obtaining overseas partners and sufficient
resources.
7 See Rousseau, R., “EFR Spells Savings,” Restaurants & Institutions (February 15, 1997).
©2004 by KPMG LLP, the U.S. member firm of KPMG International, a Swiss cooperative. 5 All rights reserved. KPMG and the KPMG logo are registered trademarks of KPMG International, a Swiss cooperative.

KPMG /University of Illinois Business Measurement Case Development and Research Program November 2004
All restaurants are subject to national and local laws and regulations concerning labor, health, sanitation
and safety. International restaurants:
Pay tariffs.
Comply with regulations on imported commodities and equipment and laws regulating foreign investment.
Face foreign currency translation exposures.
Have similar challenges as those in the United States for same-store sales growth and food and labor costs.
Competition When the National Restaurant Association asked QSR operators what worried them most in 1998, 21
percent of the respondents cited competition from other restaurants; only labor issues were a more frequent
concern. As a result of intense competition and saturated markets, new unit growth was expected to be in
nontraditional locations, such as hotel lobbies, supermarkets and schools.
Table 1 U.S. Food Industry Market Share in 19928
Retail Type Number of locations
Total Revenues
(000s)
Revenues per store
(000s) Percent of Retail Food
Revenue
Grocery stores 133,263 $352,558,154 $ 2,645.58 58%
Casual/fine dining restaurants 170,183 85,178,356 500.51 14%
Quick service restaurants 164,341 77,685,530 472.71 13%
Gasoline/convenience 33,998 47,993,477 1,411.66 8%
Other food 47,305 16,640,400 351.77 3%
Other eating places 43,236 21,339,329 493.55 3%
Drinking establishments 55,848 11,113,777 199.00 2%
Totals 648,174 $612,509,023
Competitive pressures within the food industry are not limited to QSR companies. As indicated in Table 1,
QSR companies represented only 13 percent of total food industry revenues. Other food industry segments
(mentioned earlier) include: grocery stores, casual and fine dining, gasoline/convenience stores, other food
(meat and seafood markets, bakeries and cafeterias), other dining (ice cream, yogurt, cafeterias) and
drinking establishments. At the time of the spin-off from PepsiCo, other formats did not pose an immediate
threat to the QSR industry. Nevertheless, the possibility of lost sales was on the horizon with supermarkets
and convenience stores posing the primary threats.
8 1992 Census of Retail Trade (U.S. Department of Commerce; Washington, D.C.: U.S. Government Printing Office).
©2004 by KPMG LLP, the U.S. member firm of KPMG International, a Swiss cooperative. 6 All rights reserved. KPMG and the KPMG logo are registered trademarks of KPMG International, a Swiss cooperative.

KPMG /University of Illinois Business Measurement Case Development and Research Program November 2004
Supermarkets With everything from hot pizza to ready-to-heat mashed potatoes, grocery stores are penetrating
foodservice segments. Further, those already in the ready-to-eat or ready-to-heat foods are refining
operations and are likely to become better at meeting consumers’ expectations (e.g., addressing quick-exit
concerns by providing separate registers and entrances). More stores will hire culinary professionals to
expand menus and service will improve with training. Partnerships with restaurants are growing and chains
such as Subway will have a presence.
Convenience Stores More than 80,000 convenience stores are located in and around residential areas. Regarded as a potential
competitor for years, 1998 may mark the convenience store’s arrival as a bona fide foodservice operator.
The key to a breakthrough is overcoming the public’s perception that convenience stores primarily sell
cigarettes and snack food.
International The QSR industry is much less competitive internationally than domestically and the primary international
competitor for Tricon is McDonald’s. Wendy’s, Burger King and Domino’s have a limited international
presence but the landscape may be changing with casual dining chains like TGI Friday’s exploring
international expansion. In 1996, industry sales outside the United States were approximately $62 billion.
Unit sales per person, however, were far less internationally than in the United States, suggesting an
opportunity for significant growth. In fact, much of McDonald’s planned unit growth is international. At
the time of the case, Tricon had 8,620 units concentrated in Asia/Pacific (36%), Latin America and Canada
(29%), Europe (19%) and South Pacific (16%). McDonald’s, which generated one-half of the industry’s $62 billion in international sales in 1996, had
9,000-plus international units in 104 countries. It was reported that McDonald’s opens a new overseas unit,
on average, every four hours. Sixty percent of McDonald’s sales and profits come from international units.
The international divisions of the industry’s top 100 companies are growing faster than their domestic
counterparts in terms of sales and units.
Tricon Global Restaurants, Inc.
Tricon began operations on October 6, 1997 when PepsiCo transferred the assets and liabilities of its three
restaurant businesses to the newly formed company. In exchange, Tricon distributed its common stock to
existing PepsiCo shareholders by giving shareholders one share of Tricon stock for each ten shares of
PepsiCo. (See the press release in Exhibit 1.)
©2004 by KPMG LLP, the U.S. member firm of KPMG International, a Swiss cooperative. 7 All rights reserved. KPMG and the KPMG logo are registered trademarks of KPMG International, a Swiss cooperative.

KPMG /University of Illinois Business Measurement Case Development and Research Program November 2004
PepsiCo initiated its restaurant segment in 1977 and 1978 with acquisitions of Pizza Hut and Taco Bell,
respectively. Part of the motivation to enter the restaurant business was to create captive outlets for
fountain beverage products. In 1986, PepsiCo completed its triad of restaurant concepts with the
acquisition of Kentucky Fried Chicken from RJR Nabisco. PepsiCo operated the concepts as stand-alone
divisions that competed with one another and reported directly to the PepsiCo CEO. Because each of the
three restaurant companies developed independently, each had its own culture, operating philosophy and
procedures. Nevertheless, Tricon Restaurants International (TRI), a separate division, managed the
international operations of all three concepts. PepsiCo contended that by reorganizing the three restaurant businesses into one independent publicly
traded company, it could:
Alleviate competitive barriers to expanding PepsiCo’s fountain beverage business.
Focus its attention on its packaged goods businesses, Pepsi-Cola and Frito-Lay.
Offer management incentives more directly tied to the performance of the respective businesses.
Run a separate restaurant company with improved focus on strategies, organizational goals and employee incentives to best maximize its financial performance.
In June 1997, PepsiCo announced the top executives of the spin-off restaurant company, Tricon. Andrall
Pearson was named chairman of the board and CEO. Pearson, who was president and chief operating
officer of PepsiCo when the company acquired Pizza Hut and Taco Bell, brought seasoned business
experience and savvy to the new organization. David Novak, then PepsiCo’s vice-chairman and former
CEO of PepsiCo’s KFC and Pizza Hut divisions, was named president. Novak joined Pizza Hut in 1986 as
senior vice president of marketing and served in the beverage and restaurant divisions as a senior leader.
He became CEO of KFC in 1994, initiating a turnaround of its business. The management structure was designed with a focus on operations. The president of each brand served as
the chief concept officer and had overall responsibility for all functional heads, marketing and product and
concept development. The concept chief operating officer reported to the president and focused on
building the best restaurant operations possible. One of the most important operational leaders in each
concept is the restaurant general manager (RGM), who must ensure that his or her restaurant is tops in
operational performance. Pearson and Novak chose individuals with a wealth of experience to serve as senior corporate staff. They
selected Bob Lowes as CFO, having served as CEO of Burger King and in various senior financial
positions at Grand Metropolitan, Philip Morris and General Foods. They named Chris Campbell as
Tricon’s general counsel and secretary, having served in similar positions at Owens Corning and Nalco
©2004 by KPMG LLP, the U.S. member firm of KPMG International, a Swiss cooperative. 8 All rights reserved. KPMG and the KPMG logo are registered trademarks of KPMG International, a Swiss cooperative.

KPMG /University of Illinois Business Measurement Case Development and Research Program November 2004
Chemical Company. Bob Carleton became senior vice president and controller after serving as PepsiCo’s
controller for the preceding 15 years. Gregg Dedrick became chief people officer after having served along
with Novak as the senior human resources leader for KFC and Pizza Hut. Sandra Wijnberg, who had
served as an assistant treasurer for PepsiCo and as CFO of KFC became Tricon’s Treasurer. Jonathan
Blum, Taco Bell’s senior vice president of public affairs since 1993, became Tricon’s public affairs senior
vice president. Most of these appointments were made several months before the spin-off. In addition, the concepts were
well stocked with operations and staff personnel. The corporate staff supporting the senior corporate
leaders, however, was much less developed. For example, many of the positions responsible for day-to-day
treasury and accounting functions were vacant. It would take time to fill leadership positions in treasury,
finance, legal and human resources. In the interim, Tricon entered into an agreement with PepsiCo for
assistance with critical functions.
Goals and Strategy The following goals and strategy were paramount at Tricon’s inception. 1. Become renowned for an ownership recognition culture that drives the best results in the
industry. This goal addresses the high employee turnover endemic to the industry. To accomplish this goal,
Tricon gave each RGM a one-time, $20,000 stock option grant called YUMBUCKS. This plan
provided an opportunity to earn even more options based on the RGM’s restaurant performance, along
with a unique program to recognize outstanding restaurant teamwork.
2. Drive superior same store sales growth through differentiated brand positioning and innovation.
This goal is achieved through product innovation, clever retail advertising, promotions and customer
service. In addition, Tricon began combining its brands within single restaurants in an effort to give
customers more choice.
3. Improve restaurant economics to drive shareholder value.
By working closely with top-performing franchisees and company operators, Tricon sought more
effective ways of attacking cost pressures. To control costs with economies of scale, Tricon purchases
its food, paper goods and equipment for all its U.S. restaurants through a $4 billion cooperative. The
company also uses new technologies that simplify operations and improve service time and intensify
team training and RGM coaching across the system. The CHAMPS (which stands for Cleanliness,
Hospitality, Accuracy, Maintenance, Product quality and Speed of service) program measures and
rewards outstanding employee performance against a common customer standard at all restaurants.
©2004 by KPMG LLP, the U.S. member firm of KPMG International, a Swiss cooperative. 9 All rights reserved. KPMG and the KPMG logo are registered trademarks of KPMG International, a Swiss cooperative.

KPMG /University of Illinois Business Measurement Case Development and Research Program November 2004
4. Develop the most competitive, leveragable above-the-store cost structure in the industry.
Tricon focuses on a one-time, one-way system to reduce complexity and redundancy. This system’s
objective is to reduce Tricon’s general and administrative expenses substantially.
5. Expand the system aggressively and profitably by becoming a superior franchise company.
To trim company ownership to 20-25 percent of the system, Tricon sells its restaurants to experienced
franchisees (i.e., refranchising). It also strategically expands the system. In addition, the company
conducts a U.S. Franchise Leadership Summit where company leaders and franchisees from all three
brands meet to discuss Tricon’s one-system approach, share best practices and explore cross-branded
expansion opportunities.
6. Build a capital and asset structure that dramatically enhances shareholder value.
Tricon pursues this ultimate goal by investing in high return restaurant units and exiting persistently
low return units. The company also has a sharpened focus on sales growth, margin improvement,
strategic system expansion and elimination of unnecessary or redundant initiatives.
Tricon’s Business Units
KFC® Headquartered in Louisville, Kentucky, Kentucky Fried Chicken began in 1939 when Colonel Harlan
Sanders developed his secret blend of 11 herbs and spices and special cooking process in his restaurant in
Corbin, Kentucky9 where he served travelers in the pre-interstate era. In 1952, when a new interstate
highway bypassed his restaurant, Colonel Sanders began his chicken franchising business as he traveled
from town to town across the United States. If restaurant operators liked his chicken recipe, he entered into
agreements under which they could use his process for five cents per chicken sold. In twelve years,
Colonel Sanders amassed over 600 franchises in the United States and Canada. He sold his business in
1964 to a group led by Jack Massey and John Y. Brown, retaining a consulting and public spokesman role
with the new investors. Brown and Massey rapidly developed the business and took it public in 1969. In 1971, The Kentucky
Fried Chicken Corporation was acquired by Heublein, Inc. At that time, the company had grown to more
than 3,500 company-owned and franchised units around the world. In 1982, RJR Nabisco, Inc. (RJRN)
acquired Heublein and with it Kentucky Fried Chicken. Under RJRN, Kentucky Fried Chicken began a
rapid unit development program. In 1986, PepsiCo acquired Kentucky Fried Chicken from RJRN to
complement its restaurant operations.
9 See http://www.kfc.com/about/colonel.htm
©2004 by KPMG LLP, the U.S. member firm of KPMG International, a Swiss cooperative. 10 All rights reserved. KPMG and the KPMG logo are registered trademarks of KPMG International, a Swiss cooperative.

KPMG /University of Illinois Business Measurement Case Development and Research Program November 2004
PepsiCo changed the name of the company from Kentucky Fried Chicken to KFC® to reflect broader
product offerings such as Rotisserie Chicken.10 With 1996 system sales of $8.2 billion, KFC represented
approximately 41 percent of Tricon’s revenue base. Average annual sales were $775,000 per U.S. location.
Dinners generated 66 percent of these revenues, lunches another 31 percent and snacks represented the
final 3 percent.
Market Share. At the time of the case, KFC, with a 55 percent U.S. market share, was the domestic and
international leader in the chicken segment of the QSR industry. Competitors included Popeye’s, Church’s,
independents and several regional
brands.
Brand Image. The KFC brand is evident
in several ways. First, the Colonel
serves as an icon in representing the
brand to consumers. A second brand
dimension is the distinctive packaging
of the product in buckets. The red and
white colors used in the packaging are
consistent with the color schemes used
in every KFC location. Consistency in brand image and a focus on the family enables KFC to reinforce
brand identity with each consumer interaction.11
Product Offerings. Colonel Sanders’s initial product, now referred to as Original Recipe,®consisted of
fried chicken prepared with his secret blend of 11 herbs and spices. In addition to Original Recipe, KFC
restaurants offer other fried and unfried chicken-on-the-bone products sold as Extra Tasty Crispy ® and
Tender Roast.® Other entrée items include Chunky Chicken Pot Pies, Colonel’s Crispy Strips® and
various chicken wing products. Food items other than entrées include biscuits, mashed potatoes and gravy,
coleslaw, corn-on-the-cob, desserts and nonalcoholic beverages. Each KFC location employs a cook
whose sole responsibility is to prepare chicken that is ready-to-serve when the customer enters the
establishment.
10 Ibid. 11 Ross, C. & L. Kramer, “Consolidation by Tricon Shifts TV Marketplace,” Advertising Age (February 9, 1998).
©2004 by KPMG LLP, the U.S. member firm of KPMG International, a Swiss cooperative. 11 All rights reserved. KPMG and the KPMG logo are registered trademarks of KPMG International, a Swiss cooperative.

KPMG /University of Illinois Business Measurement Case Development and Research Program November 2004
Initial Investment and Franchise and Other Fees. In 1997, franchisees had to pay KFC an initial franchise
fee of $25,000. This fee granted the franchise an option to obtain a KFC franchise for a particular area,
subject to franchisee performance of all conditions in the Franchise Agreement. KFC estimated that a new
franchisee had to invest between $1.1 and $1.7 million to acquire real property, construction and leasehold
improvements, equipment and signage, opening advertising, opening inventory, utility deposits, business
licenses and initial training. Monthly, franchisees remit to KFC a 4 percent royalty on the franchisee’s gross revenues. Gross revenues
include all receipts from the KFC outlet’s sale of products and services less taxes paid and sales promotion
discounts. In addition, franchisees expend 5 percent of gross sales for advertising purposes, which include
3 percent of gross revenues for local advertising and 2 percent of gross revenues to the National
Advertising Cooperative to support national campaigns. Most franchisees belong to local advertising co-
ops of KFC franchises that coordinate local advertising expenditures. Venues. Although KFC emphasizes consistency in product offerings and brand image, KFC outlets employ
a variety of distribution formats. At the time of the case, 71 percent of revenues were from carryout sales,
with 29 percent from dine-in customers. The standard KFC outlet is a stand-alone building on well-
traveled streets with good ingress/egress, good visibility and ample parking. Tricon also develops dual-
brand locations in which a KFC restaurant incorporates either a Taco Bell or Pizza Hut. In most cases, the
KFC unit sells the other Tricon brand on a limited-menu or express basis. Tricon also is developing
nontraditional settings (e.g., airports) that serve limited menus of each of its brands. Distribution. At the time of the case, the KFC distribution system consisted of 10,237 stores located in 79
countries. The United States had 5,120 stores―683 franchisees operated 3,190 U.S. stores and licensees
operated 80 U.S. stores. The Association of Kentucky Fried Chicken Franchisees advances the mutual
interests of the franchisee community.12 In 1997, the largest franchisee operated 250 locations, but half of
the franchisees owned one or two locations. More than 5,000 KFC outlets were outside of the United
States.
12 See http://www.akfcf.com.
©2004 by KPMG LLP, the U.S. member firm of KPMG International, a Swiss cooperative. 12 All rights reserved. KPMG and the KPMG logo are registered trademarks of KPMG International, a Swiss cooperative.

KPMG /University of Illinois Business Measurement Case Development and Research Program November 2004
In 1997, significant international markets included: 13
Table 2 Country Units Country Units
Canada 866 Thailand 190
Japan 1041 South Korea 124
United Kingdom 410 Mexico 157 Australia 459 China 216
South Africa 362 New Zealand 92
Taco Bell® Glen Bell opened the first Taco Bell restaurant in Downey, CA in 1962. Bell had success operating various
drive-ins and Mexican restaurants in Southern California beginning just after World War II. He introduced
tacos as an alternative menu item in his Bell’s Drive-In located in San Bernardino, where the McDonald
brothers started their first hamburger unit. Before starting his Taco Bell chain, Bell started and sold a
Mexican restaurant chain called El Tacos.
Taco Bell opened its 100th unit in 1966, its first franchised unit in 1967 and its first international unit
(Guam) in 1977. In 1969, Taco Bell became a public company. Bell resigned as Chairman in 1975 and
PepsiCo acquired Taco Bell in a merger
transaction in 1978. In 1988, Taco Bell
introduced its value initiative by
lowering the price of new food items,
providing free drink refills and adopting
a three-tier pricing structure. (See
http://www.tacobell.com.)
Taco Bell, with annual system sales of
$4.4 billion, accounted for 22 percent of
Tricon’s sales. Lunches accounted for
49 percent of Taco Bell’s revenues, with
45 percent from dinners and the
remaining 6 percent from snacks. Irvine, CA serves as the headquarters for the brand.
13 Oakes, P., “Analyst In-Depth Report: Tricon Global Restaurants,” Merrill Lynch Analyst Report (February 13, 1998).
©2004 by KPMG LLP, the U.S. member firm of KPMG International, a Swiss cooperative. 13 All rights reserved. KPMG and the KPMG logo are registered trademarks of KPMG International, a Swiss cooperative.

KPMG /University of Illinois Business Measurement Case Development and Research Program November 2004
Market Share. At the time of the case, Taco Bell dominated the Mexican food segment of the QSR
industry with a 72 percent market share. Del Taco, Taco John’s, Taco Time and Taco Bueno were the
closest competitors in this market. Beyond the Mexican food segment, Taco Bell views restaurants in the
hamburger and sandwich QSR as competition, with hamburger chains being its primary competition. Taco
Bell was third in the sandwich category with 9.6 percent share, behind McDonald’s (35.3%) and Burger
King (16.3%) but slightly ahead of Wendy’s (9.4%).14
Brand Image. The brand logo is a distinctive bell displayed in virtually all consumer materials. In addition,
the restaurant buildings offer a unique style that consumers immediately associate with the Taco Bell
brand.15 Taco Bell copyrights many new product names and promotional concepts (e.g., Nachos
BellGrande®). Taco Bell emphasizes a youthful image throughout its marketing efforts. Many ads feature
young people in thrill-seeking activities (e.g., white water rafting). In addition, the brand is a Gold sponsor
of the X Games⎯a series of events developed by ESPN for a youthful audience. Product Offerings. Taco Bell offers Mexican style foods, including various types of tacos, burritos, salads
and nachos. Taco Bell prepares food on a made-to-order basis. All ingredients are placed on a assembly
tray from which employees make each of the products. Initial Investment and Franchise and Other Fees. At the time of the case, franchisees paid Taco Bell an
initial franchise fee of $45,000. The initial franchise fee is part of the general revenues for Taco Bell and is
not set-aside for any particular purpose. Taco Bell estimated that a new franchisee had to invest between
$236,000 and $503,000 to acquire and develop rental property, purchase equipment and apply the décor.
The initial investment also covers signage, cash control systems, initial inventory and working capital and
deposits, permits and licenses. Franchisees pay Taco Bell a monthly franchise fee of 5.5 percent of gross
sales. Gross sales are all payments received for sales and services excluding only sales taxes, employee
meals, over-rings and refunds to customers. In addition, each franchisee pays 4.5 percent of gross sales in
marketing fees (i.e., advertising expenditure) with 3 percent going into a Universal Fund for national
advertising and 1.5 percent going to the local advertising association of Taco Bell restaurants. The Taco
Bell Franchisee Advisory Management Council pursues franchise interests. Venues. Taco Bell primarily relies on stand-alone restaurants to market its products. Carryouts generate 59
percent of sales with the remaining 41 percent coming from dine-in customers. The company embarked on
a campaign in which Taco Bell Express is available in a variety of nontraditional venues such as gasoline
14 NRN Research, “Top 100 Chains Ranked by U.S. Systemwide FoodService Sales,” Nation’s Restaurant News (June 22, 1998)
p. 86. 15 Ross, C. & L. Kramer, “Consolidation by Tricon Shifts TV Marketplace,” Advertising Age (February 9, 1998).
©2004 by KPMG LLP, the U.S. member firm of KPMG International, a Swiss cooperative. 14 All rights reserved. KPMG and the KPMG logo are registered trademarks of KPMG International, a Swiss cooperative.

KPMG /University of Illinois Business Measurement Case Development and Research Program November 2004
stations. In addition, at the time of the case, there were 354 units where Taco Bell offered a limited menu
as a complement to the full KFC®menu.
Distribution. At the time of the case, the Taco Bell distribution system consisted of 6,841 restaurants
operating primarily in the United States of which 261 franchisees managed 2,826 units. The two largest
franchisees owned 111 and 100 units, respectively. In 1997, the average franchisee owned 8 stores and in
1996, the average sales per store was $886,000. Internationally, Taco Bell had 173 locations⎯72 owned
by the corporation, 67 franchisee-owned and 34 operated by licensees. Canada had 105 of the international
units with the remaining units in Honduras, Egypt, Poland, Guatemala and Saudi Arabia.16
Pizza Hut® In 1958, brothers Frank and Dan Carney, college students in Wichita, Kansas, borrowed $600 and opened
the first Pizza Hut restaurant in their hometown. The pizza parlor was a new concept at that time. The
brothers incorporated the business and opened the first franchised unit in 1959. By 1968, Pizza Hut opened
its first international unit in Canada and was serving pizzas to one million people a week in 310
restaurants. In 1972, the company went public and opened its 1,000th restaurant. PepsiCo acquired the company through a merger in 1977 as Pizza Hut opened its 3,000th restaurant. In
1986, Pizza Hut initiated a delivery service, an idea that would rapidly expand its system and sales. Pizza
Hut, with $7.5 billion in
worldwide system sales in 1996,
accounts for 37 percent of Tricon
revenues. Restaurants average
$620,000 in annual sales with 74
percent generated at dinner, 23
percent at lunch and the remainder
during snack time. Pizza Hut’s
headquarters are in Dallas, Texas.
Market Share. At 22 percent,
Pizza Hut boasted the largest
market share in the pizza segment
16 Oakes, P., Merrill Lynch Analyst Report (February 13, 1998).
©2004 by KPMG LLP, the U.S. member firm of KPMG International, a Swiss cooperative. 15 All rights reserved. KPMG and the KPMG logo are registered trademarks of KPMG International, a Swiss cooperative.

KPMG /University of Illinois Business Measurement Case Development and Research Program November 2004
of the U.S. QSR industry in 1997. Domino’s, Little Caesar’s, and Papa John’s were the largest national
competitors in the industry. In addition, several regional brands competed aggressively in this market. Brand Image. Pizza Hut’s brand image focuses on a youthful audience. The distinctive Pizza Hut logo and
the red roof associated with the company’s traditional pizzeria-style restaurant represent the brand.
Promotional activities focus on sports-oriented and youthful audiences. Pizza Hut’s ads associate its
products with professional football, basketball and baseball. In addition, it is a corporate sponsor of the
NCAA basketball tournaments.17 Product Offerings. Pizza Hut product offerings include a variety of pizzas, appetizers, pasta, sandwiches,
desserts, alcoholic and nonalcoholic beverages. At Pizza Hut, product preparation varies by venue.
Pizzerias make pizzas after the customer places an order. By contrast, express and dual-branded locations
make personal pan pizzas ahead of time. Initial Investment and Franchise and Other Fees. At the time of the case, franchisees paid Pizza Hut an
initial fee of $25,000. The initial franchise fee is part of the general revenues for Pizza Hut and is not set-
aside for any particular purpose. In 1997, Pizza Hut estimated that a new franchisee invested between $268
thousand and $1.0 million to acquire property (the cost varies depending on location, size and whether it is
leased or owned), equipment, signage, computer systems, initial inventory and working capital, start-up
advertising and various deposits, permits and licenses. Franchisees pay Pizza Hut a monthly franchise fee
of 6.5 percent of gross sales. Gross sales are all revenue received at franchised restaurants excluding only
sales taxes. In addition, franchisees pay 3 percent of gross sales as dues to the International Pizza Hut
Franchise Holders Association (IPHFHA). Franchisees also must pay 3 percent of gross sales for national
advertising, but Pizza Hut credits any IPHFHA dues toward this national advertising obligation. Finally,
franchisees must spend 1 percent of gross sales on local advertising. Venues. Pizza Hut operates in several formats. The traditional Pizza Hut location is a freestanding pizzeria
with a prominent red roof. Of these outlets, 37 percent are exclusively casual dining restaurants, and
another 29 percent offer delivery in addition to dine-in facilities. The remaining 34 percent are Delco
(Delivery/Carry-out) stores that offer no dine-in facilities and a subset of menu items. Dessert, pasta and
sandwich items are not available in this venue. Tricon uses Pizza Hut Express locations in conjunction
with other Tricon brands in stand-alone facilities or nontraditional locations (e.g., airports). The settings
for the Express locations emphasize immediate product delivery. Consequently, these locations primarily
serve personal pan pizzas with fewer choices of toppings (i.e., cheese or pepperoni).
17 Ross & Kramer, Advertising Age (February 9, 1998).
©2004 by KPMG LLP, the U.S. member firm of KPMG International, a Swiss cooperative. 16 All rights reserved. KPMG and the KPMG logo are registered trademarks of KPMG International, a Swiss cooperative.

KPMG /University of Illinois Business Measurement Case Development and Research Program November 2004
Distribution. At the time of the case, Pizza Hut’s distribution network consisted of 12,534 outlets in more
than 90 countries. There were 8,698 restaurants in the United States of which 3,823 were company
operated, 3,581 were franchisee operated, and the remaining 1,793 were licensee operated. The U.S.
franchise network was concentrated among 129 franchisees and the IPHFHA operated to serve the
interests of this group. In 1997, the average franchisee owned 22 locations and the largest franchisee had
684 locations. More than 3,800 outlets were outside the United States. Significant international markets
included:18
Table 3 Country Units Country Units
Canada 551 Japan 225
United Kingdom 468 Australia 397
South Africa 18 Thailand 104
South Korea 139 Mexico 100
China 25 New Zealand 49
Taiwan 84 Brazil 99
Poland 48
Tricon International Since late 1994, PepsiCo consolidated the international operations of its three restaurant concepts into a
separate international division to improve focus and scale. Headquartered in Dallas, Tricon Restaurants
International (TRI) focuses on generating system growth through franchises, while concentrating its
development of company-operated stores in markets with sufficient scale.
In 1997, TRI accounted for 13 percent of
the $160 billion global QSR market and
operated in 102 countries and territories
with more than 9,000 stores and 120,000
employees. While the company has units
throughout the world, Asia Pacific
represented the largest share of its
international units. Asia Pacific was the
largest contributor to revenues and profits
with 45 percent and 34 percent,
respectively. At the time of the case, TRI operated company-owned restaurants in 27 countries but planned
18 Oakes, P., Merrill Lynch Analyst Report (February 13, 1998).
©2004 by KPMG LLP, the U.S. member firm of KPMG International, a Swiss cooperative. 17 All rights reserved. KPMG and the KPMG logo are registered trademarks of KPMG International, a Swiss cooperative.
KPMG /University of Illinois Business Measurement Case Development and Research Program November 2004
to reduce that number to 16 countries by selling units to franchisees by the end of 1999. Strategic growth
of equity business would focus on a few markets such as China, Mexico, Taiwan, Thailand, Korea and the
United Kingdom. TRI developed new global systems and tools to improve marketing, operations
consistency, product delivery, market planning and development, franchise support and store-level team
building capabilities.
Tricon’s Business Processes Tricon’s passion is to put a YUM on people’s faces around the world with food they crave at comeback
prices and high-quality service provided by customer-focused teams. Core business processes,
implemented to achieve these objectives, include restaurant operations, brand and image delivery,
franchising and product development. Resource management processes include refranchising, accounting
and finance, legal and regulatory, information systems, supply chain management and purchasing, property
management and human resources management.
Core Processes Restaurant Operations. Tricon’s three restaurant brands strive to satisfy customers with quality products,
fast and friendly service and a clean environment. The restaurant general manager (RGM) is Tricon’s
recognized key to well-run, efficient and profitable restaurants. The RGM is responsible for customer
satisfaction, team building and development, product preparation, store level procurement and restaurant
cleanliness. In addition to the RGM, the restaurant team includes one or two assistant managers, shift
supervisors and a crew of twenty or so team members, many of whom are part-time employees. RGMs
recruit team members and develop them primarily using in-store training programs. RGMs implement
local store marketing programs developed by marketing personnel at the brands’ respective Restaurant
Service Centers (brand headquarters). Local store marketing generally consists of regional price discounts,
promotion items, etc.
Workstations in the restaurant offices tie into the cash register and computer hardware in the respective
Restaurant Support Center. RGMs deposit daily sales proceeds into local bank accounts and collect
information on payroll and vendor invoices that is mailed to the support centers or electronically polled.
They also assist in producing restaurant-level annual budgets, and each RGM receives a monthly P&L
(income statement) and other reports to facilitate managing the financial aspect of the unit. Area coaches
are responsible for overseeing RGMs and support approximately ten restaurants each. They, in turn, report
to the respective brands’ vice president of operations for the support centers.
©2004 by KPMG LLP, the U.S. member firm of KPMG International, a Swiss cooperative. 18 All rights reserved. KPMG and the KPMG logo are registered trademarks of KPMG International, a Swiss cooperative.

KPMG /University of Illinois Business Measurement Case Development and Research Program November 2004
Brand and Image Delivery. The goals of this process are to enhance customer brand awareness and the
associated brand images and, thereby, raise the inherent brand value. The process involves product
offerings, preparation methods, strategies for promotions and advertising, pricing, determining distribution
formats, and location and service issues. Each restaurant concept maintains a marketing department in its
respective Restaurant Support Center. The marketing departments are responsible for developing local and
national TV advertising, point-of-sale materials and Web-based advertising. They work closely with
personnel in restaurant operations to implement promotional campaigns and with research and
development for product development, quality assurance and operating manuals. Marketing assists human
resources with training and assists franchised outlets.
Tricon determines the effectiveness of brand and image delivery activities using various measures. Sales
revenue, same-store sales, sales-by-product and sales-by-hour are various measures of promotion
effectiveness. The concepts also use various indirect measures of brand awareness and image including
focus groups, consumer taste tests and direct customer feedback systems. The concepts use mystery
(anonymous) shopper programs to assess attributes thought to affect brand image and delivery⎯attributes
such as product quality, restaurant cleanliness, employee courtesy and speed of service.
Franchising. Tricon seeks franchisees with entrepreneurial skills, proven management experience,
adequate financial resources and commitment to customer service. The selection process involves the
candidate completing a detailed application and personal interviews. Franchise development includes on-
the-job training and training in restaurant and business planning techniques. In-restaurant and classroom
programs are paid for by the franchisee. Costs involved in franchising, all of which are borne by the
franchisee, vary based on the site and cost of construction. Tricon management looks for an investment of
at least $250,000 per unit from franchisees, but the amount could be greater depending on the concept,
venue and property ownership costs. Tricon provides no financing to franchisees. It does provide site
selection assistance and construction and design consulting. The refranchising process is separate but
related to this process.
Product Development. Each Restaurant Support Center has research and development (R&D) staff
responsible for new product development and product extensions. R&D develops recipes for new products
and works with existing recipes to optimize product quality and profitability. R&D also develops
nutritional information for consumers. Product development conducts product taste tests with Restaurant
Support Center personnel and consumer focus groups. Beyond recipes, new products often require new or
different equipment. R&D tests equipment to determine proper product preparation, equipment safety and
adequate fit within the restaurant facility. R&D identifies suppliers for new product ingredients and
©2004 by KPMG LLP, the U.S. member firm of KPMG International, a Swiss cooperative. 19 All rights reserved. KPMG and the KPMG logo are registered trademarks of KPMG International, a Swiss cooperative.
KPMG /University of Illinois Business Measurement Case Development and Research Program November 2004
equipment and negotiates for price and quality. It also operates the quality assurance process to assess the
quality of food items and monitors restaurant cleanliness programs.
Resource Management Processes
Refranchising The objective of refranchising is to create a strong restaurant system by placing restaurants in the hands of
operators who have superior local knowledge. This process became more important strategically with the
spin-off and Tricon’s need for cash to retire its $4.5 billion spin-off debt. The company’s goal, in 1997,
was to rebalance the restaurant system toward franchisees and thereby reduce company ownership to
approximately 20 to 25 percent of the U.S. system. In addition, this process sought to create a vehicle for
rapid franchisee growth in an era of economic expansion, available financing and strong franchisee
demand. At the time of the case, many of the existing company-owned units were in need of investment
for refurbishing and remodeling. Refranchising is one way to leverage franchisee investment. The process
also leverages franchisee operating expertise for units that are in outlying (nonmetro) areas and are low-
volume and low-margin and difficult to manage within the restaurant operations structure.
Personnel in acquisitions and divestitures and personnel in other areas execute the refranchising process.
Staff in operations, franchise, finance and development meet at least annually to discuss each unit’s need
for investment and operating performance and to update unit information in a regional playbook. The
information in the playbook is used to identify candidates for, and the mode of, divestiture. For example,
units with low operating performance, outlying physical location and/or heavy reinvestment requirements
are candidates for refranchising. Concept management (including the board of directors, if necessary)
approves refranchising candidates. Refranchising staff frequently package candidate units in groups of five
to ten to make them attractive for franchisee investment.
Once the staff has a targeted group of units, the refranchising process, guided by a franchise transition
manual and deal checklist, includes the following:
Identify potential buyers, most of whom are existing Tricon franchisees, by geography, existing
relationships, financial capability and desire to grow.
Prepare bid packages containing the offering overview, map, facilities information, sales summary, selected unit fixed costs and a draft of the asset-purchase agreement.
Send bid packages to identified buyers that include requests to submit an offer price, business and development plans for the units, financing plans and to review a draft of the asset purchase agreement.
©2004 by KPMG LLP, the U.S. member firm of KPMG International, a Swiss cooperative. 20 All rights reserved. KPMG and the KPMG logo are registered trademarks of KPMG International, a Swiss cooperative.
KPMG /University of Illinois Business Measurement Case Development and Research Program November 2004
Analyze received bids using a shareholder value-creation model to assess returns.
Select the successful bidder and negotiate terms of sale.
Complete due diligence procedures by the seller and buyer.
Approve contract for sale by concept management and board of directors (if necessary) and schedule contract closing.
Make an announcement to Tricon operations personnel (including unit and area staff) and commence transition procedures to ensure a smooth change of ownership.
Sign final capital expenditure documents, confirm lender commitments and complete closing procedures.
Complete post-closing procedures including settlement for closing date inventory, cash funds and other adjustments, uninstall the company cash register and information system and pay performance bonuses to restaurant and area managers.
Tricon obtains financing commitments from major lenders to support refranchisee acquisitions and
guarantees the commitment up to a total of $10 million. However, lenders look to the underlying
economics of each deal to assess loan collectibility. Franchisees are free to arrange alternative financing
sources. A refranchising transaction generates cash from the sale of assets and initial franchise fees, as well
as continuing royalties on the refranchised units’ future gross sales. Tricon records gains and losses on
these transactions in accordance with the company’s policy on restaurant sales.
Supply Chain Management and Purchasing In 1996, PepsiCo combined the worldwide procurement for restaurant food, supplies and equipment into
an internal organization called Smartsourcing. The purpose of this organization was to “ensure a consistent
supply of high quality food, ingredients and other supplies at attractive prices to all of its concepts.” The
Smartsourcing organization identifies vendors, negotiates purchase contracts and purchases restaurant
commodities and supplies around the world. It also monitors market conditions, develops vendor
relationships and attempts to procure necessary items at the lowest cost. Smartsourcing also enters into
commodity hedging contracts to minimize the effect of fluctuations in food prices.
While Smartsourcing performs procurement for company-owned restaurants, Pepsi Food Services (PFS)
handles distribution to individual U.S. restaurants. PFS also delivers products and services to many Pizza
Hut and Taco Bell franchisees. KFC franchisees exclusively use the KFC National Purchasing Co-op. In
May of 1997, all three Tricon concepts entered into separate five-year distribution agreements with PFS
for delivery of food, restaurant supplies and equipment.19 Tricon also has a multi-year agreement with
19 PepsiCo sold PFS in May 1997 to Ameriserv Food Distributors, Inc.
©2004 by KPMG LLP, the U.S. member firm of KPMG International, a Swiss cooperative. 21 All rights reserved. KPMG and the KPMG logo are registered trademarks of KPMG International, a Swiss cooperative.

KPMG /University of Illinois Business Measurement Case Development and Research Program November 2004
Pepsi-Cola to sell Pepsi-Cola beverages in company-owned restaurants, and most franchisees also serve
Pepsi products in their restaurants.
At the time of the case, Tricon was developing a combined purchasing cooperative to replace the function
performed by Smartsourcing. The objective of a unified purchasing co-op is to leverage the significant
purchasing power of Tricon’s 30,000 restaurants, which have combined annual purchasing volume of
nearly $4 billion. Tricon planned to form the unified co-op through agreements with franchisees, the
existing concept co-ops and representatives of franchisees for all three brands. The company also planned
to govern the unified co-op. Tricon then would transfer many of the employees of Smartsourcing to the
unified co-op to maintain continuity.
Information Management and Technology Efficient and effective management of restaurants requires technology and information systems. An ideal
restaurant includes an accurate and paperless information system, a smooth and continuous just-in-time
product flow, electronic funds transfer and controls and automated product preparation. The benefits of a
highly automated restaurant include cheaper, fresher food, less storage space, fewer product shipment
errors, less time spent with distributors and checking stock, more time with customers and less internal
theft. Electronic data interchange (EDI) between restaurants, suppliers and company support centers
translates to less time dealing with traditional paperwork and lowers costs.
Tricon’s restaurant information processing systems have more than 10,500 information technology
applications and embedded technology applications, including third-party purchased and internally
developed software. Information systems at each of the concepts (including overseas locations) are
distinctly different (e.g., point-of-sale (POS) and RGM workstation technology). These differences stem
principally from diverse company cultures, idiosyncrasies in business practices and restaurant products and
variations in RGM compensation policies.
At the time of the case, Tricon was considering developing common in-restaurant and above-restaurant
(general and administrative) systems supported by a shared services approach. Such a consolidation would
involve a common POS platform, developing a common chart of accounts and combining administrative
software for product ordering, payroll, vendor invoices, sales and cash and asset reporting and control. The
benefits of this approach include lower costs, fewer software applications to support, shared business
understanding and higher levels of restaurant support.
©2004 by KPMG LLP, the U.S. member firm of KPMG International, a Swiss cooperative. 22 All rights reserved. KPMG and the KPMG logo are registered trademarks of KPMG International, a Swiss cooperative.

KPMG /University of Illinois Business Measurement Case Development and Research Program November 2004
Legal and Regulatory Tricon’s support functions include its own internal legal department. The legal staff manages all litigation
and claims, assists in contract negotiations and preparation and assists in filings with the SEC. Tricon also
engages outside legal firms for specific litigation. Like many large companies, Tricon is subject to various,
federal, state, local and international laws and regulations. These laws and regulations deal with health,
safety, environmental, labor and employment issues. Domestically, Tricon is required to meet legal
requirements for the public offering of franchises that include filing franchise-offering circulars in various
states. Internationally, the company is subject to laws regarding tariffs and foreign investment. The
company primarily self-insures for most workers’ compensation, general liability and automotive liability
losses, subject to per-occurrence and aggregate annual liability limitations.
From time to time, Tricon or its operating divisions become party to various suits and claims relating to
disputes, taxes, real estate, environmental or employee matters.
Accounting and Finance20 Although by October 1997 functional heads such as the CFO, treasurer, controller and assistant controller
were in place, Tricon had yet to fill many treasury and corporate accounting positions. These vacancies
created significant pressure on existing Tricon employees to perform all of the required cash management,
accounting and reporting tasks. The PepsiCo accounting staff, with assistance from Tricon’s assistant
controller, actually completed the third quarter Form 10-Q filing with the SEC. One of the most important
early objectives for Tricon’s accounting and finance department was to build an organization and fill open
positions. The primary objectives of the accounting processes for the concepts are to provide relevant,
timely and accurate information to management at the lowest cost and shortest cycle time. At the time of
the case, each concept reported unit income statements to its restaurants each period for purposes of RGM
management and control.
Each concept has an accounting department that provides payroll, accounts payable, sales, franchise
royalty, fixed asset, cash management and general ledger accounting in addition to financial planning and
analysis. Each concept also has a tax department, although Tricon files federal tax returns on a
consolidated basis. The concepts use a computer application to submit accounting reports each period for
consolidation by Tricon corporate accounting. TRI collects period reports from foreign locations and
consolidates them into a single international report for further submission to Tricon corporate.
20 Information in this section was obtained from interviews with Mark Noltemeyer, assistant controller, Tricon, June 1999.
©2004 by KPMG LLP, the U.S. member firm of KPMG International, a Swiss cooperative. 23 All rights reserved. KPMG and the KPMG logo are registered trademarks of KPMG International, a Swiss cooperative.

KPMG /University of Illinois Business Measurement Case Development and Research Program November 2004
Having developed independently under PepsiCo, the accounting processes differ in each of the four
operating divisions (including Tricon International). The domestic operating divisions collect sales and
cash management information daily. At the time of the case, KFC was the most automated with a poll-and-
pay system that retrieves payroll, revenue and accounts payable data from the restaurants and returns
period reports and other information to the units. KFC has an automated cash management system that
monitors store-level deposits. Pizza Hut and Taco Bell have combined some of their accounting in a center
in Albuquerque. Their payroll and accounts payable involve more manual functions than KFC’s. In 1997,
Tricon was taking preliminary steps toward consolidating some of the accounting for domestic operating
divisions, as illustrated by the accounting center in Albuquerque.
Property Management Property management includes site development and acquiring and leasing properties for restaurant
locations. Each concept has its own site development process, which sometimes results in competition
between the concepts for sites.
Property management involves the following activities:
Identify and select sites for development.
Qualify and select contractors for building.
Allocate sites between company-owned and franchised.
Manage the construction and build-out.
Perform remodels of existing units.
Post-audit projects for acceptable returns.
Manage lessor relationships.
Dispose of surplus properties.
Tricon assesses performance for this process using such measures as return on investment, budget
variances, restaurant performance and quality of franchisee relationships.
Human Resources Management Tricon maintains a corporate human resources (HR) management function as well as similar functions in
each division.
©2004 by KPMG LLP, the U.S. member firm of KPMG International, a Swiss cooperative. 24 All rights reserved. KPMG and the KPMG logo are registered trademarks of KPMG International, a Swiss cooperative.

KPMG /University of Illinois Business Measurement Case Development and Research Program November 2004
The objectives of the HR process are to:
Create an ownership culture among employees.
Control labor costs while maintaining morale and productivity.
Comply with labor regulations.
Attract, retain and train the labor force.
Manage compensation and benefit programs. HR management operates employee feedback systems and develops formal hiring criteria and training
programs. It also develops market studies to ensure adequate compensation programs. Tricon assesses this
process using measures such as employee turnover, compensation versus the industry, training dollars per
employee, operation response and customer feedback and measures of cultural integration.
Shared Services Shared services combines common business activities at a single location to serve multiple business units
and is customer-focused. This practice has become popular in the United States and in Europe as a means
to reduce costs and improve service delivery.21 At the time of the case, Tricon was considering combining
some of its resource management processes into shared services to achieve economies of scale. Common
business activities for shared services include accounting and finance, information systems, order
management, product development and human resources. The objectives of combining activities into
shared services include better management information, higher service levels, greater flexibility and
standardization in implementing future changes and cost reduction. Shared services redirects professionals’
efforts to decision support and away from more mundane transaction processing. A shared services unit
typically flattens supervision and reduces management layers. Outdated processes and systems and the
need to perform multi-unit analysis and decision-making often motivate shared services. In-place shared
services units also can make it easier to implement best practices in a business organization.22 The difference between a shared services unit and internal centralization is its operation as a separate
business unit. The shared services unit must deliver outstanding service to internal customers, often
through a services agreement between the unit and its users. A shared services unit uses relevant key
performance indicators to measure service quality and obtains and uses feedback from customers to
improve performance. Shared services units often charge internal customers through intercompany
chargebacks or on a transaction basis. Implementation of shared services can be costly, with large upfront
21 The Ernst & Young Report on Shared Services. 22 Sandwell, R. C., “The Shared Service Center: Catalyzing World-Class Performance,” PW Review (December 1997).
©2004 by KPMG LLP, the U.S. member firm of KPMG International, a Swiss cooperative. 25 All rights reserved. KPMG and the KPMG logo are registered trademarks of KPMG International, a Swiss cooperative.

KPMG /University of Illinois Business Measurement Case Development and Research Program November 2004
investments in technology and systems. Other costs include severance for displaced employees, relocation
costs, recruitment and training and business unit resistance. Shared service initiation often is complex and
involves cultural changes within the organization.
Financial Overview As indicated in the financial statement information in Exhibit 3, Tricon’s debt load presented a formidable
challenge. However, Tricon’s restaurant operations generated substantial operating cash flows and Tricon
anticipated additional cash flows to retire debt from refranchising company-owned restaurants to
franchisees.
Restaurant Units At the time of the case, the company’s debt load precluded substantial development of company-owned
units in the near term, although franchise development continued to be viable. PepsiCo began the process
of reducing its percentage ownership of total system restaurants in the three concepts. At year-end 1996,
Tricon owned approximately 44 percent of its restaurants, while competitors such as Wendy’s and
McDonald’s owned approximately 20 percent of their restaurants. The strategy of refranchising company-
owned restaurants generated proceeds that Tricon could use to reduce debt but also improved returns by
reducing assets while generating franchise royalties and initial fees. The sale of low-margin units also
improved the average margin from the remaining restaurants. Tricon’s goal was to reduce company
ownership to approximately 20 to 25 percent.
As indicated in Table 4, the pre-tax income effect of facility actions (closing, subleasing or sale of existing
company-owned units) was a $37 million gain in 1996, made up of $139 million in refranchising gains
from the sale of 640 units offset by $102 million in store closings and impairment charges. Refranchising
activity generated $355 million of cash flow. Cash flow from operations and refranchising, net of capital
spending, totaled $448 million. With the anticipated increase in refranchising activity, Tricon could
generate more than $1 billion in positive cash flow per year and retire its debt in a relatively short period.
Table 4
Net Facility Actions
36 Weeks Ended 9/6/97 1996 1995 1994
Refranchising gains $(203) $(139) $(93) $ 0
Store closings 28 40 38 10
SFAS 121 impairment 39 62 337 0
Net (gain) loss $(136) $ (37) $282 $10
©2004 by KPMG LLP, the U.S. member firm of KPMG International, a Swiss cooperative. 26 All rights reserved. KPMG and the KPMG logo are registered trademarks of KPMG International, a Swiss cooperative.

KPMG /University of Illinois Business Measurement Case Development and Research Program November 2004
While Tricon, in 1997, led McDonald’s by nearly 8,000 restaurants worldwide (29,096 vs. 21,022), its
sales mix from domestic and international restaurants was substantially different. Approximately 80
percent of Tricon’s worldwide sales were from the United States, while McDonald’s generated nearly 60
percent from overseas. This analysis highlights a huge opportunity Tricon had to grow the three concepts
internationally. KFC and Pizza Hut have a significant presence in Asia and the Pacific Rim, but in 1997,
Taco Bell was a relatively unknown concept outside the United States. At the time of the case,
McDonald’s obtained nearly 30 percent of its revenues from franchisees while only 5 percent of Tricon’s
revenues were derived from its franchisees.
Revenues Of course, selling company-owned units decreases total revenues. But in the QSR industry, total revenues
are not thought to be as important as same-store sales. Same-store sales represent the comparative sales for
restaurants open for 12 months or longer. Tricon’s same-store results for 1996 and 1995 were mixed. KFC
sustained same-store sales growth of 6 percent and 7 percent for each of the last two years, driven by new
products. However, Pizza Hut’s same-store sales declined by 4 percent in 1996 and grew 4 percent in
1995. Taco Bell’s same-store sales decreased 2 percent and 4 percent, respectively, in 1996 and 1995.
Tricon management attributed the declines at Pizza Hut and Taco Bell to lower customer transactions.
For the third quarter of 1997, KFC continued its positive same-store sales growth, although at a lower rate.
This growth was largely due to product promotions, favorable effective net pricing, offset partially by
lower transaction counts. Pizza Hut’s same-store sales continued to be below the prior year due to
decreasing transactions and lower average bill-of-fare. Taco Bell’s same-store sales trend reversed as a
result of higher pricing and shifts of product mix to higher-priced products. (See Table 5.)
Table 5
Same-Store Sales Growth (Decrease)
36 Weeks
Ended 9/6/97 1996 1995
KFC -US 2% 6% 7%
Pizza Hut - US (4)% (4)% 4%
Taco Bell - US 3% (2)% (4)%
©2004 by KPMG LLP, the U.S. member firm of KPMG International, a Swiss cooperative. 27 All rights reserved. KPMG and the KPMG logo are registered trademarks of KPMG International, a Swiss cooperative.
KPMG /University of Illinois Business Measurement Case Development and Research Program November 2004
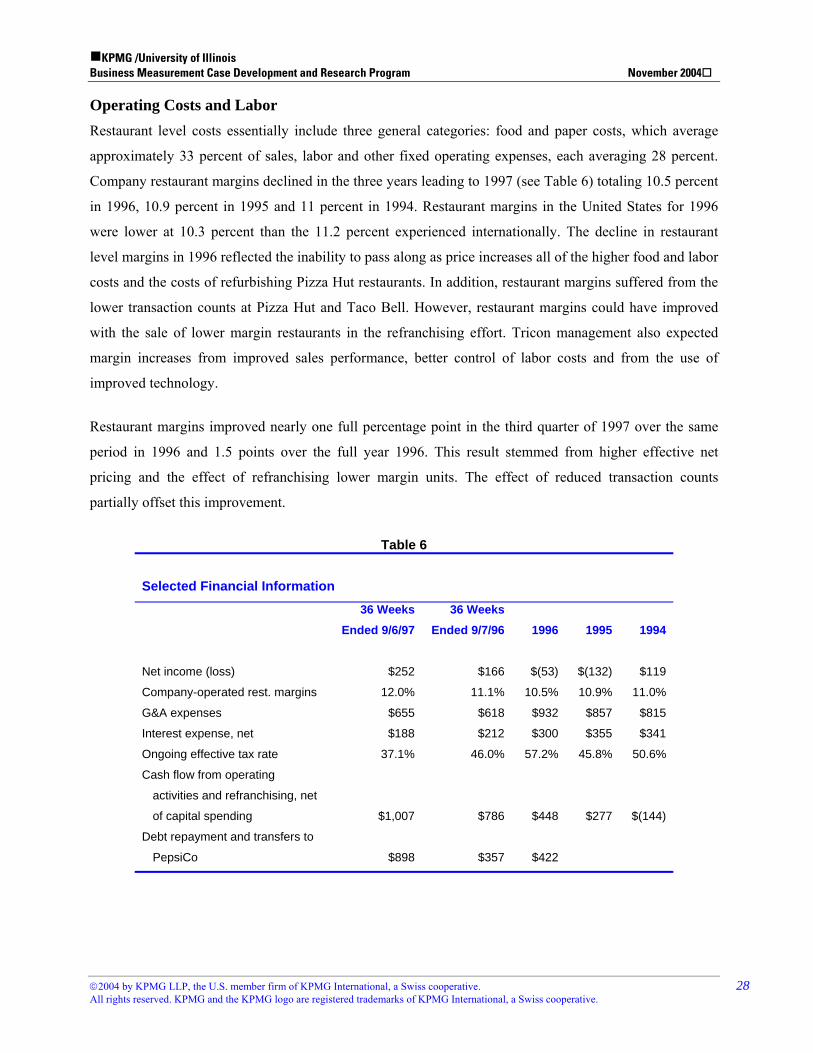
Operating Costs and Labor Restaurant level costs essentially include three general categories: food and paper costs, which average
approximately 33 percent of sales, labor and other fixed operating expenses, each averaging 28 percent.
Company restaurant margins declined in the three years leading to 1997 (see Table 6) totaling 10.5 percent
in 1996, 10.9 percent in 1995 and 11 percent in 1994. Restaurant margins in the United States for 1996
were lower at 10.3 percent than the 11.2 percent experienced internationally. The decline in restaurant
level margins in 1996 reflected the inability to pass along as price increases all of the higher food and labor
costs and the costs of refurbishing Pizza Hut restaurants. In addition, restaurant margins suffered from the
lower transaction counts at Pizza Hut and Taco Bell. However, restaurant margins could have improved
with the sale of lower margin restaurants in the refranchising effort. Tricon management also expected
margin increases from improved sales performance, better control of labor costs and from the use of
improved technology.
Restaurant margins improved nearly one full percentage point in the third quarter of 1997 over the same
period in 1996 and 1.5 points over the full year 1996. This result stemmed from higher effective net
pricing and the effect of refranchising lower margin units. The effect of reduced transaction counts
partially offset this improvement.
Table 6
Selected Financial Information
36 Weeks Ended 9/6/97
36 Weeks Ended 9/7/96 1996 1995 1994
Net income (loss) $252 $166 $(53) $(132) $119
Company-operated rest. margins 12.0% 11.1% 10.5% 10.9% 11.0%
G&A expenses $655 $618 $932 $857 $815
Interest expense, net $188 $212 $300 $355 $341
Ongoing effective tax rate 37.1% 46.0% 57.2% 45.8% 50.6%
Cash flow from operating
activities and refranchising, net
of capital spending $1,007 $786 $448 $277 $(144)
Debt repayment and transfers to
PepsiCo $898 $357 $422
©2004 by KPMG LLP, the U.S. member firm of KPMG International, a Swiss cooperative. 28 All rights reserved. KPMG and the KPMG logo are registered trademarks of KPMG International, a Swiss cooperative.

KPMG /University of Illinois Business Measurement Case Development and Research Program November 2004
Tricon classifies costs above the restaurant level as general and administrative expenses (G&A). Tricon’s
G&A expenses increased each of the two years leading up to 1997. Management attributed the $75 million
increase in 1996 to investment spending for improved customer service and marketing spending. The
customer service initiatives included expanding the number of area coaches supervising restaurants and
providing training support to them. Tricon’s 1996 G&A also includes an allocation of $53 million of
PepsiCo overhead costs, which is not indicative of the costs that Tricon would incur as a stand-alone
company. However, Tricon will need to add financial reporting, shareholder relations and other
administrative processes and staff required to function without PepsiCo corporate support.
Interest expense reflects an allocation of approximately $300 million of PepsiCo interest to Tricon for each
of the years reported in the income statements presented in Table 6. Of course, interest will remain high as
shown in the pro forma income statement as long as Tricon’s debt level remains high. As shown in Table
6, income taxes also were at a high level. For example, the ongoing effective tax rate for Tricon in 1996
exceeded 57 percent, driven principally by high foreign taxes. Tricon incurred foreign withholding taxes
without the benefit of foreign tax credits and had losses in certain foreign countries for which no tax
benefit was available. In addition, the company recorded a valuation allowance in 1996 related to an
expectation that it would not realize certain foreign deferred tax assets. It also entered into a tax separation
agreement with PepsiCo that impacted its post-spin-off tax situation. The effective tax rate declined in the
third quarter of 1997, principally due to a one-time tax-free gain from the refranchising of Tricon’s New
Zealand restaurants. Without the tax-free gain, Tricon’s year-to-date 1997 effective tax rate would have
been 45.9 percent.
At the time of the case, Tricon generated approximately 20 percent of its revenues and operating profits
from its international operations. In 1996, international revenues increased 11 percent and operating profits
improved 30 percent. The revenue increase resulted from more units, higher prices and higher transaction
volumes.
Cash Flows Tricon had projected that during 1997 it would increase its net cash from operating activities by $97
million, or 14 percent, over its 1996 operating cash flow of $713 million. The company projected that net
cash from investing activities would increase $715 million to $466 million in 1997 compared to net cash
used for investing activities of $249 million and $597 million in 1996 and 1995, respectively. The
projected 1997 increase was attributed primarily to an increase in proceeds of $415 million from
refranchisings during 1996 and $186 million from the sale of noncore businesses. Tricon expected that
capital spending would decrease by $79 million or 13 percent.
©2004 by KPMG LLP, the U.S. member firm of KPMG International, a Swiss cooperative. 29 All rights reserved. KPMG and the KPMG logo are registered trademarks of KPMG International, a Swiss cooperative.

KPMG /University of Illinois Business Measurement Case Development and Research Program November 2004
The company also projected that net cash used for financing activities would more than double in 1997 to
approximately $1 billion, primarily reflecting the net payments to PepsiCo. This net use would be partially
offset by the increase in short-term borrowings of $83 million in 1997 versus a decrease of $80 million in
1996 and payments on the revolving credit facility. (See. Table 6.)
Financial Position In addition to the substantial debt load on Tricon’s balance sheet, working capital was significantly
negative. Negative working capital, however, is common in the QSR industry. Restaurant sales are
predominantly cash, and accounts receivable from franchisees for royalties and related services turn
quickly. Inventory levels at restaurants necessarily are low due to the perishable nature of food and limited
storage space available for nonperishable items like paper products. Therefore, restaurant companies look
to the operating cash flow from customer sales to meet their liquidity needs.
Fourth Quarter 1997 Events On December 9, 1997, Tricon announced a $530 million ($425 million after tax) unusual charge primarily
as a result of the impairment of 960 U.S. units and 448 international units that it expected to close or
refranchise. Management undertook these actions to strengthen the company’s asset base and focus on
international development in high-growth markets. Management also anticipated the write-off would
reduce fixed costs in the future so that restaurant margins would benefit. (See press release reprinted in
Exhibit 2.)
The other significant fourth quarter event was the Asian economic crisis in which the currencies of several
Asian countries weakened against the U.S. dollar. Asian countries, with projected 1997 system revenues of
$509 million, represented approximately 37 percent of total international system sales and slightly more
than 50 percent of total international profits. A portion of Tricon’s debt was denominated in foreign
currencies. Historically, Tricon did not use derivative financial instruments to manage exposure to foreign
currency rate fluctuations because the market risk associated with its foreign currency denominated debt
was not considered significant.
©2004 by KPMG LLP, the U.S. member firm of KPMG International, a Swiss cooperative. 30 All rights reserved. KPMG and the KPMG logo are registered trademarks of KPMG International, a Swiss cooperative.

KPMG /University of Illinois Business Measurement Case Development and Research Program November 2004
Concluding Comments Tricon Global Restaurants, Inc., a newly formed company comprising PepsiCo’s spin-off of its three quick
service restaurants (QSR), KFC, Pizza Hut and Taco Bell, commenced operations on October 6, 1997.
Management was challenged with developing and executing a more focused operating strategy. A one-
time write-off of charges arising from closing or refranchising underperforming units paved the way for
improving future return on assets. Opportunities existed for building scale in high-growth markets,
especially in foreign markets, and for obtaining efficiency gains by consolidating certain restaurant support
services and eliminating redundant support functions. Tricon was positioned to reap the benefits of
combining KFC, Pizza Hut and Taco Bell into a stand-alone company that brought opportunities for
innovation and growth.
©2004 by KPMG LLP, the U.S. member firm of KPMG International, a Swiss cooperative. 31 All rights reserved. KPMG and the KPMG logo are registered trademarks of KPMG International, a Swiss cooperative.

KPMG /University of Illinois Business Measurement Case Development and Research Program November 2004
Exhibit I October 7, 1997 Press Release Announcing Spin-Off of Tricon HOT OFF THE PRESS INVESTORS SAY “YUM” TO TRICON STOCK 30,000 KFC, PIZZA HUT AND TACO BELL RESTAURANTS HAVE SPUN OFF FROM PEPSICO TO BECOME WORLD’S LARGEST RESTAURANT COMPANY LIVE SATELLITE TELECAST TO 100 CITIES AROUND THE WORLD UNITES ONE-HALF MILLION KFC, PIZZA HUT AND TACO BELL EMPLOYEES LOUISVILLE, KY, October 7, 1997 (NYSE: YUM) - Quick-Service Restaurant (QSR) history was made today at 9:30 a.m. EST when Tricon Global Restaurants, Inc.
officially began trading shares of common stock on the New York Stock Exchange under the symbol
“YUM.” The company completed its spin-off from PepsiCo, Inc. at the close of business yesterday and
stock has been trading on a when-issued basis since September 17th. Today, Tricon officially becomes the
world’s largest restaurant company in terms of units with nearly 30,000 KFC, Pizza Hut and Taco Bell
restaurants worldwide, $10 billion in revenue and $20 billion in system-wide sales. Tricon is the
worldwide leader in the chicken, pizza and Mexican food categories. Twenty-five million customers visit
Tricon restaurants around the globe each day in 95 countries. “This is a landmark day for Tricon, our more than 500,000 dedicated ‘founding’ employees, franchisees
and shareholders,” said Andrall E. Pearson, Chairman and CEO. “Tricon will be a dynamic competitor in
the marketplace with three of the strongest restaurant concepts in the world, making us one great restaurant
company.” “We are creating a special culture and spirit that appeals to our customers, our shareholders and
our employees. Our goal is to have a company where people come to work every day excited about their
jobs, committed to outstanding results and with a sense of ownership in everything they do,” Pearson
added. “Our recipe for success starts with the belief that everything we do is about putting a ‘YUM’ on people’s
faces, giving them the food they crave at comeback prices, combined with customer-focused teams who
deliver service second to none,” said David C. Novak, Vice Chairman and President.
©2004 by KPMG LLP, the U.S. member firm of KPMG International, a Swiss cooperative. 32 All rights reserved. KPMG and the KPMG logo are registered trademarks of KPMG International, a Swiss cooperative.

KPMG /University of Illinois Business Measurement Case Development and Research Program November 2004
“Tricon will be known for great operations, marketing innovation, delivering the highest quality food, and
superior service by responding to the voice of the customer, not just listening to them. We are creating a
world-class restaurant-based culture that puts people first. Our stores are run by people who know and love
the restaurant business, our Restaurant General Managers are our number one leaders, our franchisees are
our most important partners and our top fifty executives have an average ten years in the restaurant
business,” added Novak. In another industry first, the Tricon stock certificate features portrait engravings of KFC, Pizza Hut and
Taco Bell Restaurant General Managers with the inscription, “Restaurant General Manager is #1,”
reinforcing the importance of the Company’s frontline employees. All headquarter facilities have been
renamed as “Restaurant Support Centers” to underscore this point. Founders’ Day Celebration
Thousands of KFC, Pizza Hut and Taco Bell employees, franchisees and licensees around the world will
be united for the first time today when they participate in a special, “Founders’ Day” celebration that
includes a worldwide satellite teleconference from Louisville, KY between 2:30 p.m. and 4:30 p.m. EST. “Our Founders’ Day celebration marks a great beginning to our $20-billion restaurant company,” said
Novak. “This is the first time that our restaurant management and franchisees from all four companies,
around the world, are united in a single, powerful, common goal, to become one team, building a bright
future for Tricon. There is no better way to align our entire system around Tricon’s ‘Founding Truths’,
which are:
• People Capability First...satisfied customers and profitability follow Respond to the Voice of the
Customer...not just listen
• The RGM is Our #1 Leader...not senior management
• Run Each Restaurant Like It’s Our Only One...avoid the trap of the averages
• Recognition Shows You Care...people leave when you don’t
• Great Operations and Marketing Innovation Drive Sales...no finger pointing
• Operation Discipline Thru Process and Standards...consistency – not “program of the month”
Franchisees are Vital Assets...operate as one system not two
• Quality in Everything We Do...”especially the food”
©2004 by KPMG LLP, the U.S. member firm of KPMG International, a Swiss cooperative. 33 All rights reserved. KPMG and the KPMG logo are registered trademarks of KPMG International, a Swiss cooperative.

KPMG /University of Illinois Business Measurement Case Development and Research Program November 2004
Nearly 100 cities will host individual celebrations while they receive live broadcasts sharing the future
vision of Tricon executives, including: Andrall E. Pearson, Chairman and CEO; David C. Novak, Vice-
Chairman and President; Pete Bassi, President, TRI; Jeff Moody, President and Chief Concept Officer,
KFC; Mike Rawlings, President and Chief Concept Officer, Pizza Hut and Peter Waller, President and
Chief Concept Officer, Taco Bell Corp. Tricon Global Restaurants, Inc. will comprise nearly 30,000 company-owned and franchised restaurants in
95 countries. The Company’s brands - KFC, Pizza Hut and Taco Bell - are the global leaders of the pizza,
chicken and Mexican restaurant categories, respectively. Total worldwide system retail sales for the chains
were more than $20 billion in 1996. Starting today, consumers can visit Tricon Global Restaurants, Inc. on
the Internet at www.Triconglobal.com.
©2004 by KPMG LLP, the U.S. member firm of KPMG International, a Swiss cooperative. 34 All rights reserved. KPMG and the KPMG logo are registered trademarks of KPMG International, a Swiss cooperative.

KPMG /University of Illinois Business Measurement Case Development and Research Program November 2004
Exhibit 2 December 9, 1997 Press Release Announcing One-time Write Off Tricon Global Restaurants (NYSE: YUM) today announced that it will take one-time charges of
approximately $530 million ($425 million after-tax or $2.79 per share) in its fourth quarter to
dramatically refocus its business. The actions will have a one-time negative impact on earnings for the
year. The after-tax charge is largely non-cash and is expected to have a favorable effect on future cash
flows. Andrall E. Pearson, Chairman and CEO, commented: “Our commitment to shareholders was to take
decisive action to drive cash flow and execute a more focused operating strategy. This charge reflects that
commitment. The actions underlying the charge primarily address Tricon’s two biggest strategic issues:
(1) domestically, we are strengthening Pizza Hut’s asset base by closing or refranchising marginal stores
and, (2) internationally, we are focusing to build scale in high growth company markets. The charge will
cover closure of underperforming stores over the next year, writing-down to market value the carrying
value of some of the stores that we intend to refranchise, revaluation of some other investment assets and
reducing the overhead costs related to these operations.” Mr. Pearson continued: “Tricon will end 1997 strongly with low double-digit growth in Operating Profit,
before facility action net gains and these charges, to about $660 million. We regard this as a good start for
Tricon in its initial transition as a freestanding company particularly given the adverse currency impacts of
recent months. Our 1998 earnings estimates remain essentially unchanged reflecting a major improvement
over 1997. Moreover, we expect to continue to grow Operating Profit at least at a low double-digit rate.
The actions we are taking in the quarter will provide significant benefits in 1998. We now have the much-
needed flexibility to make investments in systems technology, including Year 2000, and to cover the
potential adverse effects of currency changes in Asia where we will continue our long-term
market development. Additionally, by being decisive now, we are accelerating certain asset disposal
decisions into 1997 that will give us the potential for a higher level of facility action net gains next year.
Our asset base continues to give us unsurpassed financial flexibility in the restaurant industry.” “We are confident these actions will improve our return on assets and cash flow and result in annual
earnings growth in the mid-teens on average over the next five years.”
©2004 by KPMG LLP, the U.S. member firm of KPMG International, a Swiss cooperative. 35 All rights reserved. KPMG and the KPMG logo are registered trademarks of KPMG International, a Swiss cooperative.

KPMG /University of Illinois Business Measurement Case Development and Research Program November 2004
Details of Charge
U.S International
Units
$MM Pre-
Tax Units
$MM Pre-
Tax
Stores to be refranchised 362 $75 305 $74
Stores to be closed 598 $139 143 $73
Other asset write-downs n/a $12 n/a $128
Other actions n/a $9 n/a $20
Total 960 $235 448 $295
©2004 by KPMG LLP, the U.S. member firm of KPMG International, a Swiss cooperative. 36 All rights reserved. KPMG and the KPMG logo are registered trademarks of KPMG International, a Swiss cooperative.

KPMG /University of Illinois Business Measurement Case Development and Research Program November 2004
Exhibit 3 Tricon Global Restaurants, Inc.
Financial Statements
Income Statements
(Dollars in millions) *Pro Forma **As Reported by PepsiCo
36 Weeks Ended 9/6/97
1996
1996
1995
1994 REVENUES Company-operated restaurants $6,251 $9,347 $9,738 $9,813 $9,170 Franchise and license fees 387 491 494 437 395 Total revenues $6,638 $9,838 $10,232 $10,250 $ 9,565 COSTS AND EXPENSES Food and paper $2,025 $ 3,092 $3,215 $3.242 $3,009 Payroll and employee benefits 1,784 2,663 2,793 2,784 2,642 Occupancy and other expenses 1,703 2,599 2,711 2,713 2,507 Total operating expenses $5,512 $8,354 $8,719 $8,739 $8,158 General and administrative 634 893 932 857 815 Net facility actions (gain) loss ( 136 ) ( 37) ( 37) 402 10 Unusual charges ___ ___ 246 ___ ___ Total costs and expenses $6,010 $9,210 $9,860 $9,998 $8,983 OPERATING PROFIT $628 $628 $372 $252 $582 Interest expense, net 224 320 300 355 341 Income before income taxes $404 $308 $72 $( 103) $241 Income taxes 152 177 125 29 122 Net income (loss) $252 $131 $ ( 53) $( 132) $119
*Note: 1996 pro forma deleted the effect (losses) of certain noncore businesses sold prior to the spin-off and replaces interest expense allocated by PepsiCo with estimated interest expense on the $4.5 billion debt used to settle balances with PepsiCo. According to the press release on the previous page, “Tricon Global Restaurants (NYSE: YUM) today announced that it will take one-time charges of approximately $530 million ($425 million after-tax or $2.79 per share) in its fourth quarter to dramatically refocus its business.” **Note: As disclosed in the 1997 Annual Report, “The accompanying Consolidated Financial Statements present our financial position, results of operations and cash flows as if we had been an independent, publicly owned company for all periods presented. Certain allocations of previously unallocated PepsiCo interest and general and administrative expenses, as well as computations of separate tax provisions, have been made to facilitate such presentation.”
©2004 by KPMG LLP, the U.S. member firm of KPMG International, a Swiss cooperative. 37 All rights reserved. KPMG and the KPMG logo are registered trademarks of KPMG International, a Swiss cooperative.

KPMG /University of Illinois Business Measurement Case Development and Research Program November 2004
Exhibit 3 (Cont’d) Balance Sheets
(Dollars in millions) Pro Forma
3rd Quarter
1997
1996 ASSETS Current assets Cash and cash equivalents $ 169 $ 137 Short-term investments 45 50 Accounts receivable, inventory, and other current assets 600 775 Total current assets $ 814 $ 962 Property, plant, and equipment, net 3,632 4,050 Intangible assets, net 937 1,100 Investments in unconsolidated affiliates 225 228 Other assets 184 180 TOTAL ASSETS $ 5,792 $ 6,520 LIABILITIES AND SHAREHOLDERS’ EQUITY Current liabilities Accounts payable and other current liabilities $ 1,066 $ 1,200 Income taxes payable 249 157 Short-term borrowings 123 59 Total current liabilities 1,438 1,416 Long-term debt $ 4,715 $ 4,770 Other liabilities 438 434 Deferred income taxes 233 200 Total liabilities $ 6,824 $ 6,820 Shareholders’ equity (deficit) Capital deficit ( 956) ( 273) Currency translation adjustment ( 76) ( 27) Total shareholders’ equity (deficit) ( 1,032) ( 300)
TOTAL LIABILITIES AND SHAREHOLDERS’ EQUITY (DEFICIT) $ 5,792 $ 6,520 Note: Pro forma balance sheets deleted the effect of certain noncore businesses sold prior to the spin-off and add the $4.5 billion debt used to settle balances with PepsiCo.
©2004 by KPMG LLP, the U.S. member firm of KPMG International, a Swiss cooperative. 38 All rights reserved. KPMG and the KPMG logo are registered trademarks of KPMG International, a Swiss cooperative.