tropical cyclone report - national hurricane center · web viewhurricane wilma 15-25 october 2005...
TRANSCRIPT

Tropical Cyclone ReportHurricane Wilma
15-25 October 2005
Richard J. Pasch, Eric S. Blake, Hugh D. Cobb III, and David P. RobertsNational Hurricane Center
12 January 2006
Updated 28 September 2006 for one additional fatality in Grand Bahama Island, a revised U.S. damage estimate, and storm surge and damage in Grand Bahama Island.
Wilma formed and became an extremely intense hurricane over the northwestern Caribbean Sea. It had the all-time lowest central pressure for an Atlantic basin hurricane, and it devastated the northeastern Yucatan Peninsula. Wilma also inflicted extensive damage over southern Florida.
a. Synoptic History
Wilma had a complicated beginning. During the second week of October, an unusually large, monsoon-like lower-tropospheric circulation and a broad area of disturbed weather developed over much of the Caribbean Sea. This system appeared to have been enhanced by an extensive area of diffluent flow to the south and southwest of an upper-level cyclone over the southwestern Atlantic. The easternmost portion of this low pressure area moved northeastward and merged with an extratropical cyclone. However, a more concentrated area of disturbed weather and surface low pressure formed near Jamaica by 14 October, possibly aided by a couple of tropical waves traversing the Caribbean during this time. Dvorak satellite classifications were initiated on this system at 1200 UTC 15 October. By 1800 UTC that day the surface circulation became well-enough defined, with sufficiently organized deep convection, to designate that a tropical depression had formed, centered about 190 n mi east-southeast of Grand Cayman. Figure 1 is a “best track” chart of the tropical cyclone’s path, and time series of the wind and pressure are shown in Figs. 2 and 3, respectively. The best track positions and intensities are listed in Table 1.
A weak and ill-defined steering flow prevailed for the first couple of days of Wilma’s existence, with a 500 mb high covering the Gulf of Mexico and another mid-tropospheric anticyclone located well to the east-northeast of the tropical cyclone. The depression moved slowly and erratically westward to west-southwestward for a day or so and then drifted south-southwestward to southward for a day or two. There was only slow strengthening during this period, and the system is estimated to have become a tropical storm at 0600 UTC 17 October. On 18 October Wilma turned toward the west-northwest and, while doing so, strengthened into a hurricane. Later that day, a remarkable, explosive strengthening episode began and continued through early on 19 October. By 0600 UTC 19 October, Wilma’s winds had increased to near 150 kt (category 5 on the Saffir-Simpson Hurricane Scale). In the span of just 24 hours, Wilma had intensified from a 60-kt tropical storm to a 150-kt category 5 hurricane, an unprecedented event for an Atlantic tropical cyclone. It is fortunate that this ultra-rapid strengthening took
1
place over open waters, apparently void of ships, and not just prior to a landfall. Wilma reached its peak sustained wind speed of 160 kt at around 1200 UTC 19 October. During the strengthening episode, Air Force reconnaissance observations indicated that the eye of the hurricane contracted to a diameter of 2 n mi; this is the smallest eye known to National Hurricane Center (NHC) staff. The estimated minimum central pressure at the time of peak intensity is 882 mb, which is a new record low value for a hurricane in the Atlantic basin. Indeed, the actual minimum pressure may well have been lower than this value, as noted in the following section.
Wilma maintained category 5 status until 20 October, when its winds decreased to 130 kt, and the tiny eye was replaced by one about 40 n mi across. Interestingly, the hurricane would retain this large, or an even larger, eye ranging from about 40 to 60 n mi in diameter, for most of the remainder of its lifetime. By 21 October, as mid-level ridging to the northeast of Wilma increased somewhat and a series of shortwave troughs in the westerlies began to erode the high over the Gulf of Mexico, the hurricane turned toward the northwest and north-northwest, taking aim at the Yucatan Peninsula of Mexico. Wilma’s maximum winds were still near 130 kt (category 4 intensity) when its center made landfall on the island of Cozumel around 2145 UTC 21 October, and it was probably only slightly weaker (but still category 4 intensity) when it crossed the coast of the Yucatan peninsula about 6 hours later. On 22 October, the mid-tropospheric high pressure area to the north of Wilma essentially dissipated, and the hurricane moved slowly northward, crossing and severely battering the extreme northeastern Yucatan peninsula. Wilma emerged into the southern Gulf of Mexico around 0000 UTC 23 October, with maximum winds of near 85 kt. Although Wilma’s intensity had been reduced due to its passage over land, it was still a large and powerful hurricane.
A vigorous mid-tropospheric trough, moving eastward from the central United States, provided an increasingly strong southwesterly steering current that accelerated Wilma northeastward toward southern Florida. As the upper-level flow over the hurricane increased, so too did the vertical shear, and by early on 24 October the environmental 850-200 mb shear (averaged over an annulus about 100 to 400 n mi from the center) was roughly 25 kt. Despite the strong shear in its surroundings, Wilma strengthened over the southeastern Gulf of Mexico and its winds reached about 110 kt as it approached Florida. Maximum sustained winds were estimated to be near 105 kt (category 3 intensity) when landfall of the center occurred in southwestern Florida near Cape Romano around 1030 UTC 24 October. Continuing to accelerate and now moving at a forward speed of 20 to 25 kt, the hurricane crossed the southern Florida peninsula in 4.5 hours, with the center emerging into the Atlantic just southeast of Jupiter around 1500 UTC. Maximum winds had decreased to near 95 kt (category 2) during the crossing of Florida. A vigorous cold front associated with the mid-tropospheric trough swept across the area to the west of Wilma, yet the cooler and drier air behind the front could not fully penetrate the inner core of the hurricane to weaken it. Very shortly after departing Florida, the hurricane re-intensified one last time, and its winds again reached 110 kt around 0000 UTC 25 October. Thereafter, Wilma finally succumbed to an unfavorable atmospheric environment and lost strength while racing northeastward at 40-50 kt over the western Atlantic. It became an extratropical cyclone around 0000 UTC 26 October while centered about 200 n mi southeast of Halifax, Nova Scotia. This extratropical low was absorbed by another extratropical cyclone located over eastern Nova Scotia around 0000 UTC 27 October.
2

b. Meteorological Statistics
Observations in Wilma (Figs. 2 and 3) include satellite-based Dvorak technique intensity estimates from the Tropical Analysis and Forecast Branch (TAFB), the Satellite Analysis Branch (SAB) and the U. S. Air Force Weather Agency (AFWA), as well as flight-level and dropwindsonde observations from flights of the 53rd Weather Reconnaissance Squadron of the U. S. Air Force Reserve Command (AFRES) and NOAA Aircraft Operations Center WP-3D aircraft. Microwave satellite imagery from NOAA polar-orbiting satellites, the NASA Tropical Rainfall Measuring Mission (TRMM), the NASA QuikSCAT, NASA Aqua, and Defense Meteorological Satellite Program (DMSP) satellites were also useful in tracking Wilma.
Highest winds measured by the AFRES were 168 kt at a flight level of 700 mb in the southeastern eyewall at 0610 UTC 19 October, when Wilma was over the northwestern Caribbean Sea. Using a standard eyewall reduction factor (ratio of surface to flight level winds of 0.9) yields a surface wind of 151 kt. Since the central pressure was still falling at the time of the last pass of the aircraft through the eye at around 0800 UTC, it is likely that the winds also increased some more from 0800 to 1200 UTC. Therefore the peak intensity of Wilma is estimated to be 160 kt at 1200 UTC 19 October. When Wilma was over the southeastern Gulf of Mexico, and approaching south Florida, the AFRES measured a 700 mb wind of 135 kt at 0646 UTC 24 October, apparently associated with a short-lived mesocyclone in the southeastern eyewall. Because of the strong southwesterly shear, the ratio of surface to flight level winds was probably smaller than that typical for the hurricane eyewall. Therefore the surface to 700 mb wind speed ratio is reduced from the normal 0.9 to 0.8, resulting in an estimated intensity of 110 kt at 0600 UTC 24 October. Subsequent sampling of the southeastern eyewall by the aircraft and Doppler radar observations showed that the winds had diminished somewhat, so the intensity of Wilma at landfall in southwestern Florida has been set at 105 kt.
Wilma’s deepening rate over the northwestern Caribbean Sea, from late on 18 October to early on 19 October, was incredible. Over the period from 2310 UTC to 0433 UTC, the central pressure fell from 954 mb to 901 mb, which is a deepening rate of 9.9 mb per hour. The minimum central pressure measured by dropsonde was 884 mb at 0801 UTC 19 October. Surface winds from this dropsonde were measured to be 23 kt, so the dropsonde probably did not capture the lowest pressure in Wilma’s eye. Therefore the pressure around 0800 UTC was probably a couple of mb lower than 884, estimated at 882 mb. This is the lowest central pressure in the NHC records for the Atlantic basin. Given that the pressure was still falling at this time, it is possible that the pressure then dropped a little below 882 mb. It should be added that the largest 6-, 12-, and 24-h drops in best track central pressure for Wilma, 54 mb from 0000 to 0600 UTC 19 October, 83 mb from 1800 UTC 18 October to 0600 UTC 19 October, and 97 mb from 1200 UTC 18 October to 1200 UTC 19 October, respectively, are by far the largest in the available records for these periods going back to 1851. The previous record 6-h deepening was 38 mb in Hurricane Beulah, September 1967, the previous record 12-h deepening was 48 mb in Hurricane Allen, August 1980, and the previous record 24-h deepening was 72 mb in Hurricane Gilbert, September 1988.
3

Ship reports of winds of tropical storm-force associated with Wilma are given in Table 2, and selected surface observations from land stations and data buoys are given in Table 3. A 10-min average wind of 87 kt with a gust to 113 kt was observed in Cancun, Mexico, but it is not certain if these were the maximum values at that station. Islas Mujeres, very near Cancun, experienced hurricane-force winds in gusts for nearly a 24-h period from 21-22 October.
The highest sustained wind measured at an official surface observing site in Florida was a 15-min average speed of 80 kt from a South Florida Water Management District (SFWMD) observation site, L006, in Lake Okeechobee. It should be noted that another SFWMD platform, LZ40, located only about 5 n mi north of L006 recorded a 15-min wind speed of 79 kt at the same time. It is reasonable to assume that these measurements correspond to a 1-min average wind speed of at least 90 kt. A number of official surface wind observation (ASOS) sites in Miami-Dade and Broward Counties stopped reporting data at their highest noted sustained wind speeds, such as Opa-Locka Airport at 74 kt and Pompano Beach Airport at 72 kt. It is likely that higher sustained wind speeds occurred at these sites. Data from the Miami WSR-88D Doppler radar indicated a peak velocity of 138 kt at an elevation of about 5000 ft over western Broward County. A comparison of Doppler velocities with co-located, official 2-min and 1-min surface wind measurements in Miami-Dade in Broward Counties suggests that the ratios of surface to 5000 ft sustained wind velocities over southeastern Florida in Wilma were likely in the range of 0.65 to 0.70. This would result in a maximum surface wind speed estimate of 90-95 kt.
Based on the surface observations and the Doppler data it can be concluded that most of the southeastern Florida peninsula experienced at least category 1 hurricane conditions, and that some parts of northern Miami-Dade County, Broward, and Palm Beach Counties likely had category 2 hurricane conditions, including wind gusts to near 100 kt, at the standard 10 m height above ground. It is expected that the upper floors of the many high rise buildings in South Florida experienced wind speeds greater than occurred there at 10 m.
Although no measurements of storm surge heights in the area of the northeastern Yucatan Peninsula have been received, it is likely that parts of that area experienced a surge of at least 12 to 15 ft. Significant storm surges likely occurred over portions of extreme western Cuba, but no measurements are available. A storm surge of 4 to 8 ft was reported from coastal Collier Counter. It is likely, however, that higher storm surges occurred over uninhabited areas of southwestern Florida to the south of where Wilma made landfall. Storm surges of 4 to 5 ft were observed over much of the lower and middle Florida Keys, locally to near 7 ft. However, a storm surge of near 9 ft was estimated visually in the Marathon area. Storm surges were generally in the 4 to 5 ft range over the upper Keys. This resulted in considerable flooding over substantial portions of the Keys. Relatively minor storm surge flooding occurred on the Biscayne Bay shoreline of Dade County. Storm surges of 12 ft or more were measured along the southwestern coastal area of Grand Bahama Island.
Wilma produced torrential rainfall as it moved slowly over portions of the eastern Yucatan Peninsula. According to the Meteorological Service of Mexico, a 24-h rainfall total of 62.05 inches was measured at Islas Mujeres. Because the hurricane moved quickly across the southern Florida peninsula, however, the rain amounts were not very large in Florida and storm
4

totals ranged generally from 3 to 7 inches. Some locations in southeast Florida had totals of only 1 to 2 inches -- or less.
Wilma produced 10 tornadoes over the Florida peninsula on 23-24 October: one each in Collier, Hardee, Highlands, Indian River, Okeechobee, and Polk Counties, and four in Brevard County.
Figure 4 is an image of Wilma while it was located over South Florida from the Miami WSR-88D radar. Note the large area that was impacted by the eyewall.
c. Casualty and Damage Statistics
Twenty-three deaths have been directly attributed to Wilma: 12 in Haiti, 1 in Jamaica, 4 in Mexico, 5 in Florida, and 1 in the Bahamas (Grand Bahama Island).
Damage was reported to have been very severe in portions of the northeastern Yucatan Peninsula, but detailed information from Mexico is not available. This dealt a major blow to the tourist industry in that area. There was major flooding from storm surge and/or wave action in portions of western Cuba. In southern Florida, the swath of damage was unusually widespread due to the large size of Wilma’s core. The damage included numerous downed trees, substantial crop losses, downed power lines and poles, broken windows, extensive roof damage, and destruction of mobile homes. Wilma caused the largest disruption to electrical service ever experienced in Florida. Media reports indicate up to 98 per cent of South Florida lost electrical service, and Florida Power and Light reported outages in 42 Florida counties. The amount of total insured damage compiled by the Property Claim Services of the Insurance Services Office, Inc., is $10.3 billion. Using a doubling of insured losses to obtain the total damage gives a current estimate of Wilma’s U.S. damage of $20.6 billion, making Wilma the third costliest hurricane in U.S. history, behind only Katrina and Andrew. There was also significant damage in the southwestern coastal area of Grand Bahama Island, with widespread destruction of roofs and vehicles along with uprooting of poles and trees.
d. Forecast and Warning Critique
Average official track errors (with the number of cases in parentheses) for Wilma were 29 (39), 42 (37), 61 (35), 84 (33), 136 (29), 264 (25), and 382 (21) n mi for the 12, 24, 36, 48, 72, 96, and 120 h forecasts, respectively. For 12 through 72 h, these errors are less than the average official track errors for the 10-yr period 1995-20041, but they exceed the 2001-2004 average errors at 96 and 120 h. There were some large along-track errors in the official forecasts for these longer time ranges; and the along-track biases indicate that the 4- and 5-day NHC forecasts for Wilma were, in general, too fast. Although the track guidance models were in general agreement that Wilma would cross the Florida peninsula, there was considerable spread in predicted forward speed. This was associated with large uncertainty in the timing of the hurricane strike on Florida. Table 4 shows the mean track errors for the various models and model combinations, and for the official forecasts. On average, the most accurate numerical
1 Errors given for the 96 and 120 h periods are averages over the four-year period 2001-4.
5
guidance through 48 h was provided by the Florida State University Superensemble, and for 72 through 120 h by the NCEP Global Ensemble and the United Kingdom Meteorological Office global model. Interestingly, the NCEP Global Ensemble had a mean 5-day track error that was about 100 n mi less than the NCEP Global Forecast System (the parent model of the ensemble).
Average official intensity errors were 11, 18, 22, 22, 30, 27, and 25 kt for the 12, 24, 36, 48, 72, 96, and 120 h forecasts, respectively. These errors are quite a bit larger than the average official intensity errors over the 10-yr period 1995-2004. There was a negative bias (i.e. underforecast of intensity) at all forecast times. As might be expected for such a rapidly strengthening hurricane, there were some very large individual underforecasts of intensity when Wilma was over the northwestern Caribbean Sea – by as much as 80 kt at 48 h. The official forecasts did not explicitly predict Wilma to regain category 3 intensity before hitting Florida, but the NHC Tropical Cyclone Discussions on 22-23 October did note the possibility that the system could again be a major hurricane as it approached the coast of Florida.
Within a day of Wilma’s genesis over the western Caribbean Sea, the Tropical Weather Outlooks issued by the National Hurricane Center anticipated the formation of a tropical depression, including (just prior to genesis) the possibility of development into a hurricane.
Table 5 lists the watches and warnings issued for Wilma. There was considerable lead time in the issuance of the hurricane warnings for the northeastern Yucatan Peninsula, as these warnings were posted well over 48 h prior to landfall in that area. Likewise the hurricane warning for Florida was issued well in advance, 31.5 h before Wilma’s center made landfall there.
e. Acknowledgements
Most of the surface observations in this report were provided by the meteorological services of Mexico and Cuba, and National Weather Service Forecast Offices (NWSFOs) in Key West, Miami, Tampa, Melbourne, Jacksonville and Tallahassee Florida. Dan Brown, Lixion Avila, Jack Beven, James Franklin, Rick Knabb, Max Mayfield, Ed Rappaport, and Stacy Stewart of TPC/NHC provided useful comments. Colin McAdie of TPC/NHC along with Robert Molleda and Pablo Santos of the Miami NWSFO helped to analyze the WSR-88D data. Eric Swartz of the SFWMD helped with the wind observations from the SFMWD network.
6

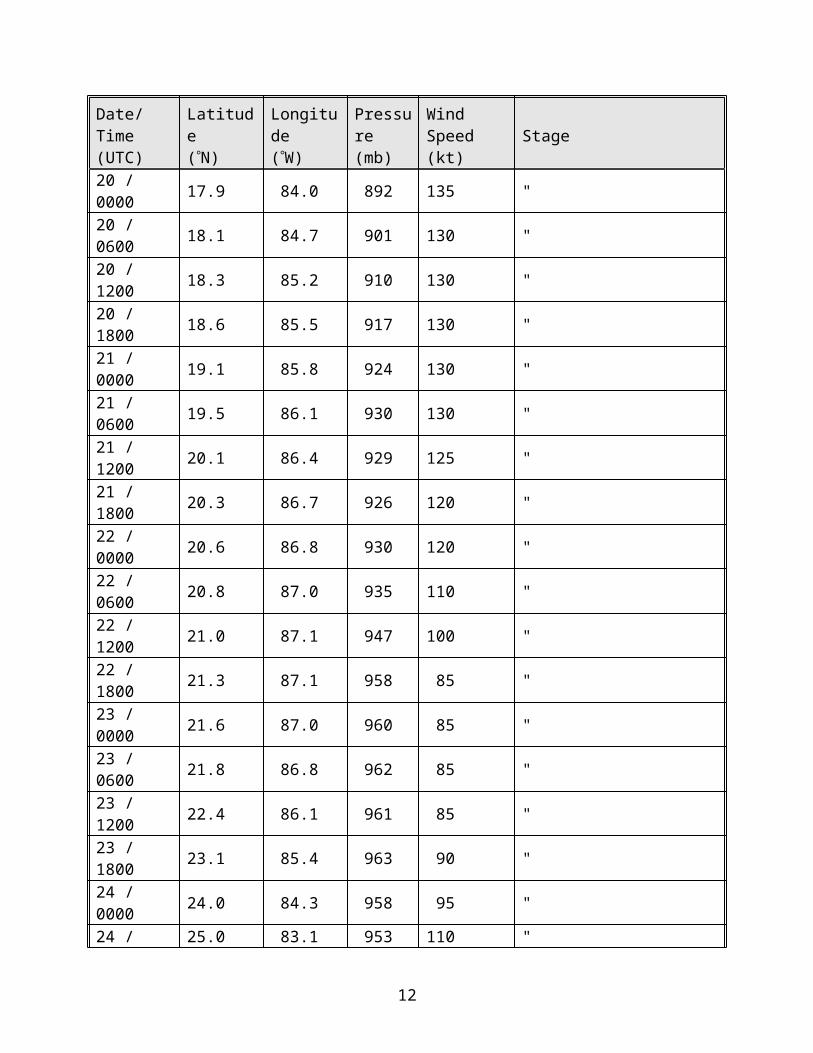
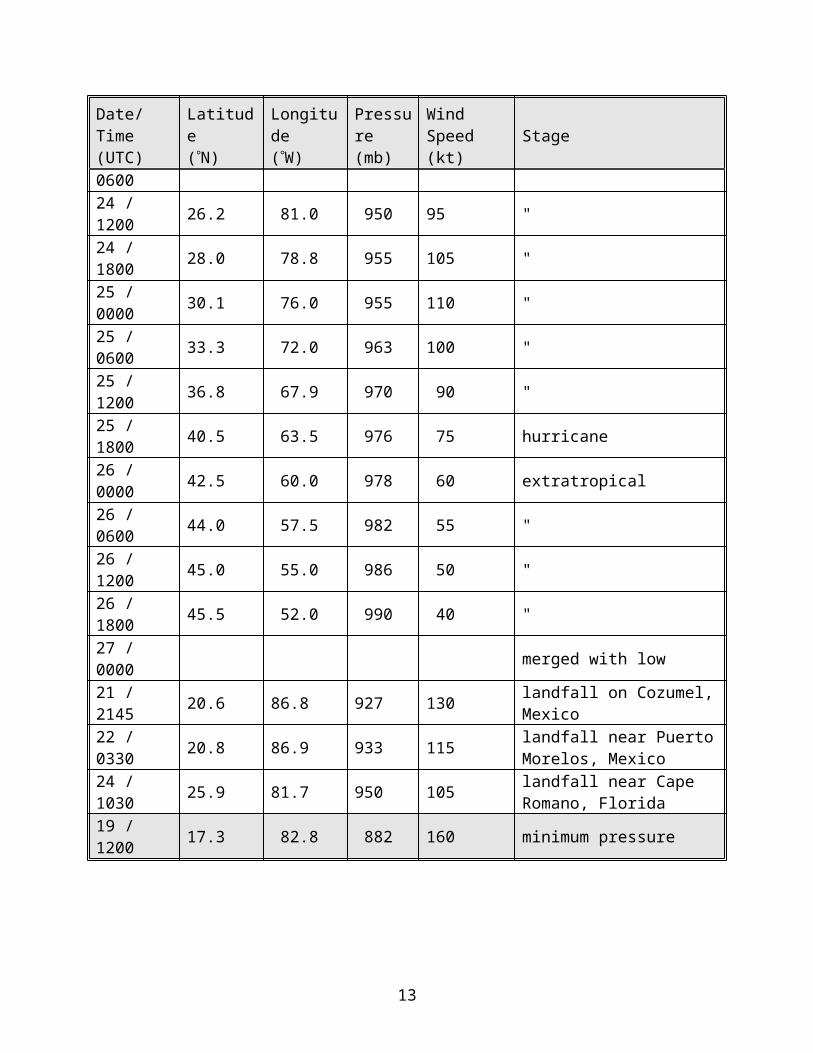
Table 1. Best track for Hurricane Wilma, 15-25 October 2005.Date/Time(UTC)
Latitude(N)
Longitude(W)
Pressure(mb)
Wind Speed(kt) Stage
15 / 1800 17.6 78.5 1004 25 tropical depression 16 / 0000 17.6 78.8 1004 25 "16 / 0600 17.5 79.0 1003 30 "16 / 1200 17.5 79.2 1003 30 "16 / 1800 17.5 79.4 1002 30 "17 / 0000 17.4 79.6 1001 30 "17 / 0600 16.9 79.6 1000 35 tropical storm17 / 1200 16.3 79.7 999 40 "17 / 1800 16.0 79.8 997 45 "18 / 0000 15.8 79.9 988 55 "18 / 0600 15.7 79.9 982 60 "18 / 1200 16.2 80.3 979 65 hurricane18 / 1800 16.6 81.1 975 75 "19 / 0000 16.6 81.8 946 130 "19 / 0600 17.0 82.2 892 150 "19 / 1200 17.3 82.8 882 160 "19 / 1800 17.4 83.4 892 140 "20 / 0000 17.9 84.0 892 135 "20 / 0600 18.1 84.7 901 130 "20 / 1200 18.3 85.2 910 130 "20 / 1800 18.6 85.5 917 130 "21 / 0000 19.1 85.8 924 130 "21 / 0600 19.5 86.1 930 130 "21 / 1200 20.1 86.4 929 125 "21 / 1800 20.3 86.7 926 120 "22 / 0000 20.6 86.8 930 120 "22 / 0600 20.8 87.0 935 110 "22 / 1200 21.0 87.1 947 100 "22 / 1800 21.3 87.1 958 85 "23 / 0000 21.6 87.0 960 85 "23 / 0600 21.8 86.8 962 85 "23 / 1200 22.4 86.1 961 85 "23 / 1800 23.1 85.4 963 90 "24 / 0000 24.0 84.3 958 95 "24 / 0600 25.0 83.1 953 110 "24 / 1200 26.2 81.0 950 95 "24 / 1800 28.0 78.8 955 105 "25 / 0000 30.1 76.0 955 110 "25 / 0600 33.3 72.0 963 100 "25 / 1200 36.8 67.9 970 90 "25 / 1800 40.5 63.5 976 75 hurricane
7

Date/Time(UTC)
Latitude(N)
Longitude(W)
Pressure(mb)
Wind Speed(kt) Stage
26 / 0000 42.5 60.0 978 60 extratropical26 / 0600 44.0 57.5 982 55 "26 / 1200 45.0 55.0 986 50 "26 / 1800 45.5 52.0 990 40 "27 / 0000 merged with low21 / 2145 20.6 86.8 927 130 landfall on Cozumel, Mexico
22 / 0330 20.8 86.9 933 115 landfall near Puerto Morelos, Mexico
24 / 1030 25.9 81.7 950 105 landfall near Cape Romano, Florida
19 / 1200 17.3 82.8 882 160 minimum pressure
8
Table 2. Selected ship and drifting buoy reports with winds of at least 34 kt for Hurricane Wilma, 15-25 October 2005.
Date/Time (UTC)
Ship call sign Latitude(N)
Longitude(W)
Winddir/speed (kt)
Pressure (mb)
20 / 1200 WCY845 18.8 80.2 130 / 36 1007.020 / 2100 DDPH 18.9 82.3 140 / 35 1004.023 / 2100 A8FN3 20.3 84.2 240 / 43 1001.623 / 2100 P3GY9 21.8 85.3 260 / 46 993.024 / 0000 ZCAM4 23.4 88.1 340 / 37 1002.224 / 0000 V7HD2 28.3 88.0 010 / 37 1009.024 / 0600 WCY845 20.0 82.6 230 / 35 1004.024 / 0600 KS049 26.4 85.2 010 / 39 993.824 / 0900 KS049 25.7 86.0 350 / 41 997.624 / 1054 ANCF1 28.2 82.8 010 / 37 999.024 / 1154 FHPF1 28.1 82.8 020 / 39 999.624 / 1200 H3VT 25.6 77.1 160 / 44 1002.024 / 1200 WAAH 26.8 76.9 160 / 37 1000.024 / 1300 PMYF1 26.9 80.6 110 / 43 -99.024 / 1500 WAAH 26.2 76.2 170 / 39 999.524 / 1800 MYSU5 24.1 74.8 190 / 49 1005.624 / 1800 V7HD2 28.3 87.7 340 / 36 1015.024 / 1800 41625 27.6 70.5 210 / 43 1002.724 / 1900 41646 25.3 75.5 200 / 41 1001.224 / 2000 41646 25.3 75.5 200 / 39 1000.324 / 2100 WAAH 25.7 75.8 230 / 44 997.824 / 2128 TYBG1 31.6 79.9 330 / 35 996.024 / 2200 3FMX7 36.4 74.6 020 / 47 996.424 / 2200 41630 26.7 74.0 220 / 41 999.524 / 2233 SKMG1 31.5 80.2 310 / 37 998.024 / 2333 SKMG1 31.5 80.2 310 / 39 999.425 / 0000 ZCDF4 23.2 79.0 270 / 38 1007.925 / 0000 PDBO 28.6 67.2 210 / 35 1008.825 / 0000 KRHX 35.5 75.2 020 / 41 992.025 / 0000 41625 27.7 70.5 200 / 39 1005.725 / 0050 41934 28.6 72.5 *** / 41 997.425 / 0059 BRBN4 39.6 74.2 070 / 35 1002.425 / 0128 TYBG1 31.6 79.9 310 / 39 1000.525 / 0200 41625 27.8 70.4 210 / 41 1006.225 / 0300 KRHX 36.2 75.3 050 / 40 990.825 / 0459 AVAN4 39.1 74.7 070 / 35 995.025 / 0500 3FMX7 37.4 74.4 020 / 48 989.225 / 0600 A8ER9 34.9 75.2 350 / 37 989.025 / 0600 ZCDC2 37.0 75.1 030 / 38 991.025 / 0600 A8CJ2 37.4 74.2 050 / 37 987.0
9

25 / 0600 KAQP 40.2 66.3 090 / 36 997.525 / 0659 BRBN4 39.6 74.2 050 / 35 994.125 / 0900 KRPB 35.5 75.2 300 / 37 990.125 / 0900 WMVF 41.5 70.7 070 / 35 1001.025 / 1100 3FMX7 38.0 74.2 010 / 37 986.625 / 1200 V2AW5 27.3 69.0 190 / 37 1015.025 / 1200 ZCDC2 37.7 74.7 350 / 35 990.325 / 1200 SHJC 40.1 70.1 070 / 58 990.425 / 1200 VRWG6 43.8 62.9 070 / 40 1013.025 / 1500 VOTV 43.5 70.0 040 / 43 1002.0
10

Table 3. Selected surface observations for Hurricane Wilma, 15-25 October 2005.
Location
Minimum Sea Level Pressure
Maximum SurfaceWind Speed
Storm surge(ft)c
Stormtide(ft)d
Totalrain(in)Date/
time(UTC)
Press.(mb)
Date/time(UTC)a
Sustained(kt)b
Gust(kt)
Mexico
Cancun 22/0000 87 113Cozumel 928.0Isla Mujeres 22/1930 968.6 22/0200 71 94 62.05Siankaan 29.25
Cuba
Bahia Honda 23/2225 49 60Caibarien 24/1459 27 34Casa Blanca 24/0040 62 73Colon 24/0503 27 43Cuba Francia 23/1650 38 48Indio Hatuey 24/0500 27 37Isabel Rubio 23/0220 38 51Jovellanos 24/0755 29 39La Fe 20/1256 41 51La Palma 23/2240 48 60Paso Real de San Diego 23/1705 24 42Pinar del Rio 23/2150 38 50Playa Giron 23/1959 32 46Punta del Este 20/1635 40 50San Juan y Martinez 23/1625 47 53Santa Lucia 23/2315 52 65Santiago de la Vegas 23/2025 43 57Santo Domingo 24/0550 28 38Union de Reyes 24/0615 26 35Varadero 24/0602 43 53Yabu 24/0552 29 39
Florida 2 W TNT (FCMP) 24/1311 77 10120 Mile Bend (S-5AE) 4.33
7W Weston FCMP Tower T1 24/1254 952.2 24/1429 77 92
11
Location
Minimum Sea Level Pressure
Maximum SurfaceWind Speed
Storm surge(ft)c
Stormtide(ft)d
Totalrain(in)Date/
time(UTC)
Press.(mb)
Date/time(UTC)a
Sustained(kt)b
Gust(kt)
(26.1oN 80.5oW)Alligator Alley West (S-140) 4.61
Andytown (ANDF1) 4.47Belle Glade (BELLW)SFWMD 24/1215 953.6 24/1515 68 102
Big Cypress (BCSI) 24/1130 951.4 24/1345 35 70 5.19Bings Landing (NOS) 24/2100 18 37 0.86Brighton (S-129) 5.65Brooksville (KBKV) 24/1206 1000.3 24/1829 25 34 1.08Cache (LPIF1) 24/1115 57 97
Chekika (CHKF1) 24/1235 67 98Chokoloskee (USGS) 7.0Clermont COOP 3.82Clewiston (CFSW) 24/1415 53 73Clewiston Field Station (COE) 7.31
Coral Springs (CSPF1) 2.67Crescent City CREF1 3.02Daytona Beach (KDAB) 24/1857 997.3 24/1857 25 38 4.82Daytona Beach COOP 4.25Deland COOP 3.18Everglades City (EGC) 24/0955 49FCMP Tower T0 (25.9oN 81.3oW) 24/1050 952.2 24/1227 63 82
FCMP Tower T2(25.9oN 80.9oW) 24/1149 955.2 24/1057 71 95
Fernandina Beach (NOS) 24/2100 1001.2 1.13FIU Main (FCMP) 24/1411 60e 83e
Forever FL COOP 8.00Fort Lauderdale (KFLL) 24/1336 961.4 24/1211 61 86 3.04
Fort Lauderdale Executive (KFXE) 24/1133 977.3
Fort Myers (KFMY) 24/1102 976.0 24/1216 54 66Fort Myers (KRSW) 24/1153 972.6 24/1229 51 69 5.44Fort Pierce (KFPR) 24/1448 968.5 24/1606 45e 68e 5.47
12
Location
Minimum Sea Level Pressure
Maximum SurfaceWind Speed
Storm surge(ft)c
Stormtide(ft)d
Totalrain(in)Date/
time(UTC)
Press.(mb)
Date/time(UTC)a
Sustained(kt)b
Gust(kt)
Fort Pierce WP COOP 6.02Hastings ARC HTGF1 3.65Hialeah (HIAF1) 1.23Hillsboro Canal (S-2) 5.25Islamorada 24/0926 94Jacksonville Int’l Airport (KJAX) 24/2058 1001.0
Kennedy Space Center Shuttle Landing Facility 10.78
Key West (KEYW) 24/0616 62 72 2.02Key West Harbor (NOS) 24/0818 977.2 24/0836 51 74 2.76Kissimmee COOP 4.73Lake Okeechobee (L001)SFWMD 24/1515 74 93
Lake Okeechobee (L006)SFWMD 24/1500 80 97 7.00
Lake Okeechobee SW (LOKEEM) SFWMD 7.14
Lake Okeechobee (LZ40)SFWMD 24/1500 79 95
Lakeland (KLAL) 7.34Lakeport (S-131) 6.00Leesburg (KLEE) 24/1846 999.0 24/1806 28 35 4.88Lisbon COOP 5.03Loxahatchee (LXWS) 24/1300 954.3 24/1545 62 98 3.12Loxahatchee West 3.82MacDill AFB (KMCF) 24/1055 21 37 2.53
Mayport (NOS) 24/2030 1000.6 24/2030 25 33 0.82Melbourne (KMLB) 24/1520 987.1 24/1600 42 52 4.25Melbourne (NWS) 24/1607 67 4.96Miami (KMIA) 24/1225 967.5 24/1230 58 80 0.76Miccosukee School 24/1100 93Miles City (RKIF1) 24/1235 34 76 4.69NAS Jacksonville (KNIP) 24/1959 1000.3
NASA LC39B (28.6oN 80.6oW)
24/1640 56 82 2.79
13

Location
Minimum Sea Level Pressure
Maximum SurfaceWind Speed
Storm surge(ft)c
Stormtide(ft)d
Totalrain(in)Date/
time(UTC)
Press.(mb)
Date/time(UTC)a
Sustained(kt)b
Gust(kt)
Naples (KAPF) 24/0942 965.8 24/1207 53e 71e 6.63
Naples Pier (NPSF1,NOS) 24/1024 960.9 24/1200 73 89 2.64
Oasis (OASF1) 24/1330 46 86 2.33Ocala (KOCF) 24/1735 1001.0 24/1735 23 34Ochoppi FCMP Tower T2 24/1227 64 84Ochopee (OCOF1) 24/1335 47 3.74Opa Locka (KOPF) 24/1316 964.8 24/1216 74e 91e
Orlando (KMCO) 24/1437 994.6 24/1212 35 42 5.17Orlando (KORL) 24/1434 997.0 24/1723 30 43 3.88Orlando East COOP 4.61Ortona (ORTF1) 4.52Palm Bay COOP 5.47Palmdale 4.56Patrick AFB 24/1521 64 6.95Pinecastle Bombing Range (KNAE) 24/1851 998.6
Plymouth COOP 3.81Pompano Beach (KPMP) 24/1240 961.1e 24/1240 72e 85e
Ponce Inlet COOP 3.07Port Canaveral USCG 24/1600 992.0 24/1500 45 69Punta Gorda (KPGD) 24/1153 985.8 24/1252 45 61 3.93ROTNWX (SFWMD) 24/1145 951.0 24/1200 56e 87e
S7WX (SFWMD) 24/1215 952.3 24/1530 56 90S-140 (SFWMD) 24/1345 58 94STA5WX (SFWMD) 24/1145 950.5
St. Augustine (KSGJ) 24/1945 999.7St. Petersburg (KPIE) 24/1145 997.6 24/1707 33 43 1.64St. Petersburg (KSPG) 24/1153 995.9 24/1144 32 41Sanford (KSFB) 24/1820 995.9 24/1859 28 37 3.59Sanford COOP 3.22Sarasota (KSRQ) 24/1042 991.9 24/1350 31 42 3.81Stuart (COOP) 4.55Sweetwater (Miami WFO) 24/1210 966.5 24/1147 57 90 4.42Tampa (KTPA) 24/1130 997.3 24/1629 30 38 1.44
14

Location
Minimum Sea Level Pressure
Maximum SurfaceWind Speed
Storm surge(ft)c
Stormtide(ft)d
Totalrain(in)Date/
time(UTC)
Press.(mb)
Date/time(UTC)a
Sustained(kt)b
Gust(kt)
Tenraw (ENPF1) 24/1120 66 92 2.64Titusville COOP 6.90Vaca Key (NOS) 24/0924 983.0 24/1412 52 6.43Vandenburg (KVDF) 24/1654 23 36Venice 7.45Vero Beach (KVRB) 24/1531 975.3 24/1353 35e 48e 5.53Vero Beach (COOP) 5.50Vilano Beach (NOS) 24/1800 27 37 1.77
Virginia Key (VAKF1) 24/1300 972.4 24/1318 65 87 3.61West Palm Beach (KPBI) 24/1225 975.0 24/1310 71 88 1.07West Kendall (KTMB) 24/1152 970.5 24/1133 50e 72e 1.18Winter Haven (KGIF) 24/1236 995.3 24/1630 31 40 4.77
Georgia
Glynco Airport (KBQK) 24/2019 1001.4 24/2059 15 22
New Brunswick (KNRB) 24/2053 1000.7 24/0536 21 27
Saint Simons Island (KSSI) 24/2120 1001.0 24/1949 18 27 0.52 1.69
Waycross (KAYS) 24/2058 1003.0 24/2058 21 29
Buoy/CMANNOAA Buoy 41009(28.5oN 80.2oW) 24/1720 985.2 24/1720 52 68
NOAA Buoy 41010(29.0oN 78.5oW) 24/1950 969.5 24/2050 62 82
NOAA Buoy 41012(30.0oN 80.6oW) 24/1950 995.3 24/1950 37 45
NOAA Buoy 42003(26.1oN 85.9oW) 23/2050 997.8 24/1020 36
(10 min) 47
Buoy 42013(27.2oN 83.0oW) 24/1010 993.1 24/1110 41 49
Buoy 42023(26.1oN 83.1oW) 24/0759 982.5 24/0959 49
NOAA Buoy 42036(28.5oN 84.5oW) 24/1150 1002.3 24/0850 37 43
NOAA Buoy 42056(19.9oN 85.1oW) 21/0800 986.6 21/0416 67 81
NOAA Buoy 42057(17.6oN 80.7oW) 18/2200 998.1 19/0600 50 59
15

Location
Minimum Sea Level Pressure
Maximum SurfaceWind Speed
Storm surge(ft)c
Stormtide(ft)d
Totalrain(in)Date/
time(UTC)
Press.(mb)
Date/time(UTC)a
Sustained(kt)b
Gust(kt)
NOAA Buoy 44004(38.5oN 70.5oW) 25/0050 1002.1 25/0050 37
NOAA Buoy 44005(43.2oN 69.2oW) 25/1750 992.4 25/1650 39
NOAA Buoy 44007(43.5oN 70.1oW) 25/1650 997.6 25/1650 35
NOAA Buoy 44008(40.5oN 69.4oW) 25/1350 984.9 25/1350 39
NOAA Buoy 44009(38.5oN 74.7oW) 25/0650 989.1 25/0750 37
NOAA Buoy 44013(42.4oN 70.7oW) 25/1650 993.8 25/1550 37
NOAA Buoy 44017(40.7oN 72.0oW) 25/1550 988.1 25/1250 41
NOAA Buoy 44018(41.3oN 69.3oW) 25/1350 987.4 25/1450 37
NOAA Buoy 44025(40.3oN 73.2oW) 25/1450 988.7 25/0950 39
NOAA Buoy 44027(44.3oN 67.3oW) 25/1750 997.5 25/1750 39
NOAA Buoy 44034(44.1oN 68.1oW) 25/1704 999.9 25/1704 35
NOAA Buoy 44142(42.5oN 64.0oW) 25/1700 992.4 25/1700 37
Anclote Key (ANCF1)(28.2oN 82.8oW) 24/1054 37 47
Big Carlos Pass (BGCF1)(26.4oN 81.9oW) 24/1054 969.2 24/1054 56 76
Clearwater Beach (CWBF1) (28.0oN 82.8oW)
24/1400 41 48
Cedar Key (CDRF1)(29.1oN 83.0oW) 24/1100 1003.2 24/1650 20 33
Duck Pier (DUCN7)(36.2oN 75.7oW) 24/2200 998.4 24/2130 37
Fowey Rocks (FWYF1)(25.6oN 80.1oW) 24/1243 975.3 24/1159 88 107
Fort Myers (FMRF1)(26.7oN 81.9oW) 24/1242 46 62
Fred Howard (COMPS FHP) 24/1154 39 49
Homosassa (COMPS HOM) 24/1754 1001.0 24/1654 31
16

Location
Minimum Sea Level Pressure
Maximum SurfaceWind Speed
Storm surge(ft)c
Stormtide(ft)d
Totalrain(in)Date/
time(UTC)
Press.(mb)
Date/time(UTC)a
Sustained(kt)b
Gust(kt)
Isle of Shoals (IOSN3)(43.0oN 70.6oW) 25/1600 995.4 25/1600 46
Long Key (LONF1) (24.8oN 80.9oW) 24/1100 982.2 24/0930 57 76 4.0
Mt Desert Rock MDRM1)(44.0o N 68.1oW) 25/1700 997.1 25/1700 49
Matinicus Rock (MISM1)(43.8oN 68.9oW) 25/1700 997.1 25/1400 45
Molasses Reef (MLRF1)(25.0oN 80.4oW) 24/1200 982.3 24/1220 66 81
Port Richey (PTRF1)(28.3oN 82.7oW) 24/1654 25 37
St. Augustine (SAUF1) (29.9oN 81.3oW) 24/2005 999.9 24/1440 35 44
Settlement Point (SPGF1)(26.7oN 79.0oW) 24/1600 969.9 24/1600 83 103
Sombrero Key (SMKF1)(24.6oN 81.1oW) 24/1000 983.4 24/0920 76 91 2.1
Tyndall Tower (SGOF1)(29.4oN 84.9oW) 24/1100 1007.3 24/1400 40
U.S. Navy Tower No. R8(31.6oN 79.9oW, TYBG1) 24/2128 996.0 24/2128 35
Venice (VENF1)(27.1oN 82.4oW) 24/1100 990.0 24/1500 44 55
Woods Hole (BUZM3)(41.4oN 71.0oW) 25/1700 989.0 25/1300 48
Unofficial Observations
Florida
Apopka 9.35Arcadia (FAWN) 24/1245 34 56Archbold 24/1322 64 6.07Avalon COOP 3.25Balm (FAWN) 24/1045 28 44Boynton Beach (26.6oN 80.1oW) 24/1400 954.5
W Boynton Beach (KFLBOYNT4) 24/1358 953.2 24/1554 78 103
Collier County EOC 24/1316 109Cudjoe Key 24/0913 107Deerfield Beach 24/1400 956.2
17

Location
Minimum Sea Level Pressure
Maximum SurfaceWind Speed
Storm surge(ft)c
Stormtide(ft)d
Totalrain(in)Date/
time(UTC)
Press.(mb)
Date/time(UTC)a
Sustained(kt)b
Gust(kt)
(26.3oN 80.1oW) Doral CBS-4 TV 24/1149 99Dry Tortugas Nat’l Park 24/0515 116Duck Key 75 2.39Everglades City Mark Suddath HLP Tower
24/0955 953.9 117
Fort Pierce (FAWN) 6.09Grant 5.99Interstate 75 and Florida. Highway 80 24/1130 978.7 56 74
John Pennekamp State Park 1.50Kenansville COOP 5.64Lake Alfred (FAWN) 24/1215 16 38Lake Wales RAWS(LWEF1) 24/1345 24 43
Lantana (26.6oN 80.1oW) 24/1415 953.2
Marco Island 24/1015 954.0 117Martin County F&R Hobe Sound MCFR1 (AWS) 24/1514 954.6
Martin County EOC Stuart MCEOP (AWS) 24/1444 957.0
Melbourne Beach 5.14Melbourne F.I.T 24/1651 64Miramar TV 6 24/1222 91Mountain Lake 6.00Mulberry 6.93Nettles Island COOP 0.08North Port 5.67North Port 2N 6.42Okahumpka COOP 5.33Ona (FAWN) 24/1800 20 46Orange Springs OSPF1 1.59Palm Bay COOP 24/1602 60Palm Beach Gardens (26.8oN 80.3oW) 24/1415 951.8
18

Location
Minimum Sea Level Pressure
Maximum SurfaceWind Speed
Storm surge(ft)c
Stormtide(ft)d
Totalrain(in)Date/
time(UTC)
Press.(mb)
Date/time(UTC)a
Sustained(kt)b
Gust(kt)
Palm Beach Gardens(26.9oN 80.2oW) 24/1445 953.5
Palm Beach Jonathan Dickinson Missile Tracking Annex
24/1310 71 99
Palm Coast WOGF1 3.95Pembroke Pines 24/1300 960.0Pierson COOP 2.80Pompano Beach 24/1248 104Ponce Inlet COOP 2.65Port Salerno COOP 0.14Punta Gorda 8 NE 7.57Scottsmoor COOP 2.95Sebring (FAWN) 24/1245 21 52South Fork St. Lucie River UNK 116South Miami 24/1230 969.0Starke SRKF1 1.16Stuart Skywarn Spotter(27.1oN 80.2oW) 24/1419 94
Tamarac BSO BSO01 (AWC) 24/1314 955.6
Titusville COOP 2.87Umatilla COOP 4.29Weston BSO DNBS2 (AWC) 24/1314 957.3
a Date/time is for sustained wind when both sustained and gust are listed.b Except as noted, sustained wind averaging periods for C-MAN and land-based ASOS reports
are 2 min; buoy averaging periods are 8 min, and SFWMD observations are 15 min.c Storm surge is water height above normal astronomical tide level.d Storm tide is water height above National Geodetic Vertical Datum (1929 mean sea level).e Instrumentation failedf Incomplete or missing data
19

Table 4. Preliminary forecast evaluation (heterogeneous sample) for Hurricane Wilma, 15-25 October 2005. Forecast errors (n mi) are followed by the number of forecasts in parentheses. Errors smaller than the NHC official forecast are shown in bold-face type. Verification includes the depression stage, but does not include the extratropical stage.
Forecast Technique
Forecast Period (h)
12 24 36 48 72 96 120CLP5 47 (38) 115 (36) 185 (34) 249 (32) 319 (28) 381 (24) 396 (20)GFNI 40 (37) 79 (34) 122 (33) 172 (31) 258 (27) 366 (23) 463 (19)
GFDI 33 (39) 55 (37) 76 (35) 98 (33) 164 (29) 361 (25) 563 (21)
GFSI 32 (39) 52 (37) 65 (35) 84 (33) 132 (29) 265 (25) 429 (21)
AEMI 31 (39) 49 (37) 63 (35) 81 (33) 126 (29) 240 (25) 328 (21)
NGPI 35 (38) 69 (35) 104 (33) 139 (31) 218 (27) 339 (23) 441 (19)
UKMI 30 (37) 43 (35) 57 (33) 77 (31) 113 (27) 240 (23) 340 (19)
A98E 39 (38) 79 (36) 109 (34) 140 (32) 184 (28) 243 (24) 380 (20)
A9UK 39 (19) 77 (18) 107 (17) 140 (16) 199 (14)
BAMD 49 (38) 88 (36) 115 (34) 132 (32) 197 (28) 379 (24) 533 (20)
BAMM 52 (38) 82 (36) 108 (34) 128 (32) 196 (28) 340 (24) 453 (20)
BAMS 73 (37) 124 (35) 165 (33) 192 (31) 231 (28) 332 (24) 414 (20)
CONU 29 (39) 48 (37) 71 (35) 96 (33) 150 (29) 271 (25) 373 (21)
GUNA 26 (37) 43 (35) 64 (33) 85 (31) 140 (27) 279 (23) 401 (19)
FSSE 21 (33) 31 (31) 40 (29) 63 (27) 142 (23) 308 (19) 480 (15)
OFCL 29 (39) 42 (37) 61 (35) 84 (33) 136 (29) 264 (25) 382 (21)
NHC Official
(1995-2004 mean)
42 (3400) 75 (3116) 107 (2848) 138 (2575) 202 (2117) 236 (649) 310 (535)
20

Table 5. Watch and warning summary for Hurricane Wilma, 15-25 October 2005.
Date/Time (UTC) Action Location
16/0900 Hurricane Watch and Tropical Storm Warning Issued Cayman Islands
17/1500 Tropical Storm Warning Issued Honduras from the Honduras/ Nicaragua Border to Cabo Camaron
18/2100 Hurricane Watch Issued Cuba from the Provinces of Matanzas westward through Pinar Del Rio and the Isle of Youth
18/2100 Hurricane Watch Issued Mexico from Punta Allen to Cabo Catoche
19/0300 Hurricane Watch Issued Mexico S of Punta Allen to Punta Gruesa19/1500 Hurricane Watch changed to
Hurricane WarningMexico from San Felipe to Tulum including Cozumel and nearby islands
19/1500 Tropical Storm Warning Issued Mexico from S of Tulum to Chetumal19/1500 Tropical Storm Warning Issued Belize from the Border with Mexico to
Belize City19/1800 Hurricane Watch and Tropical Storm
Warning Discontinued Cayman Islands20/0300 Hurricane Watch/Tropical Storm
Warning changed to Hurricane Warning Mexico from S of Tulum to Punta Allen
20/0300 Hurricane Watch Issued Mexico from W of San Felipe to Celestun
20/0300 Tropical Storm Warning Issued Cuba for the provinces of La Habana, Ciudad de la Habana, Pinar del Rio, and the Isle of Youth
20/0900 Tropical Storm Warning Issued Mexico from W of San Felipe to Celestun
20/1500 Tropical Storm Warning changed to Hurricane Warning
Mexico from S of Punta Allen to Chetumal
21/0300 Tropical Storm Warning Discontinued
Honduras from the Honduras/ Nicaragua Border to Cabo Camaron
21/1500 Tropical Storm Warning Discontinued
Belize from the Border with Mexico to Belize City
22/1500 Hurricane Watch Issued All of the Florida Keys including the Dry Tortugas and Florida Bay
22/2100 Hurricane Watch Issued West coast of Florida from Longboat Key southward and the east coast of Florida from Titusville southward including Lake Okeechobee
22/2100 Hurricane Watch changed to Hurricane Warning
Cuban provinces of Ciudad de la Habana, La Habana, and Pinar del Rio
21

22/2100 Tropical Storm Watch Issued Florida from N of Longboat Key to the Steinhatchee River and from north of Titusville to Fernandina Beach
23/0300 Hurricane Watch changed to Hurricane Warning
The Florida Keys including the Dry Tortugas and Florida Bay, the W coast of Florida from Longboat Key southward, the E coast of Florida from Jupiter Inlet southward including Lake Okeechobee
23/0300 Hurricane Watch Issued NW Bahamas including the Abacos, Andros Island, Berry Islands, Bimini, Eleuthera, Grand Bahama Island, and New Providence
23/0600 Hurricane Warning Discontinued Mexico from S of Punta Gresa to Punta Allen
23/0600 Hurricane Watch Discontinued Mexico from W of San Felipe to Celestun
23/0600 Tropical Storm Warning Discontinued
Mexico from W of Progreso to Celestun
23/0900 Hurricane Watch changed to Hurricane Warning
Florida from N of Jupiter Inlet to Titusville
23/0900 Tropical Storm Watch changed to Tropical Storm Warning
Florida from N of Titusville to Flagler Beach
23/1200 Hurricane Warning Issued NW Bahamas including the Abacos, Andros Island, Berry Islands, Bimini, Eleuthera, Grand Bahama Island, and New Providence
23/1500 Hurricane Warning changed to Tropical Storm Warning
Mexico from San Felipe to Punta Gresa
23/1500 Tropical Storm Warning Discontinued
Mexico from W of San Felipe to Progreso
23/2100 All Warnings Discontinued Mexico24/0300 Tropical Storm Watch changed to
Tropical Storm WarningFlorida from N of Titusville to St. Augustine
24/1500 Tropical Storm Watch Discontinued Florida from N of St. Augustine to Fernandina Beach
24/1700 Tropical Storm Warning Discontinued
Florida from N of Longboat Key to the Steinhatchee River
24/1830 Hurricane Warning changed to Tropical Storm Warning
The Florida Keys including the Dry Tortugas and Florida Bay, Florida W Coast from Longboat Key southward and Florida E Coast from S of Florida City including Lake Okeechobee
24/1830 Watches/Warnings Discontinued Cuba24/2100 Watches/Warnings Discontinued Florida24/2100 Warnings Discontinued Bahamas
22

15
20
25
30
35
40
45
-85 -80 -75 -70 -65 -60 -55 -50 -45
Hurricane Wilma15-25 October 2005
HurricaneTropical StormTropical Dep.ExtratropicalSubtr. StormSubtr. Dep.
00 UTC Pos/Date12 UTC Position
Low / Wave
PPP Min. press (mb)
25
24
23
22
21
20
1918
26
1617
882 mb
Figure 1. Best track positions for Hurricane Wilma, October 2005. Track during the extratropical stage is partially based on analyses from the NOAA Ocean Prediction Center.
23

2030405060708090
100110120130140150160170180
10/15 10/17 10/19 10/21 10/23 10/25 10/27
Hurricane WilmaOctober 2005
BEST TRACKSat (TAFB)Sat (SAB)Sat (AFWA)Obj T-NumAC (sfc)AC (flt>sfc)AC (DVK P>W)Surface
Win
d S
peed
(kt)
Date (Month/Day)Figure 2. Selected wind observations and best track maximum sustained surface wind speed curve for Hurricane Wilma, 15-25
October 2005. In most cases, aircraft observations have been adjusted for elevation using 90%, 80%, and 80% reduction factors for observations from 700 mb, 850 mb, and 1500 ft, respectively. Estimates during the extratropical stage are based partially on analyses from the NOAA Ocean Prediction Center. Vertical lines denote landfalls.
24

880
890
900
910
920
930
940
950
960
970
980
990
1000
1010
1020
10/15 10/17 10/19 10/21 10/23 10/25 10/27
Hurricane WilmaOctober 2005
BEST TRACKSat (TAFB)Sat (SAB)Sat (AFWA)Obj T-NumAC (sfc)Surface
Pre
ssur
e (m
b)
Date (Month/Day)Figure 3. Selected pressure observations and best track minimum central pressure curve for Hurricane Wilma, 15-25 October
2005. Estimates during the extratropical stage are based partially on analyses from the NOAA Ocean Prediction Center. Vertical lines denote landfalls.
25

Figure 4. Image of Wilma over South Florida at 1223 UTC from the Miami National Weather Service WSR-88D radar.
26