true numerical cognition in the wild © the author(s) 2017
TRANSCRIPT
https://doi.org/10.1177/0956797616686862
Psychological Science2017, Vol. 28(4) 462 –469© The Author(s) 2017Reprints and permissions: sagepub.com/journalsPermissions.navDOI: 10.1177/0956797616686862www.psychologicalscience.org/PS
Research Article
Over the past half century, laboratory work on numerical processing has advanced considerably in psychology, neuroscience, and comparative cognition. Research has characterized both the shared and distinct representa-tional systems that animals and humans use to judge numerosity (Dehaene, 2009; Feigenson, Dehaene, & Spelke, 2004; Gallistel, 1990; Nieder & Dehaene, 2009). However, little work has examined numerical processing outside the lab and, what role, if any, number plays in animals’ natural decisions. The problems that animals solve in the wild are certain to help reveal the adaptive pressures on and functions of their cognitive systems, and thus provide insights into the origins of human numerical thought.
One domain in which numerical cognition could serve a natural function is social decision making. Prior research has shown that some species make decisions about group movements or actions collectively; that is, group members choose between two or more exclusive options by reaching some kind of consensus (e.g., Boinski & Campbell, 1995; Byrne, 2000b; Seeley & Buhrman, 1999; Stewart & Harcourt, 1994). This is termed collective deci-sion making. In species that use collective decision mak-ing, cooperation enhances fitness (Conradt & Roper, 2003). Under a large range of circumstances, animals
who are able to follow a consensus group vote rather than an experienced leader or despot will face fewer fit-ness costs than those who cannot. Thus, the ability to track and tally votes quantitatively is consequential for survival.
In an exciting recent article, Strandburg-Peshkin, Farine, Couzin, and Crofoot (2015) used GPS collars to measure the troop movements of wild baboons in Kenya. They showed that the baboons made decisions about the direction of troop movement democratically, on the basis of the relative quantity of animals heading in different directions. One interesting question left open is whether the animals’ underlying representations of the vote tallies were truly numerical. There are several alternatives, including size-based representations (i.e., total animal mass moving in one direction), that would give similar answers. Democratic decisions could even be made with-out any underlying quantitative representation: Randomly picking another individual to follow would yield choices
686862 PSSXXX10.1177/0956797616686862Piantadosi, CantlonTrue Numerical Cognition in the Wildresearch-article2017
Corresponding Author:Steven T. Piantadosi, Department of Brain and Cognitive Sciences, 358 Meliora Hall, Box 270268, University of Rochester, Rochester, NY 14627 E-mail: [email protected]
True Numerical Cognition in the Wild
Steven T. Piantadosi and Jessica F. CantlonDepartment of Brain and Cognitive Sciences, University of Rochester
AbstractCognitive and neural research over the past few decades has produced sophisticated models of the representations and algorithms underlying numerical reasoning in humans and other animals. These models make precise predictions for how humans and other animals should behave when faced with quantitative decisions, yet primarily have been tested only in laboratory tasks. We used data from wild baboons’ troop movements recently reported by Strandburg-Peshkin, Farine, Couzin, and Crofoot (2015) to compare a variety of models of quantitative decision making. We found that the decisions made by these naturally behaving wild animals rely specifically on numerical representations that have key homologies with the psychophysics of human number representations. These findings provide important new data on the types of problems human numerical cognition was designed to solve and constitute the first robust evidence of true numerical reasoning in wild animals.
Keywordsnumerosity, evolution, numerical cognition, animal cognition
Received 1/11/16; Revision accepted 12/8/16
True Numerical Cognition in the Wild 463
that track the total proportion of votes. Evidence that the baboons’ decision processes were numerical in nature would be important for psychology, as researchers have sometimes assumed that number is a difficult or unnatu-ral concept for nonhuman animals and preverbal human children (Cantlon & Brannon, 2007; Cantrell & Smith, 2013; Church & Broadbent, 1990; Davis & Memmott, 1982; Mix, Huttenlocher, & Levine, 2002; Newcombe, Levine, & Mix, 2015; Simon, 1997). Some have argued that size-based quantities, such as surface area or mass, are more readily used by animals in their decision making. In the study reported here, we formally tested the basis of animals’ quantitative decisions using the natural experiment provided by wild baboons’ troop movements.
Method
We used data from the natural behavior of wild baboons to test the natural statistics and psychological models of quantitative judgments in wild primates. Our data were made available by Strandburg-Peshkin et al. (2015).
Subjects
Twenty-six baboons (14 adults, 10 subadults, and 2 juve-niles) from the Mpala Research Center in Kenya were fit with GPS collars for the study by Strandburg-Peshkin et al. (2015). One adult’s collar failed, so the total sample size was reduced to 25 individuals. Each animal was weighed during the collaring procedure.
Data collection and preprocessing (from Strandburg-Peshkin et al., 2015)
After the animals were fit with collars, they were returned to their social group in the reserve. The GPS collars were used to continuously follow the animals for 14 consecu-tive days, recording their coordinates at a rate of 1 Hz. In all analyses, we retained the data preprocessing per-formed by Strandburg-Peshkin et al. and reported in detail in their article. To summarize, the GPS track from all 25 animals was searched for instances of troop move-ment decisions. Decision events were extracted by Strandburg-Peshkin et al. (see their Supplemental Mate-rial) using dyads’ sequences of movements apart and together. These dyadic interactions were grouped into “events,” in which one animal, a “follower,” was poten-tially pulled in different directions by two simultaneous movements of groups of other individuals in the troop. These procedures resulted in 9,376 events that each involved two subgroups. Strandburg-Peshkin et al. found that at low angular disparities (< 90°), the animals
followed the vector of average direction between the subgroups, so we restricted our analyses to events in which the angular disparity between subgroups was greater than 90° and the number of animals in the two subgroups differed. This resulted in a final sample of 1,773 events. For each event, we analyzed the follower’s subgroup choice as a function of subgroup number and mass.
Analysis
We analyzed the data according to the original study’s parsing of the continuous GPS track into discrete deci-sion events in which a baboon determined which of two groups to follow (Strandburg-Peshkin et al., 2015). We used the measured numerosity of each subgroup and each subgroup’s total weight, as a proxy for spatial extent. These variables were used as predictors of individual baboons’ decisions. We then fit a variety of psychophysi-cal models—each motivated by existing literature—to the animals’ aggregate choice behavior . These models (see Table 1) were of six general classes: proportional voting models (a, b), a linear-scale model (c), compressed-scale models (d–f), models with scalar variability only for large numbers (g–j), a model with noisy 1-to-1 correspondence (k), and baseline choice models (l–n).
In the proportional voting models, the animal was hypothesized to pick an individual to follow at random. This would result in choice probabilities that tracked the proportion of individuals in each subgroup. Model a used raw proportions, and Model b included a smooth-ing term. In the linear-scale model (c), the animals were hypothesized to represent each subgroup as a linear quantity with normal noise and constant variability. In this model, the probability of choosing a subgroup was based on comparison of absolute values, as might be expected in a uniformly noisy counting model. The com-pressed-scale models included standard models from psychophysics that assign greater acuity or representa-tional resources to the smallest values on the scale rela-tive to larger values. Model d used a linear scale with linearly increasing (Weber) noise, Model e used a loga-rithmic scale with Gaussian noise, and Model f used a power-law scale with Gaussian noise. Models g through j assumed subitizing, or two systems (Feigenson & Carey, 2005; Feigenson et al., 2004): fixed performance for sub-groups numbering less than or equal to 4 (Models g and h) or 3 (Models i and j), and scalar variability when either (Models h and j) or both (Models g and i) numbers exceeded this bound. Model k implemented a noisy 1-to-1 correspondence in which the winning group was assumed to be computed through 1-1 pairing of votes, but each pairing failed with some probability. The ani-mals responded to movement at chance (50-50) if a
464 Piantadosi, Cantlon
pairing failed and perfectly otherwise. The three baseline models included a model in which the greater cardinality was chosen with some fixed accuracy (Model l), a model with a softmax choice rule popular in decision theory (Model m), and a model based on a logistic function (Model n).
Each model predicted the probability of choosing each of the subgroups as a function of the number of individuals or total mass (animal weight) in each sub-group. Each model included no, one, or two free param-eters that quantified unknown aspects of the animals’ choices (e.g., the noise in representations). These param-eters were fitted to the observed choices using R’s opti-mize function (Brent, 1973). Akaike’s information criterion (AIC) was used to compare models because significance
testing cannot be used to compare nonnested models (Akaike, 1974). A lower AIC indicates stronger support for a model, and the magnitude of difference between AIC values indicates the amount of evidence. Note that AIC incorporates a principled penalty on the number of free parameters. When the AICs for two models differ by at least 10, this is typically considered strong evidence for the model with the lower AIC over the alternative (Burn-ham & Anderson, 2002).
Results
Our analyses yielded five main findings. First, the natural correlation between number and mass in the environ-ment was high. Second, despite this high natural
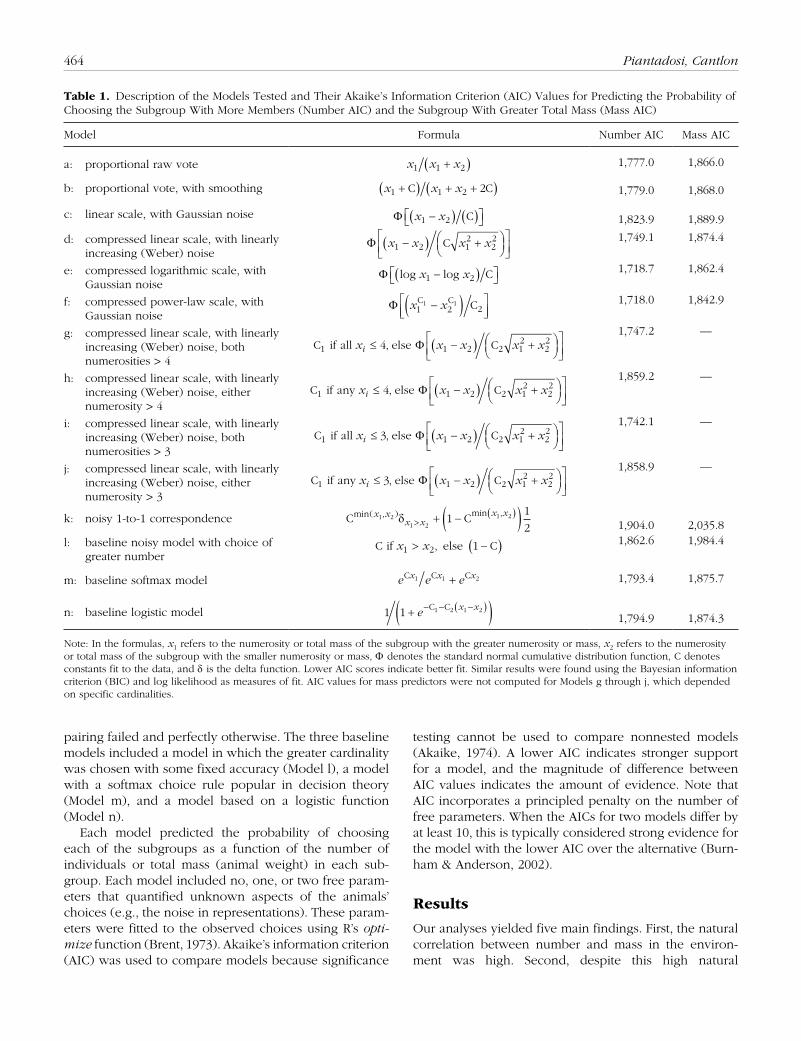
Table 1. Description of the Models Tested and Their Akaike’s Information Criterion (AIC) Values for Predicting the Probability of Choosing the Subgroup With More Members (Number AIC) and the Subgroup With Greater Total Mass (Mass AIC)
Model Formula Number AIC Mass AIC
a: proportional raw vote x x x1 1 2+( ) 1,777.0 1,866.0
b: proportional vote, with smoothing x x x1 1 2 2+ + +( ) ( )C C 1,779.0 1,868.0
c: linear scale, with Gaussian noise Φ x x1 2−( ) ( ) C 1,823.9 1,889.9
d: compressed linear scale, with linearly increasing (Weber) noise
Φ x x x x1 2 12
22− +( )
C 1,749.1 1,874.4
e: compressed logarithmic scale, with Gaussian noise
Φ log log Cx x1 2−( ) 1,718.7 1,862.4
f: compressed power-law scale, with Gaussian noise
Φ x x1 2 21 1C C C−( )
1,718.0 1,842.9
g: compressed linear scale, with linearly increasing (Weber) noise, both numerosities > 4
C else C if all 1 1 2 2 12
224x x x x xi ≤ ( )
− +, Φ1,747.2 —
h: compressed linear scale, with linearly increasing (Weber) noise, either numerosity > 4
C else C if any 1 1 2 2 12
224x x x x xi ≤ ( )
− +, Φ1,859.2 —
i: compressed linear scale, with linearly increasing (Weber) noise, both numerosities > 3
C else C if all 1 1 2 2 12
223x x x x xi ≤ ( )
− +, Φ1,742.1 —
j: compressed linear scale, with linearly increasing (Weber) noise, either numerosity > 3
C else C if any 1 1 2 2 12
223x x x x xi ≤ ( )
− +, Φ1,858.9 —
k: noisy 1-to-1 correspondence C Cmin( , ) min ,x xx x
x x1 21 2
1 211
2δ >
( )+ −( ) 1,904.0 2,035.8
l: baseline noisy model with choice of greater number
C if else Cx x1 2 1> −( ), 1,862.6 1,984.4
m: baseline softmax model e e ex x xC C C1 1 2+ 1,793.4 1,875.7
n: baseline logistic model 1 1 1 2 1 2+( )− − ( )−e x xC C1,794.9 1,874.3
Note: In the formulas, x1 refers to the numerosity or total mass of the subgroup with the greater numerosity or mass, x2 refers to the numerosity or total mass of the subgroup with the smaller numerosity or mass, Φ denotes the standard normal cumulative distribution function, C denotes constants fit to the data, and δ is the delta function. Lower AIC scores indicate better fit. Similar results were found using the Bayesian information criterion (BIC) and log likelihood as measures of fit. AIC values for mass predictors were not computed for Models g through j, which depended on specific cardinalities.
True Numerical Cognition in the Wild 465
correlation, number was a better predictor of choice than was mass or simple transformations of size (e.g., surface area or linear extent). Third, number was represented on a compressed scale. Fourth, the wild baboons’ natural numerical acuity was consistent with that observed in previous laboratory studies. And finally, the natural fre-quency with which the animals encountered each numer-osity was strongly skewed toward low numbers. Taken together, the results provide strong evidence that numeri-cal reasoning has a natural function in wild primates, and provide new insights into the distribution of quantitative variables in the natural environment.
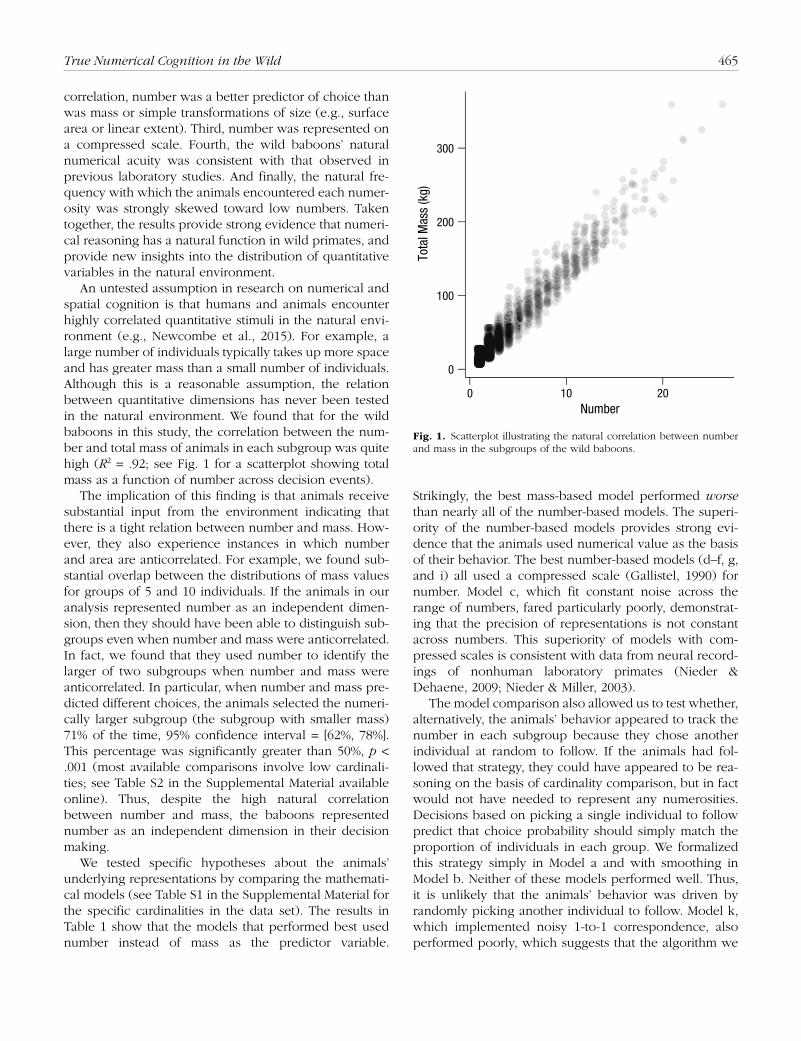
An untested assumption in research on numerical and spatial cognition is that humans and animals encounter highly correlated quantitative stimuli in the natural envi-ronment (e.g., Newcombe et al., 2015). For example, a large number of individuals typically takes up more space and has greater mass than a small number of individuals. Although this is a reasonable assumption, the relation between quantitative dimensions has never been tested in the natural environment. We found that for the wild baboons in this study, the correlation between the num-ber and total mass of animals in each subgroup was quite high (R2 = .92; see Fig. 1 for a scatterplot showing total mass as a function of number across decision events).
The implication of this finding is that animals receive substantial input from the environment indicating that there is a tight relation between number and mass. How-ever, they also experience instances in which number and area are anticorrelated. For example, we found sub-stantial overlap between the distributions of mass values for groups of 5 and 10 individuals. If the animals in our analysis represented number as an independent dimen-sion, then they should have been able to distinguish sub-groups even when number and mass were anticorrelated. In fact, we found that they used number to identify the larger of two subgroups when number and mass were anticorrelated. In particular, when number and mass pre-dicted different choices, the animals selected the numeri-cally larger subgroup (the subgroup with smaller mass) 71% of the time, 95% confidence interval = [62%, 78%]. This percentage was significantly greater than 50%, p < .001 (most available comparisons involve low cardinali-ties; see Table S2 in the Supplemental Material available online). Thus, despite the high natural correlation between number and mass, the baboons represented number as an independent dimension in their decision making.
We tested specific hypotheses about the animals’ underlying representations by comparing the mathemati-cal models (see Table S1 in the Supplemental Material for the specific cardinalities in the data set). The results in Table 1 show that the models that performed best used number instead of mass as the predictor variable.
Strikingly, the best mass-based model performed worse than nearly all of the number-based models. The superi-ority of the number-based models provides strong evi-dence that the animals used numerical value as the basis of their behavior. The best number-based models (d–f, g, and i) all used a compressed scale (Gallistel, 1990) for number. Model c, which fit constant noise across the range of numbers, fared particularly poorly, demonstrat-ing that the precision of representations is not constant across numbers. This superiority of models with com-pressed scales is consistent with data from neural record-ings of nonhuman laboratory primates (Nieder & Dehaene, 2009; Nieder & Miller, 2003).
The model comparison also allowed us to test whether, alternatively, the animals’ behavior appeared to track the number in each subgroup because they chose another individual at random to follow. If the animals had fol-lowed that strategy, they could have appeared to be rea-soning on the basis of cardinality comparison, but in fact would not have needed to represent any numerosities. Decisions based on picking a single individual to follow predict that choice probability should simply match the proportion of individuals in each group. We formalized this strategy simply in Model a and with smoothing in Model b. Neither of these models performed well. Thus, it is unlikely that the animals’ behavior was driven by randomly picking another individual to follow. Model k, which implemented noisy 1-to-1 correspondence, also performed poorly, which suggests that the algorithm we
0
100
200
300
0 10 20Number
Tota
l Mas
s (k
g)Fig. 1. Scatterplot illustrating the natural correlation between number and mass in the subgroups of the wild baboons.
466 Piantadosi, Cantlon
modeled was not the basis of these decisions. In addi-tion, the models that free-fit accuracy for small numbers (g–j) did not perform as well as the best compressed-scale models (e and f). This suggests that a single repre-sentational system was used for low and high cardinalities. The baseline models (l–n) also performed substantially worse than the models with compressed scales. The ani-mals likely did not make choices with noise that was independent of numerosity or use choice rules common in decision theory and statistics. Together, these compari-sons strongly support the interpretation that the baboons used compressed scales commonly found in numerical cognition.
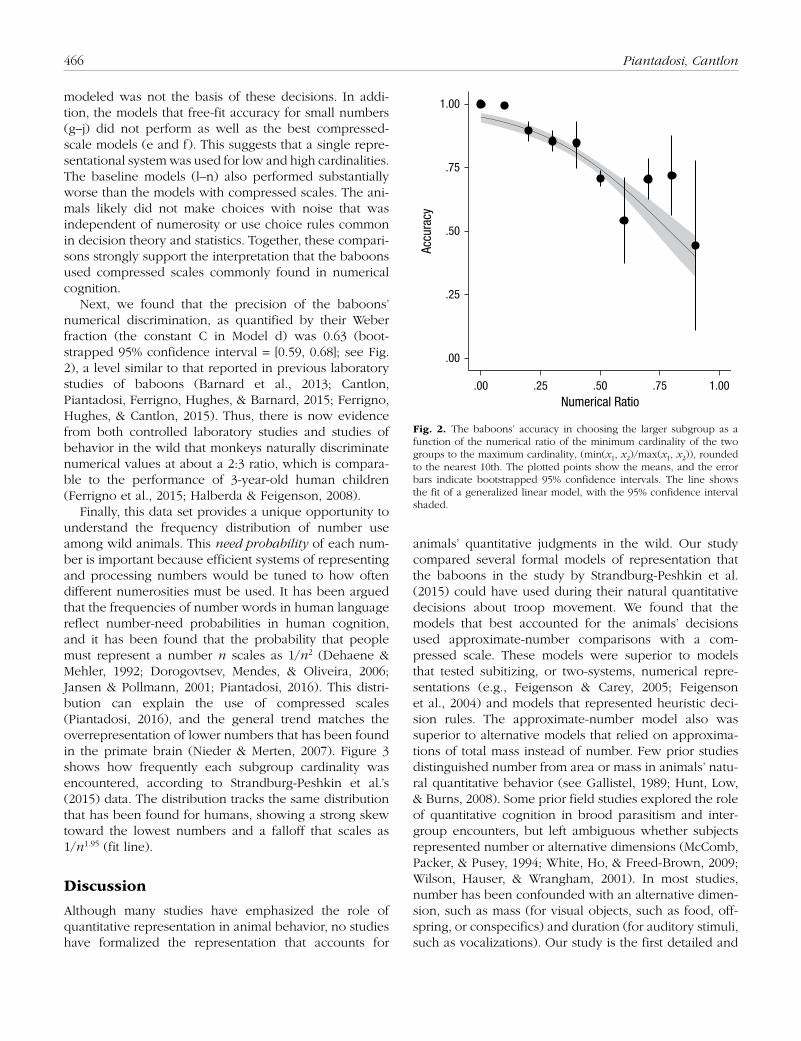
Next, we found that the precision of the baboons’ numerical discrimination, as quantified by their Weber fraction (the constant C in Model d) was 0.63 (boot-strapped 95% confidence interval = [0.59, 0.68]; see Fig. 2), a level similar to that reported in previous laboratory studies of baboons (Barnard et al., 2013; Cantlon, Piantadosi, Ferrigno, Hughes, & Barnard, 2015; Ferrigno, Hughes, & Cantlon, 2015). Thus, there is now evidence from both controlled laboratory studies and studies of behavior in the wild that monkeys naturally discriminate numerical values at about a 2:3 ratio, which is compara-ble to the performance of 3-year-old human children (Ferrigno et al., 2015; Halberda & Feigenson, 2008).
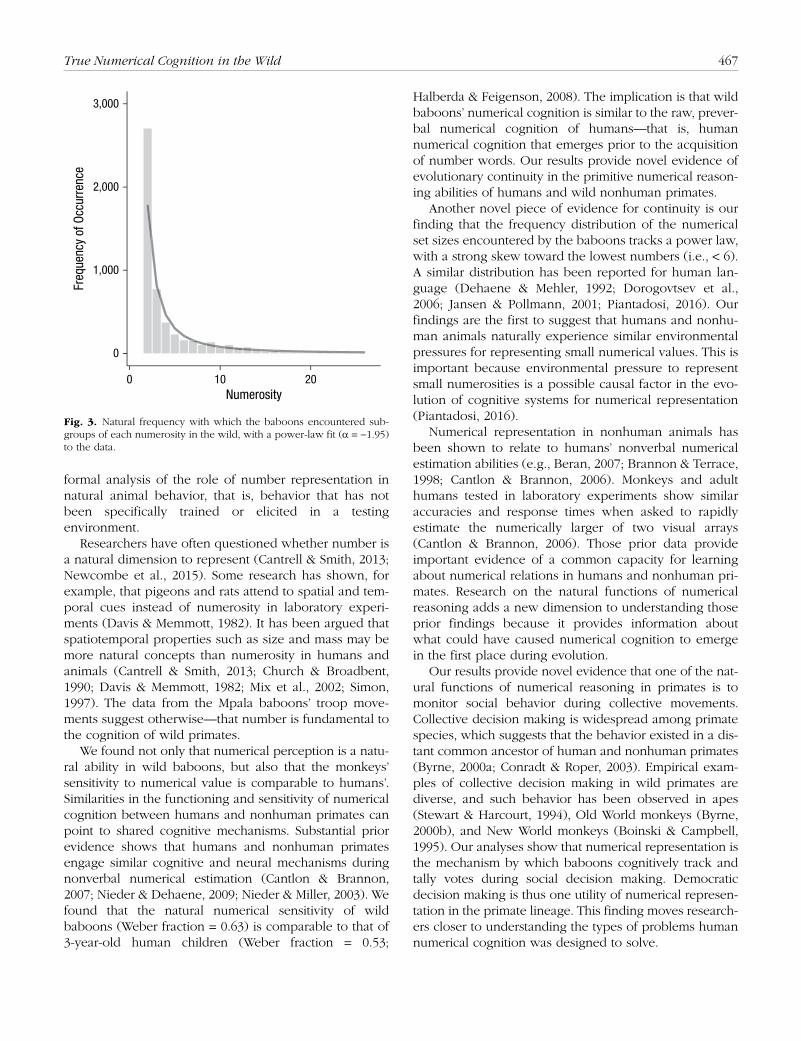
Finally, this data set provides a unique opportunity to understand the frequency distribution of number use among wild animals. This need probability of each num-ber is important because efficient systems of representing and processing numbers would be tuned to how often different numerosities must be used. It has been argued that the frequencies of number words in human language reflect number-need probabilities in human cognition, and it has been found that the probability that people must represent a number n scales as 1/n2 (Dehaene & Mehler, 1992; Dorogovtsev, Mendes, & Oliveira, 2006; Jansen & Pollmann, 2001; Piantadosi, 2016). This distri-bution can explain the use of compressed scales (Piantadosi, 2016), and the general trend matches the overrepresentation of lower numbers that has been found in the primate brain (Nieder & Merten, 2007). Figure 3 shows how frequently each subgroup cardinality was encountered, according to Strandburg-Peshkin et al.’s (2015) data. The distribution tracks the same distribution that has been found for humans, showing a strong skew toward the lowest numbers and a falloff that scales as 1/n1.95 (fit line).
Discussion
Although many studies have emphasized the role of quantitative representation in animal behavior, no studies have formalized the representation that accounts for
animals’ quantitative judgments in the wild. Our study compared several formal models of representation that the baboons in the study by Strandburg-Peshkin et al. (2015) could have used during their natural quantitative decisions about troop movement. We found that the models that best accounted for the animals’ decisions used approximate-number comparisons with a com-pressed scale. These models were superior to models that tested subitizing, or two-systems, numerical repre-sentations (e.g., Feigenson & Carey, 2005; Feigenson et al., 2004) and models that represented heuristic deci-sion rules. The approximate-number model also was superior to alternative models that relied on approxima-tions of total mass instead of number. Few prior studies distinguished number from area or mass in animals’ natu-ral quantitative behavior (see Gallistel, 1989; Hunt, Low, & Burns, 2008). Some prior field studies explored the role of quantitative cognition in brood parasitism and inter-group encounters, but left ambiguous whether subjects represented number or alternative dimensions (McComb, Packer, & Pusey, 1994; White, Ho, & Freed-Brown, 2009; Wilson, Hauser, & Wrangham, 2001). In most studies, number has been confounded with an alternative dimen-sion, such as mass (for visual objects, such as food, off-spring, or conspecifics) and duration (for auditory stimuli, such as vocalizations). Our study is the first detailed and
.00
.25
.50
.75
1.00
.00 .25 .50 .75 1.00Numerical Ratio
Accu
racy
Fig. 2. The baboons’ accuracy in choosing the larger subgroup as a function of the numerical ratio of the minimum cardinality of the two groups to the maximum cardinality, (min(x1, x2)/max(x1, x2)), rounded to the nearest 10th. The plotted points show the means, and the error bars indicate bootstrapped 95% confidence intervals. The line shows the fit of a generalized linear model, with the 95% confidence interval shaded.
True Numerical Cognition in the Wild 467
formal analysis of the role of number representation in natural animal behavior, that is, behavior that has not been specifically trained or elicited in a testing environment.
Researchers have often questioned whether number is a natural dimension to represent (Cantrell & Smith, 2013; Newcombe et al., 2015). Some research has shown, for example, that pigeons and rats attend to spatial and tem-poral cues instead of numerosity in laboratory experi-ments (Davis & Memmott, 1982). It has been argued that spatiotemporal properties such as size and mass may be more natural concepts than numerosity in humans and animals (Cantrell & Smith, 2013; Church & Broadbent, 1990; Davis & Memmott, 1982; Mix et al., 2002; Simon, 1997). The data from the Mpala baboons’ troop move-ments suggest otherwise—that number is fundamental to the cognition of wild primates.
We found not only that numerical perception is a natu-ral ability in wild baboons, but also that the monkeys’ sensitivity to numerical value is comparable to humans’. Similarities in the functioning and sensitivity of numerical cognition between humans and nonhuman primates can point to shared cognitive mechanisms. Substantial prior evidence shows that humans and nonhuman primates engage similar cognitive and neural mechanisms during nonverbal numerical estimation (Cantlon & Brannon, 2007; Nieder & Dehaene, 2009; Nieder & Miller, 2003). We found that the natural numerical sensitivity of wild baboons (Weber fraction = 0.63) is comparable to that of 3-year-old human children (Weber fraction = 0.53;
Halberda & Feigenson, 2008). The implication is that wild baboons’ numerical cognition is similar to the raw, prever-bal numerical cognition of humans—that is, human numerical cognition that emerges prior to the acquisition of number words. Our results provide novel evidence of evolutionary continuity in the primitive numerical reason-ing abilities of humans and wild nonhuman primates.
Another novel piece of evidence for continuity is our finding that the frequency distribution of the numerical set sizes encountered by the baboons tracks a power law, with a strong skew toward the lowest numbers (i.e., < 6). A similar distribution has been reported for human lan-guage (Dehaene & Mehler, 1992; Dorogovtsev et al., 2006; Jansen & Pollmann, 2001; Piantadosi, 2016). Our findings are the first to suggest that humans and nonhu-man animals naturally experience similar environmental pressures for representing small numerical values. This is important because environmental pressure to represent small numerosities is a possible causal factor in the evo-lution of cognitive systems for numerical representation (Piantadosi, 2016).
Numerical representation in nonhuman animals has been shown to relate to humans’ nonverbal numerical estimation abilities (e.g., Beran, 2007; Brannon & Terrace, 1998; Cantlon & Brannon, 2006). Monkeys and adult humans tested in laboratory experiments show similar accuracies and response times when asked to rapidly estimate the numerically larger of two visual arrays (Cantlon & Brannon, 2006). Those prior data provide important evidence of a common capacity for learning about numerical relations in humans and nonhuman pri-mates. Research on the natural functions of numerical reasoning adds a new dimension to understanding those prior findings because it provides information about what could have caused numerical cognition to emerge in the first place during evolution.
Our results provide novel evidence that one of the nat-ural functions of numerical reasoning in primates is to monitor social behavior during collective movements. Collective decision making is widespread among primate species, which suggests that the behavior existed in a dis-tant common ancestor of human and nonhuman primates (Byrne, 2000a; Conradt & Roper, 2003). Empirical exam-ples of collective decision making in wild primates are diverse, and such behavior has been observed in apes (Stewart & Harcourt, 1994), Old World monkeys (Byrne, 2000b), and New World monkeys (Boinski & Campbell, 1995). Our analyses show that numerical representation is the mechanism by which baboons cognitively track and tally votes during social decision making. Democratic decision making is thus one utility of numerical represen-tation in the primate lineage. This finding moves research-ers closer to understanding the types of problems human numerical cognition was designed to solve.
0
1,000
2,000
3,000
0 10 20Numerosity
Freq
uenc
y of
Occ
urre
nce
Fig. 3. Natural frequency with which the baboons encountered sub-groups of each numerosity in the wild, with a power-law fit (α = −1.95) to the data.
468 Piantadosi, Cantlon
Action Editor
Steven W. Gangestad served as action editor for this article.
Author Contributions
J. F. Cantlon and S. T. Piantadosi designed the study and analy-ses. S. T. Piantadosi performed the analyses. J. F. Cantlon and S. T. Piantadosi interpreted the findings and wrote the manuscript.
Acknowledgments
This research was supported by grants from the National Sci-ence Foundation (DRL1459625, to J. F. Cantlon), the National Institutes of Health (R01 HD085996, to J. F. Cantlon and S. T. Piantadosi), and the James S. McDonnell Foundation Under-standing Human Cognition Program.
Declaration of Conflicting Interests
The authors declared that they had no conflicts of interest with respect to their authorship or the publication of this article.
Supplemental Material
Additional supporting information can be found at http://journals.sagepub.com/doi/suppl/10.1177/0956797616686862
Open Practices
The analyses reported here were based on independent data collected by Strandburg-Peshkin, Farine, Couzin, and Crofoot (2015). There are no materials to share. The complete Open Practices Disclosure for this article can be found at http://journals.sagepub.com/doi/suppl/10.1177/0956797616686862.
References
Akaike, H. (1974). A new look at the statistical model identifica-tion. IEEE Transactions on Automatic Control, 19, 716–723.
Barnard, A. M., Hughes, K. D., Gerhardt, R. R., DiVincenti, L., Jr., Bovee, J. M., & Cantlon, J. F. (2013). Inherently analog quan-tity representations in olive baboons (Papio anubis). Frontiers in Psychology, 4, Article 253. doi:10.3389/fpsyg.2013.00253
Beran, M. J. (2007). Rhesus monkeys (macaca mulatta) enumer-ate large and small sequentially presented sets of items using analog numerical representations. Journal of Experimental Psychology: Animal Behavior Processes, 33, 42–54.
Boinski, S., & Campbell, A. F. (1995). Use of trill vocalizations to coordinate troop movement among white-faced capu-chins: A second field test. Behaviour, 132, 875–901.
Brent, R. P. (1973). Algorithms for minimization without deriv-atives. New York, NY: Dover.
Burnham, K. P., & Anderson, D. R. (2002). Model selection and multimodel inference: A practical information-theoretic approach. New York, NY: Springer-Verlag.
Byrne, R. W. (2000a). The evolution of primate cognition. Cognitive Science, 24, 543–570.
Byrne, R. W. (2000b). How monkeys find their way. Leadership, coordination, and cognitive maps of African baboons. In S. Boinski & P. A. Garber (Eds.), On the move: How and
why animals travel in groups (pp. 491–518). Chicago, IL: University of Chicago Press.
Cantlon, J. F., & Brannon, E. M. (2006). Shared system for ordering small and large numbers in monkeys and humans. Psychological Science, 17, 401–406.
Cantlon, J. F., & Brannon, E. M. (2007). How much does num-ber matter to a monkey (macaca mulatta)? Journal of Experimental Psychology: Animal Behavior Processes, 33, 32–41.
Cantlon, J. F., Piantadosi, S. T., Ferrigno, S., Hughes, K. D., & Barnard, A. M. (2015). The origins of counting algorithms. Psychological Science, 26, 853–865.
Cantrell, L., & Smith, L. B. (2013). Open questions and a pro-posal: A critical review of the evidence on infant numerical abilities. Cognition, 128, 331–352.
Church, R. M., & Broadbent, H. A. (1990). Alternative repre-sentations of time, number, and rate. Cognition, 37, 55–81.
Conradt, L., & Roper, T. J. (2003). Group decision-making in animals. Nature, 421, 155–158.
Davis, H., & Memmott, J. (1982). Counting behavior in animals: A critical evaluation. Psychological Bulletin, 92, 547–571.
Dehaene, S. (2009). Origins of mathematical intuitions. Annals of the New York Academy of Sciences, 1156, 232–259.
Dehaene, S., & Mehler, J. (1992). Cross-linguistic regularities in the frequency of number words. Cognition, 43, 1–29.
Dorogovtsev, S. N., Mendes, J. F. F., & Oliveira, J. G. (2006). Frequency of occurrence of numbers in the World Wide Web. Physica A: Statistical mechanics and Its Applications, 360, 548–556.
Feigenson, L., & Carey, S. (2005). On the limits of infants’ quan-tification of small object arrays. Cognition, 97, 295–313.
Feigenson, L., Dehaene, S., & Spelke, E. (2004). Core systems of number. Trends in Cognitive Sciences, 8, 307–314.
Ferrigno, S., Hughes, K. D., & Cantlon, J. F. (2015). Precocious quantitative cognition in monkeys. Psychonomic Bulletin & Review, 23, 141–147.
Gallistel, C. R. (1989). Animal cognition: The representation of space, time and number. Annual Review of Psychology, 40, 155–189.
Gallistel, C. R. (1990). Representations in animal cognition: An introduction. Cognition, 37, 1–22.
Halberda, J., & Feigenson, L. (2008). Developmental change in the acuity of the “number sense”: The approximate number system in 3-, 4-, 5-, and 6-year-olds and adults. Developmental Psychology, 44, 1457–1465.
Hunt, S., Low, J., & Burns, K. (2008). Adaptive numerical com-petency in a food-hoarding songbird. Proceedings of the Royal Society B: Biological Sciences, 275, 2373–2379.
Jansen, C. J., & Pollmann, M. M. (2001). On round numbers: Pragmatic aspects of numerical expressions. Journal of Quantitative Linguistics, 8, 187–201.
McComb, K., Packer, C., & Pusey, A. (1994). Roaring and numer-ical assessment in contests between groups of female lions, Panthera leo. Animal Behaviour, 47, 379–387.
Mix, K. S., Huttenlocher, J., & Levine, S. C. (2002). Multiple cues for quantification in infancy: Is number one of them? Psychological Bulletin, 128, 278–294.
Newcombe, N. S., Levine, S. C., & Mix, K. S. (2015). Thinking about quantity: The intertwined development of spatial
True Numerical Cognition in the Wild 469
and numerical cognition. Wiley Interdisciplinary Reviews: Cognitive Science, 6, 491–505.
Nieder, A., & Dehaene, S. (2009). Representation of number in the brain. Annual Review of Neuroscience, 32, 185–208.
Nieder, A., & Merten, K. (2007). A labeled-line code for small and large numerosities in the monkey prefrontal cortex. The Journal of Neuroscience, 27, 5986–5993.
Nieder, A., & Miller, E. (2003). Coding of cognitive magnitude-compressed scaling of numerical information in the primate prefrontal cortex. Neuron, 37, 149–158.
Piantadosi, S. T. (2016). A rational analysis of the approxi-mate number system. Psychonomic Bulletin & Review, 23, 877–886.
Seeley, T. D., & Buhrman, S. C. (1999). Group decision mak-ing in swarms of honey bees. Behavioral Ecology and Sociobiology, 45, 19–31.
Simon, T. J. (1997). Reconceptualizing the origins of num-ber knowledge: A non-numerical account. Cognitive Development, 12, 349–372.
Stewart, K. J., & Harcourt, A. H. (1994). Gorillas’ vocaliza-tions during rest periods: Signals of impending departure? Behaviour, 130, 29–40.
Strandburg-Peshkin, A., Farine, D. R., Couzin, I. D., & Crofoot, M. C. (2015). Shared decision-making drives collective movement in wild baboons. Science, 348, 1358–1361.
White, D. J., Ho, L., & Freed-Brown, G. (2009). Counting chicks before they hatch: Female cowbirds can time readiness of a host nest for parasitism. Psychological Science, 20, 1140–1145.
Wilson, M. L., Hauser, M. D., & Wrangham, R. W. (2001). Does participation in intergroup conflict depend on numerical assessment, range location, or rank for wild chimpanzees? Animal Behaviour, 61, 1203–1216.