ttm technologies, inc. annual shareholder meeting
TRANSCRIPT
TTM Technologies, Inc.Annual Shareholder
Meeting
May 7th 2020
Forward-Looking Statements
This communication may contain “forward-looking statements” within the meaning of the Private Securities Litigation Reform Act of 1995, including statements related to the future business outlook, events, and expected performance of TTM Technologies, Inc.
(“TTM”, “we” or the “Company”). The words “anticipate,” “believe,” “plan,” “forecast,” “foresee,” “estimate,” “project,” “expect,” “seek,” “target,” “intend,” “goal” and other similar expressions, among others, generally identify “forward-looking statements,” which speak
only as of the date the statements were made and are not guarantees of performance. Actual results may differ materially from these forward-looking statements. Such statements relate to a variety of matters, including but not limited to the operations of TTM’s
businesses. These statements reflect the current beliefs, expectations and assumptions of the management of TTM, and we believe such statements to have a reasonable basis.
It is uncertain whether any of the events anticipated by the forward-looking statements will transpire or occur, or if any of them do, what impact they will have on the results of operations and financial condition of the Company. These forward-looking statements are
based on assumptions that may not materialize, and involve certain risks and uncertainties, many of which are beyond our control, that could cause actual events or performance to differ materially from those indicated in such forward-looking statements. Factors,
risks, trends, and uncertainties that could cause actual results to differ materially from those projected, anticipated, or implied in forward-looking statements include, but are not limited to potential changes in domestic or global economic conditions, demand for our
products, market pressures on prices of our products, warranty claims, changes in product mix, contemplated significant capital expenditures and related financing requirements, our dependence upon a small number of customers, and other factors set forth in the
Company’s most recent Annual Report on Form 10-K and Quarterly Report on Form 10-Q and in the Company’s other filings filed with the Securities and Exchange Commission (the “SEC”), including under the heading “Risk Factors”, and which are available at the
SEC’s website at www.sec.gov.
TTM does not undertake any obligation to update any of these statements to reflect any new information, subsequent events or circumstances, or otherwise, except as may be required by law, even if experience or future changes make it clear that any projected
results expressed in this communication or future communications to stockholders, press releases or Company statements will not be realized. In addition, the inclusion of any statement in this communication does not constitute an admission by us that the events or
circumstances described in such statement are material.
Use of Non-GAAP Financial Measures
In addition to the financial statements presented in accordance with U.S. generally accepted accounting principles (“GAAP”), TTM uses certain non-GAAP financial measures, including EBITDA, Adjusted EBITDA, Non-GAAP Operating Income, Non-GAAP Net
Income, Non-GAAP Operating Margin, Non-GAAP Gross Margin , Non-GAAP EPS and Adjusted Operating Cash Flow. We present non-GAAP financial information to enable investors to see TTM through the eyes of management and to provide better insight into
our ongoing financial performance.
A material limitation associated with the use of the above non-GAAP financial measures is that they have no standardized measurement prescribed by GAAP and may not be comparable to similar non-GAAP financial measures used by other companies. We
compensate for these limitations by providing full disclosure of each non-GAAP financial measure and reconciliation to the most directly comparable GAAP financial measure. However, the non-GAAP financial measures should not be considered in isolation from, or
as a substitute for, financial information prepared in accordance with GAAP.
See Appendix for reconciliations of Adjusted EBITDA and Non-GAAP Operating Income to the most comparable GAAP metric.
Data Used in This Presentation
Due to rounding, numbers presented throughout this and other documents may not add up precisely to the totals provided and percentages may not precisely reflect the absolute figures.
Third Party Information
The information contained herein does not purport to be all inclusive. This presentation has been prepared by the Company and includes information from other sources believed by the Company to be reliable. No representation or warranty, express or implied, is
made as to the fairness, accuracy or completeness of any of the opinions and conclusions set forth herein based on such information. This presentation may contain descriptions or summaries of certain documents and agreements, but such descriptions or
summaries are qualified in their entirety by reference to the actual documents or agreements. Unless otherwise indicated, the information contained herein speaks only as of the date hereof and is subject to change, completion or amendment without notice.
Disclaimers
2
3
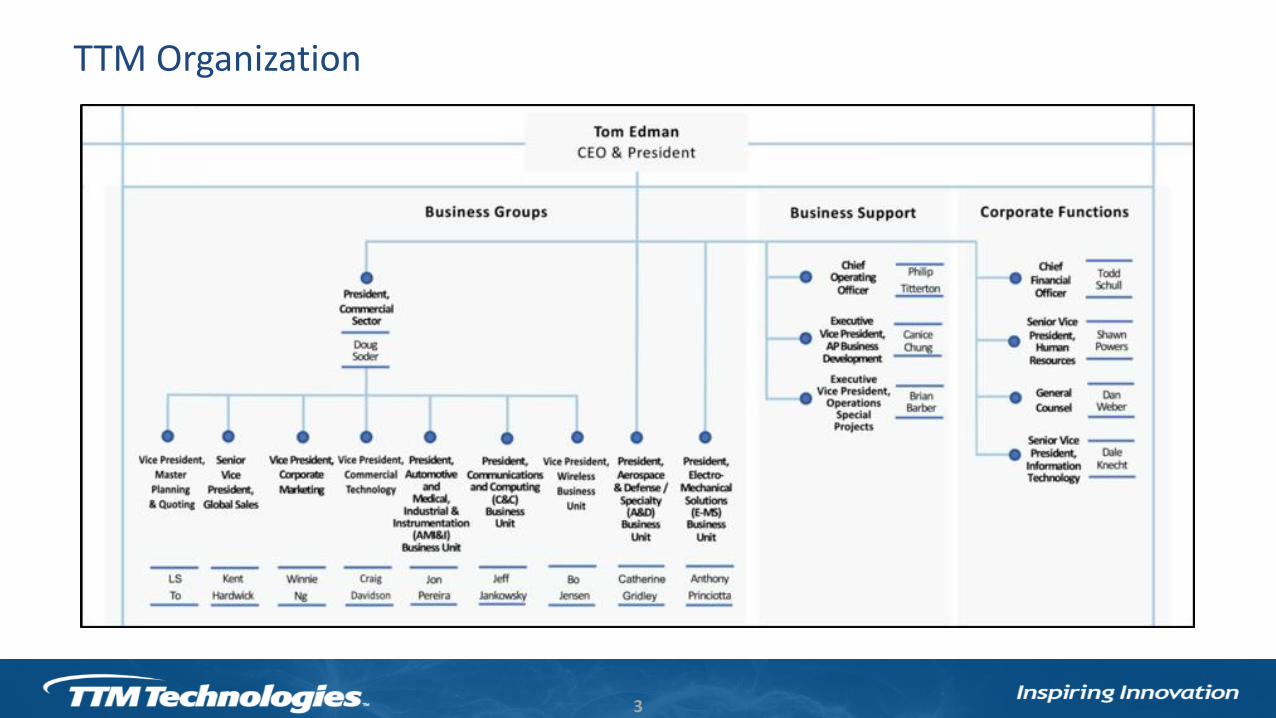
TTM Organization
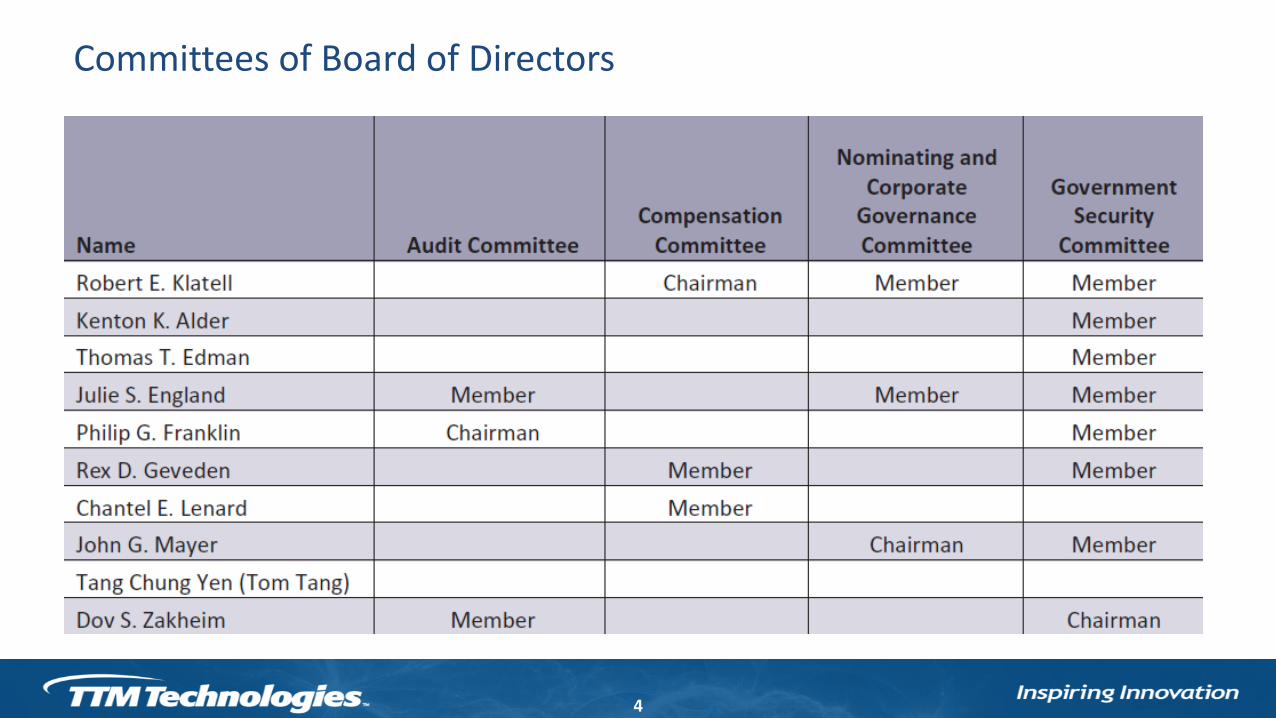
Committees of Board of Directors
4
INSPIRING INNOVATION
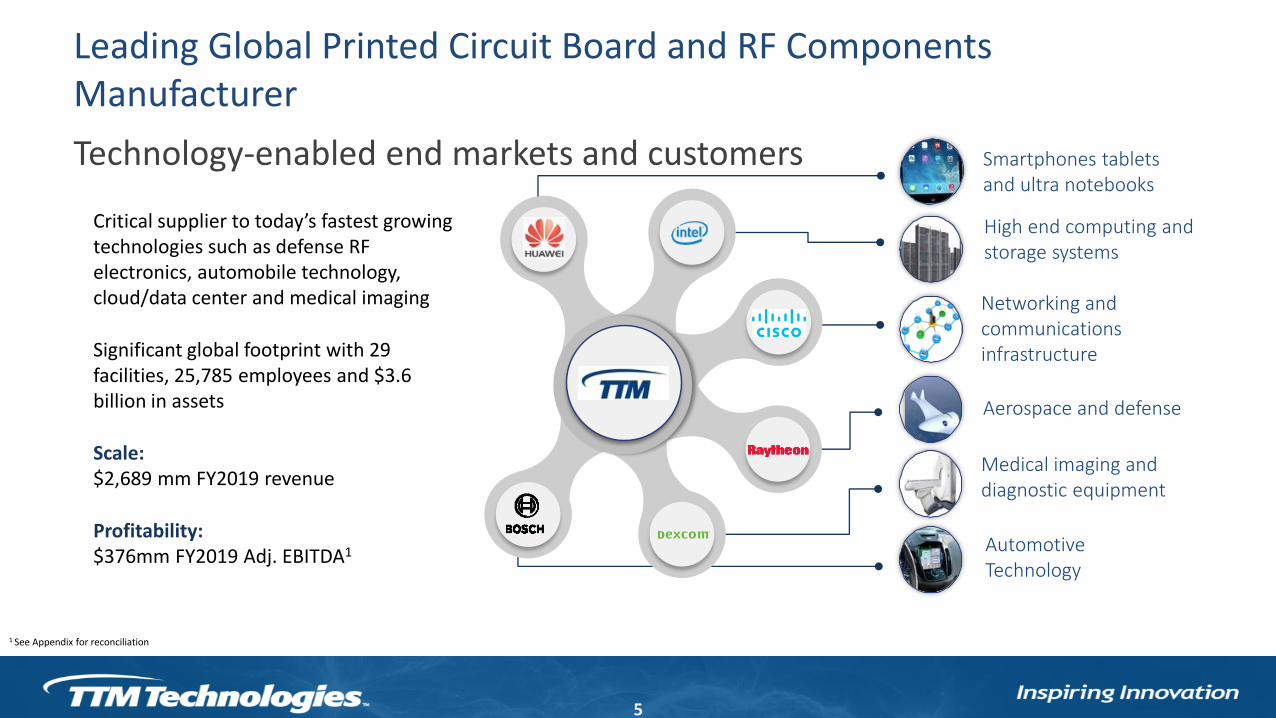
Critical supplier to today’s fastest growing technologies such as defense RF electronics, automobile technology, cloud/data center and medical imaging
Significant global footprint with 29 facilities, 25,785 employees and $3.6 billion in assets
Scale: $2,689 mm FY2019 revenue
Profitability: $376mm FY2019 Adj. EBITDA1
Technology-enabled end markets and customers
Leading Global Printed Circuit Board and RF Components Manufacturer
5
1 See Appendix for reconciliation
Smartphones tabletsand ultra notebooks
High end computing and storage systems
Networking andcommunications infrastructure
Aerospace and defense
Medical imaging and diagnostic equipment
AutomotiveTechnology
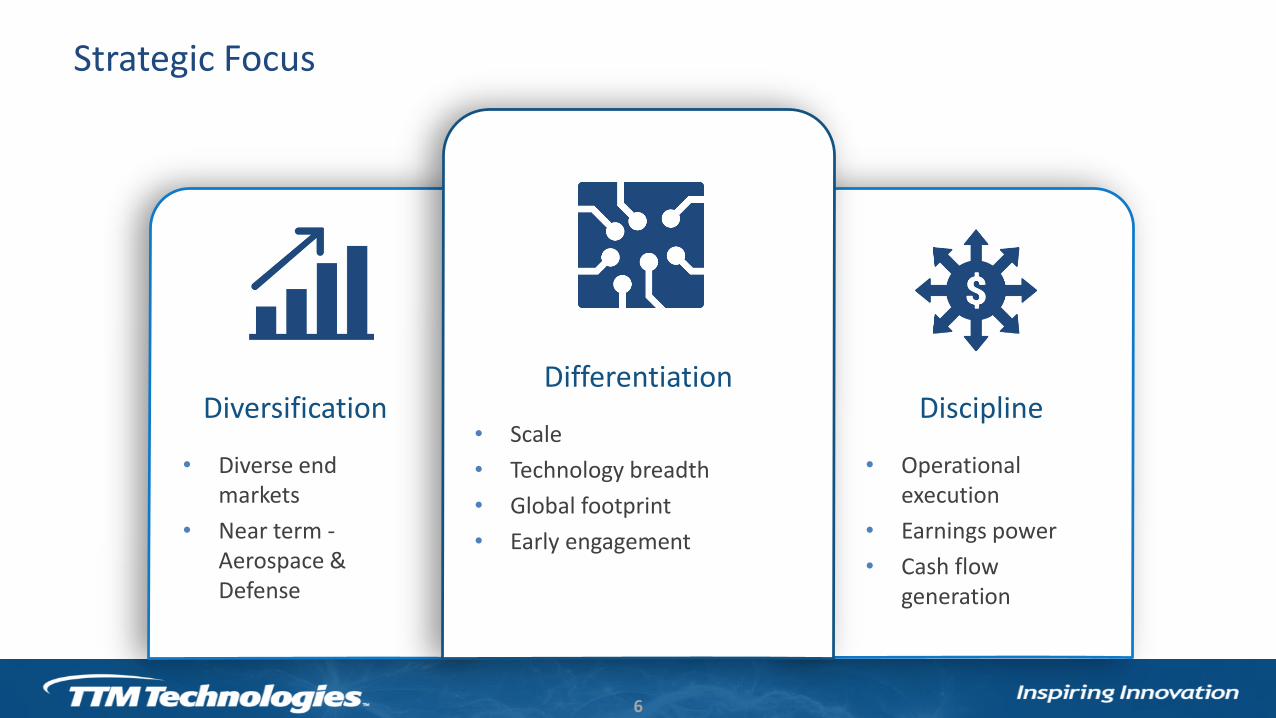
Diversification
• Diverse end markets
• Near term -Aerospace & Defense
Discipline
• Operational execution
• Earnings power
• Cash flow generation
Strategic Focus
6
Differentiation
• Scale
• Technology breadth
• Global footprint
• Early engagement
INSPIRING INNOVATION
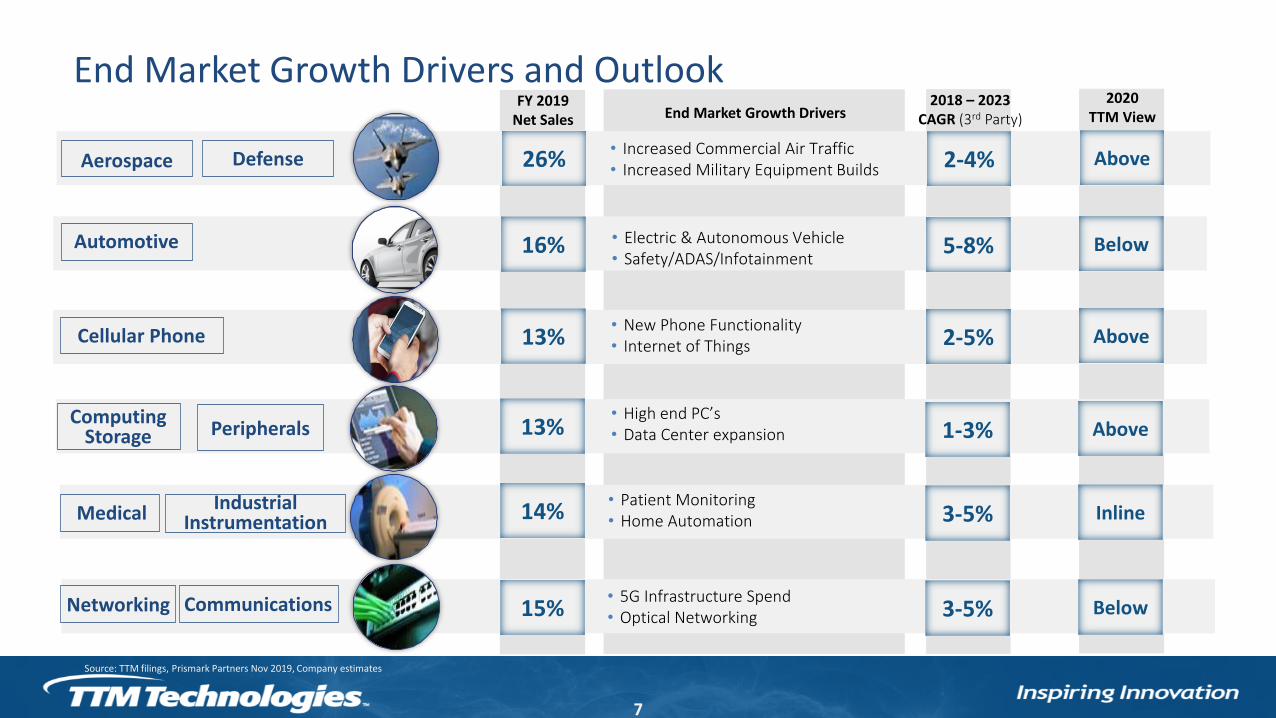
End Market Growth Drivers and Outlook
7
Source: TTM filings, Prismark Partners Nov 2019, Company estimates
26%• Increased Commercial Air Traffic• Increased Military Equipment Builds 2-4% AboveAerospace Defense
16% • Electric & Autonomous Vehicle• Safety/ADAS/Infotainment
5-8% BelowAutomotive
13%• New Phone Functionality• Internet of Things 2-5% AboveCellular Phone
13%• High end PC’s• Data Center expansion 1-3% Above
Computing Storage Peripherals
14%• Patient Monitoring• Home Automation 3-5% InlineMedical Industrial
Instrumentation
15%• 5G Infrastructure Spend• Optical Networking 3-5% BelowNetworking Communications
FY 2019Net Sales End Market Growth Drivers
2018 – 2023 CAGR (3rd Party)
2020TTM View
INSPIRING INNOVATION
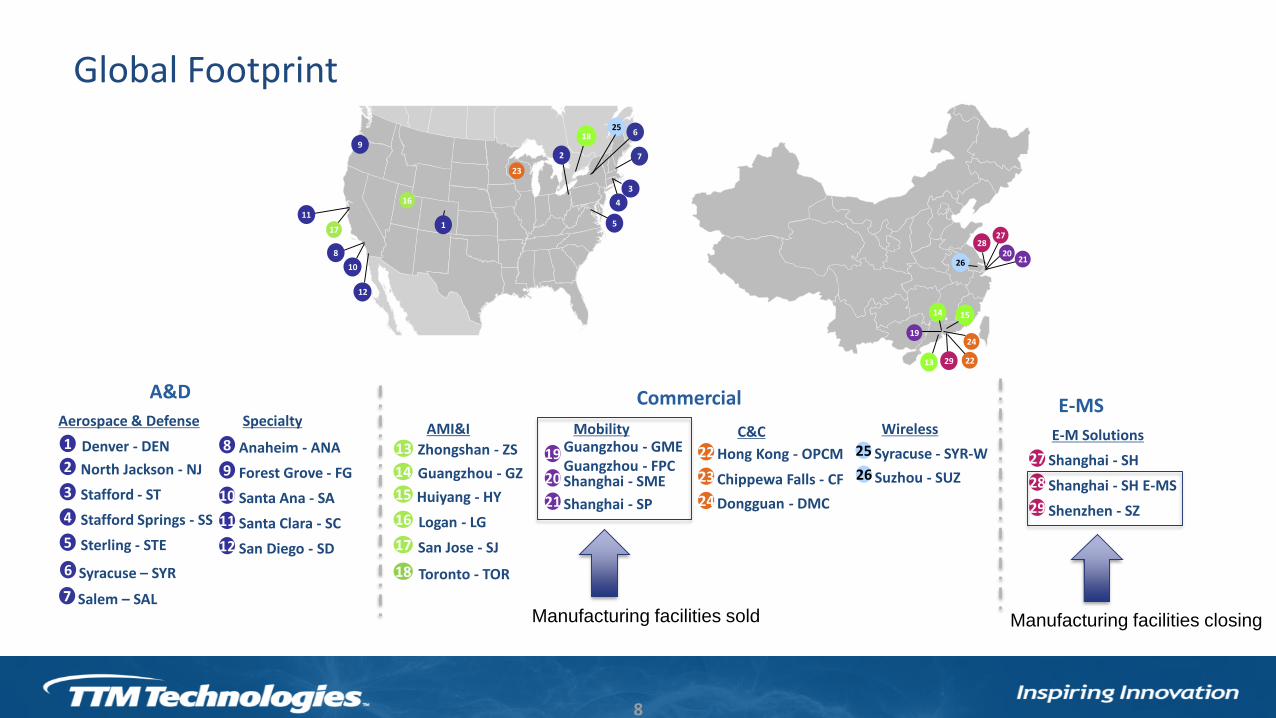
Global Footprint
8
7 Salem – SAL
Syracuse – SYR6
26 Suzhou - SUZ
Aerospace & Defense
5 Sterling - STE
Stafford Springs - SS4
3 Stafford - ST
1 Denver - DEN
2 North Jackson - NJ
Specialty
8 Anaheim - ANA
Santa Ana - SA10
9 Forest Grove - FG
11 Santa Clara - SC
San Diego - SD12
Logan - LG16
17 San Jose - SJ
Toronto - TOR18
15 Huiyang - HY
AMI&I
Zhongshan - ZS13
14 Guangzhou - GZ
29 Shenzhen - SZ
27 Shanghai - SH
Shanghai - SH E-MS28
E-M Solutions
A&D Commercial E-MS
23 Chippewa Falls - CF
24 Dongguan - DMC
Hong Kong - OPCM22
C&CMobilityGuangzhou - GMEGuangzhou - FPC
19
20 Shanghai - SME
Shanghai - SP21
15
2021
2728
1
2
8
9
5
18
3
23
16
17
13 22
1924
29
12
11
4
10
14
26
6
7
Wireless
Syracuse - SYR-W25
25
Manufacturing facilities sold Manufacturing facilities closing

INSPIRING INNOVATION
Non-GAAP EPS1Non-GAAP Operating Margin1Revenues ($ millions)
Reported Annual Revenue and Profit Growth
9
Increased scale, diversification, and differentiation1All TTM financials are reported non-GAAP. See Appendix for reconciliation
$2,095
$2,533$2,659
$2,847$2,689
0
1,000
2,000
3,000
FY 2015 FY 2016 FY 2017 FY 2018 FY 2019
7.0%
8.8%9.6% 9.4%
7.6%
0%
5%
10%
15%
FY 2015 FY 2016 FY 2017 FY 2018 FY 2019
$0.87
$1.40
$1.57
$1.76
$1.13
$0.00
$0.50
$1.00
$1.50
$2.00
FY 2015 FY 2016 FY 2017 FY 2018 FY 2019
INSPIRING INNOVATION
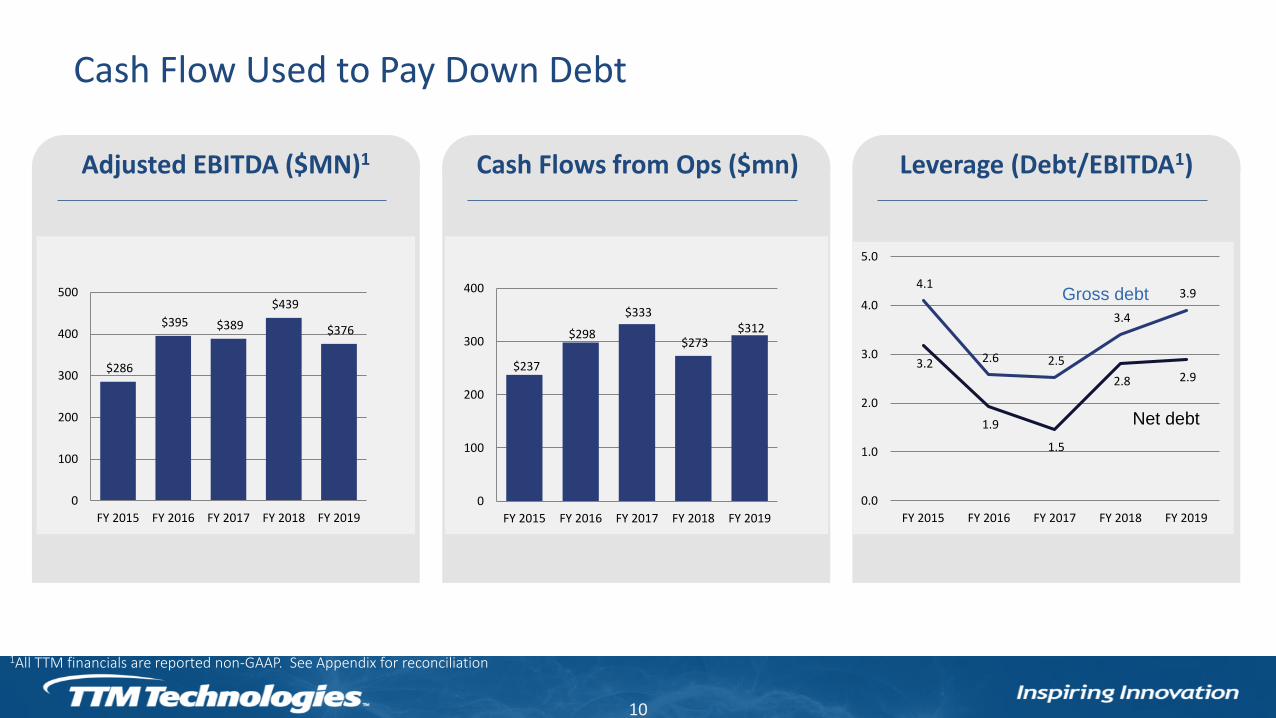
Leverage (Debt/EBITDA1)Cash Flows from Ops ($mn)Adjusted EBITDA ($MN)1
Cash Flow Used to Pay Down Debt
10
4.1
2.6 2.5
3.4
3.9
3.2
1.9
1.5
2.8 2.9
0.0
1.0
2.0
3.0
4.0
5.0
FY 2015 FY 2016 FY 2017 FY 2018 FY 2019
Gross debt
Net debt
$237
$298
$333
$273 $312
0
100
200
300
400
FY 2015 FY 2016 FY 2017 FY 2018 FY 2019
$286
$395 $389
$439
$376
0
100
200
300
400
500
FY 2015 FY 2016 FY 2017 FY 2018 FY 2019
1All TTM financials are reported non-GAAP. See Appendix for reconciliation
INSPIRING INNOVATION
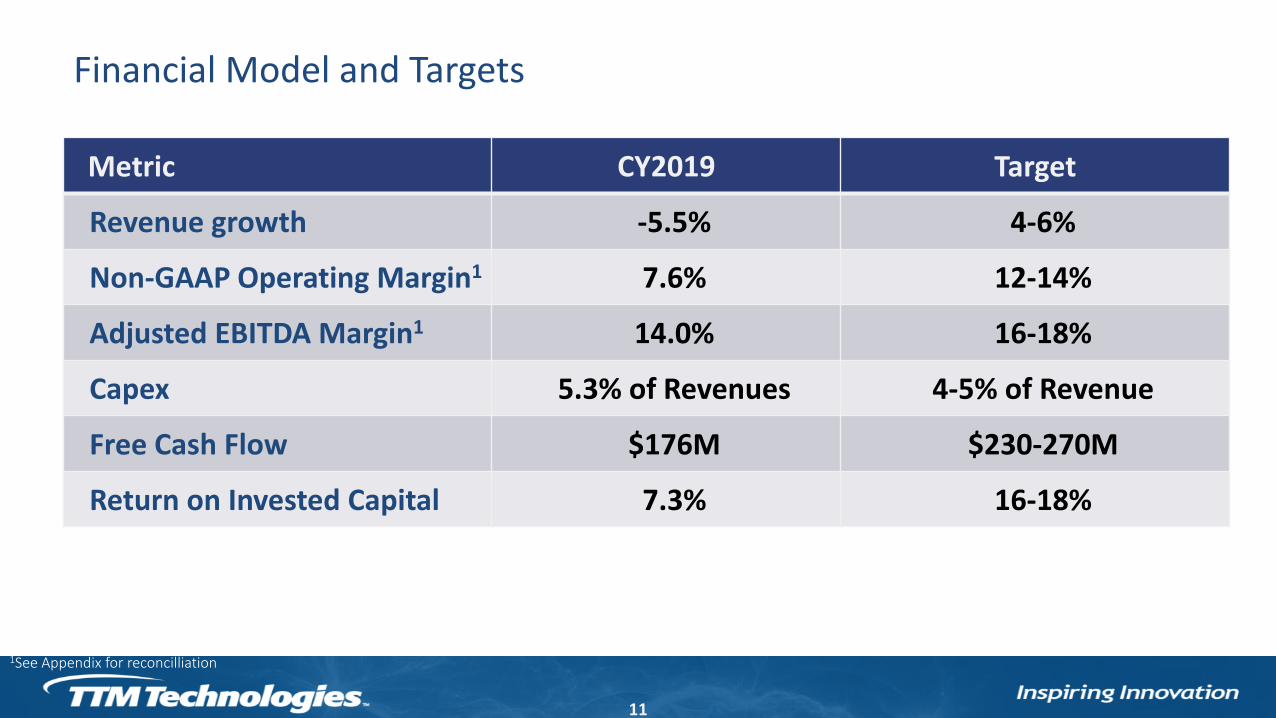
Financial Model and Targets
11
Metric CY2019 Target
Revenue growth -5.5% 4-6%
Non-GAAP Operating Margin1 7.6% 12-14%
Adjusted EBITDA Margin1 14.0% 16-18%
Capex 5.3% of Revenues 4-5% of Revenue
Free Cash Flow $176M $230-270M
Return on Invested Capital 7.3% 16-18%
1See Appendix for reconcilliation
Divestiture of Mobility Business Unit
12
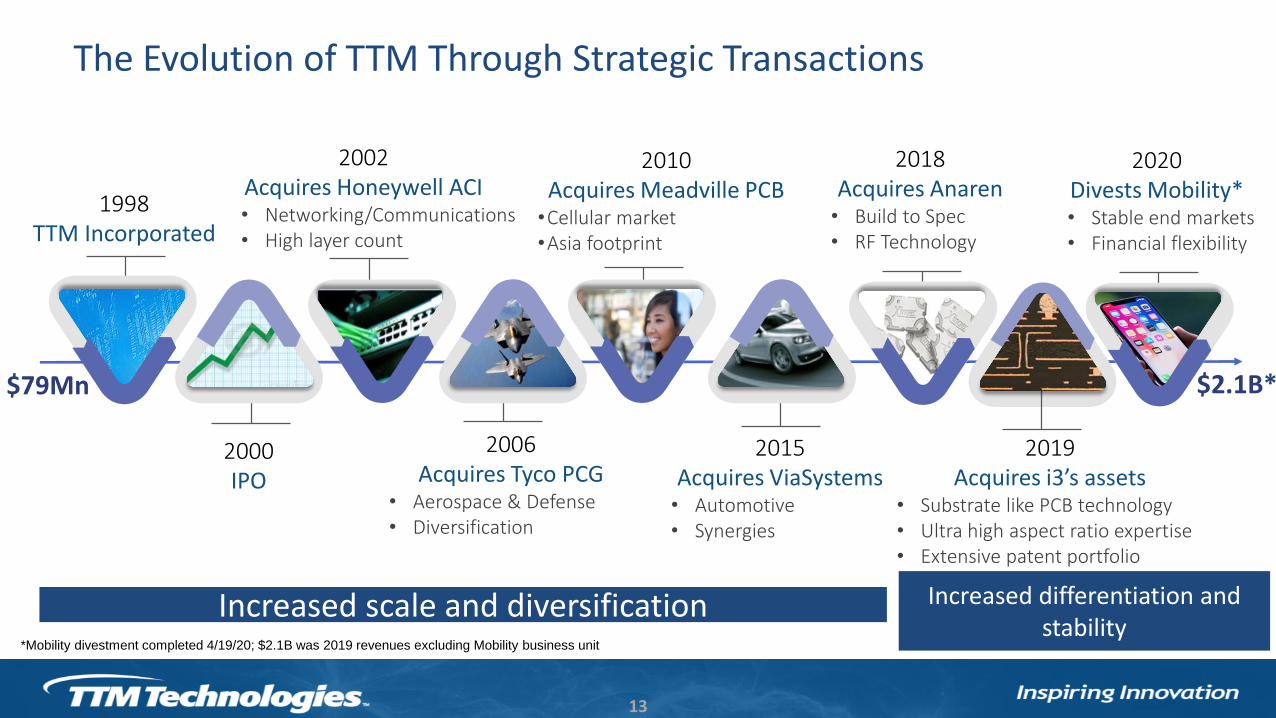
$2.1B*$79Mn
The Evolution of TTM Through Strategic Transactions
13
1998TTM Incorporated
2000IPO
2002Acquires Honeywell ACI• Networking/Communications• High layer count
2006Acquires Tyco PCG
• Aerospace & Defense• Diversification
2010Acquires Meadville PCB
•Cellular market•Asia footprint
2015Acquires ViaSystems
• Automotive• Synergies
2018Acquires Anaren
• Build to Spec• RF Technology
Increased scale and diversification Increased differentiation and stability
2019Acquires i3’s assets
• Substrate like PCB technology• Ultra high aspect ratio expertise• Extensive patent portfolio
2020Divests Mobility*• Stable end markets• Financial flexibility
*Mobility divestment completed 4/19/20; $2.1B was 2019 revenues excluding Mobility business unit
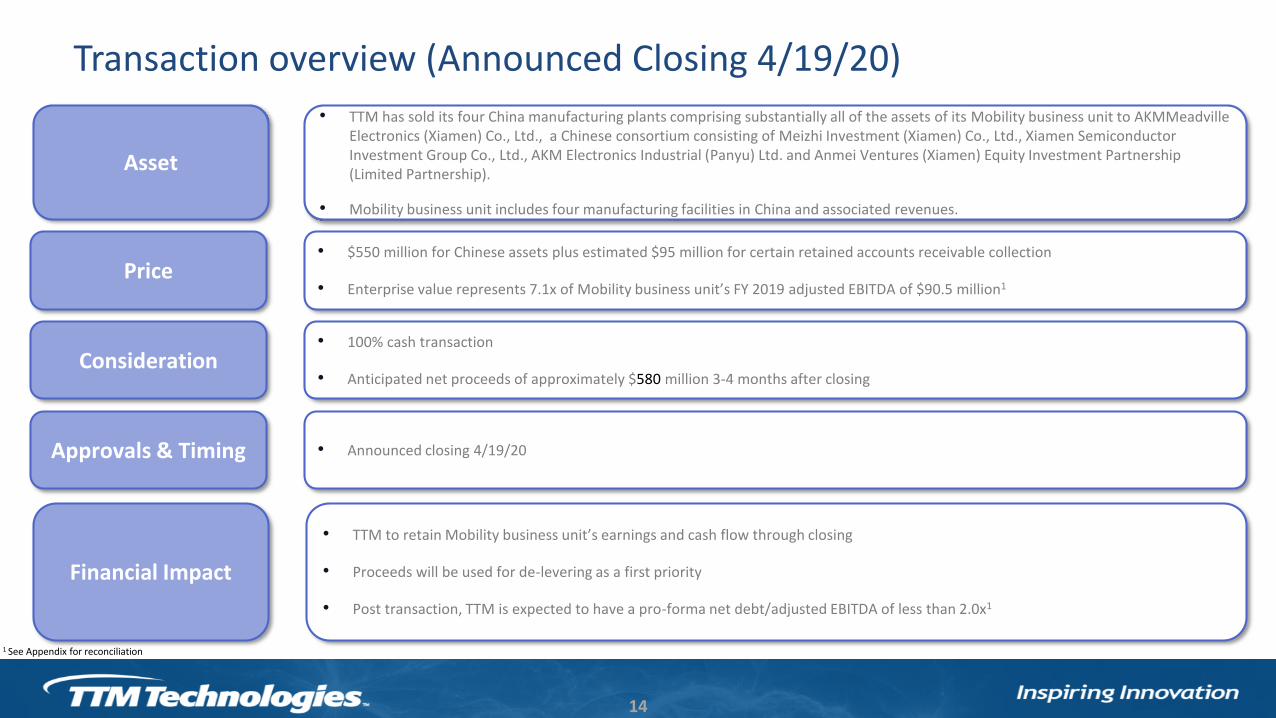
Transaction overview (Announced Closing 4/19/20)
14
• TTM has sold its four China manufacturing plants comprising substantially all of the assets of its Mobility business unit to AKMMeadvilleElectronics (Xiamen) Co., Ltd., a Chinese consortium consisting of Meizhi Investment (Xiamen) Co., Ltd., Xiamen Semiconductor Investment Group Co., Ltd., AKM Electronics Industrial (Panyu) Ltd. and Anmei Ventures (Xiamen) Equity Investment Partnership (Limited Partnership).
• Mobility business unit includes four manufacturing facilities in China and associated revenues.
Asset
Price• $550 million for Chinese assets plus estimated $95 million for certain retained accounts receivable collection
• Enterprise value represents 7.1x of Mobility business unit’s FY 2019 adjusted EBITDA of $90.5 million1
Consideration• 100% cash transaction
• Anticipated net proceeds of approximately $580 million 3-4 months after closing
Approvals & Timing • Announced closing 4/19/20
Financial Impact
• TTM to retain Mobility business unit’s earnings and cash flow through closing
• Proceeds will be used for de-levering as a first priority
• Post transaction, TTM is expected to have a pro-forma net debt/adjusted EBITDA of less than 2.0x1
1 See Appendix for reconciliation
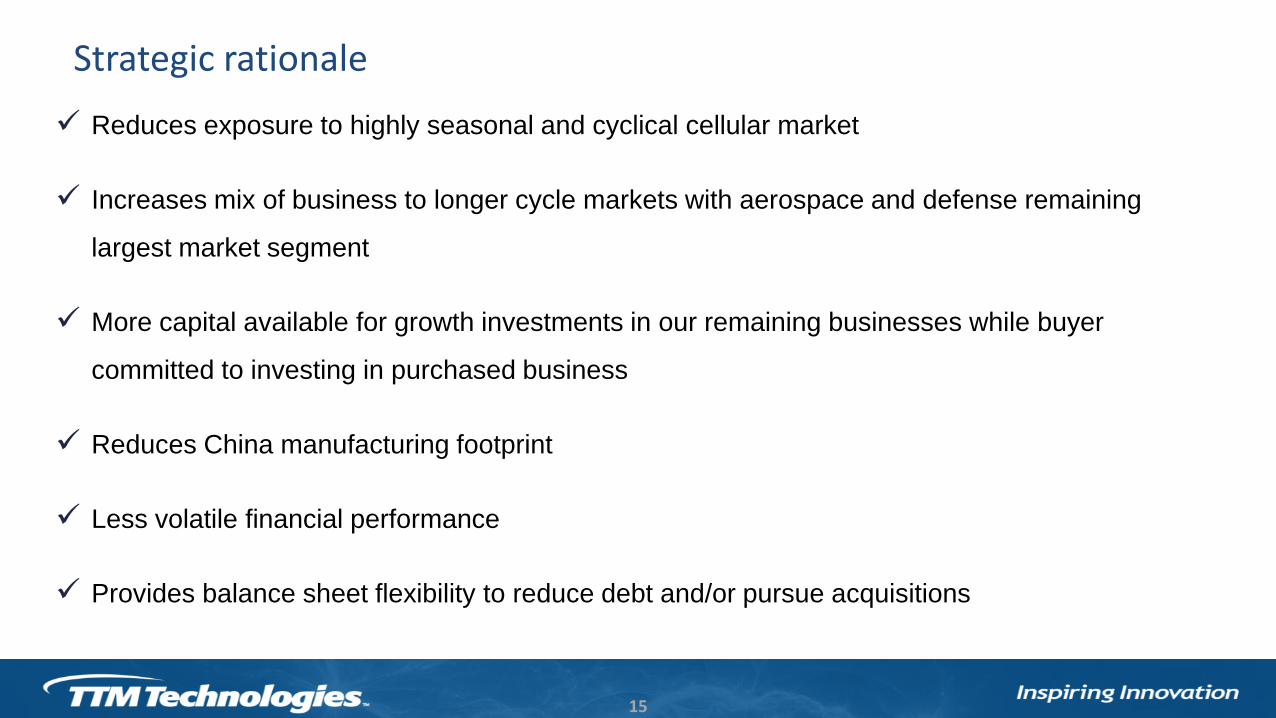
Strategic rationale
15
Reduces exposure to highly seasonal and cyclical cellular market
Increases mix of business to longer cycle markets with aerospace and defense remaining
largest market segment
More capital available for growth investments in our remaining businesses while buyer
committed to investing in purchased business
Reduces China manufacturing footprint
Less volatile financial performance
Provides balance sheet flexibility to reduce debt and/or pursue acquisitions
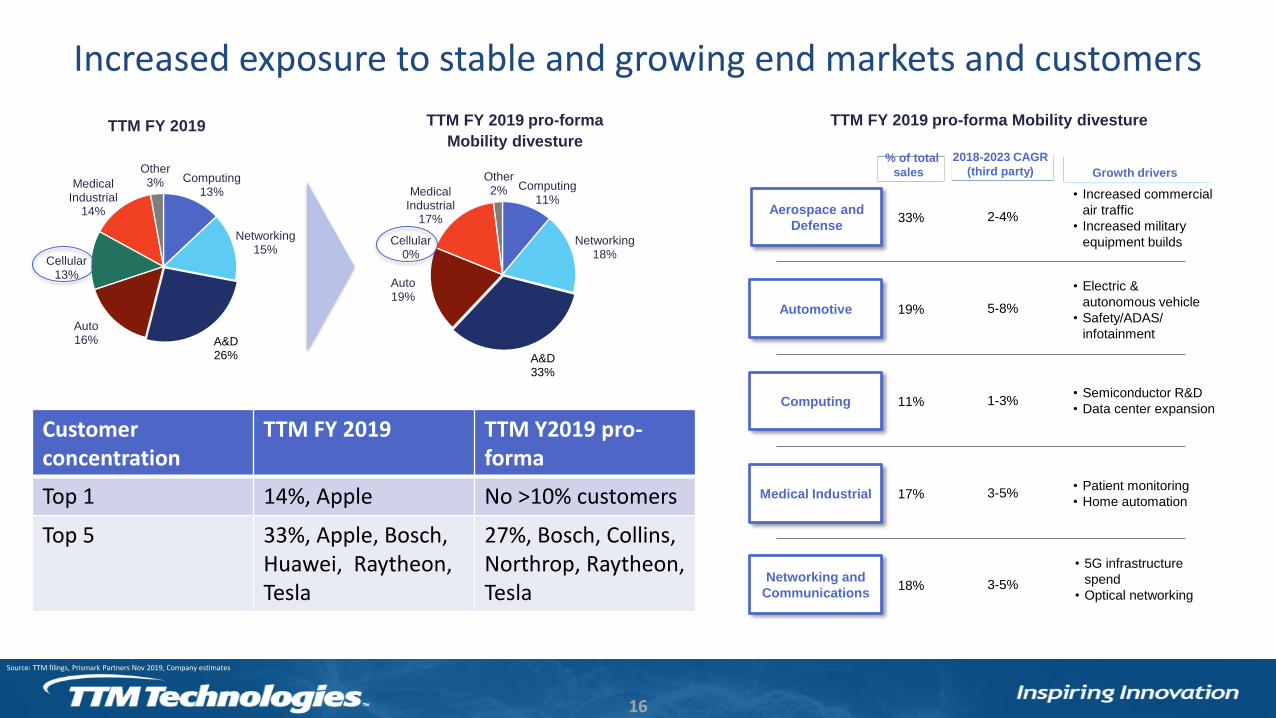
Increased exposure to stable and growing end markets and customers
16
Computing13%
Networking15%
A&D26%
Auto16%
Cellular13%
Medical Industrial
14%
Other3%
TTM FY 2019 TTM FY 2019 pro-forma
Mobility divesture
Networking and
Communications
Aerospace and
Defense
Medical Industrial
Computing
Automotive
Growth drivers
2018-2023 CAGR
(third party)
2-4%
5-8%
1-3%
3-5%
3-5%
% of total
sales
33%
19%
11%
17%
18%
• Increased commercial
air traffic
• Increased military
equipment builds
• Electric &
autonomous vehicle
• Safety/ADAS/
infotainment
• Semiconductor R&D
• Data center expansion
• Patient monitoring
• Home automation
• 5G infrastructure
spend
• Optical networking
Computing11%
Networking18%
A&D33%
Auto19%
Cellular0%
Medical Industrial
17%
Other2%
TTM FY 2019 pro-forma Mobility divesture
Customerconcentration
TTM FY 2019 TTM Y2019 pro-forma
Top 1 14%, Apple No >10% customers
Top 5 33%, Apple, Bosch, Huawei, Raytheon, Tesla
27%, Bosch, Collins, Northrop, Raytheon, Tesla
Source: TTM filings, Prismark Partners Nov 2019, Company estimates

INSPIRING INNOVATION
Summary Financial Impact FY 2019
17
TTM As Reported($mn)
Mobility Business Unit ($mn)
TTM Excluding Mobility Pro-Forma ($mn)
Revenues 2689 556.1 2133
Non-GAAP Operating Profit1
204.1 (7.6%) 14.8 (2.7%) 189.3 (8.9%)
Adjusted EBITDA1 376.2 (14.0%) 90.5 (16.3%) 285.7 (13.4%)
Cash 400.1 N/A 1000
Debt 1475 N/A 1475
Net leverage2 2.9x N/A 1.7x
1 See Appendix for reconciliation, 2 Net leverage is calculated by dividing net debt (net of discount, net of cash) by adjusted EBITDA. TTM excluding mobility pro-forma assumes $600 million in net proceeds.
Potential Use of proceeds
18
Drive growth through investments, strengthen balance sheet and create value for shareholders
Maintain financial discipline and optimize the balance sheet through de-levering
Ongoing investment in our technology portfolio
New product and technology development
Strategic acquisitions
Increased balance sheet flexibility
INSPIRING INNOVATION
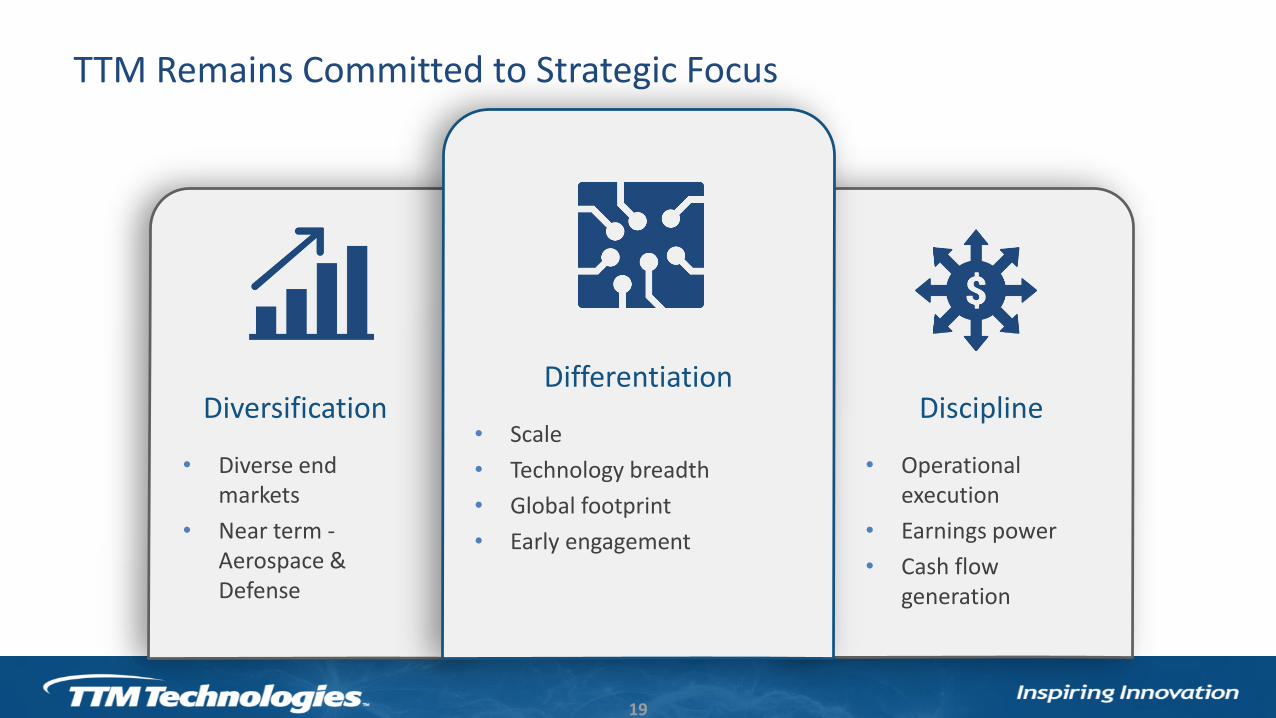
Diversification
• Diverse end markets
• Near term -Aerospace & Defense
Discipline
• Operational execution
• Earnings power
• Cash flow generation
TTM Remains Committed to Strategic Focus
19
Differentiation
• Scale
• Technology breadth
• Global footprint
• Early engagement

Thank You
Appendix
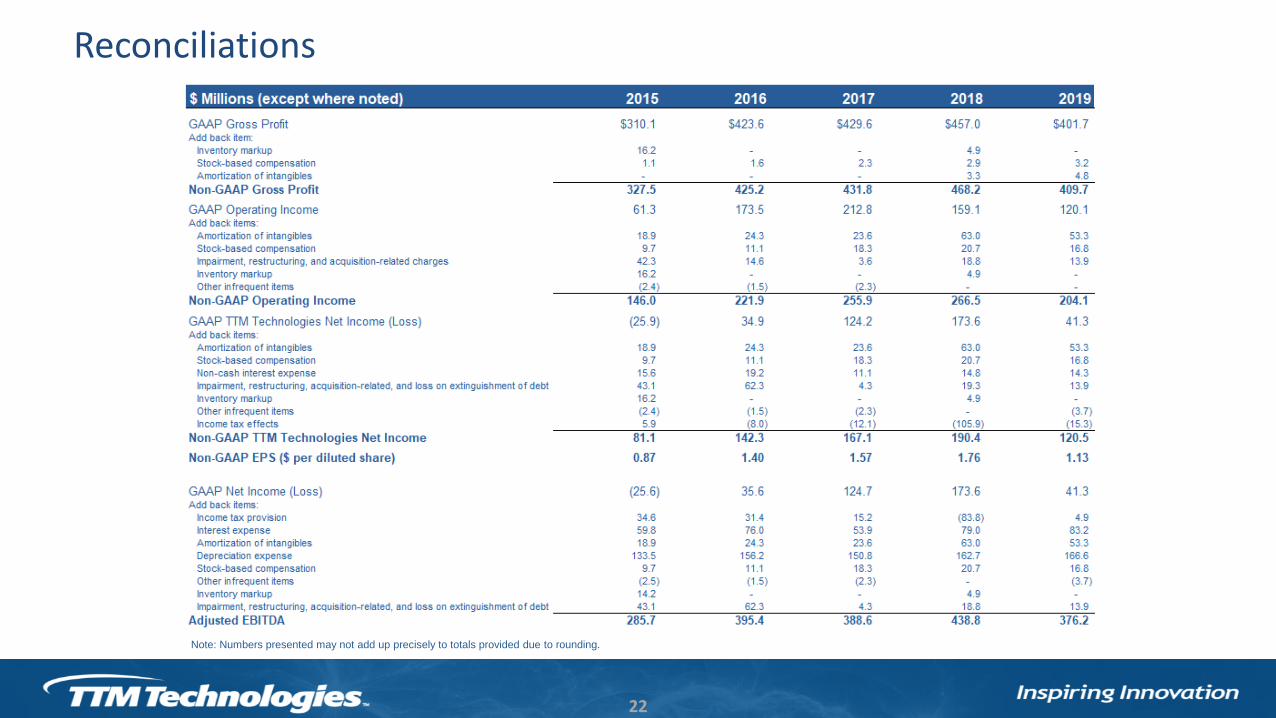
Reconciliations
22
Note: Numbers presented may not add up precisely to totals provided due to rounding.
INSPIRING INNOVATION
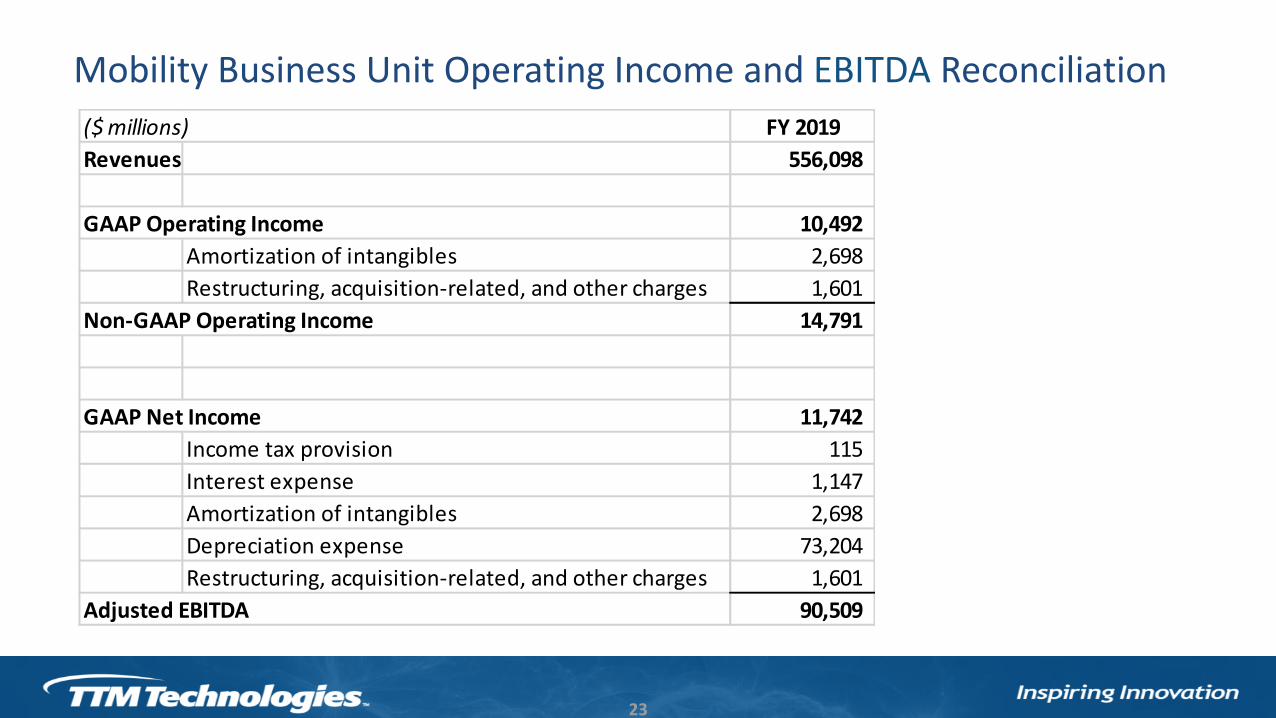
Mobility Business Unit Operating Income and EBITDA Reconciliation
23
($ millions) FY 2019
Revenues 556,098
GAAP Operating Income 10,492
Amortization of intangibles 2,698
Restructuring, acquisition-related, and other charges 1,601
Non-GAAP Operating Income 14,791
GAAP Net Income 11,742
Income tax provision 115
Interest expense 1,147
Amortization of intangibles 2,698
Depreciation expense 73,204
Restructuring, acquisition-related, and other charges 1,601
Adjusted EBITDA 90,509