u nclb ssei e d 854 - dtic.mil · u nclb ssei fi e d ad84 854 defense ... thermal decomposition of...
TRANSCRIPT

U NCLb SSEI FI E D
AD84 854
DEFENSE DOCUMENTATION CENTERFOR
SCIENTIFIC AND i'ECHNICAL INFORMATION
CAMERON STATION ALEXANDRIA. VIRGINIA
inv
UNCLA SSIFIED
/
DISCLAIMER NOTICE
THIS DOCUMENT IS BEST QUALITY
PRACTICABLE. THE COPY FURNISHED
TO DTIC CONTAINED A SIGNIFICANT
NUMBER OF PAGES WHICH DO NOTREPRODUCE LEGIBLY.
NOTICE: When government or other drawings, speci-fications or other data are used for any purposeother than in connection with a definitely relatedgovernment procurement operation, the U. S.Government thereby incurs no responsibility, nor anyobligation vhatsoever; and the fact that the Govern-ment may have formilated, furnished, or in any waysupplied the said drawings, specifications, or otherdata is n6A to be regarded by implication or other-wise as in any manner licensing the holder or anyother person or corporation, or conveying any rightsor permission to manufacture, use or sell anypatented invention that may in any way be relatedthereto.
ii
'4SACRAME-NTO PLANT
INVESTIGATIONS OF THE MECHANISMSOF DECOMPOSITION, COMBUSTION, AND DETONATION
OF SOLIDS
A= Contract AF 49(638)-851, SupptementalU-'Agreement -No. L4(64-475)
INCE March 1964 through February 1965
_______ Report, 0372-01F 15 Ma rch 1965
1D
Lr-

Report 0372-017
INVESTIGATIONS OF THE MECHANISMSOF DECOMPOSITION, COMBUSTION, AND DETONATION
OF SOLIDS
Contract AF 49(638)-851, SupplementalAgreement No. 4 (64-475)
Period Covered: March 1964 through February 1965
To
Director of Aeronautical SciencesAir Force Office of Scientific ResearchAir Research and Development Command
United States Air ForceWashington, D. C.
Aerojet-General Corporation
PREPARED BY: APPROVED BY:
Cheselske C /. StricklerPrincipal Investigator Program Manager, Advanced Propellants
Solid Propellant Research Division
This if the final report of technical- progress accomplished under thisprogram and is submitted in fulfillment of the contract.
OSR Project No. 9750, Task 37501ARPA Order No, 24-60, Project No. 4759

Report 0372-O1F
PREFACE
The Aerojet-General Corporation has for several years been engaged
in fundamental research dealing with the mechanisms of decomposition,
combustion and detonation of solids. During the 1958-1959 period, these
subjects were studied separately under Contracts AF 49(638)-573, AF 49(638)-566,
and Nonr 2804(OO), respectively. Since these-programs were interdependent,
they were combined into a single study under Contract AF 49(638)-851. This
report describes the important results of these studies which have been
carried out during the period from February 1960 to February 1965, and in
submitted in partial fulfillment of the contract.

9
Report 0372-O1F
ABSTRACT
This report summarizes the results of research on the mechanisms of
decomposition, detonation and combustion of solids,
Extensive kinetic studies have been made on 1) linear surface regr-,ssion
rates of solid high explosives (TNT, RDX, etc.), 2) sublimation of ammonium
halides, 3) thermal decomposition of anhydrous perchloric acid, and 4) apparent
"lame strength measurements on NH3 with 02, C12, NO and N20 in the opposed-
at diffusion flame reactor.
Preliminary phenomenological studies have been carried out on the
decoposition of pure or nearly pure single crystals of ammonium perchlorate.
Theoretical studies were made on reactions in opposed-jet diffusion
flames. New models were developed to explain extinction phenomena in solid
rocket motors and a low pressure deflagration limit (PDL).
.. . .. . . . .... . . . .
Report 0372-O1F
TABLE OF COTZM
I. Introduction and Summary 1
II. Technical Discussion 4
A. Mechanism of Detonation Processes 4
1. Introduction and Background 4
2. Summary of Results 8
B. Mechanism of Decomposition of Solids 9
1. Introduction 9
2. Sublimation of Amnonium Halides 10
3. Decomposition of Single Crystals 12
C. Mechanism of Ct-bustion: Reaction Processes in 17Combustion of Propellants ContainingAmmonium Perchlorate
1. Reaction Processes in Combustion of 17Solid Propellants
2. Thermal Decomposition of Anhydrous 24
Perchloric Acid Vapor
3. Opposed-Jet Diffusion Flame Studies 26
III. Recommendations for Future Work 54
IV. Project Personnel 54
V. Publications 55
References 56

Report 0372-017
High Pressure Pyrolysis Apparatus1
Ammonium Perchlorate Microscopic Decomposition 2
Crystal No. 1 - Original Surface Before Heating 10001
Crystal No. 1 - Surface After Heating for 30 Minutes at1900C. Samn areas as figure 3. 1000X Bright Field 4
Crystal go. 1 - After Heating for 90 Minutes at 1900C.Samne area as Figure 3. 1000X Bright Field. 5
Crystal No. 2 - After Heating for 15 Minutes at 2200C.10001 Bright Field., 6
Crystal No. 2 -After Heating for 45 Minutes at 2200C. iCrystal No. 3 - After Heating for 9 Minutes at 2500C.1000X Polarized Light jDistribution of Major Ga-teous Products From the Deflagrationof One Mole of Solid Ammonium Perchlorate 9
Decomposition of Perchioric Acid at 2000C 10
Reactor for Studiy of HC104-NH3 Flames Ui
Flow Reactor System 12
Conditions of Opposed-Jet Reactions Between HC104~ mid XK3 13
Opposed-Jet Reactor System 14
Ammionia - Oxygen Diffusion Flame at Extinguishment 15
Reaction Conditions for Opposed-Jet Flames BetweenAmmonia and Oxygen 16
Amonia-Oxygen Flame 17
Reaction Products From Ammonia-Oxygen Flames is8
Stoichiometry 6f the Auaonia-Oxygen Flame Reaction tin the Opposed-Jet at Extinguishment- 19
- Report 0372-031
Figure List (Continued)
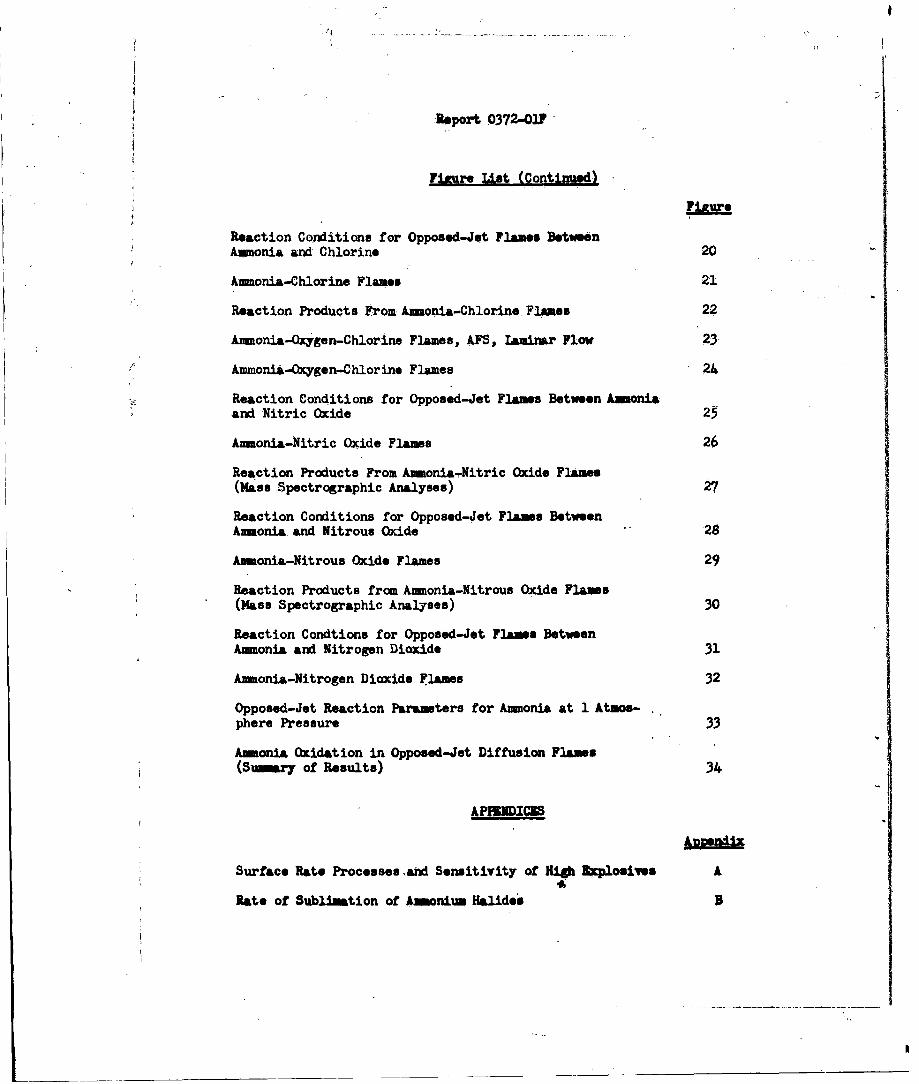
FixureReaction Conditions for Opposed-Jet Flaes BetweenAmmonia and Chlorine 20
Aumonia-Chlorine Flames 21
Reaction Products From Ammonia-Chlorine Flames 22
Ammonia-Oxgen-Chlorine Flames, AFS, Laminar Flow 23
Ammonia-xygen-Chlorine Flames 24
Reaction Conditions for Opposed-Jet Flames Between Ammoniaand Nitric Oxide 25
Ammonia-Nitric Oxide Flames 26
Reaction Products From Anonia-Nitric Oxide Flames 7(Mass Spectrographic Analyses) 27
Reaction Conditions for Opposed-Jet Flame Between
Amonia and Nitrous Oxide 28
Asmonia-Nitrous Oxide Flames 29
Reaction Products from Ammonia-Nitrous Oxide Flames(Mass Spectrographic Analyses) 30
Reaction Condtions for Opposed-Jet Flame BetweenAmmonia and Nitrogen Dioxide 31
Ammonia-Nitrogen Dioxide Flames 32
Opposed-Jet Reaction Parameters for Ammonia at 1 Atmos-phere Pressure 33
Ammonia Oxidation in Opposed-Jet Diffusion Flame(Sumary of Results) 34
AP3NDICES
Surface Rate Processes ,and Sensitivity of High Explosives A
Rate of Sublimation of Amonium Halides B

, ,
Report 0372-011
APFENDICES (D~tiud
Analysis of the Sublimation of Ammonium Halides B-2
Kinetics of the Decomposition of Anhydrous PerchioricAcid C
On the Extinction of Opposed-Jet Diffusion Flames-A Physical Criterion for Extinction D
-A Model for Low Pressure Extinction of Solid Rocket Motors E
Implications of a Steady-State Solid Propellant CombustionModel to a Low Pressure Deflagration Limit F
List of Pertinent Publications G
Report 0372-01F
I. INTRODUCTION AND SUMMARY
Over the past several years, Aerojet-General Corporation has been
engaged in fundamental studies dealing with the mechanisms of decomposition,
combustion and detonation of solids. The objective of these studies has been
to advance the understanding of the kinetics of solid phase reactions and the
mechanism of deflagration and detonation. These investigations have led to
significant advances and a continual increase in our understanding of the processes
of evaporation sublimation, decomposition of solids and combustion of propellants,
A number of technical notes and publications have resulted from these and related
studies. Much of this work has been summarized in contributions which appear at
the end of the report.
This report is concerned with a discussion of essentially all phases of
the studies mentioned above, and, in addition, with the mechanisms of the gas-
phase reactions deemed important to ammonium perchlorate deflagration,,
Rates of linear surface regression of TNT, RDX, tetryl and PETN were
studied by means of the (hot-plate) linear pyrolysis technique. The primary
surface process appeared to be an endothermic melt-flow, which, when used as
a measure of surface heat dissipation, correlated well with measured values of
impact sensitivity.
Extensive studies of the rates of sublimation of the ammonium halides
were carried out using two different experimental techniques - isothermal
weight loss (quartz balance) and the hot-plate pyrolysis method. The results
were in fair agreement with the SchultaDekker mechanism for amoniua halide
sublimation.

Report 0372-01F
Preliminary phenomenological studies were carried out on the thermal Idecomposition of single crystals of ammonium perchlorate using continuous
microscopic observation and metallographic techniques. The results tend to
corroborate the postulate concerning the decomposition of the intermosaic
:structure.
An overall reaction scheme (based upon the work at Aerojet and other
laboratories) has been proposed for ammonium perchlorate deflagration.
It has been found that NH3 catalyzes the thermal decomposition of
anhydrous perChloric acid, and is believed to have important implications
in connection with ammonium perchlorate deflagration.
An extensive investigation has been made on the thermal decomposition
of anhydrous perchloric acid. The results indicate that the decomposition
does not take place by a simple reaction scheme. Initially the reaction occurs
by a mechamism which is second-order in perchloric acid, and, after 50% reaction,
a first order mechanism is rate controlling. Both mechanisms were sensitive to
surfaces. Water has been found to inhibit the first-order reaction on Pyrex
surfaces. A hydrated 01207 species has been postulated as the activated complex
for the second-order reaction.
Experimental studies have been carried out on NH3 oxidation by 02, C12 ,
NO and N20 in the opposed-jet diffusion flame reactor. Apparent flame strength
measurements indicate the order of reactivity at 1 atmosphere pressure is
N2 0> 02> C12> NO. However, overall reaction orders (pressure dependencies) of
these flame reactions are C12 (2.3)>N2 0 (2.0) >02 (1.7) >NO (1.56) indicating
that at higher pressure, chlorine may govern the rate of heat release if the
same reaction mechanism is operative.
-2-
Report 0372-01?
Theoretical studies were made on reactions in opposed-jet diffusion
flames. A physical criterion for extinction in counter-flow diffusion flames
has been developed which differs from that given by Spalding, In the new
treatment, maximum reaction rates are determined by means of physical extinction
criteria which are imposed on the flame process rather than previous or assumed
chemical kinetic information as required by Spalding's treatment.
A model of low pressure extinction of solid rocket motors, involving
the coupling of propellant flame kinetics and rocket nottle exhaust trme, has
been developed.
Also, the thermal layer treatment of steady-state combustion has been
applied to the problem of a low pressure deflagration limit, The hypothesis
relating extinguishability and low pressure burning stability to PDL appears
to be in satisfactory agreement with the available experimental data.
-i

Report 0372-01F
II. TECHNICAL DISCUSSION
The following discussion briefly summarizes the important results of
studies dealing with investigations of mechanisms of detonation, decomposition
and combustion which have been conducted under Contract AF 49(638)-851.
For more extensive discussions of various phases of this program the reader
is referred to the appendices (A through F) at the end of the report.
The results of experimental studies on opposed-jet diffusion flames are
discussed in greater detail in the body of this section since\the publication
covering this work was not completed at the writing of this report,
A. MECHANISM OF DETONATION PROCESSES
1. Introduction and Background
The kinetic processes involved in the initiation,
deflagration, and (non-ideal) detonation of solid high explosives (e.g.,
TNT, PETN, RDX, etc.) have never been ascertained with certainty.
Experimental and theoretical investigations which have been conducted for
many years have yielded sufficient information to enable formulation of
hypotheses regarding the interpretation of much observable explosive
phenomena. It is only within recent years that these studies have become
sufficiently quantitative to allow some definitive elaboration of these
hypotheses; however, much of the picture is still highly speculative.
A thorough understanding of the fundamental processes
involved in the deflagration and detonation of solid explosives takes on
new importance in view of recent interest in such materials as HMX and RDX. ,1
Previous studies at Aerojet-General Corporation on such propellant ingredients
as ammonium nitrate and ammonium perchlorate have led to significant advances
in the knowledge of combustion and detonation of propellants and explosives.
It was believed that similar studies on solid high explosives such as PETN,
-4-
iI
Report 0372-01F
RDX, TNT, etc., would provide the information needed to elucidate the
kinetic processes involved in the combustion and detonation of propeflants
containing high explosives.
There is strong evidence that, for all conventional
high explosives, the initiation process is thermal in origin, M chanical
energy, such as a blow or friction, must be transformed into heat in order
to ignite the explosive. Like-wise, the energy of the shockwave preceding
a detonation front in a solid explosive is converted into heat by the work
the shock does (by compression) on the explosive through which it is moving.
On the assumption, then, that the initiation of an explosive is a thermal
process, the overall characteristics of the initiation propagation of
detonation in explosives rest upon the balance between the rate of release of
thermal energy by chemical reaction, and the rate of loss of energy by gas
expansion and thermal conductivity.
The mechanism of detonation in solid explosives may
be conveniently considered from two broad aspects-viz., the surface properties
and the bulk properties of the explosive. The various possible detonation-
reaction mechanisms then include the following:
Grain Burninx
(1) Gaseous diffusion is rate determining.
(2) Bulk decomposition is rate determining.
(3) Surface decomposition, evaporation, or sublimation is rate
determining.
Unimolecular Bulk Decomposition From Shock Compression
(1) Unimolecular, first-order, bulk decomposition is rate determining,
(2) Gaseous diffusion is rate determining.
-5-
Report 0382-01F
In the grain burning theory (originally due to Eyring
and co-workers, Reference 1), the initiation and propagation of detonation
in heterogeneous explosives is considered on a microscopic scale to proceed
through a mechanism whereby chemical reaction is induced in and spreads from
"hot-spots" produced by localized stress from impact (e.g., shock or mechanical
impact). The detonation reaction time (T) is then given by the equation
'- = sec (1)
IJkr
where R is the average grain radius of the explosive particles, L is the
effective diameter of a molecule on the surface of the grain, and kr is
the specific rate constant of the rate controlling reaction. The detailed
mechanism of energy release in the grain burning theory need not be known
to evaluate detonation reaction times; it is only necessary to isolate the
rate determining step. Eyring and co-workers (Reference 1) concluded that
kr had only a small temperature dependence and thus involved a smaller
activation energy than would normally be expected for first- or second-order
kinetics. They suggested that a diffusion process, either of heat or
matter, was possibly rate controlling. Unofrtunately, it has never been
possible to numerically calculate k with any confidence using this suggestion.
Cook and co-workers (Reference 2) describe a grain
burning model in which the rate-controlling kinetics of the reacting surface
layer of the explosive particles corresponds to the exothermic bulk de-
composition kinetics obtained from low temperature isothermal measurements.
In general, reaction times calculated from these data are much greater
(by 10 to 50 times) than those estimated from the curved front (Reference 1)
and nossle (Reference 3) theories, which relate detonation reaction times
-6-
Report 0372-01F
to obervable'detonation velodities. Unfortunately, unambiguous experimental
absolute reaction times have never been obtained for heterogeneous explosives,
And the validity of the various diameter theories is not known.
In contrast to the grain-burning theory of relatively
recent origin, the concept of unimolecular first-order bulk decomposition
arising from shock compression has been discussed since the early history
of detonation studies. It has, for example, long been the accepted mechanism
of gaseous detonation. There appear to be at least two reasons why a
grain-burning detonation theory need be considered. The first of these is
that a particle size influence on the n-ideal detonation characteristics
of heterogeneous explosives is almost always observed experimentally.
The second reason is that at low-charge densities the detonation shock is
relatively weak and can produce but little temperature rise through bulk
compression of the explosive,
Evidence that compressional bulk heating is a possible
mechanism of propagation of detonation in conventional high explosives has
been obtained in investigations at Los Alamos (Reference 4). It was
demonstrated that under suitable conditions of initiation, large single
crystals of TNT, .PETN and tetryl can be made to detonate. The apparent
lack of heterogeneity in single crystals thus seems to exclude grain burning,
in these cases,
The general picture suggesting a grain-burning mechanism
for the detonation of low-energy heterogeneous explosives aid low-density
high-energy explosives, and an unimolecular bulk decomposition mechanism for
shock compression of high-density, high explosives appears to be qualitatively
consistent with many known experimental facts. However, much of the picture
is still highly speculative and additional studies both theoretical and
-7-
Report 0372-01F
experimental are needed to clarify the situation.
2. Smaimary of Results
On this basis of these considerations, the mechanist
of detonation studies of low density h~gh explosives (such as TNT, RDX, etc.)
carried out on this program were initially based upon a model similar
to that proposed for low-energy, low-density granular explosives such as
ammonium nitrate (AN) and ammonium perchlorate (AP) (Reference 5). This
model incorporated Eyring' s grain burning detonation theory and stipulated
that the rate controlling reaction in grain-burning detonation was the
linear endothermic surface gasification- rate of the explosive particles.
Thus, the linear pyrolysis rate, B, is considered to be the proper value
for Ikr in Equation 1.
Accordingly, linear pyrolysis (hot-plate) studies were
made on the four common high explosives (TNT, RDX, tetryl and PETN)
utilizing the high-pressure apparatus shown in Figure 1. The results indi-
cated that over the range of surface heating conditions employed, the rate of
linear surface regression was governed by a melt-flow process rather than
an evaporative or sublimation process. Therefore, the data were not
compatible with the grain-burning detonation model proposed at the outset
of this work.
Consequently, a theoretical treatment of steady-state
surface melting of materials which are pressed against a heated surface
has been developed to explain the experimental hot-plate data for the
high explosive strands. The rate of surface regression of the solid strands
was attributed to viscous flow in a molten layer which separated the solid
strand surface from the hot-plate surface.
-8-

Report 0372-OIF
This theoretical treatmnt of a viscous flow process
at the heated surface of high explosives has made possible a quantitative
description of Bowden's concept of hot-spot ignition of explosives by impact
and frictional heating. The results of the analyses presented (Appendix A)
are consistent with a mechanism for initiation of pure solid high explosives
which involves the rate of dissipation of kinetic energy of impact by
endothermic surface melting, and not by the melting temperature alone. Frc
the observed energy balance versus temperature relationship, the rate at
which kinetic energy can be dissipated by melting is TNT'>Tetryl>RDX>PETN,
which is the order of increasing sensitivity of these explosives. The results
demonstrate the importance of melting in determining the initial rate of
heating of solid high explosives by external stimuli such as impact and friction.
Also, by means of this treatment and the hot-plate technique,
it should be possible to obtain surface melting rates, viscosity-temperature
relationships and heats of fusion for materials (ex., high explosives)
which are normally unstable in the molten state. Such information could be
useful in determining equations of state for such materials.
A detailed discussion of the results of these studies
and of their importance to impact sensitivity is presented in Appendix A.
B. MECHANISM OF DECOMPOSITION OF SOLILS
1, Introduction
This section of the report summarizes the results of
studies concerned with the processes involved in the decomposition of solids,
with particular emphasis being placed on surface decomposition phenomena.
These relatively fundamental studies were designed to serve as forerunners
for investigations of the more complex problems associated with the
decomposition of solid propellant components.
-9..

Report 0372-01?
An extensive kinetic study of the sublimation of the
ammonium halides has been carried out by means of linear pyrolysis (hot-plate)
and bulk heating techniques. The sublimation studies were undertaken
to gain fundamental knowledge on prototype ammonium salts with the object of
applying such knowledge to the decomposition of oxidizers such as ammonium
perchlorate.
In addition, a study of the decomposition of single
crystals of solids was undertaken. However, due to a decrease in fundin,
this phase of the program was dzrpped before definitive results could be
obtained.
2. Sublimation of Ammonium Halides
a. Introduction
Application of the Eyring activated complex theory
to sublimation of both molecular and ionic solids by workers at Aerojet
(References 6-10) has resulted in a number of significant advances in the
understanding of the basic theories of d.ccosition at solid-gas interfaces.
The most recent studies dealing with surface decomposition phenomena involve
the rates of sublimation of the ammonium halide series.
The studies of the sublimation of amuonium halides
which have been carried out in these laboratories have been of special value
in helping to understand the mechanism of evaporative processes which involve
endothermic dissociative decomposition.
The rates of evaporation of such solids appear
to be characterized by an apparent activation energ which is considerably
less than the heat of vaporization, and an apparent accommodation coefficient
for evaporation which is approximately 10-4 (as compared to 0.1 - 1.0 for n
non-dissociative molecular evaporation rates).
-10-

Report 0372-01F
Prior to the present studios, a considerable amount
of work had been carried out on the rate of subliation of ammonium chloride;
however, two different mechanisms were postulated to explain the..eubl5mation
data. In view of the conflicting concepts concerning the sublimation mechanism,
studies were initiated with the idea that data on the sublimation of the other
amnonium halides might resolve the problem.
b. Suary of Results
The rates of sublimation of ammonium chloride,
bromide, iodide and fluoride have been determined by two different experimental
techniques over the temperature range of 100 to 6000C, corresponding to an increase
in sublimation rate of 104. The two experimental methods employed were the measure-
ment of isothermal rate of weight loss using a quartz spring balance, and the hot-
plate linear pyrolysis method. Using these techniques, it was possible to
determine linear rates of sublimation ranging from 10-6 to 10- 2 cm/sec. These
rates corresponded to a change in surface temperature of approximately 2000 C
for ammonium fluoride and approximately 4000 C for the other three halides.
The unusually low values for the Arrhenius frequency
factor and activation energy observed by other investigators for NH4Cl'have
been verified in these studies and found to extend to the other halides. In
all cases, the measured apparent activation energies were approximately one-
third of the heat of sublimation. Except for ammonium fluoride, which hab
a frequency factor of 10 to 100 times greater than the other halides, the frequency
factor increases with increasing molecular weight.
By applying the Schultz-Dekker transition-state
treatment of NH*C1 sublimation, it was possible to calculate linear rates of
sublimation which are in reasonable agreement with the experimental results.
i I I-I 1-

Report 0372-01F
A detailed discussion of these studies are presented
in Appendix B.
3. Decomposition of Single Crystals
a. Introduction and Analysis
Considerable effort has been expended in many
laboratories on studies of the mechanisms of decomposition of ammonium perchlorate
(References 11-14). However, it appears that certain abnormal behavior in the
crystal still exists which is unexplained.
It has long been assumed that a simple first order
transition from orthorhombic to a cubic structure takes place at approximately
2400C (References 13, 14) with ammonium perchlorate. Changes in the de-
composition rate at 2400C have been ascribed to the formation of the new
cubic structure.
However, investigations at the Aerojet laboratories
of the crystal transitions of ammonium perchlorate in the same temperature range
by X-ray diffraction techniques suggested that this picture of the crystal
- transition my be inaccurate. The X-ray data indicated that an irreversible
transition occurred at 2400C which was separate and distinct from the reversible
orthorhombic-cubic transition which occurs at a higher temperature. At 2400C,
it was not possible to show a structural change by X-ray diffraction, although
significant intensity changes did appear in the diffractogram. At 2700C, the
cubic structure was evident. It disappeared on cooling, returning to the pattern
obtained at 2400C. Thus, it appears that the abnormal decomposition behavior
of ammonium perchlorate in the neighborhood of 240 0 C may be caused by an
irreversible second order phase transition.
This picture receives some support from the earlier
work of Bircumshaw, Newman and Phillips (References 11, 12) who observed that,
-l2,
: -'...-.]
Report 0372-017
although the rate of decomposition of ammonium perchlorate went through, a
maximum at a temperature slightly below 240C, there was a continuously
decreasing decomposition rate up to temperatures of approximately 2500C. A
continuously varying rate would be expected for second order phase transitions.
However, first-order structural transitions, such as the orthorhombic to cubic
change, should occur sharply, resulting in nearly discontinuous properties.
Second order transitions have oeen observed in other ammonium salts (Reference 15)
This type of transition is known to give rise to a specific heat anomaly which
would be expected to cause a modification of the decomposition behavior of the
solid (Reference 16).
Experimenters who have analyzed the data of amonium
perchlorate decomposition have concluded that the mechanism consists of two
steps in which changes in the physical structure of the solid are rate determining.
The conclusions of Galwey and Jacobs (References 13, 14) are that the low
temperature reaction (to 300oc) represents the decomposition of strained material
in intermosaic configurations, while the high temperature reaction represents
the decomposition of unstrained material formed -by mosaic blocks. They also
conclude that the low temperature reaction is confined to the intergranular
material, although nucleation occurs at the boundaries of the mosaic blocks
from which, the reaction grows until all of the intergranular material is
consumed.
On the basis of the preliminary findings at the
Aerojet laboratories, it was felt that a re-evaluation of the crystal surface
processes was needed in order to establish the cause of the variations in
decomposition rates which occur in the neighborhood of 2400 C for ammonium
perchlorate, It ws believed possible that a second order phase transition
which took place at temperatures below the known structural change was the
-13-
Report O372-OF
real cause of the decomposition rate change.
b. Suanary of Results
An experimental program was initiated to study the
reaction kinetics of single crystals of oxidizers. Ammonium perchlorate was
examined initially in order to develop the necessary experimental techniques
without undue hazard; and, of course, because of its importance to the
theoretical aspects of the problem.
Relatively large single crystals of ammonium
perchlorate were used in these s udies and were prepared by means of a temperature-,
differential technique described by Dreyfus and Levy (Reference 17). Single
crystals of AP were decomposed under continuous microscopic observation. A
Zeiss Ultraphot II microscope, with a Leitz hot-stage attachment, and a
Bausch and Lomb metalograph were used in these investigations. The results of
these studies are shown in Figures 2 through 8.
Two views of a decomposing NH4C1O4 crystal are
shown in Figure 2. This photo shows the orthorhombic-to-cubic transition in
a, single crystal. It was noted that the transition was accompanied by the
appearance of a large number of surface cracks and an apparent sudden increase
in surface reaction (i.e., growth of reaction nuclei). The photo on the right
(Figure- 2) shows the transition in the process of occurring. This is depicted
by an-irregular boundary line which was photographed as it moved from the top
to the bottom of the crystal. The increase in reactivity at this point is in
agreement with the postulate concerning the decomposition of the intermosaic
structure. ,
It was anticipated that shadow-cast replica techniques
would be required to obtain the necessary detail to study the crystal surfaces
at various stages of decomposition. However, metallographic examination gave
-14-

Report 0372-01F
sufficient magnification for these studies.
A series of three well-formed crystals was
photographed with the Bausch and Lamb metallograph using three magnifications,
1IOX, 50OX, and lOOOX. These original pictures were selected in order to show
some identifying feature of the crystal surface which could be used as a reference
point. Each of the crystals was then heated under vacuum (5 x 10- 5 m'Hg),
using a Nichrome heating element situated'-4 mm above the surface of the crystal.
The temperature was determined by a chromel-alumel thermocouple held against
the crystal surface by its own tension, and the emf was read on a potentio-
memter. The crystals were heated according to the following schedule: Crystal
No. 1 was heated at 1900C for three separate intervals of 30 mi each; Crystal
No. 2 was heated at 2200C for three intervals of 15 min each; and Crystal No. 3
was heated at 2500 C for three intervals of 3 min each. After each of the heating
intervals, the resulting crystal surface was photographed using some unique
surface detail to identify the original area.
A study of the completed series of photographs
resulted in several generalized observations. The original crystal surfaces
were smooth with some wrinkling and showed a number of cleavage planes. This
behavior is illustrated in Figure 3. Upon heating, the surfaces changed
radically and took on a mottled, amorphous, quasi-liquid appearance, punicated
with numerous very small irregularities (Figure 4).
The observations with each of the crystals may be
summarised:
Crystal No. 1 (1900C): An amorphous layer of
unknown thickness formed on the surface, appeared to loosen from the crystal
substrate, and then separated into many clumps of various sizes, which upon
further heating, formed single rhombic crystallites. The larger crystallites
-15-
I I I I I I II I

Report 0372-01F
grew faster than the smaller ones; after the final heating, the amorphous material
was gone, having been replaced by crystalline structures. The entire surface
was then covered with individual rhombic crystals. (Figure 5).
Crystal No. 2 (2200C): The same result was noted
with this crystal as was described for Crystal No. 1, except that the transition
took place more rapidly, being completed within the first heating interval of
15 min, (Figure 6). However, after the last heating period (total heating
time, 45 min) the crystallites seemed to degenerate somewhat, and their out-
lines became less clearly defined (Figure 7).
Crystal No. 3 (25000): None of the crystallite
growth observed at lower temperatures was detected. Continued heating of this
crystal only resulted in a darkening and rapid deterioration of the original
surface characteristics. After the final heating period, the surface of the
crystal exhibited a mottled, appearance lacking in structure (Figure 8). This
crystal appeared milky and opaque as contrasted with Crystal No. 1, which was
still fairly clear, and Crystal No. 2, which was beginning to appear slightly
milky.
These studies indicate the need to determine whether
the amorphous layer, which first appears to form on the large crystal surface,
is transformed into crystallites or decomposes (or sublimes), leaving behind
the observed structures. It is thought that the points on the surface where the
tiny crystals form are defect sites, but the cause of the process is still
speculative.
To date, these studies have been primarily
phenomenological in nature. However, the results obtained thus far clearly
show the need for this type of study. It is firmly believed that such data,
when compared with kinetic decomposition data for particulate samples of
-16-
Report 0372-OIF
the same material will help elucidate the decomposition mechanisms involved
and the importance of crystal imperfections on rates of reactions in
crystalline solids.
This phase of the program u discontinued at this
point due to a decrease in funding of the program.
C. MECHANISM OF COMBUSTION: REACTION PROCESSES IN COMBUSTION OFPROPELLANTS CONTAINING AMONIU1 PERCHLORATE
1. Reaction Processes in Combustion of Solid Propellants
a. General Considerations
The fundamental experimental and theoretical studies
on solid propellant combustion which ha-ve- been carried out at Aerojet, as well
as in other laboratories, have led to a concept of combustion in which the solid
ingredients gasify under the thermal influence of a flame to form reactive
species which then undergo gas-phase redox reactions to propagate that flame.
The mass-flow and energy of each reaction step in the burning process are of
necessity coupled to each other by the conservation equations. Suitable
mathematical models of varying complexity have been developed to describe this
coupling process, and have been tested with some success against burning rate
data for ammonium nitrate (AN) and ammonium perchlorate (AP) composite pro-
pellants. In spite of the overall agreement between these mathematical treat-
ments and experimental burning rate data, relatively little headway has been
made in predicting, by one of these models, the effects of specific propellant
binders and additives on the combustion properties. In this connection, the
failure of the models is due primarily to the lack of information on the
specific chemical reaction mechanisms which give rise to the burning process,
and the attendant kinetic data under burning conditions.
The primary purpose of the combustion research
being carried out under the present contract is the study of the chemical
-17-
Report 0372-01F
reactions which are deemed important in determining the burning properties
of solid propellants. The basic problems associated with such an approach are
essentially three-fold, viz;
1) the design and analysis of experiments to
elucidate the chemical nature of the combustion process;
2) the development of experimental and theoretical
methods suitable for obtaining the necessary specific reaction rate data;
3) the development and testing mathematical
conbustion models based upon the proposed chemical mechanisms.
These problems must be attacked simultaneously
since, more often than not, the advances made in each problem area are inter- .
dependent. Also, the relatively unusual reaction conditions (e.g., high
pressure and temperature, surface heating, etc.) have often required the
examination of the applicability of the existing basic theories of reaction
rates themselves.
The progress made at Aerojet tovards the goals of
the present contract (and its predecessors) is well documented in various
reports and publications (see Appendix G), particularly in the area of the nature
of the solid phase reactions and their relationship to the burning rates of
AN and AP composite propellants. More recently, research efforts have delved
in greater detail into the kinetics of the gas-phase redox reactions which give
rise to the flame processes near the burning propellant surface. It is
believed that the effects of pressure, binders and other additives on propellant
burning are due primarily to changes in the specific rates and/or nature of these
redox reactions. Considerable progress has been made in elucidating the nature
of some of these gas-phase reactions, and in developing techniques for determining
-18-

Report 0372-01F
their kinetics under flame conditions. At present, particular emphasis is
being placed on reactions involving ammonia and oxidizers of the chlorine-
oxygen and nitrogen-oxygen types. These advancements are discussed in a following
section.
The following sections are devoted to a discussion
of the concepts behind the formulation of the current program of research and
the pertinent results of the work completed on the contract.
b. Solid Propellant Combustion Model
The combustion model taken is that developed at
Aerojet, and is based upon the concepts of the two temperature postulate and
thermal layer theory of propellant combustion.* These concepts have been
described extensively in the literature (21, 22, 23) and are sunmarized in
Section II in Appendix F.
Briefly, it is believed that the major surface
reaction processes in AP propellant combustion involve the gasification of
ammonium perchlorate to gaseous HC104 and NH3, which then undergo a rapid
exothermic redox reaction resulting in a primary flame close to the oxidizer
surface (within a distance of about 100/1). This flame zone is essentially
the thermal layer. Under the influence of this redox flame, the polymeric
binder in the vicinity of the oxidizer vaporizes (probably by a surface
thermal degradation process) and diffuses away from the surface. The reaction
between the pyrolysis products of the binders and the oxidizer redox flame
This model is somewhat at divergence with the Granular Diffusion Flame modelof Summerfield (Reference 18). However, it is in accord with the model ofammonium perchlorate strand deflagration described by Friedman (Reference 19)and with the model Vandenkerckhove (Reference 20) has used in describingresonant burning.
-19-
! ! !

Report 0372-OIF
is diffusion controlled, and its influence upon - propjvJiint burning rate
depends upon the extent of diffusion into the thermal lay.er. It is possible
that at elevated pressures ( >100 psi), most of the binder oxidation occurs
too far from the oxidizer particle surface to influence the surface temperature
gradient to any significant degree. However, at lower pressures this does
not appear to be the Oase.
The effect of pressure on the rate processes has
been considered to be twofold: (1) to change the rate of the NH 3-HC04 gaseous
redox reactions; (2) to alter the rate of diffusion of the binder and oxidizer
pyrolysis products.
It is evident that the role of burning-rate catalysts
could be to increase the rate of the NH 3-HC104 redox reaction. Thus, it appears
that the rates of surface decomposition of solid oxidizer and polymeric
binder; the rates of reaction of' HC1O4 with NH3 and binder degradation products;
and. the rates of diffusion of binder and oxidizer gases are the basic parameters
which define the propellant burning characteristics.
Much of the recent research on the present contract
has been devoted to a study of the rates of the oxidizer gas-phase reactions.
c. Surface Decomposition of Ammonium Perchlorate
Utilizing the hot-plate linear pyrolysis technique,
t. linear rate of surface decomposition, B, for ammonium perchlorate has been
reported to be:
B = 460o exp(-22000/RT S) cm/sec
corresponding to a sublimation process,
NH4CI04 (solid) > NH3 (g) + HC10 4 (g)
B is the linear regression rate of the surface measured as a function of surface
-20-

RYport 0372-01F
temperature, Ts . The sublimation process probably involves a proton transfer at
the solid surface followed by desorption of HCIO4. and NH3 from the surface.
Upon combustion of the ammonium perchlorate, rapid decomposition of the HCIO4
occurs (catalyzed by NH3 ) making the above reaction irreversible. Preceding
the surface evaporation, partial decomposition (-30%) by the following exo-
thermic solid-phase reaction occurs (References 24, 25, 26, 27):
2 NH4C4 C2 + 3/2 0 2 + 4 H2 0+ N 20
This reaction is b-'1, d to occur by means of an
electron transfer process in the so-called int (defect lattice) material,
and results in an apparent lowering of the endothe,..i oi: the overall surface
sublimation. The extent to which the intermosaic reaction affects the amonim
perchlorate deflagration rate has yet to be studied.
d. The Gaseous Reaction of Ammonia With Perchloric Acid'
. The experimental study of the reaction between NH3 (g)
and HClO (g) is severely complicated by the highly reactive nature of the system,
even at low temperature and pressure. Early exploratory studies under Contract
AF 49(638)-566 demonstrated that NH3 (g), at initial gas temperatures as low as
25-4O0 Ccould be oxidized to NH4Cl almost instantaneously upon admixture
with HClO4 . The same result was found to occur in attempts to establish an
NH + HCO flame in the opposed-jet reactor. The solid product NH4CI can be3 4
explained by the decomposition of HCO 4 to C12 followed by oxidation of NH3
by C12 to NH4 C1 (g) + N2. These eploratory studies led to an-intensive study
of the isotherval d ecomposition of HClO4 at temperatures as high as 250OC
(Appendix C).
A salient fe +,,r of the isothermal decomposition
studies was the relatively slow rate of decomposition of HC1O4 as compared with
-21-
Report o72.o3
the rapid XH3 oxidation reaction. However, it was observed (Reference 28)
that the sudden addition of -40 mole % of NX3 to slowly. deoomposin, pure
HCIO4 (T - 2300C) caused the reaction to becs eigorOU an4 led to a rapid
decapposition. Thus, it would appear that small amounts of H3 O tAlyze"
the HC1O4 decomposition at elevated temperatures, This observation has important
implications in connection with the AP deflrration react4ion mehanism which is
poposed in the following section.
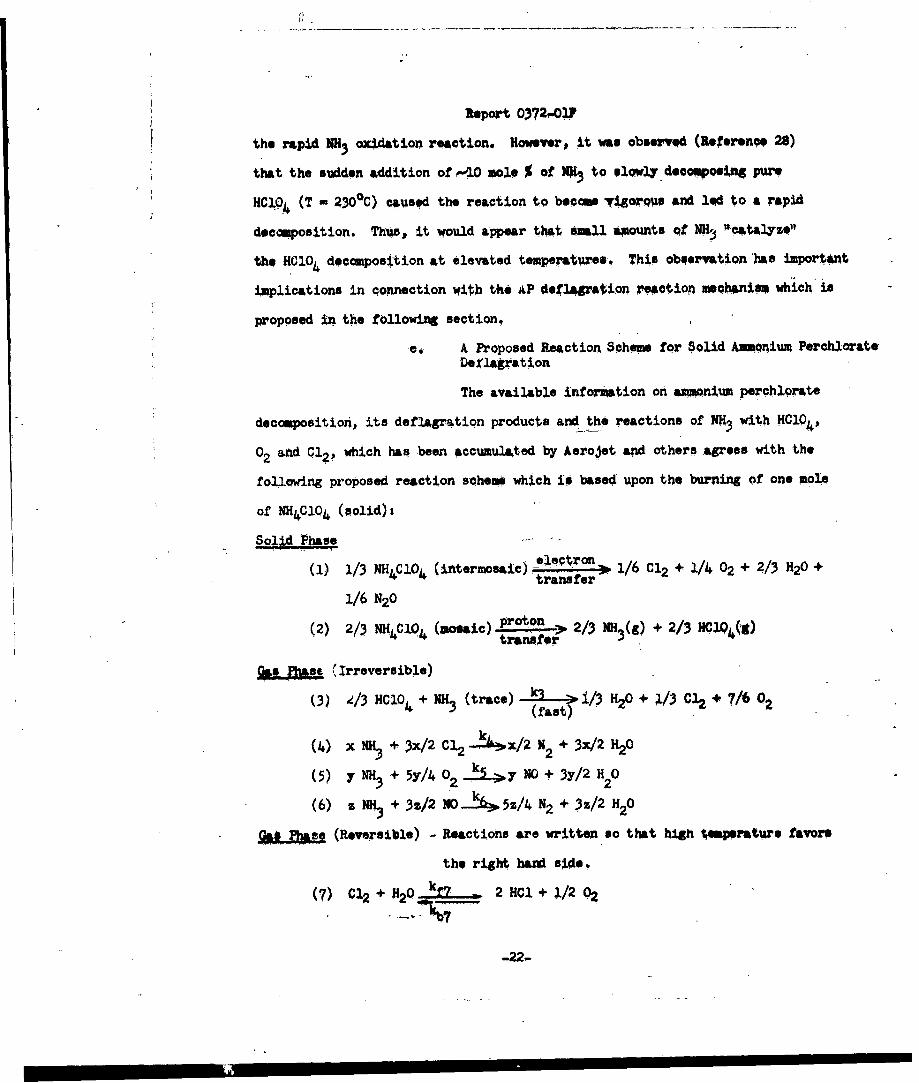
e.. A Proposed Reaction Scheme for Solid Amohium PerchlorateDe!'lagration
The available inforuation on aionium perchlqrate
decomposition, its deflagration products and the reactions of NH3 with HCIO4 ,
02 and C12, which hap been accumulated by Aerojet and others agrees with the
following proposed reaction scheme which is based upon the burning of one mole
of NH4C.O4 (polid):
Solid Phase
(1) 1/3 NH4 IO4 (intermosaic)e t ro 1/6 C12 + 1/4 02 + 2/3 H20 +' transfer 2
1/6 N20
(2) 2/ NH4ClO4 (moaic) proton 2, NH3(g) + 2/3 C194(4)
Gas Phase 'Irreversible)
(3) /3 H0104 + NH3 (trace) k3 / 3 H2 0 + ;/3 C12 + 7/6 02
(fast)
(4) x NH3 + 3x/2 c12 -- J'x/2 N2 + 3x/2 H20
()Y NH3 + 5Y/40 2 '5 .>yN+ 3y/2H 02
(6) z NH3 + 3z/2 NoJ>5z/4 N2 + 3z/2 H20
9A L (Reversible) - Reactions are written so that high tempsrature favors
the right hand side.
(7) C1 2 o + 20 up 2HM 2 + 202
-22,
Report 0372-01-
(8) NH4C1 (solid) k *3 (g) +C
kbbS( ) N2 - N 2 0 2
(10) NOC -. NO + 1/2 2kbl0
It my be seen from this scheme that the gas phase
oxidation of ammonia involves the competing reactions (4) through (6), with the
reversible reactions (7) through (10) acting as buffers to control the con-
centrations of reactants and products.
It should be pointed out that the total amount of
NH3 (g) available for oxidation by this scheme is only 2/3 mole per mole of
NH4CIO4 (i.e., x + y + z = 2/3). Inasmuch as the only source of NO considered104
is reaction (5), this sets an upper limit to the amount of NH3 (g) that can be
oxidized by reaction (6) (i.e., Z - 2y/3 = 4/15 - 2x/5).max
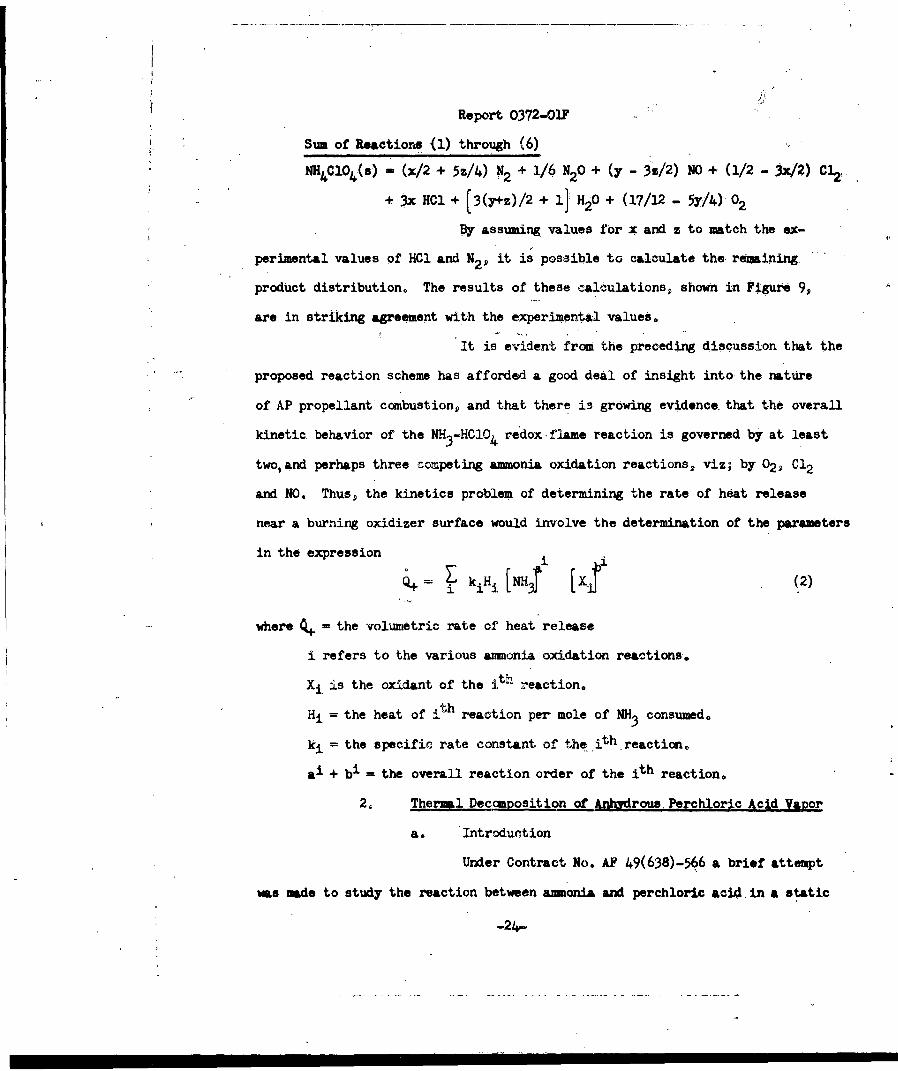
It is interesting to compare the distribution of
deflagration products which would be expected by summing reactions (1) through
(6) in the above reaction scheme, with the distribution determined by J. Levy
and R, Friedman (Reference 19) from sampling measurements on burning strands
of solid ammonium perchlorate. Their results at L-ata*nd 70 atm pressure applied
to the sum of reactions (1) through (6) above gives:
1 atm (Tf = 12400K)
NH4ClO4 (s) = 0.125 N2 + 0.10 20 + 0.55 NO
+ 0.5 C12 + 2.00 H20 + 0.675 02
70 atm (Tf = 1260OK)
NH4C104 (s) = 0.265 N2 + 0.12 N2 + 0.23 NO
+ 0.12 C12 + 0.76 HCl + 1.62 H20 + 1.0l 5 2
-23-
Report 0372-OIF
Sum of Reactions <I) through (6)
Nl4 C1Oc4 (s) = (x/2 + 5z/4) N2 + 1/6 N2 0 + (y - 3,/2) NO + (1/2 - 342) Cl.
+ 3x HCl + [3(Y+z)/2 + l] H20 + (17/12 - 5Y/4) 022O
By assuming values for x and z to match the ex-
perimental values of HCl and N2 1 it is possible to calculate the remaining
product distribution. The results of these calculations, shown in Figure 9,
are in striking agreement with the experimental values.
It is evident from the preceding discussion that the
proposed reaction scheme has afforded a good deal of insight into the nature
of AP propellant combustion, and that there is growing evidence that the overall
kinetic behavior of the NH3 -HC1O 4 redox-flame reaction is governed by at least
two, and perhaps three competing ammonia oxidation reactions, viz; by 02" Cl2
and NO. Thus, the kinetics problem of determining the rate of heat release
near a burning oxidizer surface would involve the determination of the parameters
in the expression i (
where = the volumietric rate of heat release
i refers to the various ammonia oxidation reactions.
X, is the oxidant of the ith reaction.
Hi = the heat of ith reaction per mole of NH3 consumed.
ki = the specific rate constant of the ith reaction0
ai + bi = the overall reaction order of the ith reaction.
2, Thermal Deccmposition of Anhydrous Perchloric Acid Vapor
a. Introduction
Under Contract No. AF 49(638)-566 a brief attempt
ws made to study the reaction between amuonia and perchloric aci4 in a static
-_24

Report 0372-017
system. The reaction occurred too rapidly to obtain rate data even at low
-temperatures (25 - 400C) and pressures. Mass spectrographic analysis of the
reaction products indicated that decomposition of the perchloric acid probably
played an important part in the reaction. For this reason, a study of the
kinetics of the thermal decomposition of gaseous, anhydrous perchioric acid
was undertaken. Work on this phase of the program was initiated under Contract
AF 49(638),-566 and has been completed under the present Contract, AF 49('63*)-85l.
b. Experimental
The decomposition of anhydrous perchloric acid
samples was studied between 1650 and 2500C using two types of systems. In one,
acid samples were decomposed in an all-glass apparatus immersed in an opaque oil
bath and pressure changes, indicated by a glass Bourdon gage and a pressure
balancing system, were used to follow the rate of the reaction. A second
system allowed an intermittent determination of chlorine concentration by use
of a photoelectric colorimeter while simultaneous pressure readings were
obtained.
In the course of these studies, the effects of
a wide variation in initial perchloric acid pressure were studied; pressures
between 8 and 280 mm were used. In addition, the surface-to-volume ratio in
the reactors were varied between 1.7 and 12 cm2/cm3 by the addition of Pyrex
beads, in selected experiments. (See Appendix C for details.)
c. Sumnary of Results
The experimental data indicated that the decomposition
of anhydrous HCIO does not take place by a simple reaction scheme. Initially
the reaction occurs by a mechanism which is second-order in perchloric acid.
However, after approximately 50% of the acid has been destroyed, a first-order
mchanism is rate controlling. Both reaction mechanisn were found to be
-25-
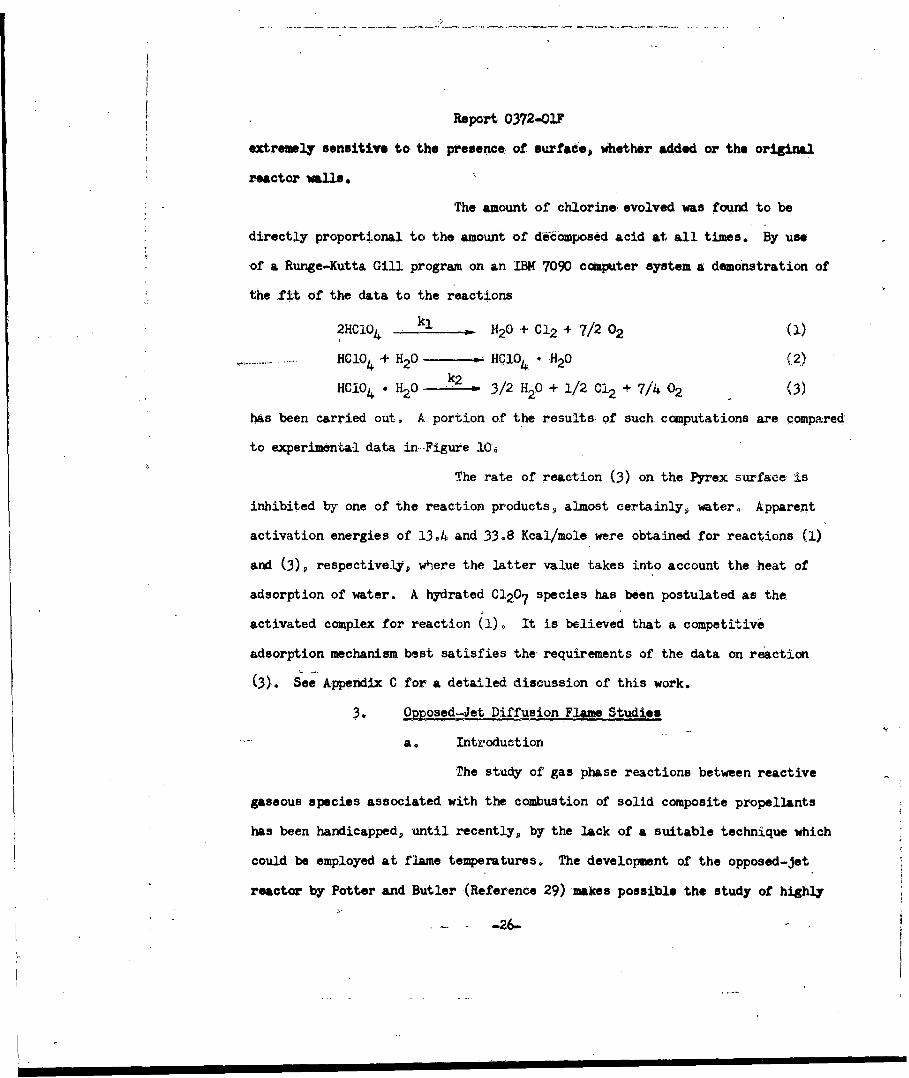
Report 0372-02F
extremely sensitive to the presence, of surface, whether added or the original
reactor walls,
The amount of chlorine evolved was found to be
directly proportional to the amount of decomposed acid at all times. By use
of a Runge-Kutta Gill program on an IBM 7090 computer system a demonstration of
the fit of the data to the reactions
2HC104 k H20 + C12 + 7/2 02 ()
HC1O4 + H20 - HClO4 • H2 0 (2)
HCO 4 • H20 k2 3/2 H20 + 1/2 C12 + 7/4 02 (3)
has been carried out. A portion of the results of such computations are compared
to experimental data in Figure 106
The rate of reaction (3) on the Pyrex surface is
inhibited by one of the reaction products, almost certainly, water. Apparent
activation energies of 13,4 and 33.8 Kcal/mole were obtained for reactions (1)
and (3), respectively, where the latter value takes into account the heat of
adsorption of water. A hydrated C1207 species has been postulated as the
activated complex for reaction (l)o It is believed that a competitive
adsorption mechanism best satisfies the requirements of the data on reaction
(3). See Appendix C for a detailed discussion of this work.
3. Opposed-Jet Diffusion Flame Studies
a. Introduction
The study of gas phase reactions between reactive
gaseous species associated with the combustion of solid composite propellants
has been handicapped, until recently, by the lack of a suitable technique which
could be employed at flame temperatures. The development of the opposed-jet
reactor by Potter and Butler (Reference 29) makes possible the study of highly
-26-
Report 0372-01?
reactive components such as those which are desorbed from the surface of a
subliming or decomposing surface of a solid propollant. An anlyris of this type
of experiment has been made by Spalding (Reference 30) who, within the limits
of a set of simplifying assumptions, has shown the relationships between chemical
kinetic theory and the flame properties measured by the opposed-jet diffusion
flame reactor. Pandya and Weinberg (Reference 31) have demonstrated the use
of the technique to study temperature distributions across flat, premixed
flames to make possible the measurement of heat release rates,
Earlier theoretical studies by Zeldovich (Reference
32) and by Spalding (Reference 33) demonstrated the existence of a fundamental
property of diffusion flames which could be made the basis of a combustion
measurement. These workers showed that when the flow of fuel and oxidant into
the reaction zone of a diffusion flame exceeded a critical value the chemical
reaction could not keep pace and the reaction ceased. In the opposed-jet
technique, the mass flows of fuel and oxidant are increased until the critical
flows are reached at which the flame is extinguished in a region surrounding
the jet axis. Potter, et. al. (References 29, 34, and 35) defined the highest
mass flow rate at which the flame remained unbroken as the "apparent flame
strength." This value was obtained from the average of the sum of the mass
flows of fuel and oxidant divided by the cross sectional area of the jet so as
to give a value of the mean mass flow per unit area. This result, when
multiplied by the theoretical ratio of axis to mean flow velocity (2.0), gave
the mass flow rate per unit area at the jet axis.
During the current contract period, the opposed-jet
technique was used to determine the apparent flame strength of several of the
reactions deemed important in the combustion of solid composite propellants
containing ammonium perchlorate. These results are described in subsequent
sections.
-27-
^m
Report 0372-01F
b. Theory of the Opposed-Jet Diffusion FlameReactor
In this section, the results of the theory of
extinguishment of diffusion flames supported from opposed-jets will be outlined.
Spalding (Reference 32) has developed a mathematical theoz-y which shows the
relationships between the fluid mechanic, mass transfer and chemical kinetic
factors of the opposed,jet reactor system.
As a basis for this development, it was assumed that
jet diameters, gas density and gas velocity of the oxidizer and fuel streams
are equal. (A parallel theoretical development appears required for variations
in gas density and velocity, if this technique is to achieve maximum value).
Using as a model the impingement of an inviscid fluid jet on a flat plate, the
solution of the equation of motion of the gas stream requires that a flat flame
be obtained in which the flame thickness is not greater than 0.2 D. D is the
diameter of the jet approaching the impingement zone. The diagram shown on
the next page indicates the situation between the jet nozzles.
Applying the mass conservation principle to the
impingement region, it was possible to solve for the flame location and the
burning rate in the flame. The position of the flame was defined by
£stoich Mo,... /r = / 1+efYi )](3)mfu. .+ mox'P _ /r
where mox-_ = the mass fraction of the oxidizer in the oxidizer stream
mfu,, = the mass fraction of the fuel in the fuel stream
r = the' mass of oxidizer consumed per unit mass of fuel
4. = the fuel gas density
U = the jet velocity approaching the impingement area
X. = the exchange coefficient (defined as the thermal conductivityof the mixture divided by the specific heat at constant pressure)
_28-

Report 0327-01 ._
MODEL OF OPPOED-JET SYSTEM (Spldinfg)
Axis of ft3*7
OXIDANT JET I 1I -I II
I I
I Izone
IImpingeent -flane of
Region 0DSymmetrr
FuTA
In this fifrao: D - The diameter of the jet approaching the pxlatex - The radial distance frcm the axis of aymwtryy - The distance from the plans of s~r to the fuel jetU - The velocity in the jet aprahn the plate
-29-
Report 0372-017
and Ytoich = the distorted distance along the y axis which indicates thelocation of the flame under stoichiometric conditions.
Values of Y \/jU/ 7, D against fstoich have been computed and are available
for use.
Thus, computation of fstoich' the mass fraction
of material derived from the fuel stream at stoichiometry permits the determination
of the flame coordinate, ,stoich _,U/7D. For example, for a propane-air
system where the following reaction is assumed:
C3H8 + 5 02 3 C02 + 4 H20 (4)
r= 3.63 lb oxygen/lb propane
= 0.222
mfu ' = 1.0
and fstoich = 0.057
The resulting value of Y P .U/7.Dz-I.0 indicates
that the flame lies well on the oxidant side of the stagnation point.
The burning rate in the flame, Qcan be defined in
terms of the mass fraction f, of material derived from the fuel stream which
is present in the local mixture.
/ " uU 2If u e--xp",- y stic (5)atoich { mfur } '7-1/ (1 f stoich)
Q is..defined by Equation (3) and by
exp[ P. U y 2 ]
1 -/) (6)7r 1 (l - f) )
where mfu is the mass burning rate of the fuel per unit area of diffusion
flame and the other terms have the meanings indicated above.
Values of Q have also been computed as a function
-30-

Report 0372-OIF
of f arid are available.
The chemical kinetic aspects of the theory have been
obtained by solution of the differential equation for the fuel concentration mfu:
dy dy y-
= the velocity of gas in the y direction
where mfu = the rate of creation of the fuel by chemical reaction perunit volume. Other notation remains as indicated previously.
The volumetric reaction rate i& is a function only
of the reactants, pressure, local temperature and the local mass fractions of
fuel and oxidant, provided that the chemical reaction is a single step or pro-
ceeds by specified classes of chain reactions (Reference 36).
Employing a variable change, the rate expression
may be put in the following form:
d2Mfu
df 2 (l_f) 2 Q 2
where = DR()
In these equations)
Rmax = R(f,mfu) is the maximum rate of consumption of fuel at extinction
Y =.a non-dimensional reaction rate defined as R/max
Numerical integration of Equation (8) to obtain the
lowest value ofAunder the restraint thatAmust approach unity, gives the
extinction coefficient of the flame. The value ofjdepends on the activation
energy of the reaction, reaction orier and the values of f in the originating jjets.
The value of min when applied to Equation (9)
-31-
-Report 0 372-01F
permits the calculation of R from the jet velocity at extinction, Uext .
Thus, the relationship between Uext and R depends uniquely on chemical properties.max
It can now be shown that the extinction condition
takes the form
/.!LUext 2stoich fstoichUext (10)
stOich mfu,
Applying the Zeldovich, Frank-Kamenetsky
approximation:
mfu,- fstoich G / 2 ffu -fstich- !& dfu (11)
where G is the mass flux normal to a laminar, premixed flame propagating through
a stoichiometric mixture formed from the fuel and oxidant stream.
Then, mfu, oa fstoich G J2r.. mfu .( stoich 2)stoich~nax
Eliminating 4stoich Rmax from Equation (10)
/O.Uext D GD 2 f2stoich
stoich
Equation (5) allows the elimination of U and D fromthis expression so that m ext~mfu, e. fstoich G (14)
This equation indicates that the flame strength is approximately equal to the
burning rate of the fuel component per unit area for a laminar flame propagating
through a stoichiometric mixture of the gases of the diffusion flame.
Making use of this development, the rate of
creation (negative of the rate of destruction) of the fuel by chemical reaction
per unit volume may be expressed as:
-32-

0372-01F
'40 UeXt mfu stoich
-t 0llhuS max (15)• fu max p D2 stoichfstoich
This may be evaluated from the experimental data and the computed numerical
values ofQas a function of f. An assumed value of M, the average reaction
rate., must be applied. +stoich is a number smaller than unity, normally with
a value lying between 0.33 and 0.17. It may be evaluated by construction of
contours on the mfuf plane. 4is the average value T along the line f = fstoich'
For propane-air at atmospheric conditions \fw 0.25. Spalding has reported that
exact values of the 4function are being computed.
The volumetric heat release rate may also be
obtained by multiplying if& by the specific heat of combustion of the fuel.
Three valuable results are implied in this theory.
(1) From Equation (IO),p Uext (AFS), the mass
flow rate per unit jet cross sectional area at extinguishment, is shown directly
proportional to Rmax, the modified rate of consumption of fuel per unit volume.
From this proportionality it should be possible to determine the total dependence
of the volumetric rate upon pressure and to gain some insight into the mechanism
of the flame reaction, since both R and?..Uext, the experimentally determined
quantity, will have the same pressure dependence.
(2) From the same equation, it appears that the
"flame strength" is independent of the transport properties of the gases. Thus,
this technique will permit a study of the kinetic factors of the flame processes
without requiring detailed knowledge of diffusion coefficients of individual
gases in the mixture or of thermal conductivity properties of the mixture.
(3) From Equation (13), at constant values of
D and 7, it may be shown how the mass burning rate of fuel in a laminar flam
-33-

Report 0372-01?.
and "flame strength" are related.
U ext , (mfu, fstoich G )2
(fu-Q stoich)2 (16)
In this expression, the product mfu,.o f stoich G is the mass burning rate in a
laminar flame. A.Uext is, of course, the mass velocity/unit area of the "flame
strength" measurement.
A number of experimental limitations have been pointed
up by the theoretical results outlined above.
(1) The solutions hold for flame thicknesses
of approximately 0.2 D. Translated into the terms of a Peelet number,
,Oo U D
a value >1000 is required.
(2) The derivation also requires that the
incident gas jets remain uncontaminated until they reach the impingement zone.
In conclusion, it is believed that the opposed-jet
aiffusion flame reactor technique has an adequate initial theoretical back-
ground for establishing the method as a major tool in the examination o f high-
temperature and flame reactions between highly reactive components. For general
use, the theory requires study in terms of unequal gaseous densities from the
two jets, gas velocity variations and chemical kinetic system which cannot be
considered to occur in terms of single steps.
c . Combustion of Ammonia In Opposed-Jet DiffusionFlames
(1) Reaction Between HC1O4 and NH3
During the current contract period, a number
of studies of the perchloric-acid-ammonia system have been carried out with the
-34-

Report 0372-01F
objectives of establishing a diffusion flame in an opposed-jet reactor and of
determining the "apparent flame strength" ( eUext) of the flame.
Exploratory studies of this system Carried
out previously under Contract AF 49(638)-566 at temperatures between ambient
and 600C have indicated that these highly reactive components cannot be premixed
for study as a laminar flame, The gaseous products of this extremely rapid
reaction were oxygen, hydrogen and nitrogen and small quantities of nitrogen
oxides. Simultaneously NH4C1 and NH4ClO4 were deposited as solids. In view of
these results, studies of the diffusion flame reaction between these components
was initiated. Figures 11 and 12 are schematic diagrams of the apparatus which
w.s constructed to examine the flow reactions between perchloric acid and ammonia.
The glass system consists of four functional
sections (1) gas preparation and flow rate controllers, (2) the reactioh zone,
(3) sample collection and analysis and (4) vacuum and pressure control sections.
In the gas preparation and control section
(Sections A, B, C, F-L of Figure 12), ammonia gas passes directly from a gas
cylinder through a drying train, a calibrated glass rotameter and a flow rate
controlling section of 1/2 mm capillary to the orifice within the reactor.
Provision has also been made for dilution and mixing of this gas with helium
for examination of the effects of diluents on. the burning velocity. Anhydrous
perchloric acid is prepared under vacuum in an all-glass train without stopcocks
by the reaction:HCIO4 • 2H20 (73%) + H2SO (20% SO3) HClO4 (anhydrous) + H2SO4
The anhydrous oxidizer is passed over magnesium perchlorate and sealed in a
five liter reservoir which is also connected to the reaction cell through a
glass rotameter and a flow-controlling capillary. However, this portion of the
system is closed off from the reaction zone by interposition of a glass breakseal
-35-

Repczt 0372.),F
tube, K, in the line. At the start of a reacion, after ammonia flow into the
reactor has been -stabilized, the break-seal is ruptured by a sealed-in magnetic
breaker to initiate flow of the anhydrous acid through its nozzle into the
reactor.
The reactor (Section E) consists of a 12 inch
section of 50 mm square Pyrex tubing which is mounted vertically. The oxidizer
and fuel enter from opposite ends of the cell and are metered through 1/2 mm
capillary orifices which were separated by 5 cm in the initial experiment. An
electrically heated platinum wire is positiqed approximately 3 mm above the
perchloric acid outlet for igniting the gases.
The exit from the reactor leads directly to
a trapping system (Sections M and N) and a gas chromatograph (Section 0). In
the traps, condensible reaction products are removed from the gas stream. At
the end of an experiment these gases can be revaporized and passed directly
into the chromatograph for analysis. During the reaction, gaseous products
can also be analyzed by a direct sampling of the gas stream. The chromato-
graphic unit contains three columns for separation of the product gases which
are expected to include N2 0, NO, NO2 , Cl 2 , HC1, H2 0, H2 , NH3 , 02, NOCI and N2 .
The columns are 30% Kel-F on powdered fire brick, 13-X Molecular Sieve and 10%
Carbowax on teflon.
The final section of the apparatus consists
of standard manifolds (Section P), a vacuum system (Section U), three pressure
measuring devices, a McLeod gage (Section T), a differential manometer (Section
5) which is read by a cathetometer, and a glass sickle gage (Sections Q and R)
for measuring pressures within the perchloric acid reservoir. A Precision
manostat is also connected to control the pressure in the reactor.
Experiments have been carried out under
-36-

Report 0372-01F
varied experimental conditions. Figure 13 catalogues the conditions of the
experiments. All experiments were conducted at reduced pressures. The effect
of pressure from 1.O to 60 torr was examined while HCO flow rates were4varied between 4.3 x 10⁻⁶ to 2.6 x i0 - 4 moles/min. Mole ratios of HCIO:NH
were varied from 0.05 to 7.7 with corresponding mass ratios between 0,3 and 46.2.
Nozzle geometry was also varied: Initial trials used a 0.5 mm capillary orifice
while 2.0 mm nozzles were used for all experiments at pressures from 9.0 mm
upwards. Nozzle separation was 2.0 cm with the exception of the first trial.
Finally, gas inlet temperatures were varied between ambient and 1801C.
Despite the relatively large range in
variation of conditions, no stable flames were obtained. In two runs, No's 8 and
10, a small flae envelope was observed to form at the perchloric acid jet
initially. However, when the spark igniter system was turned off, the flam
disappeared and could not be reestablished. It is believed possible that the
flame was caused by perchloric acid decomposition, rather than the reaction
with ammonia. In all cases- in which the transient flame was not observed,
a rapid build-up of a white deposit was observed at the HClO nozzle. In the
cases where the flame appeared, the deposit formed immediately on extinguishment.
Analysis of the deposit indicated its composition to be exclusively ammonium
chloride.
In order to ascertain whether it was possible
that li3 might catalyze or trigger the decomposition of HCOb, a test of the
effect of ammonia on perchloric acid at 2300C was carried out. In this ex-
periment, perc hloric acid vapor, whose pressure was monitored by use of a glass
sickle gage, and ammonia were brought to thermal equilibrium in a two-
compartment reactor, After establishing the rate of decomposition of the acid,
a membrane between the two compartments was broken, allowing the gases to mix.
-37-
Report 0372-01F
Instantaneously the pressure rose to a high level, f llowed by a slight decline
to a fixed plateau. Although analysis of the gaseous products are, not available,
some preliminary observations are warranted. From a measure of the relatively
large quantity of gases which were not condensible at liquid nitrogen temperatures,
it is reasonable to conclude that the presence of a relatively small amount of
ammonia appeared sufficient to induce the instaneous decomposition of perchloric
acid.
In any case, this experiment makes it appear
unlikely that a flame can be established between gaseous perchloric acid and
ammonia. Instead, it appears that ammonia reacts with the decomposition products
of HClO4 (oxygen and chlorine) after initiating decomposition of the acid.
The analysis of the jet deposit as 100% NH CI appears to be consistent with these
findings..
(2) Reaction Between 02 and NH3
Following the unsuccessful attempts to
establish a stable NH3 - HC104 flame in the opposed-jet reactor, experimental
work was initiated on the flame reactions between NH3 and two of the decomposition
products of HCIO4 , i.e., 02 and C12 . A new opposed-jet reactor was constructed
for these investigations in order to permit higher mass flow rates of reactants
and better heat dissipation. Figure 14 is a schematic diagram of the apparatus.
This apparatus is basically similar to that
used by Potter et. al. The burner tubes were mounted in a large glass chamber
which in turn was connected to a vacuum system. The pressure was maintained by
means of a manostat which operates on the principle of leaking into the
system the amount of an inert gas required to maihtain any vacuum less than the
ultimate the vacuum pump will pull. In order to start the diffusion flame, the
following procedure was followed. Helium or argon was blown through the fuel
-38-

Report 0372-01F
and oxidant lines for a sufficient length of time to ensure that the entire
system was free of fuel and oxidant, The pressure was then set at the desired
value and fuel turned on until the reactor was fuel-filled. Finally the oxidant
stream was started and the reactants ignited by means of a Tesla coil attached
to and grounded through the metal burner tubes.
To make a measurement, the fuel and oxidant
flows were alternately increased, keeping the flame centered between the two
jets until a hole was observed at the center of the flame. The flame strength
was calculated from the experimental data as follows: The mass flows (gr/sec)
of fuel and oxidant at flame breaking were averaged and the result divided by
the cross-sectional area of the jet to give the mean mass flow per unit area
(gr/cm2 -sec). Since the flame always broke at the center, the mean flow was
multiplied by the ratio of axial to mean flow velocity to give the mass flow
rate per unit area (apparent flame strength) at the jet axis. This factor
is 1.22 for turbulent flow and 2.0 for laminar flow in straight tubes.
The opposed-jet flame reaction between
ammonia and oxygen has been investigated at pressures ranging from 200 torr to
1 atm. Figure 15 is a photograph of a typical flame as it appears at extinguish-
ment. The photograph was taken from below at an angle of approximately 450 .
In this case the experiment was carried out at atmospheric pressure with a 2 cm
jet separation. As the pressure was decreased the combustion zone became
increasingly thin and, at 250 torr, the flame had very little thickness and
appeared to be nearly linear (planar). Changesof less than .5% in the gas flow
rates were sufficient to create or destory the axial flame-quenching phenomenon.
The experimental data are summarized in
Figures 16 and 17. Figure 17 shows the effect of pressure on the apparent
flame strength of the ammonia-oxygen system. Since there is an effect of nozzle
-39-
Report 0372-01?
or jet diameter on the apparent flame strength all data must be referred to a
single diameter (0077 cm in this case). The plotted data are linear and have
a slope of 1.70. According to Spalding (Reference 30) the slope should be the
order of the reaction since the apparent flame strength is directly proportional
to the maximum reaction rate in the flame. Jo Verwimp and A. Van Tiggelen
(Reference 37) studied the reaction by another technique and reported an acti-
vation energy (490°C- T ( 5400C) of approximately 50 kcal/mole, with an overall
reaction order of 1.7 (1.4 order in NH3 and 0.3 order in 02). The agreement
obtained by these two independent methods is excellent.
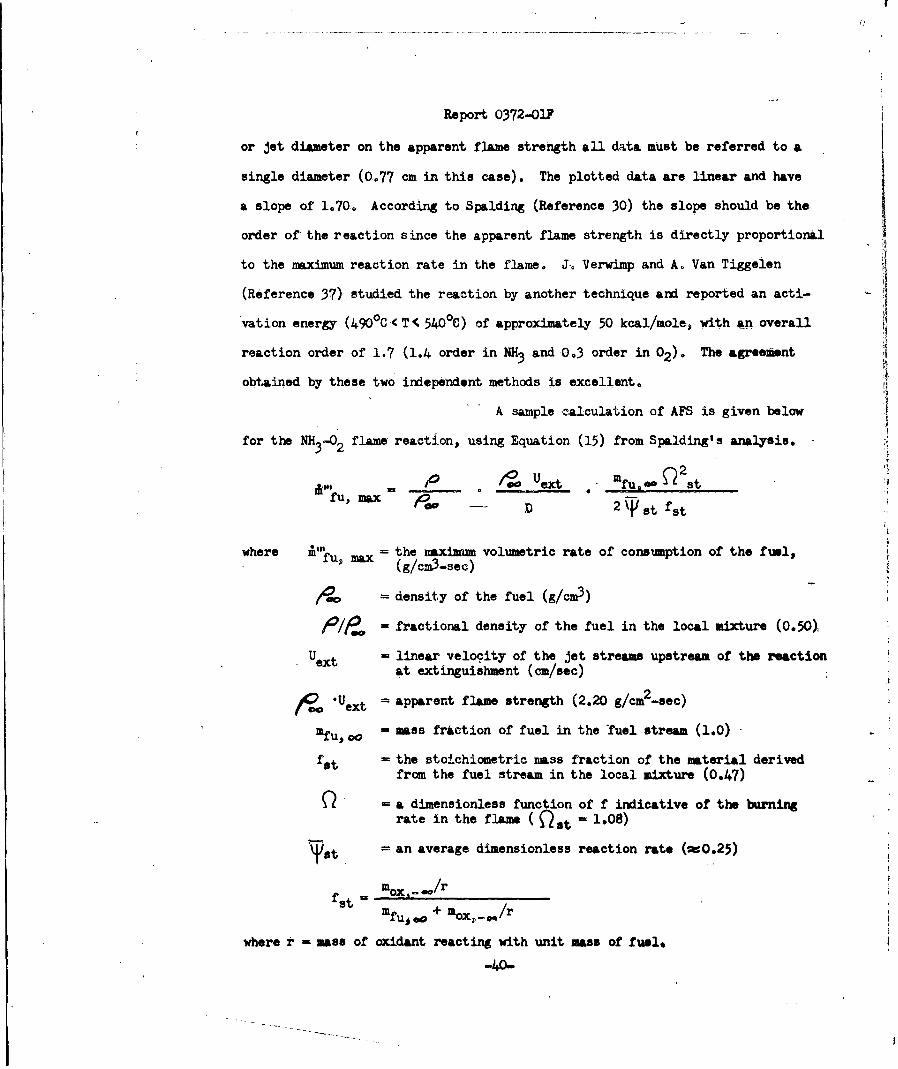
A sample calculation of AFS is given below
for the NH3-02 flame reaction, using Equation (15) from Spalding's analysis.
_ pUext mfu, Q2stfu, ax D 2 7st fst
where "u, = the maximum volumetric rate of consumption of the fuml,4max D (g/cm3-sec)
= density of the fuel (g/c3)
1P1 O = fractional density of the fuel in the local mixture (0.50),
U = linear velocity of the jet streams upstream of the reactionat extinguishment (cm/sec)
SUext = apparent flame strength (2.20 g/cm2 -sec)
11fuoo = mass fraction of fuel in the fuel stream (1.0)
fat = the stoichiometric mass fraction of the material derivedfrom the fuel stream in the local mixture (0.47)
Q = a dimensionless function of f indicative of the burningrate in the flame (Q t 1.08)
et. = an average dimensionless reaction rate (==0.25)
f at= ox,-..1r
mfuo + mox,_O,/r
where r mass of oxidant reacting with unit mass of fuel,
-40-

Report 0372-O1F
Spalding (Reference 30) has plotted values
of Q- as a function of f; values of Tat have been estimated. Substitution of
the appropriate values* in the above equation yields i"' 7.1 g/cm3-secfu, Max
for the ammonia reaction at one atmosphere. Using a value of 3410 cal/g as the
specific heat of combustion, a volumetric heat release rate of q"i -2.42 xmax
104 cal/cm3 -sec is obtained. More exact calculations will become possible when
exact values of 4become available.
On the basis of the approximate theory of
laminar flame propagation derived by Zeldovich (Reference 32), calculated values
of the mass burning rate, G, of a stoichiometric mixture of NH and 02 as3
obtained from the apparent flame strength data at 1 atm were compared with the
mass burning rate of ammonia in a laminar flame using Van Tiggelen's experimentally
determined value (S = 113 cm/sec at 1 atm) of the flame speed. Using this;U
value for S ,9 the mass burning rate G (mfP Sg) was found to be 12.8 x 10- 3
g/cm 2-sec at 700F. The equivalent value derived from the experimentally deter-
mined value of the apparent flame strength is 23.7 x l0 - 3 g/cm2 -sec. These
values differ by a factor of two, however, this comparison is considered
reasonable in view of the estimations involved in Zeldovich's treatment.
One aspect of the kinetics problem of
determining the rate of heat release from the redox-zone of burning AP in-
volves the determination of the stoichiometry of the pertinent gas-phase reactions.
Consequently, product analyses have been carried out to determine the
stoichiometry (and exothermicity) of the ammonia-oxygen flame reactions in the
immediate region of flame extinguishment.
The opposed-jet reaction parameters used in these and subsequent calculations
and the values of A"fu .. and 4"11 for all the flame reactions aresunarised in Figures 3"ad 34, respectively.
-41-
Report 0372-01?
Yigure 18 lists the results of mass spectro-
graphic analyses of the reaction products sampled from the effluent streams of
several of these ammonia-oxygen flames. The sampling and analytical techniques
are such that the values for H20 concentration are inaccurate; therefore, it it
the hydrogen-nitrogen ratio that is utilized in determining the overall
stoichiometry of the reaction. Such a procedure is valid since the data indi-
cate that essentially all of the oxygen in the reaction products appears in the
water. Also, the data indicate that the H2 /N2 ratio exhibits a small pressure
dependency (decreasing with increasing pressure); however, it appears that the
product distribution of the NH-0 2 flame reaction in this pressure region is
characterized by a H2/N2 ratio of approximately 0.5 to 0.6. This conclusion
is substantiated by the results of Gaydon and Wolfhard (Reference 38) who have
calculated the equilibrium compositions and temperatures of NH3-0 2 flames for
various mixture strengths. Their calculations showed that, for a fuel-oxidant
ratio of 5/3, the equilibrium H2/N2 ratio in the flame was 0.55. This would
seem to indicate that chemical equilibrium was attained in the 113-02 flames
examined by means of the opposed-jet technique.
One of the chief features of the opposed-jet
technique is that it provides information concerning the fuel oxidant ratio (in
the flame) at extinguishment, where the reaction rate is at its maximum. This
information has also been used to determine the overall stoichicmetry of the
NH3 -02 flame reaction. The results of an analysis based upon both combustion
product analyses and NH3 /0 2 ratios at extinguishment are presented in Figure 19.
This table lists calculated coefficients for the reactants (based upon product
analyses) and for the products, based upon the measured * 3/0 2 ratios at
extinguishment. An examination of the data reveals a slight disparity between
the calculated and measured values of the 113/02 and H2/N2 ratios; however, it
-42-
-Report 0372-0IF
is clear that the overall'stoichictry of the N 3-02 flame reaction is best
represented by the equation
5 NH 3 02 H + I N 6 0 ()
Actually the "true" overall stoichiometry
for this reaction (as determined in non-flame systems using static reActors)
is
4 NH3 + 3 02 -e, 2 N2 + 6 H20.
It appears, therefore, that some of the
NH3 is undergoing thermal decomposition before it reaches the stoichicmetric
plane in the flame zone.
(3) Reaction Between Cl2 and NH3
The flame reaction between ammonia and
chlorine has been studied by mas of the opposed-Jet reactor at pressures
ranging from 300 torr to 1 atmosphere. It was observed that the NH3 -Cl 2
flame was considerably more difficult to establish than NH3-02 flames, and was
too unstable at pressure below 300 torr (nozzle diameter = 0.77 cm) for accurate
apparent-flame-strength (AFS) measurements. The results of the AFS measure-
ments are sufmnlarised in Figures 20 and 21. A log-log plot of the data
is linear and indicates that the overall reaction order for the NH3-C12 flam
is 2.3 in this pressure ranga.
A comparison of these data with those obtained
for the NH3-0 2 flame reaction in the same pressure range shows that the apparent
flame strength (at 1 atmosphere) of the NH3-O2 system is approximately 70%
greater. This result was unexpected since it was previously postulated on the
basis of the work of R. Mattair and H. Sisler (Reference 39) that chlorine would
oxidize ameonia more rapidly than oxygen. It should be pointed out, however,
-43-

Report 0372-OIF
that at higher pressures (>2 atmospheres) chlorine may be a better oxidant
since the overall reaction order for the NH3 -C12 system (2.3) is larger than
that (1.7) for the NH-0 2 system. This is based upon the assumption that the
same mechanisms are operative at the higher pressures. This system requires
further investigation.
The flame reaction between ammonia and chlorine
has also been investigated by means of the opposed-jet technique in conjunction
with a mass spectrometer in order to determine the overall stoichiometry of this
reaction. Figure 22 lists the reaction products of flame reactions carried out
at pressures ranging from 300 to 745 torr. The data in Figure 20 clearly
indicate that the mole ratio of ammonia to chlorine, in the vicinity of flame
extinguishment, is approximately 9/4 (2.25) in the pressure region of 350 to
650 torr. The mole ratio values at 300 and 745 torr differ somewhat from the
average value of 2.25 because of inaccurate flow rate data. The inaccuracy
of these latter data is due primarily to the instability of the ammonia-chlorine
flame at these pressures. On the basis of these results (Figure 20), the overall
stoichiometry could be represented by the equation
9 NH3 + 4 C12 - 5 NH4C1 + 3 HCl + 2 N2 + 2 H2
which accounts for the measured NH3/C12 ratio of 2.25. However, the results of
products analyses (Figure 22) indicate that the H2/N2 ratio in the above
equation is too high by a factor of about 30. An overall stoichimetry which
is in better agreement with the analytical results (neglecting Run No. 41)
is represented by the equation
7 NH+ 3 C1 2 5 NH4 1+HC1+N 2
-44-

Report 0372-01F
The ammonia-chlorine ratio for this equation is 2.33, which lies within the
experimental error of the extinction measurements. The small amount (-2%)
of hydrogen detected in the reaction products is probably due to incomplete
reaction of the hydrogen fomed in the flae as a result of thermal breakdown
of NH to N2 and H2 .
The volumetric rate of reaction of ammonia
per unit volume for this equation (NH3 /C12 = 7/3) has been calculated on the
basis of Spalding's analysis to be 3.39 g/cm-sec. This value corresponds toa volumetric heat release rate of "' - 9.17 x l03 cal/cm3-ssc. (See Figure 33
for opposed-jet parameters.)
It appears that no quantitative data are
available in the literature regarding the flame reaction of ammonia with
chlorine. R. Mattair and H. Sisler (Reference 39) studied the reaction in a flow
system with the object of forming hydrazine by condensing the products in liquid
ammonia. Consequently, the results of these apparent flame strength studies
represent the only quantitative information currently available for the ammonia-
chlorine flame reaction.
(4) Reaction of 02-C1 2 Mixtures with NH3
The kinetics of proposed mechanism for the
gas-phase reactions above burning ammonium perchlorate is believed to be dependent
kinetically upon the competition between two primary irreversible reactions:
5NH3 + 302 -sH 2 + 5 N + 6H20
22 2 2 O
and
7NH3 + 3C 2 --- HCl + N2 + 5NH.Cl.
In order to further test this hypothesis, preliminary experiments on the flame
reaction between anonia and a mixture of oxygen and chlorine was studied by
the opposed-jet technique. The flames were considerably less stable than those
-45-

Report 0372-01F
*'to which chlorine had not been added, however, they were more stable than the
ammonia-chlorine flaes. Figure 23 is a tabulation of representative data on
the apparent flame strength for the a&aonia-ox~geAL-chlorin mixture as a funetion
of reactor pressure and chlorine content of the oxidizer stream.
These data clearly show the inhibiting
effect of the chlorine on the AFS of these flames. The results indicate that
the AFS of NH3 -0 2-C12 flames is inversely proportional to the mass fraction
of chlorine in the initial unreacted mixture. This fact is further born out
by the data shown in Figure 24.
An unusual feature about these curves is
that the slopes are constant over the indicated range of chlorine mass fractions
(0.1 to 0.3). Furthermore, the overall reaction order (2.0) falls midway
between the values found for NH - 2 flames (1.7) and NH3 -C12 flames (2.3).
Since product analyses could not be obtained
with the present apparatus, no volumetric reaction or heat release rate data
are available for these flame reactions.
(5) Reaction Between NO and NH3
Although it is believed that the overall
kinetics of ammonium perchlorate deflagration is governed primarily by the
competition between 02 and C12 for the H3) other irreversible reactions which
may enter into the overall reaction involve oxidation of the NH 3 by NO, M20
and possibly N02. Consequently, experiments were initiated to investigate
these flame reactions in the opposed-jet reactor.
The NH3-NO counterflow diffusion flame
was found to be quite stable and easily ignited; however. at pressures below
150 torr, the flame exhibited some instability and AFS measurements were not
feasible for a nossle dianter of 0.77 cm. Figure 25 tabulates the conditions and
-46-
Report 0372-OIF
apparent flam strength data for the NH3 -NO system. A log-log plot (Figure 26)
of the AFSversus pressure data is linear and indicates that the overall
reaction order is 1.56 at pressures ranging from 150 to 745 torr. This
value is in good agreement with that found by Wise and Frech (Reference 40)
who investigated this reaction by another technique and reported an overall
reaction order of 1.5; first order with respect to NH3 and one-half
order with respect to NO. Volders and van Tiggelen (Reference 41) on the
'other hand report the reaction to be 1.3 order with respect to NO and 0.5
order with respect to NH3 (1.8 overall). Although there is mild disagreement
concerning the overall order of this reaction, there appears to be
considerable disparities among the results of the various studies regardig
the reaction orders with respect to NH3 and NO.
Initial studies have been made to determine
the overall stoichiometry of the NH3-NO flame reaction. Figure 27 lists the
results of mass spectrographic analyses of representative samples of the
reaction products sampled downstream from the flames. The sampling techniques
are such that the values for H20 concentrations are inaccurate; consequently,
the hydrogen-nitrogen ratio has been utilized in determining the overall
stoichiometry. This procedure is valid since all of the oxygen in the
reaction products appears in the water. The H2/N2 ratio (Figure 27) does not
exhibit a pressure dependency indicating constancy of flame temperature over this
pressure range (150 to 745 torr). However, the observed ratio of O.7
is not in complete agreement with the value (1.0) predicted on the basis of
the stoichiometry determined from the NH3 /NO ratio (u 1.5) at flame
extinguishment. An overall stoichiometry based on the H2 /N2 of 0.7 predicts an
NH3 /NO ratio of 1.0 with unreacted oxygen appearing in the products in order
to give a correct mass balance, In as much as no oxyen was detected in the
-47-
P
Report 0372-.01Fproducts and an M3/O ratio of 1.0 involves too great .an error in the
M3/NO measurement, it is believed that the stoichiamtry based upon the
/NO ratio at extia: uishment is the more accurate ons and that the mrasred
.HN 2 ratio is in error. The overall stoichiomtry of the NH3-NO counterflow
diffusion flame (at extinguishment) can be represented by the following equation*
3 HH3 + 2 NO -- 2 N2 I + 2 H20
Actually, in such an NH rich flaw, the stoichiametry of combustion can be
represented by a combitation of two reactions.
1113 + 1.50 1.25 N2 + 1.5 H20
and
1.25 113 - 0.625 12 + 1.875 H2
These equations indicate that the stoichiametric proportion of WH13 was oxidised
and the excess NH3 (1.25 moles) decomposed into 12 and H2 . A significant
result of the AFS measurements is that the NH /1O ratio (at extinguishment) in3
counterflow diffusion flames does not correspond to the ratio (0.828) for the
mixture giving the l laminar flame speed (Su).
The volumetric rate of reaction of awaonia
for the reaction
1.5 NH3 + NO- -1.25 12 + 1.25 H2 + H2 0 AH -41.89 Kcal/mole MI13
has been calculated on the basis of Spalding's analysis. Substitution of the
appropriate values (See Figure 33) in Equation (15) yields a value forsill 2.73 g/ca 3-sec for the NH3-NO reaction at 1 atmosphere. The
heat release ratio ( a) corresponding to this volumetric rate is 6.73 x 10³
Cal/ca 3-sec.
-48-
Report 0372-01F
(6) Reaction Between 120 M NH
The NI-M20 counterflow diffusion flame
was also quite stable, down to pressure as low as 100 torr (for a nossle
diameter of 0.77). Figures 28-30 sunarize the results for this flam reaction.
The usual plot of AFS versus pressure is quite linear, giving an overall.
reaction order of 2.0 at pressures ranging from 100 to 745 torr.
A comparison of these data with those
obtained for the NH3-NO reaction shows that the apparent flame strength (at
1 atmosphere) of the NH3-N20 flame is approximately 3.5 times that for the
NH3 -NO flame. Considering their respective adiabatic flame temperatures
(2580 and 27100K), this is somewhat surprising. Also of considerable interest
is the fact that the AFS of the NH3 -N20 flame is of the same order of mgnitude
as the NH3-0 2 flaem
Experimental studies were carried out on the
determination of the stoichiometry and exothermicity of the amonia-nitrous
oxide diffusion flame in the immediate region of flame extinguishment. The
results of mass spectrographic analyses of representative samples or reaction
products are presented in Figure 30. The samples were taken downstream from
the flames and the sampling techniques are such that the values for H20
concentration are inaccurate. This presents no problem for the reasons
indicated previously.
The data indicate that unusually large
amounts of unreacted ammonia passed through the reaction zone of these flames.
This finding was unexpected, since this phenomenon was not observed in other
counter-flow diffusion flames between amonia and oxidants such as 02, C12
and NO. Also burning velocity measurements by other workers on binary mixtures
of NH3 with N2Ogave no indication of are unusual behavior which might distinguish
-49-

Report 0372-01F
this flame from those between NH3 and the oxidants mentioned above. The o4
unusual feature of the hM3-V20 counter-flow diffusion flame thkt distinguished
it from those etudied previously is that the flame had a bell shap4 rather
thc= the usual flat disc shpe. Furthermore, the flame extended downward
from the mouth of the oxidant jet rather than remaining suspended between the
two jets as was normally observed for counter-flow flames. Whether or not
these phenomena have any bearing or effect on the nature of the reaction
zone, and consequently, on the passage of NH through it remains to be demonstrated.
-However, the fact -remains that the analytical results are in agreement with
the results obtained fofthe fuel/axidant ratio as determined from reaction
parameters in apparent flame strength (AFS) measurements. The average value of
the fuel/oxidant ratio deduced from the H2 /N2 and NH3/N2 ratios listed in
Figure 30 is 1.75 whicb agrees with the value of 1.74 determined from AFS
measurements (see Figure 28). On the basis of these results and the data listed
in Figure 30, the- complete reaction is best represented by the equation
1.75 NH3 + N20 0.5 H2 + 1.5 N2 + H20 + 0.75 Nl3 (1)
However, subtracting out the unreacted NH3 leaves an overall stoichiometry
for the NH3-N20 counter-flow flame that can be represented by the sum of
reactions (2) and (3).
NH3 + 1.5 N20-- 2N2 + l.5 20 (2)
0.5 NH3 0.25 N2 + 0.75 H2 (3)
These equations (1, 2, and 3) would seem to indicate that the stoichiometric
proportion (1 mole) of NH3 was oxidized to the expected products, excess NH A
'(0.5 mole) was decomposed into N2 and H2 , and finally., that 0.75 mole of "Is
did not rerct. Thus, the exothermicity of the flame reaction is governed
-50-

Report 0372-01W
by the overall reaction
NH3 + N20 - l/2H2 + 3/2 N 21+ H 20 (4)
with a corresponding A H - -3898 cal/gm NH3 . The volumetric rate of reaction
of ammonia for reaction (4) is 1.95 gm/cm3-sec at 1 atm pressure. This value
corresponds to a volumetric heat release rate of 7.6 x M0 cal/cu'-sec.
(See Figures 33 and 34 for sunkary of opposed-jet parameters).
(7) Reaction Between NO2 and NH3
A cursory examination of the reaction
between amonia and nitrogen dioxide was initiated with the objective of comparing
known kinetic data with apparent flam strength data obtained by the opposed-jet
technique. Such a study should facilitate a theoretical analysis of the theory
of fla strength because of the availability in the literature of kinetic data
for this reaction. Furthermore, it has been postulated (Reference 22) that the
rate controlling step of the gas phase reactions occurring over anmonim nitrate
propellants involves the reaction
kgNH3 + M02 k NH2 + HNO2 - Products.
This provides an additional incentive for the investigation of this system.
W. A. Rosser and H. Wise (Reference 42) have suggested that N02 is produced by
the relatively rapid decomposition:
HNO 3 N- O2 + OH
These workers studied the kinetics of the NH3-N02 reaction in the temperature
range of 600 to 800°K and reported an activation energy of 27.5 kcal/mole. They
found that approxinately the first third of the reaction was second order. On
the other hand, F. Falk and R. N. Pease (Reference 3) reported an overall reaction
-51-

Report 0372-03Y
order of 3 for this reaction in the temperature range of 150 to 200 0 C at total
pressures up, to 200 torr. They also observed' a gradual change in the reaction
order,
The results of the initial studies in these:
laboratories on the effect of pressure on the apparent flame strength of
H3-NO flames is shown in Figures 31 and 32. The flames were readily established
and were stable at pressures ranging from 300 to 745 torr. The plotted data
are linear and the slope of the line indicates that the overall reaction order
is 2.43. This value falls approximately midway between the values reported by
the aforementioned workers. These studies need to be extended in order to
provide additional data for -carrying out a theoretical analysis of the flame
strength data in terms of standard kinetic units.
(8) Theoretical Studies
Although the opposed-jet diffusion flame
reactor technique had an adequate theoretical background for the preliminary
studies completed on this program, the experimental work has progressed to the
point where there is a need to obtain actual kinetic rate constants from apparent
flame strength data. Spalding's approximate theoretical treatment in its present
stage of development is not adequate since it requires prior kinetic knowledge
or assumptions about the flame reactions we are attempting to investigate.
This shortcoming in Spalding's treatment was recognized when attempts were made
to obtain the necessary kinetic constants required for the solution of Equation (2)
(Section II, 1., e). Accordingly, theoretical studies were undertaken to
examine the theory with the objective of expanding its development for use with
practical systems.
As a result, a physical criterion for
extinction in opposed-jet flas has been developed and differs somewhat from
-52-

Report 0372-OF
that given by Spalding. In. this treatment, maximu reaction rates are detrmined
by means of physical extinction criteria which are imposed on the flame
process rather than previous or assumed chemical kinetic information.
This criterion, whert used in conjunction
with the Spalding Theory of mixing in opposed gas jets enables
the apparent flame strength to be related to (1) the effective maximum chemical
reaction rate in the opposed-jet flame, and (2) the laminar flame speed of an
equivalent pre-mixed diffusion flame. The derived relationships differ some-
what from similar relationships given by Spalding's earlier treatment of the
phenomena in the thin flame approximation, but do yield quantitatively similar
results.
A detailed discussion of the new treatment
is given in Appendix D. Also in the Appendix (D) is a discussion and evaluation
of dome of the results from the opposed-jet diffusion flame experiments.
Two additional theoretical studies were carried
out, in part, during the present contract period. In one of these studies, a
new model was developed to. explain the extinction process in solid rocket
motors. In the other theoretical study, the thermal-layer theory of steady-
state combustion has been applied to the problem of a low pressure deflagration
limit.
The results of these studies are presented
in Appendices E and F.
-53-

Report 0372-01?
III. RECOMMENDATIONS FOR FUTURE WORK
It is recommended that future work be directed along two general lines:
(i) a continued effort to develop the oppoed-jet technique (and theory) for
investigating fast-burning mixtures and high temperature kinetics; and (2)
investigate the mechanisms of decomposition of single crystals, particularly
with respect to the effect of defects, impurities, etc., on the decomposition
rate.
The opposed-jet technique is particularly useful for investigating high
temperature kinetics of highly reactive or hypergolic materials. Furthermore
it permits studie (particularly, structure determinations) to made of reactive
mixtures under certain conditions that would be impossible to obtain in
c responding premixed flames. It is believed that flame structure determinations
in conjunction with the new theoretical treatment developed on this program could
provide the means of determining kinetic rate constants for highly reactive
systems.
IV. PROJECT PERSONNEL
The following is a list of personnel who were engaged, in whole or in
part, in carrying out the investigations described in this report:
F. J. Cheselske Research Chemist, Principal Investigator(June 1963 to March 1965)
D. J. Sibbett Senior Chemist, Principal Investigator(October 1961 to May 1963)
R. F. Chaiken Technical Specialist, Principal Investigator(February 1960 to September 1961) Later Consultantto the program (October 1961 to February 1965)
A. Wheeler Technical Specialist -
I. Geller Research Chemist
J. M. Lobato Research Chemist
.. 5i

Report 0372-01F
J. E. Sutherland Research Chemist
D. K. Van de Mark Senior Laboratory Technician.
R. S. Godds Senior Laboratory Technician
R. L. Carter Senior Laboratory Technician
P. A. Kees Senior Laboratory Technician
V. PUBLICATIONS
The following is a list of publications which describe the experimental
and theoretical research achievements of this program, Contract AF 49(638)-851.
The disposition of these papers are indicated below.
1. R. F. Chaiken, D. J. Sibbett, J. C. Sutherland, D. K. Van de Markand A. Wheeler, "The Rate of Sublimation of Ammonium Halides";published in J. Chem. Phys., J, 2311 (1962).
2. D. J. Sibbett and I. Geller, "Kinetics of the Decomposition ofAnhydrous Perchloric Acid"; accepted for publication in theJournal of Physical Chemistry (1965).
3. R. F. Chaiken and F. J. Cheselske, "Surface Rate Processeso andSensitivity of High Explosives"; submitted for publication inthe Journal of Chemical Physics.
4. R. F. Chaiken, "A Model for Low Pressure Extinction of SolidRocket Motors"; accepted for publication in AIAA Journal (1965).
5. F. J. Cheselske, R. F. Chaiken and D. J. Sibbett, "Oxidation ofAmmonia in Opposed-Jet Diffusion Flames"; in preparation.
6. R. F. Chaiken, "On the Extinction of Opposed-Jet Diffusion Flames:A Physical Criterion for Extinction"; in preparation.
7. R. F. Chaiken, "Implications of a Steady-State Solid PropellantCombustion Model to a Low Pressure Deflagration Limit"; inpreparation.
-55-
. . . ......

Report 0372-01F
REFERENCES
1. H. Eyring, R. E. Powell, G. H. Duffey and R. B. Parlin, Chem, Rev., ,69 (1949D'
2. M. A. Cook, "The Science of High Explosives", Reinhold Publishing Corp.,New York, N.Y., 1958 -
3. H. Jones, Proc. Roy. Soc., 89A, 415 (1947),
4. A. W. Campbell, M. C. Malin, and T. E. HQlland, "Second ONR Symposiumon Detonations", Office of Naval Research, Washington, D.C. (February 1955).
5. W. H, Andersen and R. F. Chaiken, ARS Journal, ;), 49 (1959).
6. R. D. Schultz and A. 0. Dekker, "The Absolute 'nermal Decopposition Ratesof Solids", Part I, Fifth Symposium (Internalional) on Comaustion, Reinhold,New York (1955), p. 260.
7. R. D. Schultz and A. 0. Dekker, "The Absolute Decomposition Rates ofSolids", Part II, J. Chem. Phys., ?_, 2133-38 (1955).
8. R. D. Schultz and A. 0. Dekker, "The Effect of Physical Adsorption on theAbsolute Decomposition Rates of Crystalline Ammonium Chloride and CupricSulfate Trihydrate", J. Phy. Chem., 60, 1095 (1956).
9. R. D. Schultz and A. 0. Dekker, "Transition-State Theory of the LinearRate of Decomposition of Ammonium Perchlorate", Sith SAmmniu Pechlrat" ixt S vosium (Inter-national) on Combustion, Reinhold, New York (1957), p. 618
10. R. F. Chaiken, D. J. Sibbett, J. E. Sutherland, D. K. Van de Mark, andA. Wheeler, "Rate of Sublimation of Anmonium Halides", J. Chem. Phys., 37,2311 (1962).
11. L. L. Bircumshaw and B. H, Newman, Proc. Roy. Soc., A227, U1S, (1954);
b_ . A227, 228 (1955).
12. L. L. Bircumshaw and T. R. Phillips, J. Chem. Soc., 1957, 4741.
13. A. K. Galwey and P. W. M. Jacobs, Proc. Roy. Soc., A4, 455 (1960).
14. A. K. Galwey arid P. W. M. Jacobs, J. Chem. Soc., 1 837.
15. J. C. Slater, "Introduction to Chemical Physics", McGraw-Hill Book Co.,New York, 1939, p. 293.
16. H. N. V. Temperley, "Changes of State", Interscience Publishers, NewYork, 1956, Chapter II.
17. R. W. Dreyfus and P. W. Levy, Proc. Roy. Soc., 24A, 233 (1958).
-56-

Report 0372-0iF
REFERENCES (Cont'd)
18. D. W. Blair, E. K. Bastress, C. E. Hermance, K. P. Hall and M.Suinerfield, Progress in Astronautics and Rocketry, Volume I, SolidPropellant Rocket Research, Academic Press, New York, 1960, p. 183-206.
19. J. Levy and R. Friedman, Eighth Symposium (International) on Combustion,Williams and Wilkins Co., Baltimore, 1962, p. 663.
20. J. Vandenkerckhove and A. Jaumotte, ibid. p. 689.
21. W. H. Andersen, K. W. Bills, E. Mishuck, G. Moe, and R. D. Schultz, "AModel Describing Combustion of Solid Composite Propellants; Application toAmmonium Nitrate", Combustion and Flame, J, 301 (1959).
22. R. F. Chaiken, "A Thermal Layer Mechanism of Combustion of Solid CompositePropellants; Application to Ammonium Nitrate Propellants", Combustion andFlame, 3, 285 (1959).
23. R. F. Chaiken and W. H. Andersen, "The Role of Binder in CompositePropellant Combustion", Progress in Astronautics and Rocketry, Volume I,Solid Propellant Rocket Research, Academic Press, New York, 1960, p. 227-249.
24. P. W. M. Jacobs and A. R. Tarig Kureishy, Eighth Symposium (International)on Combustion, Williams and Wilkins Co., Baltimore, 1962, p. 672.
25. L. L. Bircumshaw and B. H. Newman, Proc. Roy. Soc., A227, 115 (1954);A227, 228 (1955).
26. A. K. Galwey and P. W. M. Jacobs, J. Chem. Soc., 1959, 837
27. A. K. Galwey and P. W. "'. Jacobs, Pro. Roy. Soc., A254, 455 (1960).
28. Aerojet-General Corporation Quarterly Project Report No. 0372-01-12,Contract AF 49(638)-851, 31 December 1962 (Unclassified).
29. A. E. Potter and.?J. N. Butler, "A Novel Combustion Measurement Base fnt..the Extinguishment of Diffusion Flames", ARS Jour., ?J, 54-56 (1959).
30. D. B. Spalding, "Theory of Mixing and Chemical Reaction in the Opposed-Jet Diffusion Flame", ARS Jour., 31, 763-771 (1961).
31. T. P. Pandya and F. J. Weinberg, "A Study of the Structure of LaminarDiffusion Flames by Optical Methods", Ninth Symposium (International) onCombustion, Academic Press Inc., New York, 1963, p. 587.
32. Y. B. Zeldovich, "On the Theory of Combustion of Initially Unmixed Gases",NACA Technical Memorandum No. 1296, Translated from Zhur. Tek. Fiz.,12,
-1199-1210 (1949).
33. D. B. Spalding, "A Theory of the Extinction of Diffusion Flames", Fuel, 33255-273 (1955).
-57-
Report 0372-01F
REFERENCES (Cont 'd)
34. Evelyn Anagnostou and A. E. Potter, "Flame Strength of Propane-OxygenFlames at Low Pressures in Turbulent Flow", Ninth Symxosium (International)on Combustion, Academic Press Inc., New York, 1963, p. 1-6.
35. A. E. Potter, J. Heimel, and J. M. Butler, "Apparent Flame Strength",Eighth Symposium (International) on Combustion, Williams and Wilkens Co.,Baltimore, 1962, p. 1027-34.
36. D. B. Spalding, "One-Dimensional Laminar Flame Theory for Temperature -
Ekplicit Reaction Rates", Combustion and Flame, 1, 296-307 (1957).
37. J. Verwimp and A. Van Tiggelen, Bull, soc. chim. Belges, 62, 205 (1953).
38. A. G. Gaydor and H. G. Wolfhard, "Flames, Their Structure, Radiation, andTemperature, Chapman and Hall Ltd., London, 1960, p. 297.
39. R. Mattair and H. H. Sisler, J. Amer. Chem. Soc., 7, 1619 (1951).
40. H. Wise and M. W. Frech, J. Chem, Phys., 22, 1463 (1954).
41. A. Volders and A. Van Tiggelen, Bull. Soc. Chim. BelA., 63, 542 (1954).
42. W. A. Rosser and H. Wise, Jet Propulsion Laboratory Progress Report No.20273, California Institute of Technology, 15 September 1955.
43. F. Falk and R. N. Pease, J. Amer, Chem, Soc., 76, 4746 (1954).
-58-
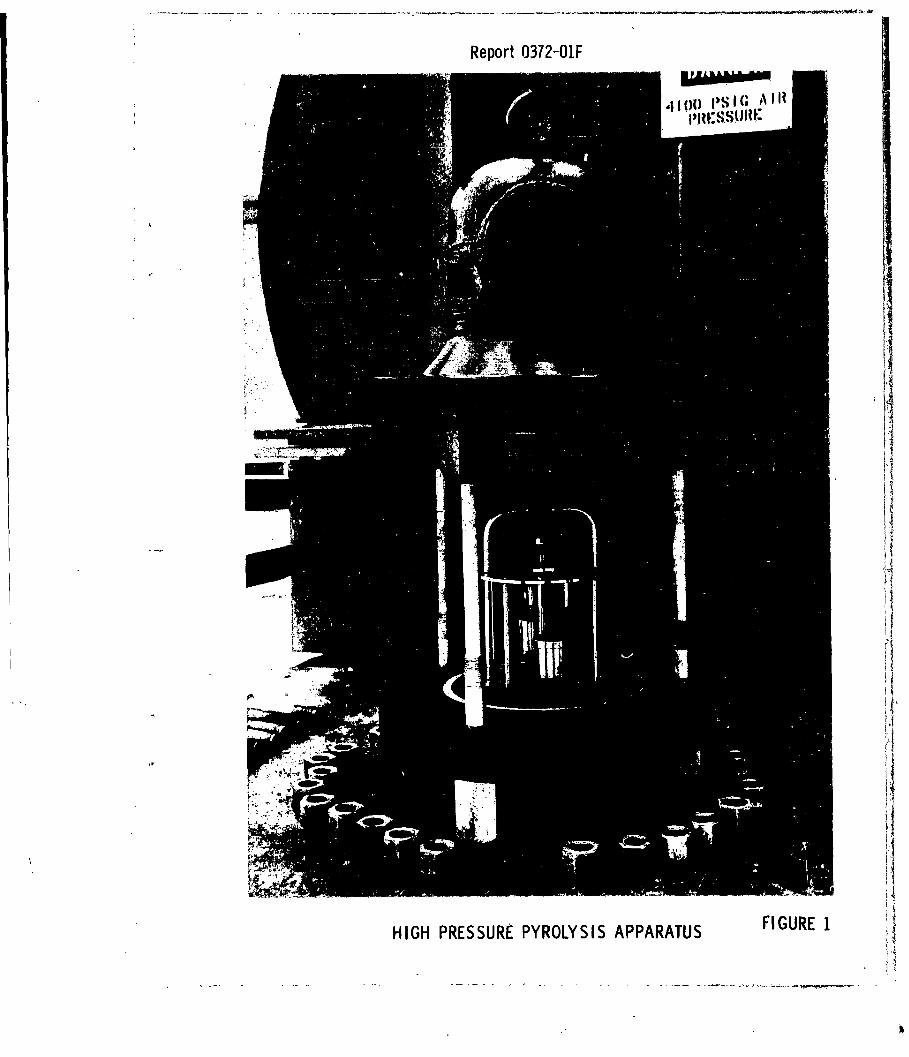
Report 0372-O1F
I C' A
U 14
HIGH PRESSURE PYROLYSIS APPARATUS FI GURE 1 j

Report 0372-0O1F
0-44
CL
ii 2e~
FIU!

Report 0372-01F
Fiuze 3. Crystal No. 1 Original Surface before Heating. 100OX Bright Field.
Figure 4. Crystal No. 1 -Surface after Heating for 30 Min. at 1900 C. Same
Area as Figure 3. 100OX Bright Field.
Figures 3-

Report 0372-01F
Figure 5. Crystal No. ,l - After Heating for 90 Min. at 1900C. Same Area asFigure 3. O00OX Bright Field.
Figure 6. Crystal No. 2 - After Heating fo 15 Min. at 2200C. O00OX Bright Field.
Figures 5 - 6

Report 03T2-OlF
Figure T. Crystal No. 2 -After Heating for 45 Min. at 2200C. lO00X Bright Field.
Figure 8. Crystal No. 3 -After Heating for 9 Min. at 250'C. 100OX PolarizedLight.
Figures 7 8

Report 03T2-0)1
~ *0
~~1o 0 0
tz p.1 0 Ic0 0 0 -1 - C
ca k
,
C) cv, 0
-r
11 0c 0 '0 N
or) (na
H -\
OI. 1 + C
caIc N MN r
CD .)
rx4r Hr- C)
C)- 0 Q)
00) & )4-1
'-0 C8 0c 01 Q' 4-
U-\ C) N
* ~ 4 C; 0R U0CH q-44) k
it C C3 6 C 0 Cj C 0' -1 0)
4-) CH
'-0 0) C Ur
It CQ 4i~~~CLr + N0 *
W LFigurer9

Report 0372-02F
DECOMPOITION OF PERCHIUIC ACID AT 200*C
--Comparison of ,Experimental and Computed Results
Experimental Calculated .004 C12 H20 02Time Pressure Pressure Pressure Pressure Pressure Pressure
0 218i.5 218.5 0 0 0. 0
20 278.7 281.2 182.7 17.9 17.9 62.7
'-,40 333.7 327.2 156.4 31.1 31.1 108.7
60 370.2 362.2 136.4 41.0 41.0 143.7
80 392.2 389.5 12o.8 48.9 48.9 171.0
100 410.2 411.5 108.2 55.2 55.2 193.0
120 426.5 429.6 97.9 60.3 60.3 211.1
140 441.0 4 44.7 89.3 64.6 64.6 226.2
160 453.5 457.4 81.9 68.3 68.3 238.9
180 465.5 468.4 75.7 71.4 71.4 249.9
200 475.7 477.9 70.3 74.1 74.1 259.4
220 484.3 486.2 65.5 76.5 76.5 267.7
240 492.5 493.6 61.3 78.6 78.6 275.1
260 500.0 500.1 57.6 8o.5 80.5 28l.6
280 505.5 505.9 54.2 82.1 82.1 287.5
300 511.0 .. 511.2 51.2 83.6 83.6 292.7
320 516.2 515.9 48.5 85.0 85.0 297.5
340 520.6 520.3 46.o 86.2 86.2 301.8
360 524.8 524.2 43.8 87.4 87.4 305.7
380 528.2 527.8 41.7 88.4 88.4 309.4
400 532.0 531.2 - 39.8 89.3 89.3 312.7
Figure 10

Rmport 0372-031
REACTOR FOR STUDY OF WC 014 - NH,. FLAMES
Maf FO8R3 f
AND'NU JI GIE
-1/2 -CAPULUZI
TOVAUA 310 ZL
H'104
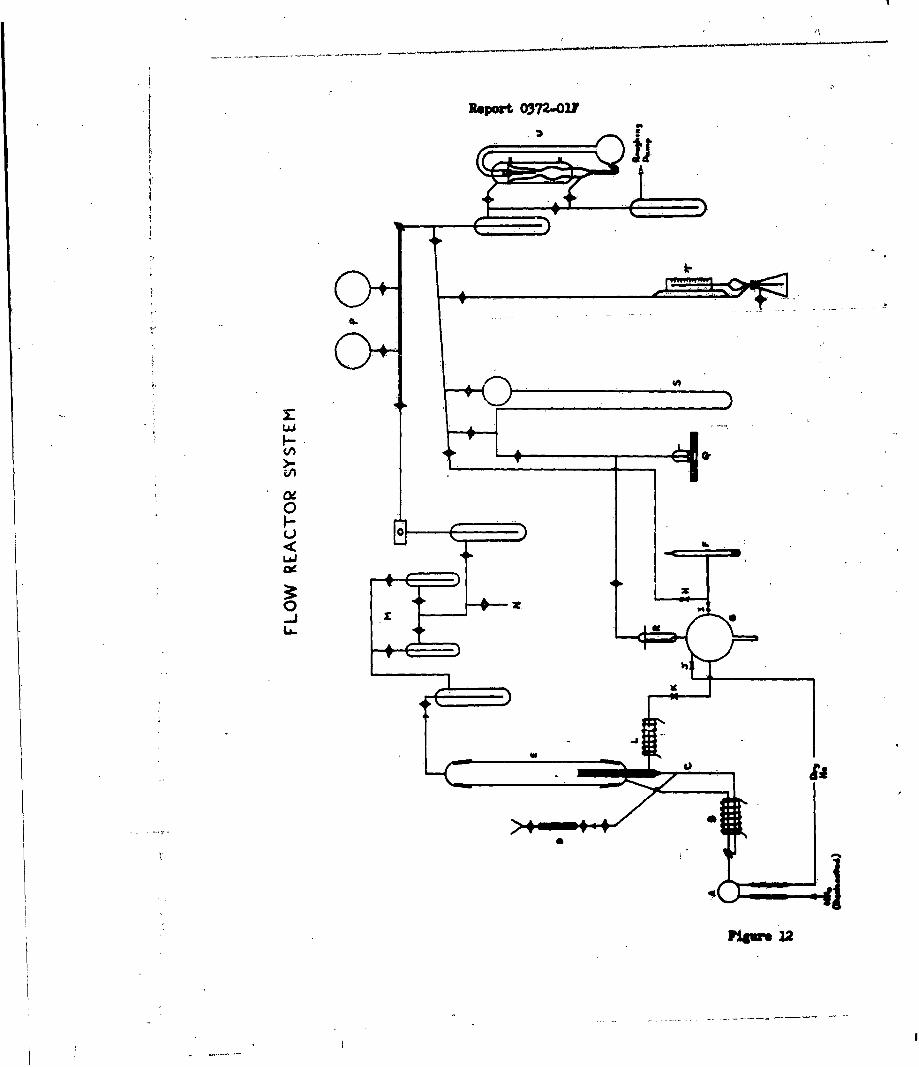
Report 037"302
0
0
-1J
flu9J
- -....-. grit

RaOzt 0372.011
H \D 0 0
Nj N \0 N N i UN
0 0-0
1 0 0
- H4 0 0N N 0N N C
14 ccu 0 H 0
m o
00 '0 C
~0 H HC6 0~- 0 0 Nu
00
4)-
0iur 03

RoPeat 0372.0OV
MNi
t~
.3 43.4
I W
III
Figue I

Report 0372-011
AMMONIA - OXYGEN DIFFUSION FLAME
AT EXTINGUISHMENT
Oxygen inlet at top
Ammonia at bottom
iI
tiI

Report 0372 -01F
U- L\ C]j 0 Ll
C) coco H.
4? r) 4 4
4- o
0 ON l \ C ) C '] - t
U-\ ) C ) C)
U-\ C)m' " t- C) --tc
t-- 0 H -t " ] ~ -
t- r d 1- r- "0 C r4 E
0) C)4- 4r.00 cO
-r4 H, CC)
Q)'- HD C) R y
-H r-H
0 a
0 C0
4--'
H COH ') 0 C) H O C)041"
L*H 4-' 4
8 C*
a) 4-4C-
~r4 ;i ',
0
4'W z4~ HW C) *U~ H-.. P 0) 0)41
D) MY-H H C-I
Figure 16
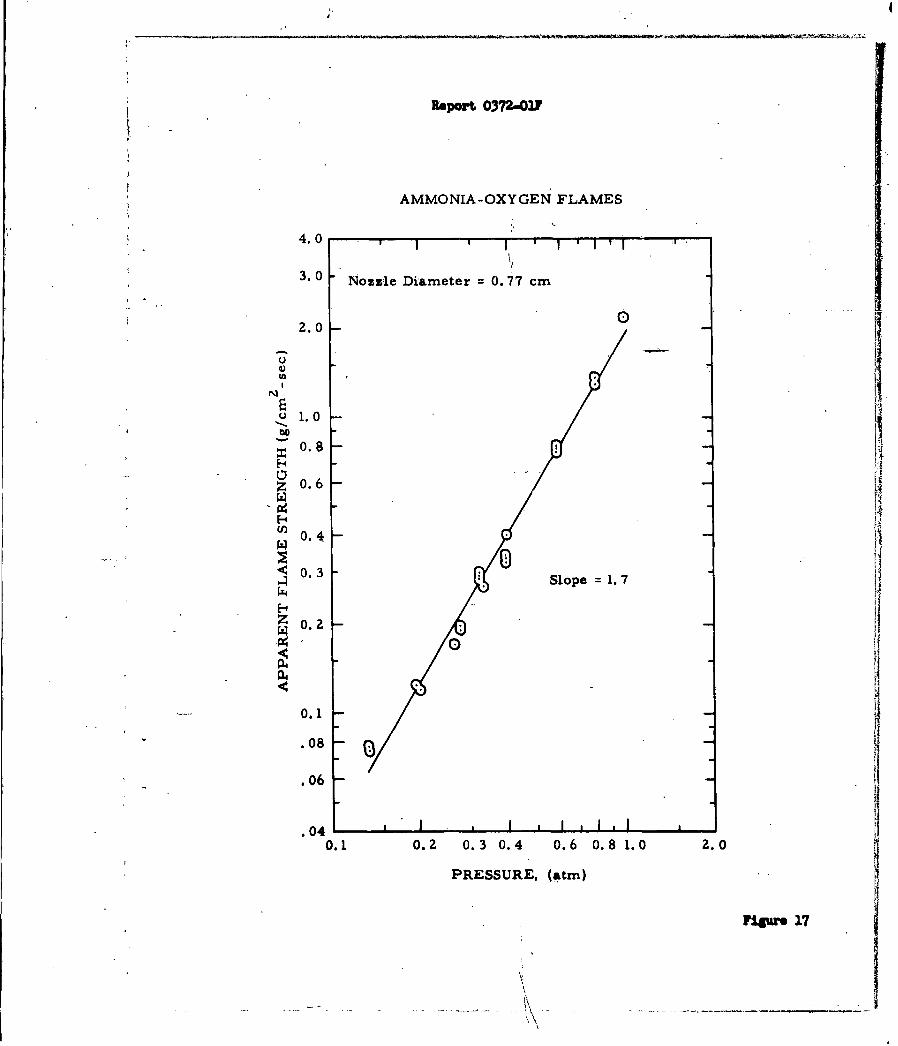
Report 0372-OW
AMMONIA-OXYGEN FLAMES
4.0 , I' I ' 1 ' I '
3.0 Nozzle Diameter = 0.77 cm
2.0 0
u 1.0
0O.8
Z 0.6
S0.4
j 3Slope =1. 7
0.2
0.1
.08
.06
.040.1 0.2 0.3 0.4 0.6 0.8 1.0 2.0
PRESSURE, (atm)
INWO 17
.... . ... ... ... ..... .. . .. r e l?

Report 0372-01F
ttia)
4--
a)
0
C)
0 0 0 -0
0)*
-4
Fiu0 te8
EAi
m 0 0 0Ea 0 Lr\ U-\ LC\Q) E-I (Y) \1
0
Q a)
H
Figure 18
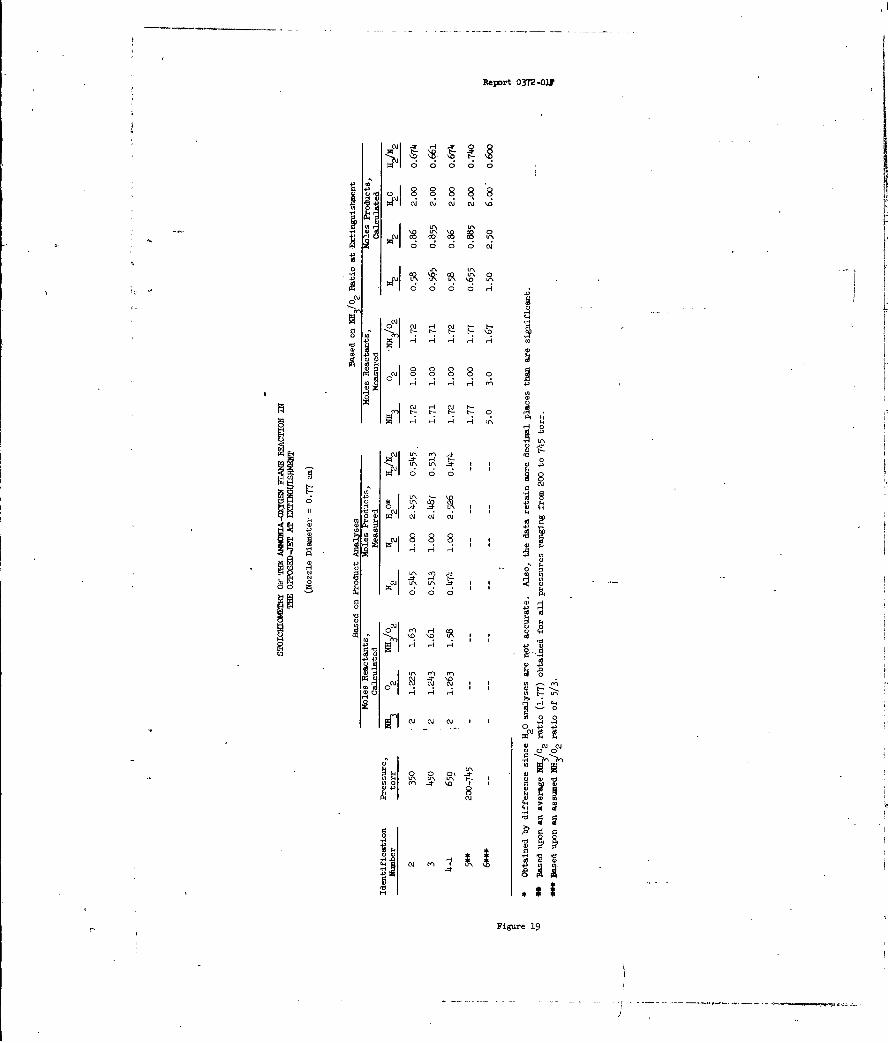
Report 03T2-OWF
4.'
0~ 0 0 0 0 c
0 O
4.'
.13
4P C,
ii e4 8888H H
Ht
0
0
0~ ~ 0I ]C
0 0.m
~~IHHH
4.'ur 419
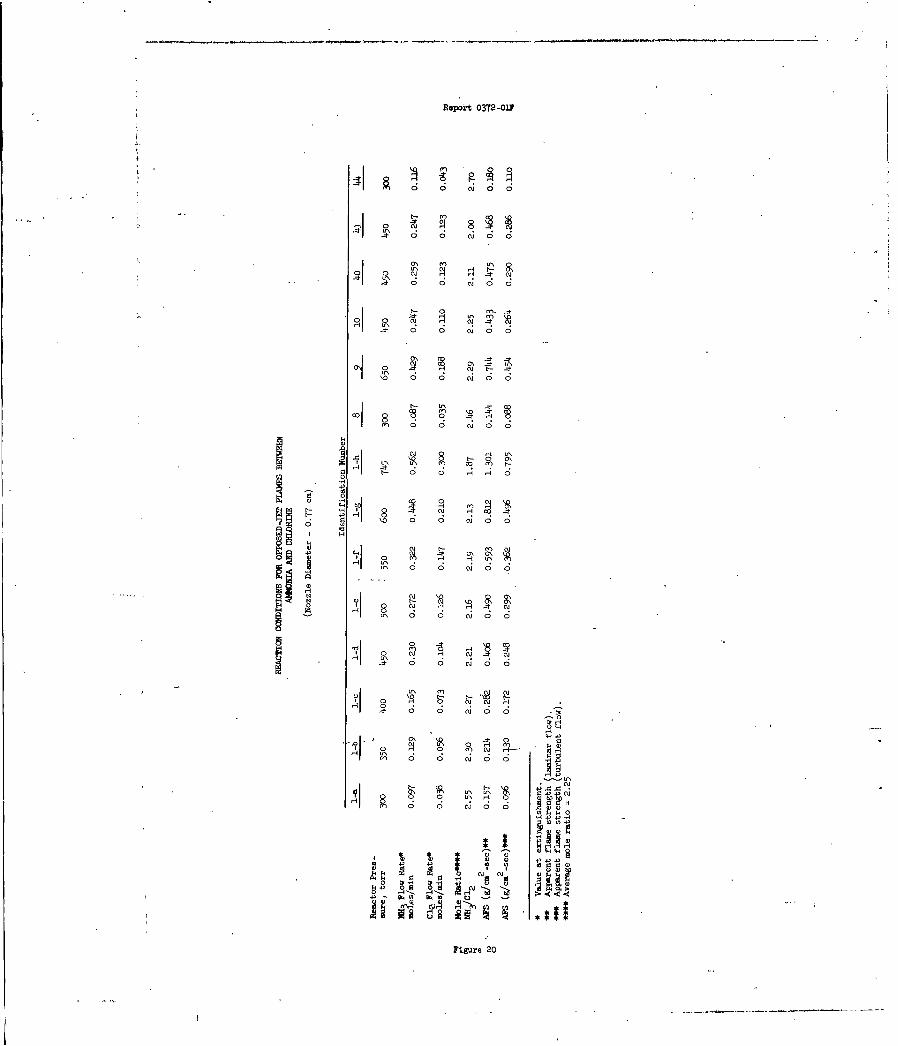
Repoit 03T2-01?
* 0 0 NU o
o" 0 NU 0 0
4)4
0 CU 0
C)) 0- t-- )
1 . C;) C) 0
8 8 m C
0 C 0 0 H) 0 0
C)
o 0 0 0
w c ud
o: o 0 N 0 0
ol 0 Cu) 0 0
4 C 0 0 '1
~~*H1 44
0 CJ.. ..
Figure 20
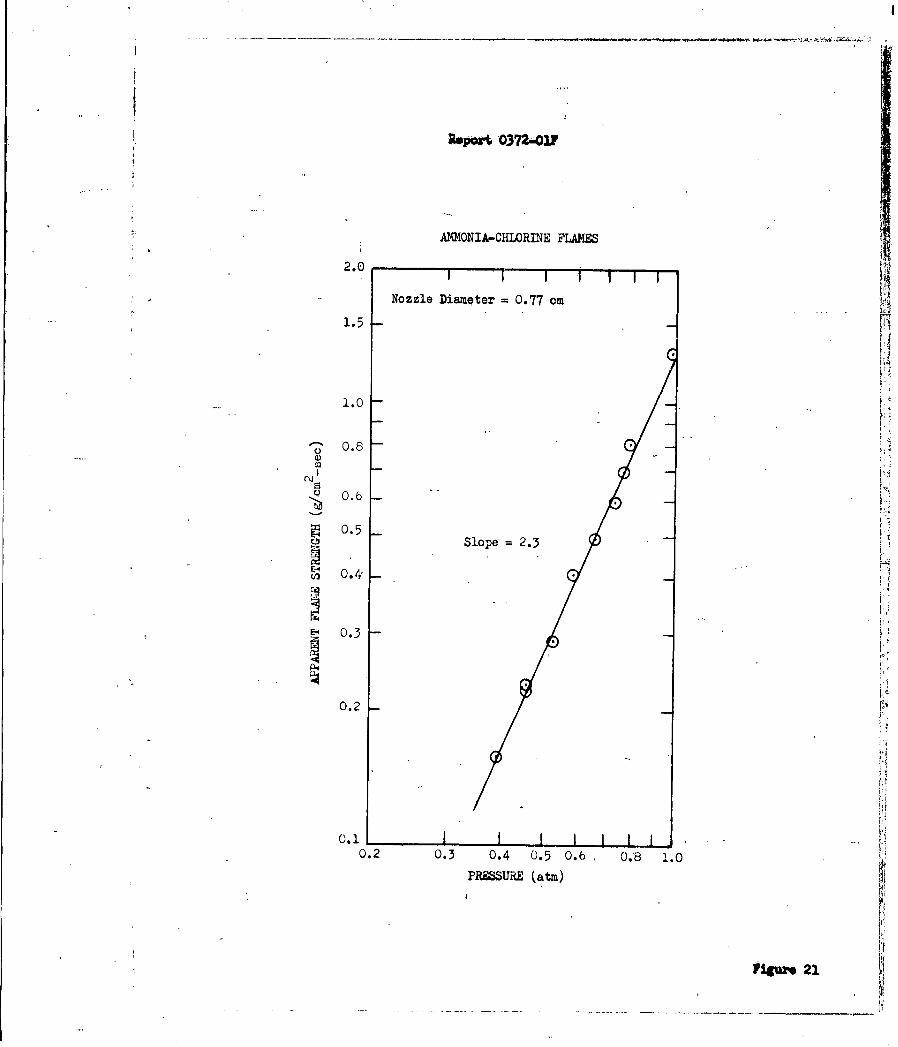
$
arp~rA 0372-031
AMMONIA-CHLORINE FLAMES
2.0
I 1 1 I, Nozzle Diameter = 0.77 cm
1.5
1.0
o 0.8
o 0.6
0.5Slope = 2.3
0.3
P4
0.2
0.10.2 0.3 0.4 0.5 0.6 0.8 1.0
PRESSURE (atm)
igure 21

Report 0372 -0iF
Q1)P
0
83 4>~C
C\J P r4HO * ~r- rd J
43 Q 0 w- 00' 0 -E4 C\J CJ. 0 0 r4
r4 U
ca) 43 -r
* 0
4.+ + + + 4
00 aJ)
C.?) H- OC .4P
4rd
Cc
0 U
CQ) r u.. C)
T\ +\*C
0I c ci c )
0 C)+' OC)' -4W b
H 00 0 -4
0 ~ HjC) 0
00 Ea
t- 0 0 0 *
4C)C
a)) 4-C0 F-4 C)
o0 rd0*
C)C .EO * O ~o
S0 0 H04H -4 t 4 - t ca
Figure 22

Report 03"'2-0IF
-AMONIA-OXYGEN -CHLORINE FLANES
(Nozzle Diameter: 0.77 cm)
AFS,* Laminar Flow Mass Fraction C1 Pressure,___g/c_2-sec)__ . in Mixture (torr)
2.01 o.o68 74
1.21 0.225
o.844 0.300*- "0t,717 0-. 353 "
1.28 0.073 600
0.744 0.222 "
0.516 0.297
0.668 0.071 450
0.520 0. 1P4 "
o.446 0.210 "
0.326 0.262
0.3o4 0.051 300
0.254 0.100 "1
0.209 0.190 "
0.169 0.257 "
* AFS - Apparent flame strength
°'. Figure 23

Rpeat 0372-OW
AMMONIA-OXYGEN- CHLORINE FLAMES
2.0
Nozzle diameter = 0.77cm 0
1.50 0. 1 mass fraction CX2,& 0.2 mass fraction Cl 2
E 0.3 mass fractionCl
1.0
u
w .8N
bC .6
Z1: ..4
z.3
C .2 Slope =2.0
4
.1 . I *' I
• .4 .5 .6 .8 1.0
PRESSURE, (atm)
F0Iguie 24

Report 03T2-037
0; 0 H1 0 0
0 0
0 H 0 0
(M 0 0 H4 0 0
CO
I H 0 0 H 0 0
0 -1
O I H 0 0 0 0 3
~4 u 0 0 0 0 4
Cu 0 A
'0 0 0 H 0 0 3
S0 0 o
IRI4~j 10 0 0 5 0
0 r 0 0 H4 0 0CA s4* 0 0 H 0 0 01
HI od C4
0\
0 4''4
Figure 25

leport 0372-031
A~MMN-ITRIC OKIDZ FIAlossle Diamoter - 0.77 On
ianimar Flow1.0
.7
.5
* .3
. 25 ,
.2 Slope- 1,56.*i .15
0.10
.08
.07
.06
.05
'. 04 I I I 1 1 1 1I 1.1 .15 .2 .25 .3 .4 .5 .6 .7 .A .9 1.0
Prssure (at.)
flaws as

Report 0372 -Ol
P-34
CC.C.) a)-
cxi.. Ar r
CD
44.
4a
a) 14'
Figuare 27 i
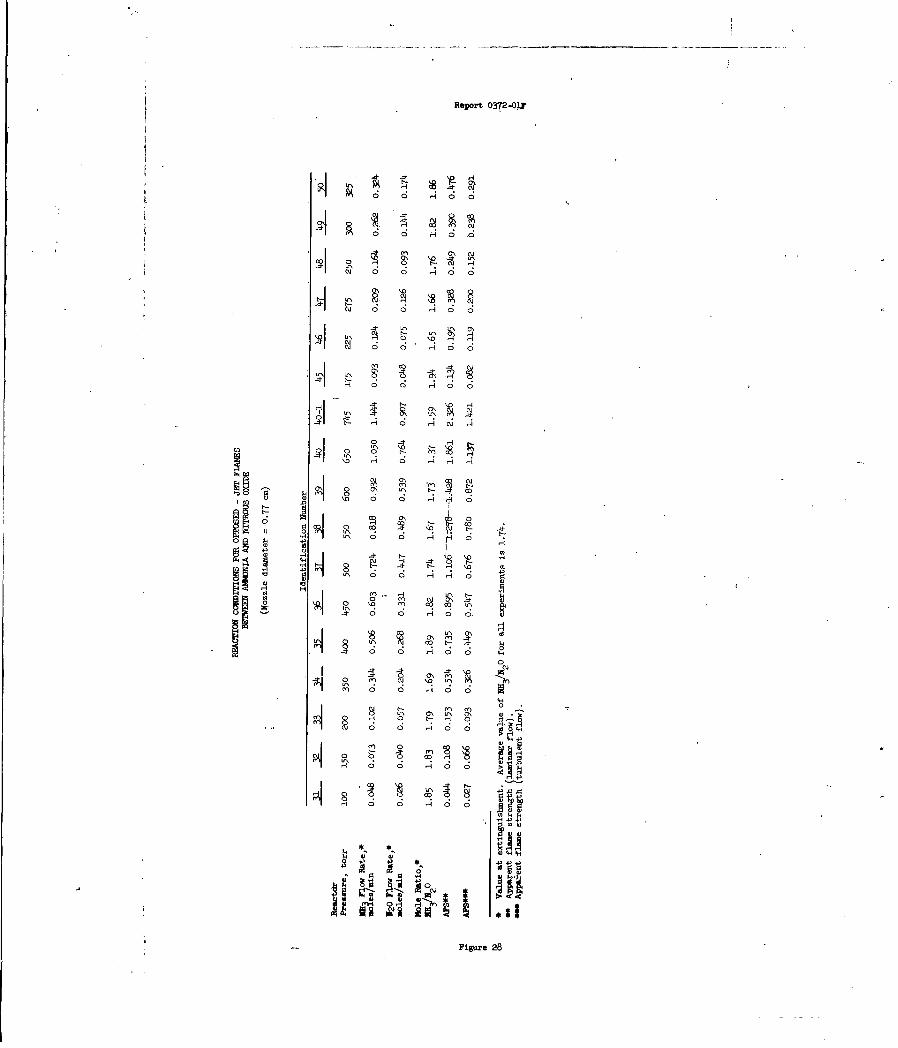
Report 03T2-03W
0 0
0 Al0 H 0 0
0 R
0 0 0
0 Ha 0
0 0 H 0 0
0 0- H -0I
01 la i > i 'A -4
0 k 0 0 HA H 0
4, H
HH\0 HmiI 48,9 LH- U-' -- o1o
0 O\ "m
o1 0a- N ' - o -
'~ 0 0 H o 0
4 64
4.,+
Figure 28

Report 0372-01V
&3MSMIA-MIOUrS. OXID 7U3ossle Diiamt.r - 0.77 On3.0 .....
2.5-
2.0-
1.0 - Slope -2.00.9-
o.80.7-
0.6-
• 0 .5 _
0.4I '
0.25 -
0,2 - o.i
0.25
0.1 .0
0.1 0.15 0.2 0.25 0.3 0.4 0.5 0.6 07 0.8.0.91Lo
helm (t.) [
P':l ap~o i

Report 0372 -01F
.C',
H .0 0 0
* 0 X *
C\J H ~ H U
HiZ 0
r-) a)-It
00 0
P-4 OO
0 C OD LCeh0 0
\10 0 %
(Y 0 a
H~~ Cc -C\ Cla)H H H p ~U)
W~r8I .
o 0
Lr. ) a) co M 0)P-1 C~ rnQ (1)
r4~ Cu Cal c
rd Cuj(Y1 tLc\\ t
Figure 30
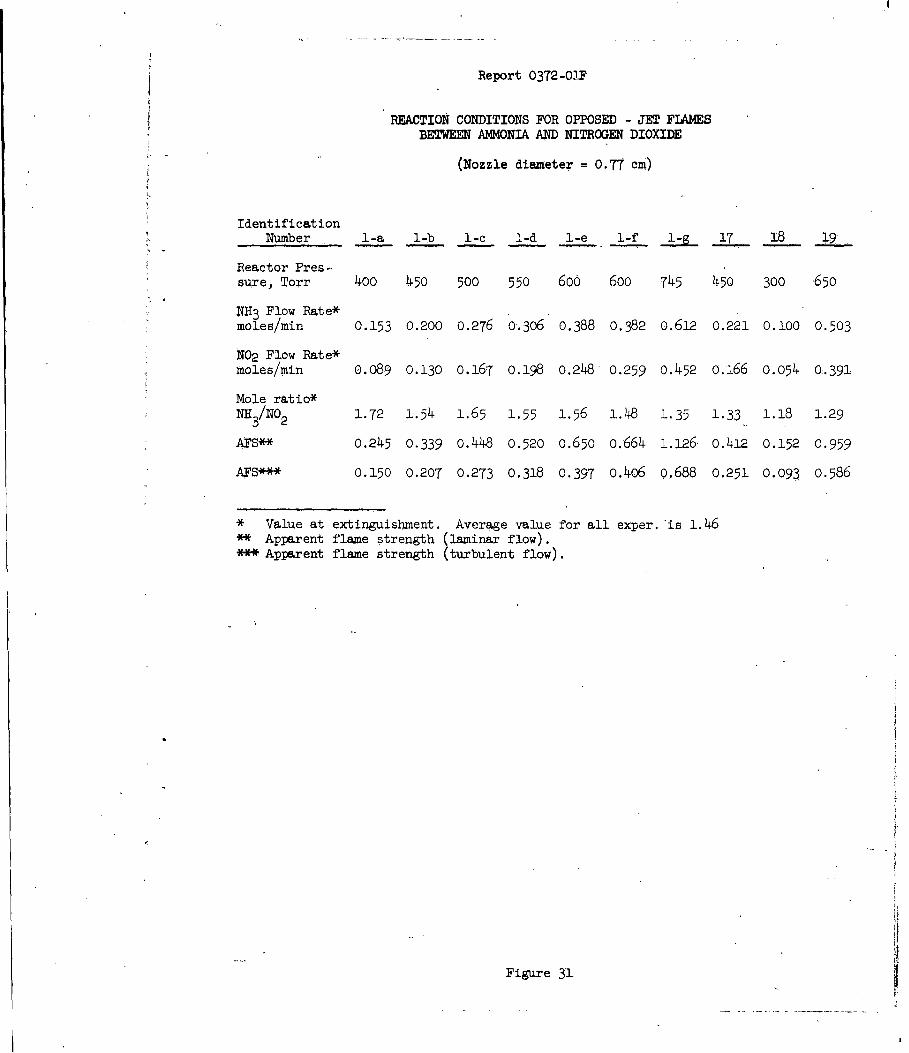
Report 0372-0IF
REACTION CONDITIONS FOR OPPOSED - JET FIAMESBETWEEN ANMONIA AND NITROGEN DIOXIDE
(Nozzle diameter = 0.77 cm)
IdentificationNumber 1-a 1-b 1-c 1-d l-e 1-f 1- 17 18 19
Reactor Pres-sure, Torr 400 450 500 550 600 600 745 450 300 650
NH 3 Flow Rate*
moles/min 0.153 0.200 0.276 0.306 0.388 0.382 0.612 0.221 0.100 0.503
N02 Flow Rate*moles/min 0.089 0.130 0.167 0.198 0.248 0.259 0.452 0.166 0.054 0.391
Mole ratio*
NH3/N02 1.72 1.54 1.65 1.55 1.56 1.48 1.35 1.33 1.18 1.29
AFS** 0.245 0.339 0.448 0.520 o.650 0.664 1.126 0.412 0.152 0.959
AFS*** 0.150 0.207 0.273 0.318 0.397 o.406 0.688 0.251 0.093 0.586
* Value at extinguishment. Average value for all exper. is 1.46** Apparent flame strength (laminar flow).*** Apparent flame strength (turbulent flow).
Figure 31
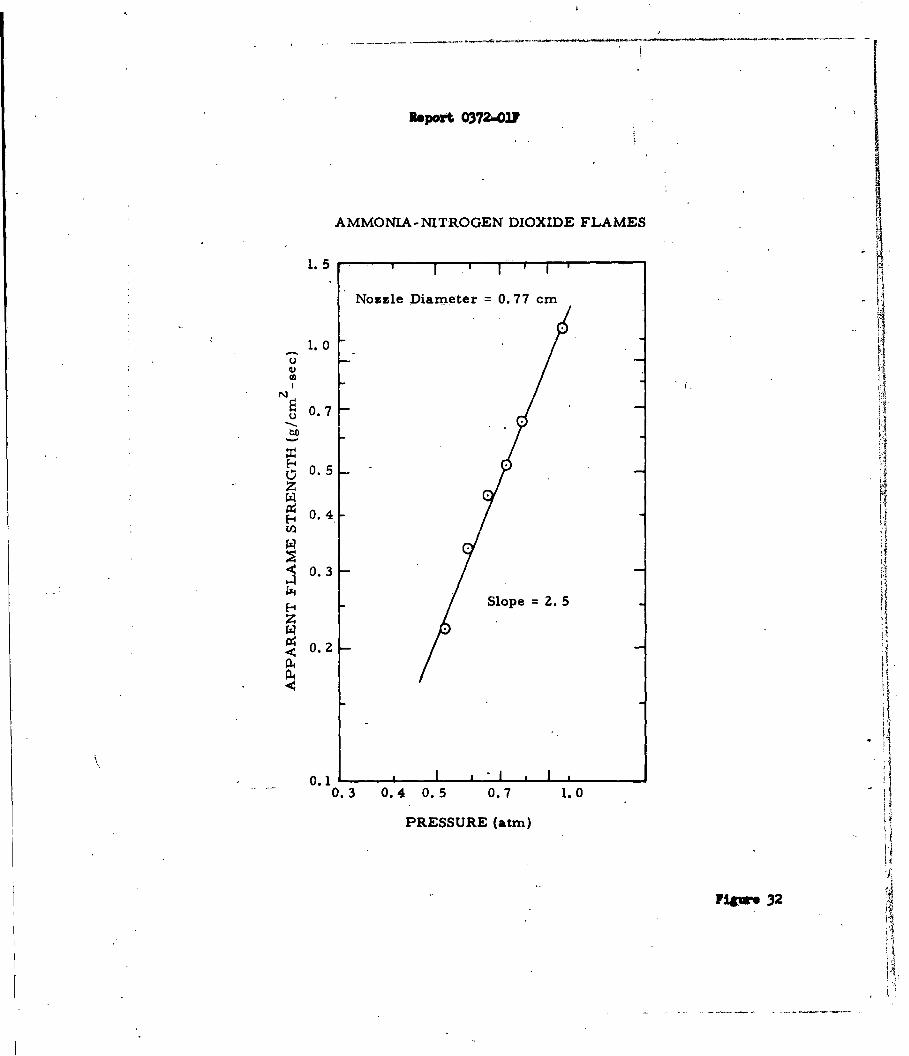
Report 0372-031
AMMONIA- NITROGEN DIOXIDE FLAMES
Nozzle Diameter = 0.77 cm
1.0 -
N
" IN 0.7---u
0.3
0. I Slope Z. 5ZI
~0.2
0.11
0.3 0.4 0.5 0.7 1.0
PRESSURE (atm)
Fi~gure32
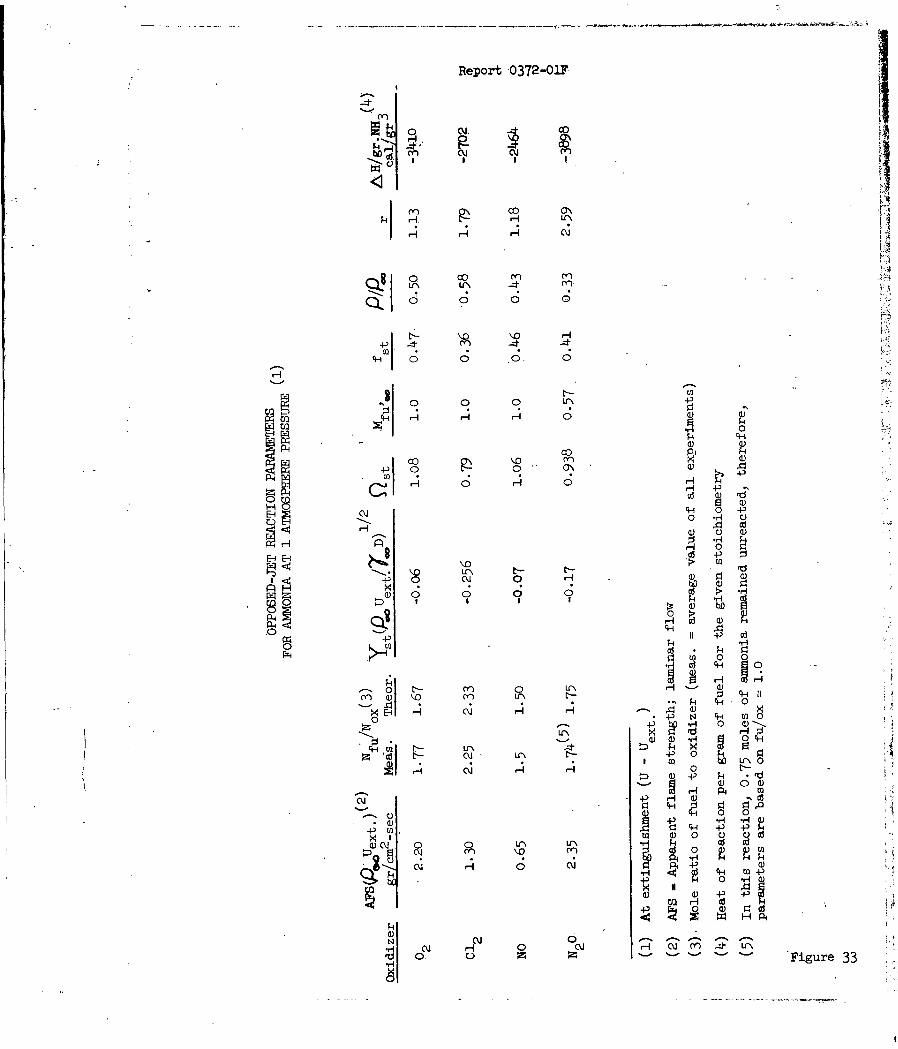
Report 0372-01F
JDCt
a, 4
bo 0
4-4 0 0 0 0r --
.,i 0
'-40 - 4 - )00
N04-ri0 a )
\l -r C
01) 0 0 0 0w~ -
80
rTg 0 0
0 0-'-0
0)) CH 0C
4 0a) -
U-\-id) V) 0 C H )
C~~j v-10);Lbf Ul
r-4-4 ri
000
m' a) 0' C')' C3
H~~C 00 4D CC1 -
00 H a) igre3

Report 0372-01F
H Hn
0H H
00
El P 0
1 ca
0 (r I
Ccx P4 C
C. H xiEj 0p 0 a
H- H-U
0010 C.)
0 0F- C 4)r HH4 -pH
00
NI a)j0~ r- N~
a) 0
Fiur 3

Report 0372-O1F
APPENDIX A
SURFACE RATE PROCESSES AND SENSITIVITY
'OF HIGH EXPLOSIVES*,
,R. F. Chaiken** and F. J. Cheselske***
(Submitted for Publication in the Journal of Chemical Physics)
Solid Propellant Research Operations
Aerojet-General Corporation
Azusa, California
*This work was supported by the Advanced Research Projects Agency under
Contracts NOnr 2804(00) monitored by the Office of Naval Research, and..Contract AF 49(638)-851 monitored by the Air Force Office of Scientific Research
**Technical. Consultant to Aerojet-General Corporation
***Research Chemist, Combustion Section, Advanced Propellants Department.
Report 0372-OIF
APP M A
I. INTRODUCTION
In previous papers from these laboratories, 1 ' 2 it ws shown that
1. W. H. Andersen and R. F. Chaiken, ARS Journal, 22, 49 (1959).
2. W. H. Andersen and R. F. Chaiken, ARS Journal, 31, 1379 (1961).
kinetic data for the surface gasification (pyrolysis) of amionium nitrate
and perchlorate could be used in conjunction with the Byring Grain Burning
Theory3 to describe the chemical rate processes occurring during detonation
3. H. Eyring, R. E. Powell, G. H. Duffey and R. B. Parlin,Chem, Rev., t 69 (1949).
of these low-energy explosives. The linear rates of surface gasification,
which were determined as a function of surface temperature by the hot-plate
linear pyrolysis technique, 4 ' 5 suggested the following overall reaction scheme
4. M. K. Barsh, W. H. Andersen, K. W. Bills, G. Moe and R. D. Schultz,Rev. Scient. Instr., 92, 392 (1958).
5. R. F. Chaiken and D. K. Van de Mark, Rev. Scient. Instr., LO, 375 (1959).
during grain burning:
1) 1014X (solid) surtface NH.2(gas) + HX(gs)' heat flux
2) NH3 (gas) + HX (gas) redox detonation products + heatfla--
These findings naturally led to the question of whether or not the
detonation of high-energy explosives could proceed by a similar reaction
Report 0372-01F
APPENDIX A
scheme, viz., endthermic surface evaporation followed by exothermic
gas-phase decomposition.
Toward this viewpoint, the hot-plate linear pyrolysis technique
was applied to the four common high explosives TNT, Tetryl, RDX and FSTN.
It was found that over the range of surface heating conditions imposed
(surface heat flux as high as 60 cal/cm2-sec), the surface rate process
consisted of melt-flow which proceeded at measured linear surface regression
rates as high as 0.2 cm/sec. During these experiments, hot-plate temperatures
as high as 5000C (well above the isothermal "explosion temperature" for these
materials) were recorded° Although the data are not compatible with grain
burning detonation rates, they do constitute a measure of the rate at which the
surface thermal energy was dissipated. This rate of energy dissipation at
the surface of an explosive granule is believed to be of considerable impor-
tance in determining the sensitivity of the explosive to initiation by external
stimuli (e.g., impact and friction)6 .
6. F. P. Bowden and A. D. Yoffe, Initiation and Growth of ExDlosives inLiquids and Solids, University Press, Canbridge- (1952).
II. EXPERIMENTAL
The explosives utilized in these studies were of standard military
type which were not given any further purification treatment. The explosive
in powder form (passed through a U. S. Standard No. 100 sieve) was pressed
under 30-40 thousand psi forming pressure into solid strands or pellets for
use with the hot-plate apparatus. For PETN and RDX, it was found
necessary to incorporate a small amount of binder (polystyrene or nitro-
-2-

Report 0372-01?
APPENDIX A
cellulose) into the powder in order to form high-density coherent strands.
Solid explosive strands having a density within 88% of crystal density were
obtained by these techniques. Figure 1 lists details of the strand character-
istics. --_......
Measurements of the linear rate of surface regression of the solid
strands under surface heating conditions were obtained with the use of the
hot-plate linear pyrolysis apparatus described in detail elsewhere.4,5
Briefly, surface heating is accomplished by pressing the end of a sample
strand upward against an electrically heated hot-plate. A small Pt
(Pt-lO% Rh) thermocouple junction, which is imbedded in the hot-plate and
positioned at the strand-hot-plate interface, enables the hot.-plate temperature
(Th) to 'be recorded, while the linear rate of regression of the strand surface
(B) is measured. For conditions of constant Th, a constant B is obtained.
Varying the electrical power expended in the hot-plate causes a variation
in Th and hence B.'
The rate data obtained in this fashion are shown in Figures 2-5
plotted as log (B/Th) vs. l/Th type rate curves. Interestingly, the apparent
constant slope of the curves at elevated temperature, corresponding to a
linear surface regression rate equation of the form
B = ATh exp(-E/RTh)cm/sec (1)
is reminiscent of what one might expect for a surface decomposition reaction
where Th = Ts, the strand surface temperature.1 ,2 ,7 However, in spite of
7. R. F. Chaiken, W. H. Andersen, M. K. Barsh, E. Mishuck, G. Moeand R. D. Schultz, J. Chem. Phys., 32, 141 (1960).
-3-I-i
Report 0372-01F
APPENDIX A
hot-plate temperatures which in some instances reached as high as 7700K,
only a slight amount of decomposition was observed in any experimental run.
The explosive strands, in each case, seemed to melt and flow away from the
strand-hot-plate interface.*
Inspection of the TNT and PETN data indicates that within the
experimental data scatter, change in environmental pressure from
-10 -3 to 1 atm has no discernible effect on the melt-flow surface rate.
Also, the fact that the surface regression rates for PETN appear to be
independent of the type of binder (unreactive polystyrene vs; reactive
nitrocellulose) would indicate that the 3% level of binder used in forming
the strands, does not influence the inherent surface rate process,
As an aid to interpreting the observed hot-plate surface rate process,
the slopes of ths straight lines drawn through the upper temperature regime
data points of Figures 2-5 were determined to yield "apparent activation
energies" and pre-exponential constants corresponding to values of E and A
in Equation (1). Surprisingly these values, which are listed in Figure 6, were
found to correspond to what might be expected as an energy barrier to a rate
process involving melting or Viscous flow. According to Eyring's Absolute
Rate Theory, the energy barrier to, melting and/or viscous flow should be of
the order of the heat of fusion.8 Unfortunately, data on the heat of fusion
8. S. Glasstone, K. J. Laidler and H. Eyring, Theory of RateProcesses, McGraw-Hill, New York (1941) Ch. 9.
and viscosity coefficient for the explosives of interest are too limited for an
* In the case of TNT, the melt-flow process was verified by high-speed
motion pictures of a vacuum run, and recovery of the melt.
-4,-
Report 0372-01F
APIENDIX A
exact comparison of the results at this time. However, similar melt-flow
rate data on benzoic acid, obtained in these laboratories with both the
hot-plate and Ostwald viscosimeter techniques (see Figures 7, 8) do allow
a precise comparison of results. As seen from Figure 6, the apparent
activation energy of 4.1 kcal/mole for the hot-plate surface rate data com-
pares quite favorably with the heat of fusion (4.14 kcal/mole) -, and the
"activation energy" for the temperature variation of viscosity (4.12 kcal/mole).
These correlations are undoubtedly more than fortuitous, thus
suggesting that some rate controlling kinetic process related to the explosive
itself is occurring at the strand hot-plate interface. If this were so, then
Equation (1) can be treated as a surface boundary condition for dissipation of
6energy under similar surface heat-flux conditions. Bowden, in his hot-spot
treatment of impact and friction initiation of granular explosives, has already
suggested that intergrannular friction accompanied by melting at the surfaces
of the granules could control hot-spot temperatures, and hence, sensitivity
to initiation.
This point as well as an anlysis of the kinetic processes which are
believed to occur is discussed in the following sections.
III. THEORETICAL
A. Analysis of the Hot-Plate Experiment
A proper treatment of the detailed surface rate processes
occurring in the hot-plate heating experiment requires consideration of the
energy and mass transport in the melt layer separating the hot-boundary,
(represented by the hot-plate) and the cold boundary (represented by the
strand surface). Solutions to the conservation equations representing such
flow phenomena are generally a formidable task requiring numerical methods;
-5-
Report 0372-01F
APPENDIX A
however, the simple geometry and steady-state nature of the hot-plate
experiment allows for simplifications which, render the problem tenable.
Cantrell 9 has demonstrated this for the case of a solid evaporating at a
9. R. H. Cantrell, AIAA Journal, I, 154 (1963).
hot-plate surface where the flow velocity in the gas-film layer is subsonic.
Solutions have also been presented1 0 for the same problem when supersonic
10. R. F. Chaiken, D. J. Sibbett, J. E. Sutherland, D. K. Van de Markand A. Wheeler, J. Chem. Phys., 37, 2311 (1962).
flow velocities occur in the gas-film layer.
For the melt-flow problem of interest here, flow velocities
are undoubtedly subsonic, hence an approach similar to Cantrell's should
be applicable.
The model of the hot-plate experiment considered is shown
in Figure 9, where cylindrical geometry with radial symmetry is assumed.
The mass balance at steady-state values of the surface
regression rate, B, is determined directly by equating the melt flux intro-
duced axially into the melt layer from the surface, to the melt flux passing
radially through the melt layer parallel to the strand surface, i.e.,
27rf Ps Brdr = 27f Pm urdz (2)
where P. and Pm are the densities of the solid and melt respectively;
r and z are the respective radial and axial distances in the melt layer;
-6-

Report 0372-017
APPENDIX A
u is the radial flow velocity of the melt, and 6is the thickness of the
melt layer.
For constant densities, B can be expressed an
2 PB = - J uds (3)rP5
Now u(r, z) can be readily obtained from the momentum con-
servation, where it is assumed that 1) the viscosity, ?, of the melt can be
treated as an averaged constant, and 2) the pressure gradient (AP) is zero
in the axial direction, i.e., P = P(r). Thus the conservation of momentum
is expressed by
(dP/dr) = 7(62 u/6z2), (4)
which can be solved for u under the viscous flow boundary conditions,
u = o at both the strand surface (z = o), and the hot-plate surface (z -6).Direct integration of Equation (4) gives
u = (z/2 N)(z -6)(dP/dr) (5)
Substitution of this expression for u into Equation (3) yields
the followipg expression for the radial pressure gradient.
(dP/dr) = -(6? PsBr)/(P 63) (6)
Taking the pressure at the outer edge of the strand (±.e., at
r = b) to be the ambient pressure Po, integration of Equation (6) defines the
pressure explicity in terms of r, i.e.,
P(r) - Po - 31? PA B(b2-r2)Pm 6(7)
-7-
Report 0372-O1F
APPEND 3X A
Now since the pressure in the melt layer arises from the strad
loading force W, P(r) - Po is related to W by the expression
27ff (P-Po)rdr (8)
This results in an equation for B in which only the melt layer thickness 6,
is unknown, i.e.,
B (2 Pw 6 3 7rN Pb4 ()
It now remains to determine 6 in terms of the temperaturegradient across the melt layer. It is interesting to note that for benzoic
acid at B 0.1 cm/sec, reasonable values of the other parameters of Equation (9)
give a value for 6 of-2 x 10- 3 cm, which is larger than the estimated
roughness of the hot-plate surface.
The steady-state energy balance at the strand surface can be
written as
As =%A(a T/a z)~ Z- =PB [ + Cs(Ts-T0) ](10)where qs is the heat flux/unit area at the strand surface; Lf is the latent
heat of fusion of the solid; Cs is the specific heat of the solid assumed
independent of temperature, ),is the heat conductivity of the melt layer
(assumed to be an averaged constant); Ts is the strand surface temperature
(assumed to be the melting point of the solid); and To is the ambient initial
temperature of the solid.
Assuming the temperature T, in the melt layer t6-be isothermal
in the radial direction, the stationary heat transport in the region o n z -- 6
is-described by
w(dT/dz) + K(d2T/dz2) = o ()
-8-

Report 0372-01F
APPENDIX A
where w is the axial component of the melt flow velocity, and K - A/ Pm Cm
is the thermal diffusivity of the melt (assumed to be an averaged constant).
For the conditions of interest here, it is reasonable to neglect
the convective term of Equation (U) so that d2T/dz2 - 0, which leads to the
temperature distribution
T = (Th-Ts)z/ 6 + Ts (12) A
This approximation can be justified by considering w to be
constant over much of the melt layer. For this condition, the temperature
distribution corresponding to Equation (11) is I
11. D. Rosenthal, Trans. Amer, Soc. Koch, Errs., 68, 849 (1946).
Th-T 1 wz 2- = exp (-wIK) -l1-- +2 (-T) - • . . .... (13)Th-T2
For the hot-plate conditions of interest, -1wz/K l so thatI z
second-order or higher terms in the expansion may be neglected.* Thus;
dT/dz is approximately constant which justifies the approximation leading to
Equation (12).
The melt layer thickness 6 can then be derived from Equations (10)
and (12) yielding
6_________ ) K (Th- T)B_ ____ + (To-T)1
A maximum value for Iwz/Kj would be -0.1 corresponding to w = PsB/Pm0.1 cm/sec, z-6vlO- 3 cm; K 10-3 cm /sec.
-9-

Report 0372-OIF
APFENDIX A
which when combined with Equation (9), gives the followLg expression for B.
PC LfC + T , T -)
where 0 - -i is the fluidity of the melt.
Now it should be recalled that in the derivation of Equation (15),
the transport coefficients K and 0, as well as the densities and specific heats,
were assumed to be constants'averaged over a given region in space While
. might be expected that the ratios )Q/ Ps and Cm/Cs are relatively
independent of Th, the variation of OK3 with Th should be considered in
determining B(Th). Over the region 0 - z - 6 , the average value of a
parameter is determined by the expression
f6 5F(z)dz
> (16)
or in terms of temperature (see Equation 12),
((Th> = 1 f T h F(T)dT (17)(Th-Ts) T_
where <F(Th)> is the average value of the function F of interest (i.e.,
0, K or 0K3).
From the Eyring"Absolute Rate Theory treatment of diffusion
and viscous flow as rate processes 8 , it can be expected that the energy barriers
for thermal conduction, self-diffusion and viscous flow should be very nearly
the same. This is reflected in the well known Einstein-diffusion equation, in
which the diffusion coefficient is directly proportional to the fluidity, and in
-10-

Report 0372-01F
APFENDIX A
the fact that the Lewis Number (ratio of diffusion coefficient to thermal
diffusivity) is approximately unity in many flow systems. Thus, in accordance
with the Eyring theory it should be possible to represent the temperature
variation of 0 and K as Arrhenius type functions, i.e.,
F(T) = Fo exp (-EF/RT) (18)*
where the activation energy EF is the same for thermal diffusivity and fluid
flow.
In this manner, Equation (17) for the average value of 0K3 (Th)
becomes3 Th
- exp (-E/RT)dT (19)(Th-Ts) Ts
where E = E + 3EK '"Ag.
While Equation (19) cannot be integrated directly, it can be
shown that the appearance of the exponential term in the integrand as a weight
factor will result in an average value of OK3 which lies closer to the value of
the function at Th than at T.. This is particularly true for values of E much
larger than RT. For purposes of obtaining a closed solution for the average
value 0K3 (Th), Equation (19) can be reasonably approximated by
O 3N. 00 K0 3 R <T"-2 rx(T h)= J exp (x) dx (20)
E (Th - Ts) x(T )
where <t> (Th + Ts)/2 and x (-E/RT).
The symbol F represents either 0 or K.
Report 0372-01!
APPENDIX A
Integration of Equation (20) yields
0 Ko3 R(Th+ Ts) 2
3(T)> (- + [ exp (-Z/RTh) - exp (-E/RT, )] (21)4 E(Th - To?
Replacing $K3 in Equation (15) by <K3' results in the final
expression for B(Th),
P(Th) A(T 2_T 2)1 [exp(-E/RTh - exp(-E/RT.) ] (22)
wh,. , . c _i _ ,, ,, C°,, ____o__o__ ___
h h)
3Tr Ps -Cs 16 b04 (Lf/c + T- TO)
It is interesting to note that when Th approaches Ts, B(Th)
rapidly approaches zero, but as Th increases above To,, the expression for
B(Th) approaches
B = A Th exp(-EO/RTh) (23)
in agreement with the empirical curve found for the high temperature regime
of the hot-plate data (Equation 1).
Using the parameter values listed in Figure 10, B(Th) was cal-
culated and compared with the experimental hot-plate data for benzoic acid.
As can be seen in Figure 7, the theoretical curve represents a reasonably
goot fit to the experimental data, thus indicating that the assumption of heat
transport and forced viscous flow of melt as the rate controlling process at
the strand-hot-plate interface is consistent with the experimental data.
B. Application to Explosive Sensitivity
The classical investigations of Bowden and his colleagues6 of
the impact and friction sensitivity of granular high explosives clearly
-12-

Report 0372-01F
APPENDIX A
demonstrate the possible role of melting as a mechanism of degrading the
kinetic energy of the external stimuli to heat. Their studies of the sensiti-
zation of explosives by high melting ( > 4000C) grit impurities showed that the
effectiveness of a grit impurity in promoting initiation increases directly with
its melting point. It was postulated that under the action of impact and friction,
hot-spots are induced within the explosive sample by intergranular rubbing.
Presumably, the highest temperature achieved by this mechanism of energy dissipation
is the melting temperature of the explosive and/or grit; hence, impurities having
melting points exceeding the hot-spot temperature necessary for growth of
explosion (e.g., 4OO-500°C for C-H-N-O explosives) will sensitize the explosive
to impact and friction initiation.
Unfortunately, this correlation of melting point with sensitivity
apparently fails when pure explosives are considered. This is readily seen
by comparing the melting point and impact sensitivity of PETN (m.p. = 142°C;
50% impact height ,- 15 cm) with that of RDX (m.p. = 2040C; 50% impact
height = 25 cm).12 Also, it is readily calculated that the rate of isothermal
12. A. D. Little Co., "Punch Card Recording of Data on Explosives,"Final Summary Report Contract DA 19-020-ORD-173 (March 31, 1954).
decomposition of typical high explosives at their melting point is far too slow
to account for a rapid initiation under impact (see Figure 11).
This lack of correlation led Bowden 6 and Cook 13 to suggest
13. M. A. Cook, The Science of High Explosives, Reinhold Publishing Corp.,New York (1958) p. 180.
-13-
Report 0372-01F
APPENDIX A
that in pure C-H-N-0 explosives, initiating hot-spots (400-500oc) arise from
adiabatic compression of vapor pockets rather than from intergranular rubbing.
However, it can be shown on the basis of the current hot-plate data on explo-
sives that melting with viscous flow can also result in initiating hot-spots.
It is assumed, along with Bowden, that in an impact or friction
sensitivity measurement, the kinetic energy of the external stimulus (e.g., &
falling weight) is converted to heat by the action of explosive particles being
pressed and rubbed against each other. It is further assumed that the initial
hot-spot temperature will depend upon the endothermic rate processes which
occur in the vicinity of the inter-particle contact surface. The analysis of
the hot-plate data in the previous section suggests that this type of surface
heat generation will result in melting at the particle surface with viscous flow
of heated melt in a thin layer separating the actual solid particle surfaces.
With this model it might be expected that the rate at which the particles can
melt will be given by Equation (1) or (22) where B is now the linear rate of
melting of the explosive granule, and Th the highest temperature in the melt.
Th can also be considered the induced hot-spot temperature.
The energy balance between the rate of energy delivered into
the explosive sample per unit of contact area, (.-, and the rate of energy
dissipated by melt flow at the -ontact surfaces is then simply
= P [. f + Cs(Th -To)
where T0 is the temperature of the explosive before impact, and where it is
assumed that the heat capacity of the explosive is independent of temperature
and phase. The hot-spot temperature, Th, can be related directly to 4in by
expressing B in terms of Equation (1) or (22).
-14-

Report 0372-01F
APPENDIX A
A plot of log 4 n vs Th for the four explosives studied is
shown in Figure 12.*. It is readily apparent that, at any given melt temperature
above 2500C, the order in which kinetic energy can be dissipated by melting
is given by TNT-TetryIu-RDX-PETN. Likewise, at any given energy input, Ithe induced hot-spot temperatures would be in the order PETN-RDX-TetrylI-TNT,
which is just the order of decreasing impact sensitivities of these explosives.
Hence, it is suggested that impact sensitivity should be correlated by
the rate at which kinetic energy of impact can be dissipated by endothermic
surface melting, and not by the melting temperature alone. This consideration
is certainly in keeping with the observed sensitivity data as well as with
a self-heating type of mechanism for the growth of exothermic reaction (in the
melt) to explosion.
It is interesting to note that below 2500C, the rate of surface
energy dissipation by PETN is greater than that of RDX. This would imply
that under conditions where hot-spot temperatures less than 250°C are re-
quired to cause initiation, RDX may be more sensitive than PETN. However,
under most conditions of impact measurements, minimum critical hot-spot
temperatures lie in the range of 400-5000C.
In the case of impact sensitivity measurements carried out
under standardized procedures it is even possible to use the hot plate data
In calculating Qin, the heat of fusion was taken as being equal to the apparentactivation energy for melt flow. The data of Figure 6 indicates that this isprobably a reasonable approximation.
A self heating type of growth mechanism leads to the conept of a critical
minimum hot-spot temperature required for initiation of the explosive.
-15-

Report 0372-01F
APPENDIX A
to estimate relative impact sensitivities. Under standard conditions it might
be reasonable to expect that 'will be directly proportional to the kinetic
energy of the falling hammer, with a proportionality constant which is the
same for the four C-H-N-0 explosives under consideration. Also, there isevidence6 ' 13 that the hot-spot' temperature required for initiation by impact
is approximately the same (400-5000C) for these high explosives. With these
conditions, the values of in should be in the same ratio as the values of theint
impact heights necessary to initiate the explosive. Figure 13 shows acor- m
parison of these ratios at Th = 400'C and T = 6000C. It is readily seen that Ij
there is reasonably good agreement between the calculated and experimental
ratios, and that the ratios are relatively independent of the choice of Th.
It is perhaps worthwhile to show that the absolute values of .4
Q.n (Th w 500°C) are of a reasonable order of magnitude on the basis of the
initiating kinetic energy of a falling weight. Most standard impact measure-
ments are made with a 2.5 kg hammer with a -35 mg sample of explosive.
It has been estimatedI 4 that the time duration of the kinetic energy of impact,
14. J. Wenograd, "Third ONR Symposium on Detonation," held at PrincetonUniversity September 1960; ONR Symposium Report ACR-52 Vol. I, p. 60.
is - 250 9 sec. Assuming spherical explosive granules of radius rp and a
circular contact area of radius rc, ain can be approximated by
in = o atc (kinetic energ of impact) --
(# of particles) x (contact area/particle) x (impact duration)
=in 3 /rc 2 cal/cm2-sec
where h, the impact height, rp and re are given in ca.

Report 0372-01F
APFM)x A
While the value of r is not known, it might be reasonable to
expect a value of 51L when rp -54 . Thus an impact height of 50 ca would
correspond to 6in -200 cal/cm-sec, which is within the range of values
expected from the hot-plate data.
-17-

Report 0372-01F
APPENDIX A
IV. SUMMARY
The nature and rate of linear surface regression of TNT, RDX, tetryl and
PETN has been studied utilizing a hot-plate pyrolysis technique over surface
temperatures ranging as high as 5000C. The data when compared to similar
data for benzoic acid suggests that the primary surface rate process appears
to be an endothermic melt-flow having an apparent activation energy sugges-
tive of heat-transfer and viscous flow as a rate controlling step.
These data, when used as a measure of surface heat dissipation, corre-
late very well with the measured values of impact sensitivity. Also, they
offer an explanation for the fact that attempts to correlate impact and/or
friction sensitivity with melting point alone could lead to misleading re-
sults when PETN and RDX are -considered.
-18-
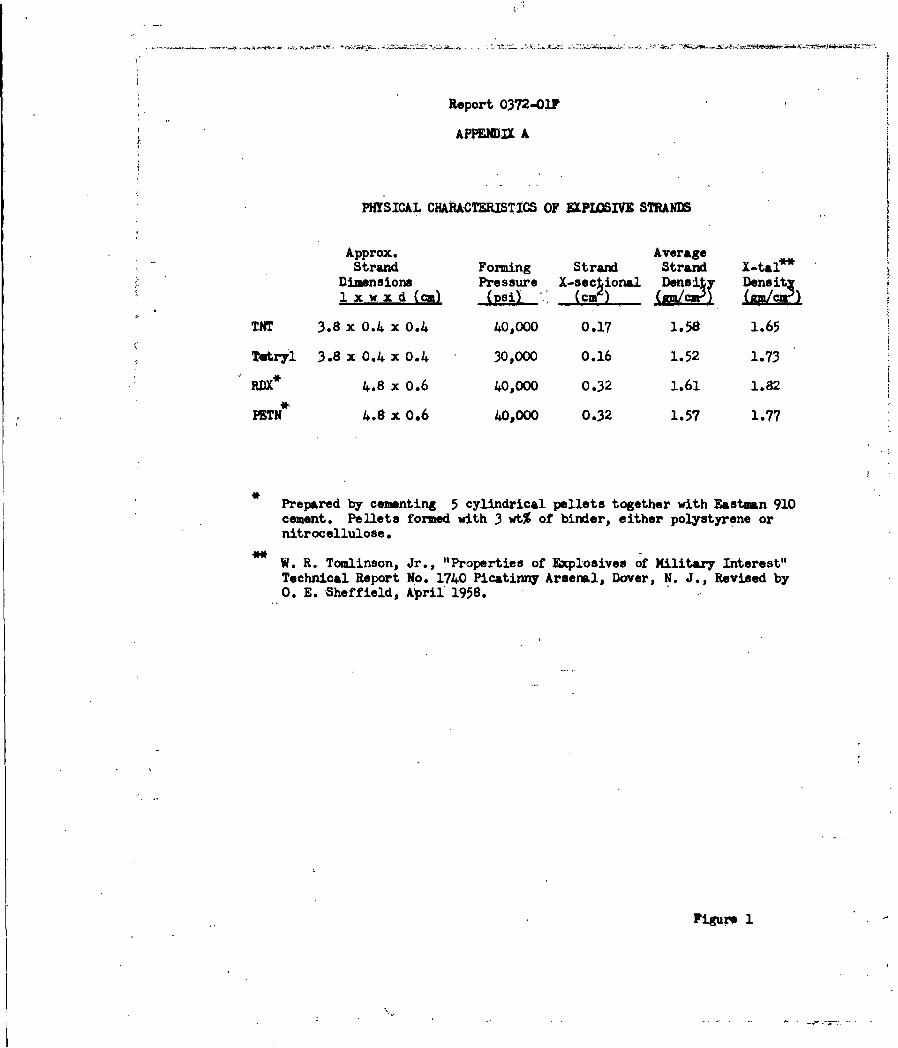
Report 0372-011
APPENDIX A
PHYSICAL CHARACTERISTICS OF EXPIBIVE STRANDS
Approx. AverageStrand Forming Strand Strand X-tal1
Dimensions Pressure X-secTional Density DensiS1 x ,w x d (ca) (psi ' a) cm ( m)w5
TNT 3.8 x 0.4 x 0.4 40,000 0.17 1.58 1.65
Utryl 3.8 x 0.4 x 0.4 30,000 o.16 1.52 1.73
RDX* 4.8 x 0.6 40,000 0.32 1.61 1.82
PETN 4.8 x 0.6 4O,0OO 0.32 1.57 1.77
Prepared by cementing 5 cylindrical pellets together with Eastman 910
cement. Pellets formed with 3 wt% of binder, either polystyrene ornitrocellulose.
W. R. Tomlinson, Jr., "Properties of Explosives of Military Interest"Technical Report No. 1740 Picatinny Arsenal, Dover, N. J., Revised by0. E. Sheffield, April 1958.
Figure 1

heport 0372-01FafM1P1NDI A
10* 3
RATE OF LINEAR SURFACE REGRESSIONOF ThT STRANDS IN NITROGEN
00
.0
o 0
,,.B e.T h 7.1 X 10, . 2 ox, .4900/RTI, ) "
0 o
0
STRAND LOADING FORCE -1860 GRAMS
C)- 760 mm.Nq PRESSURE
O"4.0 ,,mHg PRESSURE"
M.P. -80ec10" 1
1.6 1.8 2.0 2.2 2.4 2.6 zo 3.0RECIPROCAL TE MP ERATURE -)/T X 104,-(-K) "
Figure 2
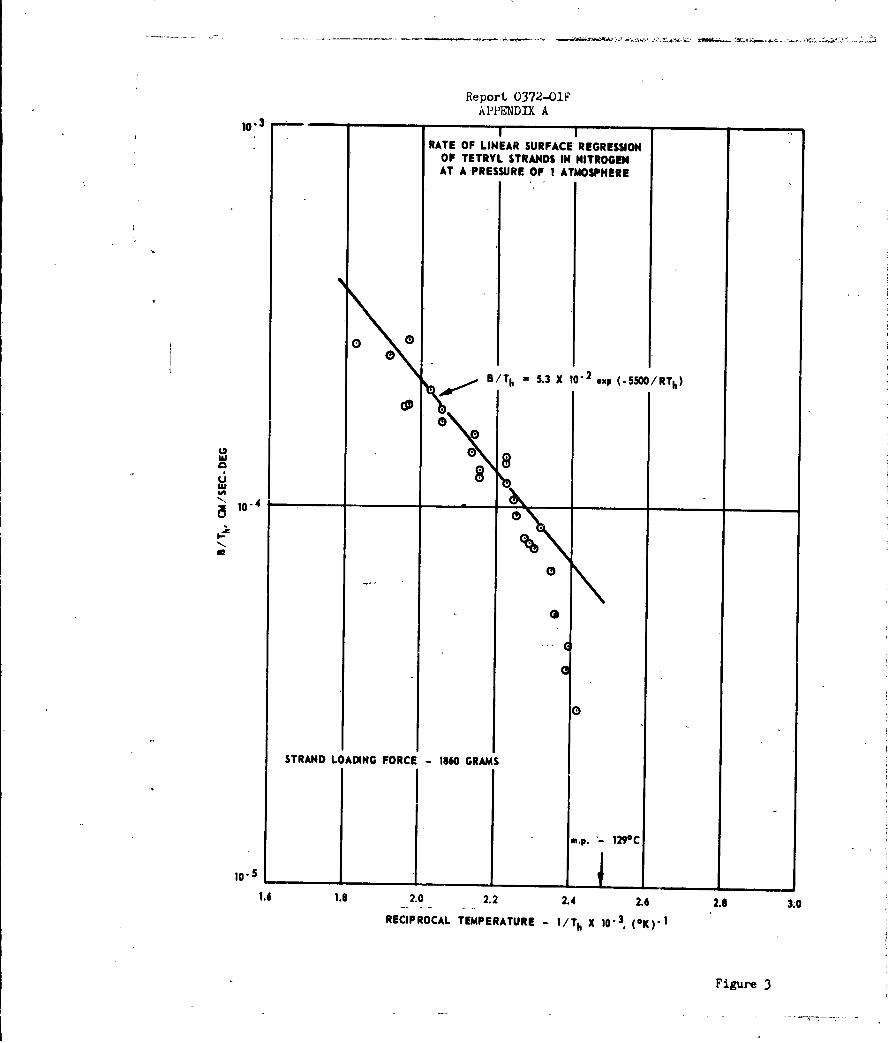
Report 0372-01FAPPENDIX A
1o" 3 - 1 "RATE OF LINEAR SURFACE REGRESSION
OF TETRYL STRANDS IN NITROGENAT A PRESSURE OF 1 ATMOSPHERE
0
1 j B/Th 5.3 X 10 2 exp (.5500/RTh)
Uus
10-4
N
STRAND LOADING FORCE - 1960 GRAMS
m.p. 129°C
1.6 1.8 2.0 2.2 2.4 2.6 2.8 3.0RECIPROCAL TEMPERATURE - 1 /Th X 10. 3 (0K)'!
Figure 3

R~eport 0372-01OFI AP1ISNLbrA A
RATE OF LINEAR SURFACE REGRESSION OF RDX STRANDSIN NITROGEN AT A PRESSURE OF I ATMOSPHERE
0
B/Th 1.4 X 10" 2 *xp (.5300/RTh)
00
00
00
STRAND LOADING FORCE -1660 GRAMS -
m.p. -2040(
1.4 ls
.2141.6 182.0 2.2 242.6
RECIPROCAL TEMPERATURE - /Th X 103(*K) 1
Filp re 4.

Report 0372-O1FAFPENDIX A
560C 4410C 352°C 2826C 227C 17?C 144C10-3
RATE OF LINEAR SURFACE REGRESION
OF PETN STRANDS IN NITROGEN
g EEB/Th 1.2 X 10 .3 ,xp (2700/RTh)
-u 0 0
0
-a-
STRAND LOADING FORCE - 1860 GRAMS
0-3% POLYSTYRENE BINDER0- 3% NITROCELLULOSE BINDER
SHADED POINTS: 2-4 mm Ng PRESSURE
OPEN POINTS: 760 mm Hg PRESSURE
m.p. - 142°C
1.2 1.4 1.6 1.8 2.0 2.2 2.4 2.6- RECIPROCAL TEMPERATURE - 1/Th X 10- 3, (OK)'
Figure 5
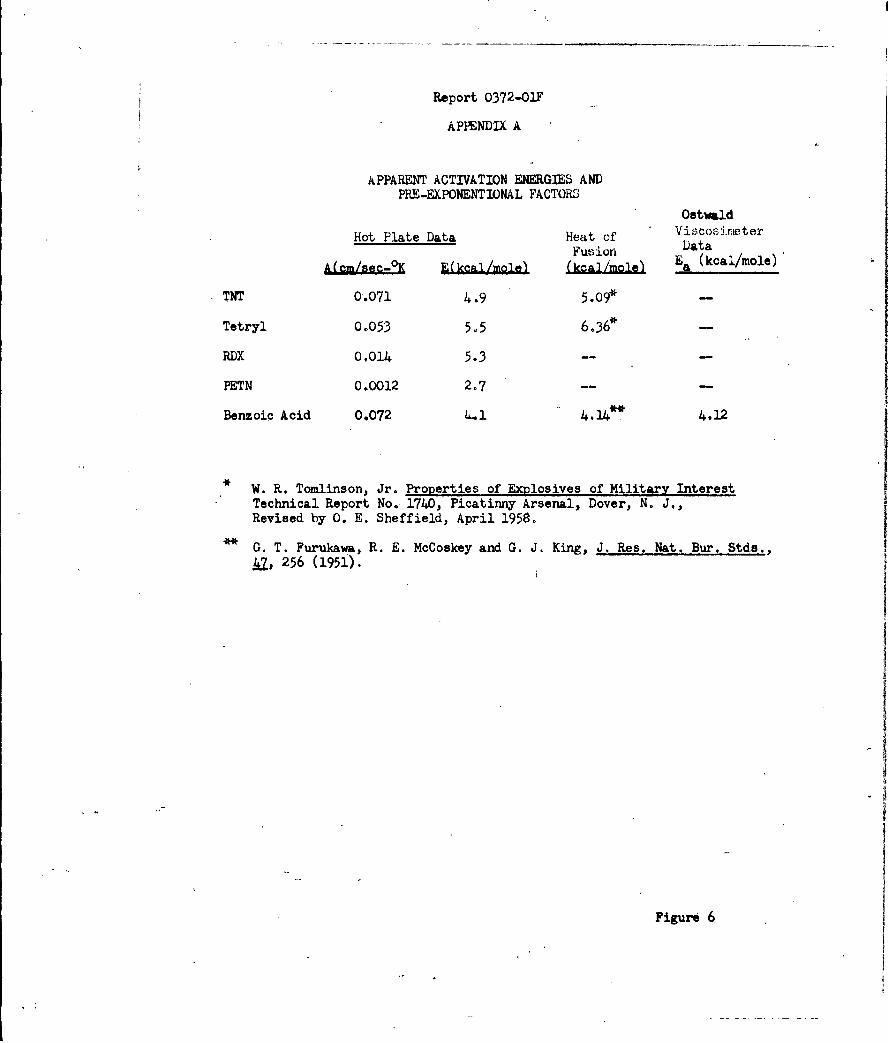
Report 0372-01F
APPENDIX A
APPARENT ACTIVATION ENERGIES AND
PRE-EXPONENTIONAL FACTORS
Ostwald
Hot Plate Data Heat of Vi\cosimeterFusion Data
Ea (kcal/mole)
TNT 0.071 4.9 5-09*
Tetryl 0.053 5, 5 6-36* --
RDX 0.014 5.3 --
PETN 0.0012 2.7 -- --
Benzoic Acid 0.072 4.1 4-14" 4.12
* W. R. Tomlinson, Jr. Properties of Explosives of Military InterestTechnical Report No. 1740, Picatinny Arsenal, Dover, N. J.,Revised by 0. E. Sheffield, April 1958.
G. T. Furukawa, R. E. McCoskey and G. J. King, J. Res. Nat. Bur. Stds.,
r256 (195i).
Figure 6

Ieport 0372-O1FAP DNDLX A
RATE OF LINEAR SURFACE REGRESSIONOF BENZOIC ACID IN NITROGEN
AT A PRESSURE OF I ATMOSPHERE10 "-3.. .... . .
0
0 B2/Th - 7.2 X 10- 3 ex (.4140/RTh)
-4
,, ,0 .%%0- 5
a .\
I
0
STRAND LOADING FORCE - 1860 GRAMS
EXPERIMENT (HIGH'TEMPERATURE REGIME)
THEORETICAL CURVE
10. 6 ap.- 12C
.0-6 111.4 1.6 1.8 2.0 2.2 2.4' 2.6 2.8
RECIPROCAL TEMPERATURE - 1/Th X 10 . , (°K)'l
Figure 7
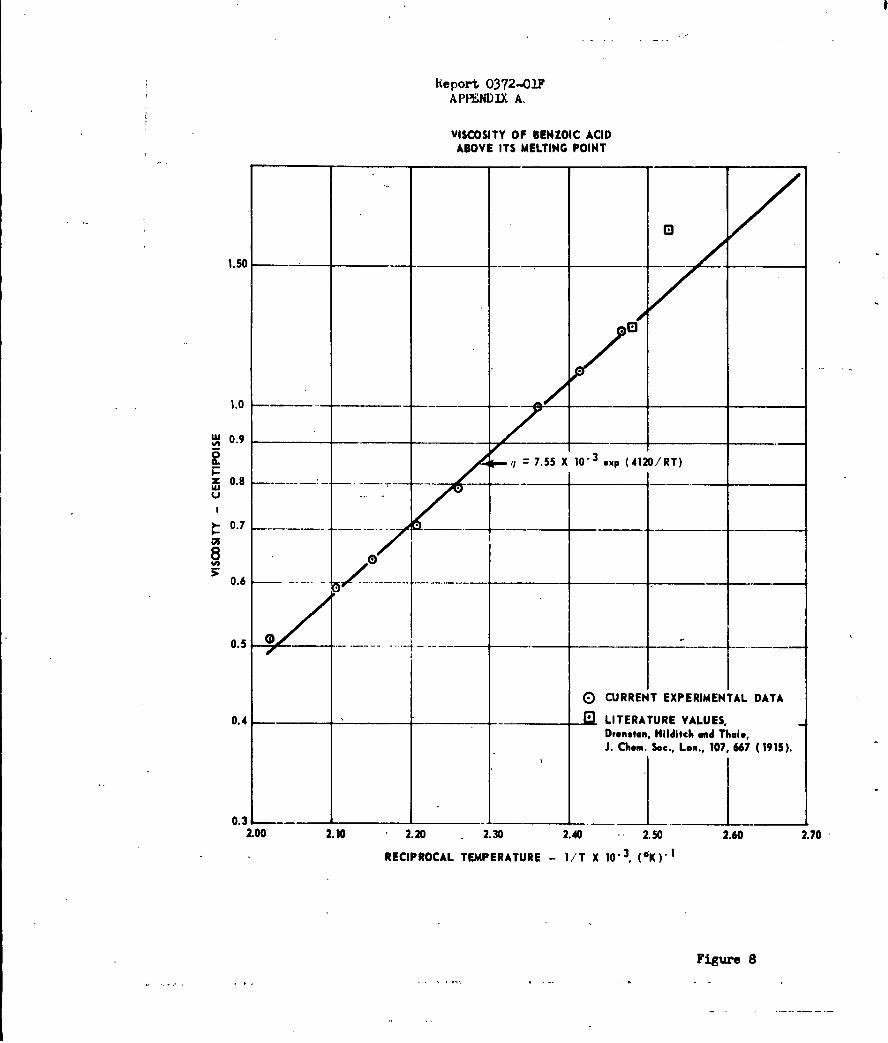
Report 0372-01F
APPENDIX A,
VISCOSITY OF BENZOIC ACIDABOVE ITS MELTING POINT
w1.50 -- __---- -x-,2 T
I- .0
A 0.9 _-_
q 7.55 X 10, 3 xp (4120/RT)z 0.8 - --.wU
0.7 ....... _ __ _ _
0.6
0.5 .
C) CURRENT EXPERIMENTAL DATA
0.4 -'1 LITERATURE VALUES,Drensten, Hilditch end Thule,J. Chem. Soc., Lon., 107, 667 (1915).
0.32.00 2.10 2.20 2.30 2.40 2.50 2.60 2.70
RECIPROCAL TEMPERATURE - I/T X 10- 3, (°K)'l
Figure 8

~Rport 0372-OIFAPPENDIX A
CYLINDRICAL GEOMETRY REPRESENTATIONOF NOT. PLATE -STRAND INTERFACE
WITH RADIAL SYMMETRY
///HOTLATI //
MELT"ALAYEffR r.x alt
jLOADING FORCED W
Figure 9

Report 0372-01F
APPEMDIX A
BENZOIC ACID PARAMeTERS FOR CALCUIATINT RETICAL SURFACE RGRESION RATE
Lf = 33.95 cal/gm Ko = 0.8 cm2/sec; corresponding to
R K0To) = a x 10-4 cm *
Ts = 395°K KT)ji ~8To = 39 0K = 1.32 x 10⁴ poise (cm-sec/gm)To 300°K
P = 0.95 gm/cm3 w = 18o ocm,,ec 2
P = 1.27 gm/cm3 b = 0.25 cm
00 = .4120 cal/mole
os =c 50 cal/gie
Estimated value.
Figure 10

Report 0372-OIF
APPENDIX A
ISOTHERMAL DECOMPOSITION RATES AND ADIABATIC EXPLOSIONTIMES OF HIGH EXPLOSIVES AT THEIR MELTING POINT
Melting kr t_____ ~E Point texp
Explosive log__Z (Kqal/mole) 'T. OK) s-c-1 sec
TNT(a) 12.2 4 43.4 353 2,5 x 10⁻¹⁵ 2,3 x 10¹²
TNT(b) 114 34.4 353 16 x l0-1 0 45 x 108
Tetryl(a) 129 34.9 402 10-6 8,9 x 10³
RDX(b) 15.5 41.0 477 6,3 x lo-4 18
RuX(c) 185 47o5 477 6.3 x i04- 16
PETN( a) 15.2 38.6 415 10- 880
PETN( d ) 23.1 52.3 415 4 x 10- 5 160
W Domposition Rate Constant, kr = z exp(-Za/RT).
Calculated with the heat capacity, C - 0.5 cal/gmdeg and heat ofdecomposition, Q = 500 cal/gm for all explosives; Adiabatic ExplosionTime, texp t CRT 2 m/QEaR
(a) M, A. Cook and M. T. Abegg, Ind.0Eng. Chem., _8-"1090 (1956).
(b) A. Jo B. Robertson, Trans. Faraday Soc., A, 977 (1948); 5, 85 (1949).
(c) E. Ko Rideal and A. J. B. Robertson, Proc. Roy, Soc, (London), A195,135 (1948).
(d) A. J. B,, Robertson, J,. Soc. Chem. Ind. (London), 61, 221 (1948).
Figure 11

Rleport 0372-01PAiPPaElUix A
Cie4
05
X LU
1.I.-
Z 0mag at
atw
U, anbd3 N O
Fiur 12.

Report 0372-017
APPENDIX A
COMPARISON OF RATE OF SURFACE HEATDISSIPATION AND IMPACT SENSITIVITY
Calculated Rates of
Surface Heat Dissipation (cal/cm2-sec) Imvact Sensitivity
Th = 673°K T_ = 83K 50%*
% Relative to i % Relative height % Relative
Explosive in TNT in to TNT (cm) to TNT
TNT 500 1.00 2600 1.00 ..170 1.00
Tetryl 210 0.42 1100 0.42 40 0.24
RDX 70 0.14 330 0.13 25 0.15
PETN 40 0.08 120 0.05 15 0.09
Values averaged from several sets of data listed in A. D. Little Co., "PunchCard Recording of Data on Explosives" Final Summary Report ContractDA-19-020-ORD-173 (March 31, 1954) for a 2.5 kg drop hammer on 35 mg ofexplosive.
Figure 13

Report 0372-01F
APPENDIX B
RATE OF SUBLIMATION OF AMMNIUM HALIDFS
By
R. F. Chaiken, D. J. Sibbett, J. E. Sutherland, P. K. Van de Mark,and A. Wheeler
(A portion of this Appendix -was published in the Journal of ChemicalPhysics, Vol. 37, 2311, 1962)
I. INTRODUCTION
A. GENERAL BACKGROUND
The sublimation of ammonium halides is of special interest
in studies of the mechanism of evaporation in that the surface gasification
process involves an endothermic dissociation reaction. Also, the measure-
ments of the rate of sublimation of ammonium chloride, by H. Spingler(l)
and R. D. Schultz and A. 0. Dekker(2), have indicated a rate constant which
is charaicterized by an Arrhenius activation energy considerably less than
the heat of vaporization, and a frequency factor corresponding to an
accommodation coefficient of -10-4 (as compared to 0.1 - 1.0 for many non-
dissociative molecular- evaporations) .*
H. Spingler(I ) employed M. Volmer's(3) concept of step-wise
evaporation, and suggested that the rate-controlling step in the gasification
process involves the transfer of a molecule from one surface site to another
The accommodation coefficient for evaporation refers to the constantwhich appears in the Knudson-Hertz evaporation rate equation. It shouldbe noted that the physical significance of this coefficient is question-able when applied to substances which dissociate upon evaporation.
-i-

Report 0372-OF
APFENDIX B
having less bonding energy, 0. Knacke, I. N. Stranski, and G. Wolff(4)
elaborated on this mechanism in further -detil. In essence, the reaction
steps can be depicted as
NH4+C17(1/2c) 1 N23 H3(a) + HCl(a) (1)
NH3(g) + HCl(g)
where (1/2c) refers to a half-crystal site on the surface (a) to a surface
adsorbed site, and (g) to the gas phase.*
The relatively small experimental activation energy (13.5 kcal/
mole)(l) led Knacke et al. to consider reaction step (1) as rate controlling.
The small value of the accommodation coefficient is then related to the
relatively small concentration of half-crystal surface sites.
0. Knacke and I. N. Stranski( 5) regard the rate of dissociation
of ammonium chloride as a "direct proof of Volmer's theory of stepwise evaporation."
The above statement is interesting, since R. D. Schultz and
A. 0. Dekker(2,6), who utilized a novel experimental technique (the hot-plate
linear pyrolysis technique) to verify Spingler.'s data, suggested that desorption
(step 3 in equation (1)) is the rate-determining step. This assumption implies
that the crystal surface is fully covered with an adsorbed layer of (NH3 .. .HCl).
By application of transition-state theory to this model, they were able, to derive
a rate constant in agreement with experiment.
The half-crystal site- (Halbkristallage) is taken as that surface site wherethe coordination number is one half that for the crystal interior. As such,it is considered that the energy to remove a molecule from that site to thegas phase is exactly the heat of vaporization. An important feature of thehalf-crystal site is that it is the edge of a surface step, and hence regenerat-ing (i.e., the removal of a molecule from the site forms another filled half-crystal site).
-2-

Report 0372-01
APPENDIX B
B. PURPOSE OF PRESENT STUDIES
In view of the conflicting concepts concerning the details of the
sublimation mechanism, it was thought that data on the sublimation of the other
ammonium halides, (viz., NH4F, NH4Br, and NH4I) might shed further light on the
subject. It is the primary purpose of this paper to describe these rate measure-
meats.
II. EXPERIMENTAL
A. TECHNIQUES
The direct measurement of the sublimation rate as a function of
surface temperature is complicated by the fact that considerable surface cooling
of the solid can occur during the reaction, and that the reacting surface is
continually regressing. Thus, it becomes somewhat difficult to obtain an accurate
temperature and area measurement of the reacting surface. In fact, it is probably
these difficulties which prompted R. Littlewood and E. Rideal(7) to make the
comment that experimental values of the evaporation coefficient for materials
evaporating under vacuum are determined primarily by heat-transfer conditions,
and not by other considerations.
In the present vacuum sublimation-rate studies, two separate and
independent techniques were employed: (a) a hot-plate linear pyrolysis technique
which wap initially developed by R. D. Schultz and A. 0. Dekker(2), and (b) a
conventional continuous weight-loss measurements under isothermal-vacuum heating
conditions.* In the use of both techniques, careful consideration was given to
the measurement of the true reaction temperature.
* H. Spingler's (l) studies were also carried out under isothermal-vacuum heating
conditions; however, his rate determinations were based upon an average time-lapsed weight loss.
-3-
Report 0372-01F
APPENDIX B
B. ISOTherMAL VACUUM STUDIES
A continuous weighing method using a quartz spring balance similar
to that described by L. L. Bircumshaw and T. R. Phillfps( 8 ) was employed in these
studies.
The ammonium halides were of analytical reagent grade obtained from
the Baker and Adamson Chemical Company. The chloride was further purified by
three recrystallizatiQns from distilled water before use, while the bromide,
fluoride, and iodide were used without further purification. All the materials
were dried and stored in vacuum over P2 0 5 at all stages of sample preparation.
To prepare sublimation samples, the coarse halide crystals were ground in a ball
mill to a particle size which would pass through a 100-mesh (149,,") screen. The
dried powder was pressed with a conventional IR-spectrophotometer, KBr window
press for 10 min at 10,000 psi into disk-shaped tablets having the dimensions of
-1 x 12.7 mm, and weighing -0.2 g. The tablet .?:,e quite uniform, and appeared
hard and translucent, with no apparent (macro) surface irregularities. Measure-
ments of the tablets' dimensions with a precision micrometer were used to make
density calculations. These calculations indicated densities of 0.97, 1.48,
2.36, and 2.47 g/cm3 for the fluoride, chloride, bromide, and iodide respectively.
Except for the fluoride, whose crystal density is reported as 1.315(9), these
values are only 2 - 3% below the accepted crystal density values.
The sublimation experiments were carried out in the apparatus
illustrated in Figure 1. The apparatus consisted of a quartz helical-spring
balance (20 cm long, with a sensitivity of 9.9 mg per mm spring displacement)
suspended in an evacuated glass chamber (balance case). The entire lower section
of the balance case could be set into an electrically heated vertical combustion
furnace. The sample tablet was placed edge up in the small glass bucket attached
-4'

Report 0372-01F
APPENDIX B
to the spring in a manner such that a minimum of sample area was in contact with
the glass. A thermocouple well allowed a thermocouple Junction (Pt - Pt, 10% Rh)
to be placed within 1 cm of the sample. This allowed the balance case temperature
to be determined as a function of time. The pressure was maintained at -10-6
mm Hg during an experiment.
In practice, the furnace was first preheated to the desired tempera-
ture and then raised into position around the lower end of the balance case in
which the tablet was suspended. Subsequent vaporization in the temperature
controlled (+ 10C) vacuum chamber was followed by observing the spring contraction
with an optical reader. The position of a reference fiber attached to the spring
suspension could be read to + 0.04 mm, leading to weight-loss measurements which
were accurate to ± 0.5 ng. Typical weight loss vs time curves which were obtained
by this method are shown in Figure 2.
In determing the sublimation temperature, careful consideration
was given to the surface cooling effect mentioned previously. In separate
experiments, the actual surface temperature was measured as a function of balance-
case temperature by comparing the EMF of a thermocouple junction in direct contact
with the subliming surface to the reading from the balance case thermocouple.
The measured temperature differences served as empirical correction factors (see
Figure 3) to account for the effect of surface cooling. (When a non-volatilesample, such as NaC1 or NaNO3 was heated, the two temperature readings agreed to
+ 10C.) It was interesting to observe that for NH4F, the surface cooling amounted
to as much as 700C at a balance-case temperature of only 1500C.
C. HOT-PLATE STUDIES
In these studies. direct measurements of the linear rate of surface
sublimation of rectangular strands of pressed ammonium halides were obtained by
-5-

Report 0372-01F
APIENDIX B
means of the method known as the hot-plate technique(2).
The sample strands, measuring 0.5 x -1.0 x 7.5 cm, were prepared by
pressing the powdered halides in a special strand mold. The materials used were
the same as those employed in the isothermal studies, except for the mesh size
of the NH4F, which was 35 mesh (420pt).
The strand formation conditios were 20,000 psi, with a 5-min dwell
time. It was found that heating the die to e-1500C during the pressing operation
was beneficial in obtaining almost uniformly translucent strands; however, the
method was only applied to the chloride and bromide. The other two halides were
pressed cold in order to minimize the possible formation of ammonium hydrogen
fluoride and iodine. Solid-strand densities similar to those listed for the
disk-shaped tablets were obtained by this technique.
The hot-plate apparatus employed in the present studies was an
improved version of the early apparatus employed by R. D. Schultz and A. 0.
Dekker.(2) The details of this improved apparatus are published elsewhere.(lO I I)
Briefly, the surface evaporation is accomplished by pressing the end of a sample
against an electrically heated hot plate. A small Pt - Pt, 10% Rh thermocouple
junction, which is imbedded in the hot plate and positioned at the strand-hot
plate interface, enables the surface temperature to be recorded while the linear
rate of regression of the strand surface is measured. The steady-state surface
temperature (and hence the linear sublimation rate) is changed by varying the
electrical power expended in the hot plate.
Figures 4 and 5 show the data points for the linear sublimation rate
of NH4Cl obtained at different environmental pressures and with different loading
pressures (i.e., the force/unit strand area with which the strand is pressed
against the hot plate). It is noteworthy that the Arrhenius-rate plot of the
-6-

Report 0372-OF.
APPENDIX B
vacuum data is linear over a 2500C range of surface temperature, corresponding
to sublimation rates which differ by more than a factor of 100. Also, the hot-
plate data are in good agreement with the linear surface regression rates obtained
from Spingler's data. The significance of the data points which lie below the
straight-line curves of Figures 4 and 5 will be discussed in the next section.
The vacuum hot-plate data for all the halides are showin in Figure 6. The idealized
strand-hot-plate interface for mass transfer analysis is shown in Figure 7.
III. RESULTS
A. ISOTHERMAL VACUUM STUDIES
The problem of determining the rate constant from the experimental
weight loss vs time data was apparently greatly simplified by the use of the thin
disk-shaped samples, which had a relatively large and well-defined surface-to-
volume ratio. As would be expected for a zero-order reaction (i.e... surface
reaction with a constant reaction area), the rate of weight loss was essentially
constant over a major portion of the reaction (see Figure 2). Since the surface
roughness factor was not known, it was assumed that the sublimation rate per
unit of area would be determined by the initial geometric sample area, and the
slope of the straight-line portion of the weight loss vs time curves. As will
be described later, the assumption of unity for the surface roughness factor
gives good agreement between the hot plate and isothermal data.
The lower portion of Figure 6 shows a compilation of the rate data
obtained in this manner. For convenience, the data have been converted from a
2mass rate (i.e., mg/cm -min) to a linear rate (i.e., cm/sec) by dividing by the
crystal density and other suitable numerical factors.
B. HOT-PIATE STUDIES
The rate measurements made with the hot-plate technique yield directly
-7-

Report 0372-01F
APPENDIX B
the linear sublimation rate, and hence do not require further analysis to determine
the reaction area. However, a major assumption in the use of the technique is
the identification of the reaction-surface temperature with the hot-plate tempera-
ture. It is actually the latter temperature which is measured by the imbedded
thermocouple. The assumption implies that the temperature drop across the thin
layer of gas separating the strand surface from the hot plate is negligible,
which might not be the case.
Evidence for the validity of this assumption lies in the fact that
there is a range of vaporization rates where the measured surface temperature
is independent of the force used to press the strand against the hot plate
(see Figure 5). However, as the gasification rate increases, the thickness of
the separation layer must increase in order to maintain steady-state flow
conditions. Hence, there will be a vaporization rate above which there will be
a significant temperature gradient between the hot plate and the gasifying sur-
face. At this point, the apparent surface temperatures would be fictitiously
high, and, in terms of the Arrhenius rate plot of Figure 5, will result in a
downward displacement of the data points from a linear curve.
In order to estimate the value of the temperature drop across the
interface more quantitatively, an approximation analysis of the heat and mass
transfer at the interface was carried out. The details of this analysis are
presented in Appendix B-2. It was shown that a temperature difference could be
expected to occur within the range of experimental conditions, and that it would
vary inversely with the first power of the loading pressure, and difectly with
the square of the linear regression rate. Thus, one might expect an apparent
rate threshold above which the basic assumption concerning the surface temperature
measurement would mot be-valid. As can be seen by comparing the high temperature
-8-

Report 0372-O1F
APPENDMI B
data points of Figure 5 to the calculated curves (calculated by equation 14k in
Appendix B-2), a threshold point does occur at -0.01 cm/sec. Unfortunately,
it is believed that the calculated temperature errors are insufficiently certain
to warrant their use as correction factors in a manner analogous to the tempera-
ture corrections employed in the isothermal vacuum studies.
With regard to the effect of environmental pressure on the rate of
sublimation, it is apparent from the data of Figure 4 that increasing pressure
causes an apparent decrease in the linear sublimation rate-atthe lower range of
surface temperatures, and that the effect becomes more pronounced as the tempera-
ture is decreased.
This environmental pressure effect can be readily understood from con-
sideration of the reverse condensation reaction (see Equation 1). Under environ-
mental pressures which approach the vapor pressure of the NH3 and ICl in the
interfacial layer, the gas flow from the layer becomes diffusion limited rather
than sound-velocity limited (see Appendix B4. This results in an increased A
residence time for the vapor in close vicinity to the solid surface, thereby
enchancing the back condensation reaction. It is this increased condensation
which results in measured linear sublimation rates which are less than the vacuum
rates.
It can therefore be expected that the measurement of accurate vacuum
sublimation rates with the hot-plate technique is limited to surface temperature
conditions where the equilibrium vapor pressure is at least twice that of the
environmental pressure. For the ammonium halide system and the vacuum conditions
employed here (i.e., 1 - 2 mm Hg), this lower limit of surface temperature
corresponds to a linear velocity of regression equal to about 10-4 cm/sec.
IV. DISCUSSION
The sublimation rate equation can be expressed as a linear surface
-9-

Report 0372-0OW
APPENDIX B
regression rate,2
B = A. exp(46RT,)cm/sec (2)
or its equivalent form
v = A5 ( P/M)exp(-E,/RTs)moles/cm2-sec, (3)
where .Pis the crystal density and M the molecular weight.
In Figure 6, the vacuum rate data from both experimental techniques
corresponding to Equation (2) have been combined for easy visual comparison.
The good agreement between the data of both experiments is quite apparent,
particularly when one recognizes the limitations of the techniques.
It is somewhat remarkable to observe from the linearity of the data
points, that the experimental data for each halide represent a change in the
reaction rate of a factor of about 104, and that a single reaction mechanism
appears to be operating over the entire range of temperature.
Figure 8 contains a list of physical constants and constants for the
sublimation rate equations as determined by combining both sets of experimental
data. Although a complete statistical analysis of variance has not been
carried out, it is estimated that the standard deviation of the values for
the activation energy Es, is less than + 2 kcal/mole.
It should be pointed out that the sublimation rate of NH4Cl, as
determined in the present studies, compares quite favorably with the measure-
ments of Spingler (i.e., As = 87 cm/sec; Es = 13.5 kcal/mole), and of
Schultz'and Dekker 2 (i.e., As = 300 cm/sec; E. - 11.2 kcal/mo3e*).
Reference is also made to the unpublished ammonium chloride hot-plate databy K. W. Bills, M. Therneau, E. Mishuck, and R. D. Schultz OSR-TN-55-117(1955) in which As = 120 cm/sec, and Es = 13.5 kcal/mole.
-10-
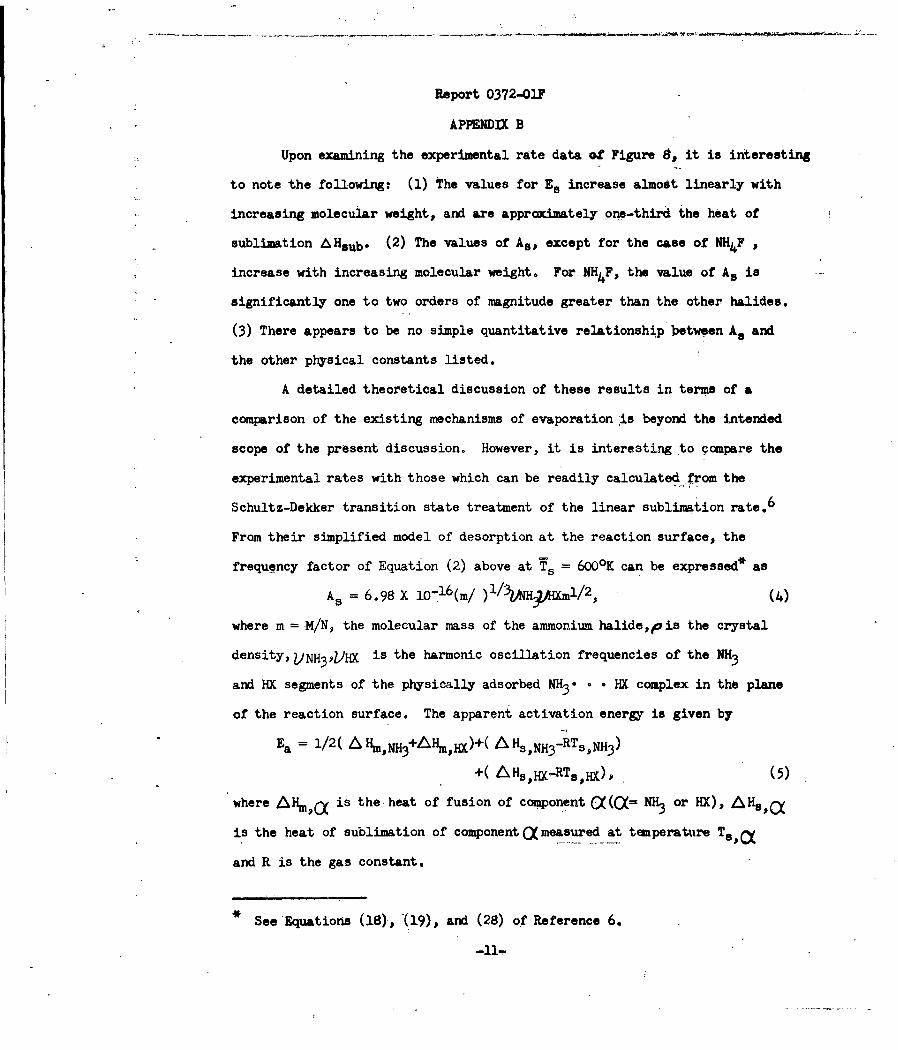
Report 0372-01F
APPENDIX B
Upon examining the experimental rate data of Figure 8, it is interesting
to note the following: (1) The values for E. increase almost linearly with
increasing molecular weight, and are approximately one-third the heat of
sublimation AHaub. (2) The values of As, except for the case of NH4F
increase with increasing molecular weight. For NH4F, the value of A8 is
significantly one to two orders of magnitude greater than the other halides.
(3) There appears to be no simple quantitative relationship between A. and
the other physical constants listed.
A detailed theoretical discussion of these results in terms of a
comparison of the existing mechanisms of evaporation is beyond the intended
scope of the present discussion. However, it is interesting to compare the
experimental rates with those which can be readily calculated from the
Schultz-Dekker transition state treatment of the linear sublimation rate.6
From their simplified model of desorption at the reaction surface, the
frequency factor of Equation (2) above at T. = 6000K can be expressed* asAs -- 6.98 X 1O-16(m/ )l/3&%Hpi~timl/2 , (4)
where m = M/N, the molecular mass of the ammonium halide,p is the crystal
density, )NH3 ,ZHX is the harmonic oscillation frequencies of the NH3
and HX segments of the physically adsorbed NH3 • . • HX complex in the plane
of the reaction surface. The apparent activation energy is given by
Ea = 1/2( A HmNH3 +AHmHX)+( A sH 3 -RTs,NH3 )
+( L HlsI -RTs, lHX)' (5)
where AHm,(x is the heat of fusion of component C((Q= NH3 or HX), AH,O
is the heat of sublimation of component 0( measured at temperature Ts,
and R is the gas constant.
See Equations (18), (19), and (28) of Reference 6.
-11i.
Report 0372-O1F
APPENDIX B
In Equation (5), Eq is taken as the sum of the energy barrier to
surface collisons between NH and HX (approximated by the first term),3and the energy required for desorption of NH3 and HX (approximated by the
second and third terms). Equation (4) corresponds to a relatively highly
localized activated complex which otherwise resembles the adscrbed initial
state molecular complex.
Schultz and Dekker6 obtained estimates of the harmonic vibration
freq4encies from the expression
M 1.025 x 10⁵ (0. 5 Hm.I(/MC Vi
M/Np
Thus, Equations (W)-(6) allow almost a completely a priori calculation of
sublimation rates.i
Utilizing thermodynamic data compiled by the U. S. Bureau of
Standards912 the rate constant parameters for all the ammonium halides were
calculated. Figure 9 shows a comparison between the calculated and experimental
results. It is readily apparent that the agreement between theory and
experiment is quite reasonable. As for the apparent discrepancy between the
measured and calculated trend in the variation of A. with molecular weight,
one might argue the significance of this point in view of the uncertain
nature of the kinetic rate determinations. However, it is perhaps worthwhile
to consider this discrepancy prior to forming ar conclusions as to the validity
of the Schultz-Dekker treatment.
-12-
Report 0372-017
APPENDIX B
1. H. Spingler, Z. physik. Chem.. 2_2, 90 (1942).
2. R. D. Schultz and A. 0. Dekker, Fifth Symposium (International) onCombustion, Reinhold Publishing Co., New York (1955) p. 260.
3. M. Volmer, "Kinetic der Phasenbildung", Dresden and Leipzig (1939).
4. 0. Knacke, I. N. Stranski, and G. Wolff, Z. phsik. Chem. !8, 157 (1951).
5. 0. Knacke and I. N. Stranski "The Mechanism of Evaporation", "Progress'in Metal Physics", Vol. VI, hergamon Press, N. Y. (1956) p. 181.
6. R. D. Schultz and A. 0. Dekker, J. Phys. Chem., 60, 1095 (1956).
7. R. Littlewood and E. Rideal, Trans. Faraday Soc., 52, 1598 (1956).
8. L. L. Bircumshaw and T. R. Phillips, J. Chem. Soc,, 4741 (957).
9. Handbook of Chemistry and Physics, 39th ed., Chemical Rubber PublishingCo., Cleveland (1958) p. 484.
10. M. K. Barsh, W. H. Andersen, K. W. Bills, Jr., G. Moe, and R. D. Schultz,
Rev. Sci. Instr. 29, 392 (1958).
11. R..F. Chaiken, and D. K. Van de Mark, Rev. Sci. Instr., 30, 375 (1959).
12. "Selected Values of Chemical Thermodynamic Properties", U. S. NationalBureau of Standards, Circ. 500, 1952.
13
-13-
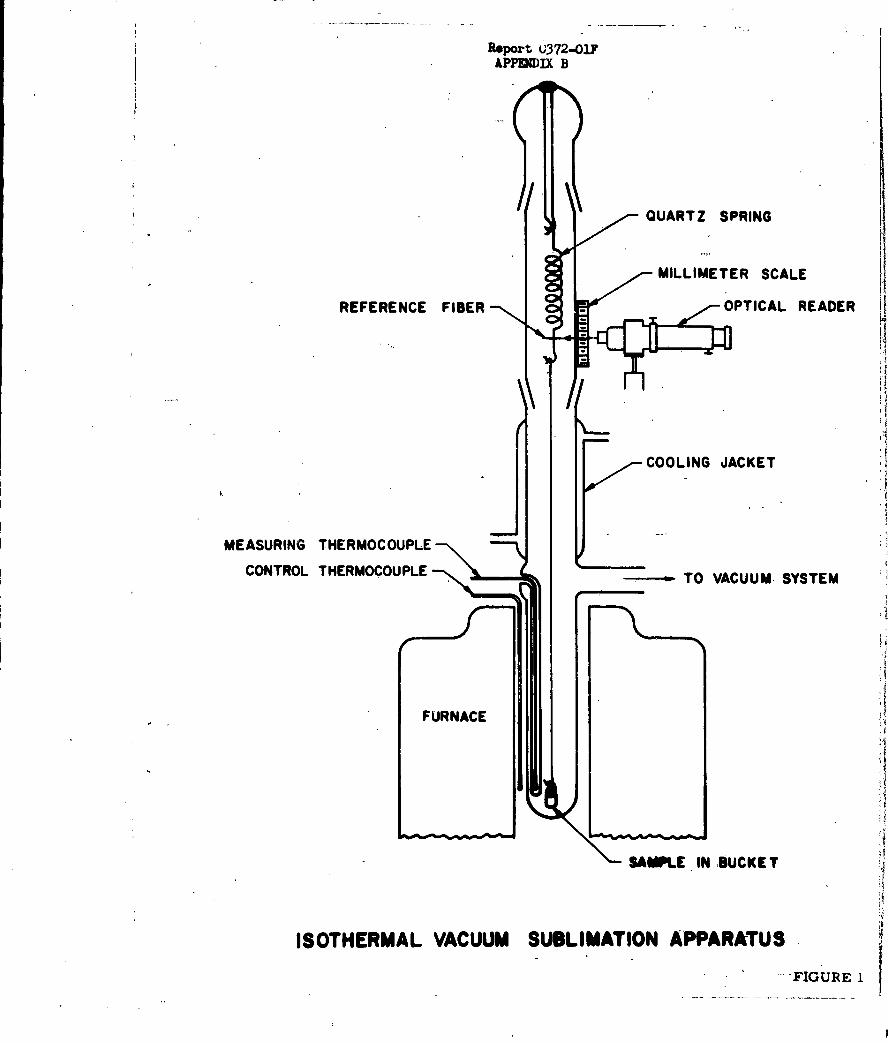
Report U372-01FAPPENDIX B
QUARTZ SPRING
MILLIMETER SCALE
REFERENCE FIBER OPTICAL READER
COOLING JACKET
MEASURING THERMOCOUPLE
CONTROL THERMOCOUPLE- __ TO VACUUM. SYSTEM
FURNACE
SAMPLE IN BUCKE T
ISOTHERMAL VACUUM SUBLIMATION APPARATUS-FIGURE 1

Report 0372-O1F
1.0 -APPENDIX B
00.9 - -0
0
0.800
A
0.7 60
IIJJ.5
U)
0
0 Q4 - - 0 - - - - - - - - -
O LNH 4 Cl
u. 0. 4 NH 4 Br0.3-- -- -,.- - NH 4 F
00
OjA
0 20 40 60 80 00 I0 140
TIME, min
SUBLIMATION OF AMMONIUM HALIDESTYPICAL WEIGHT LOSS VS TIME CURVE2
-FIGURE 2
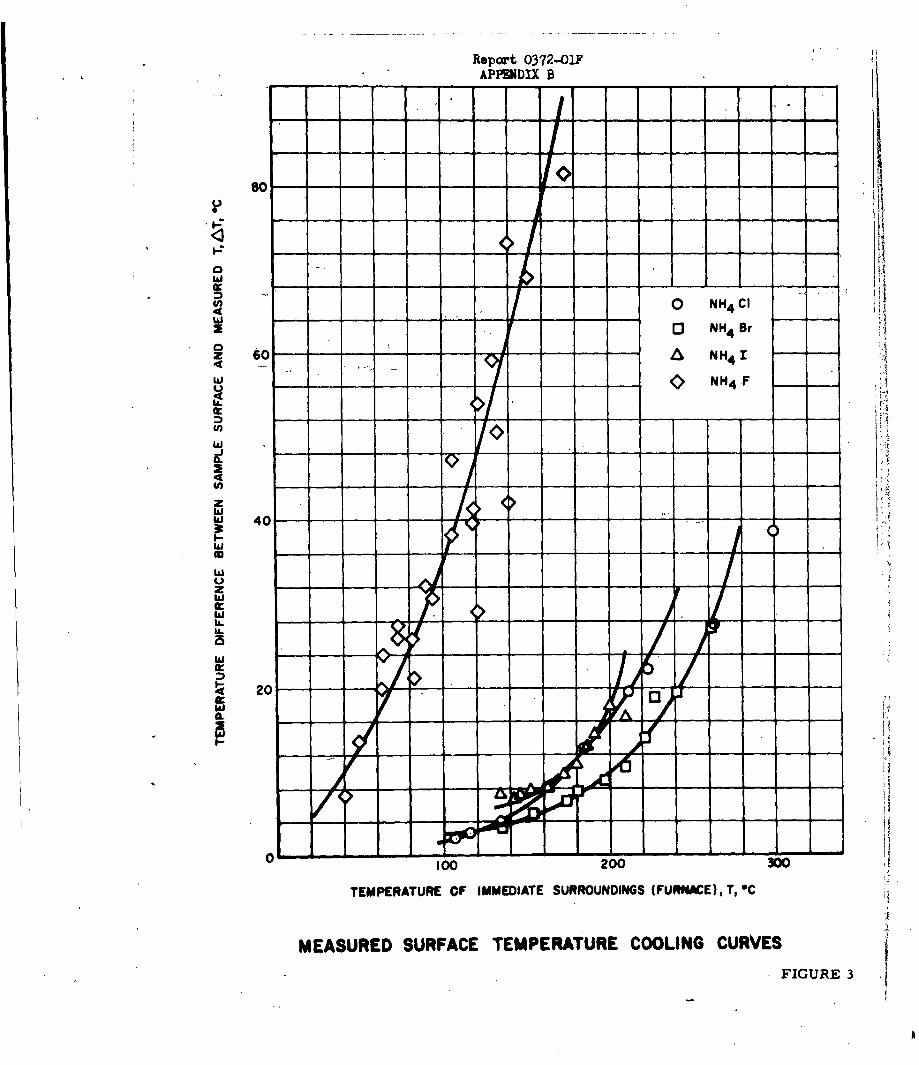
Report 0372-01APPEDIX B
so
4 0 NH 4 CI-3 NH 4 Br
04
z 60- NH 4 INH4 F
IlJ-o; '--'' N 4
4A
40
20
w
z LW -- -7 II - .--.. L
TEMPERATURE OF IMMEDIATE SURROUNDINGS (FUNWME), T, OC i
MEASURED SURFACE TEMPERATURE COOLING CURVES
FIGURE 3 '
Iii
Iii
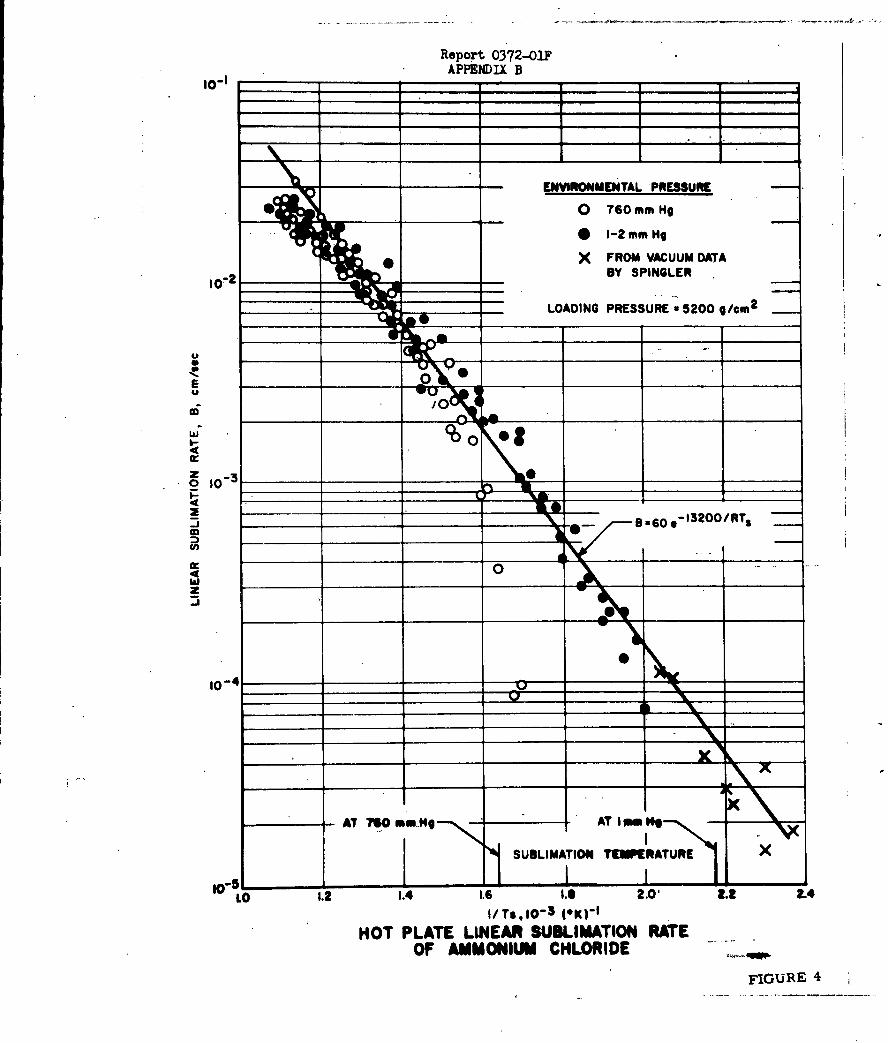
Report 0372-01FAPPENDIX B
- ENVONMMENTAL PRESSURE
0 760 mm Hg
i-2 mm Hg
* X FROM VACUUM DATA
IO2 BY SPINGLER
"- LOADING PRESSURE •5200 g/cm 2
UE
u
I- -4,v
w
10-4
•XX.
mN
AT ?60 mm-lg AT Iwo
SUBLIMATION TWIERATURE X
LO 1.2 1.4 1.6 1.8 2.0 2.2 2.4I/Ts, 10-3 (-$()I
HOT PLATE LINEAR SUBLIMATION RATEOF AMMONIUM CHLORIDE
FIGURE 4

Report 0327-01F_________APPENDIX B
W LADING PRESSUREs OD____
LOADING PRESSURE .2500 g/cm 2
LOADING PRESSURE 5WOg/cmn2
ENVIRONMENTAL PRESSURE1-2 mm Hg*
LOADING 'PRESSUREIj6,2 Ah0 5200 g/cm2
X FROM VACUUM DATA
--- CALCULATED CURVES 4
I-
010,
4 O 1.2___ 1.41._1_ _0_.22.
I/ s 10-3_____-
EFFECT OF LOADING PRESSURE 0ON THE HOT PLATELINEAR SUBLIMATION RATE OF AMMONIUM CHLORIDE
FIGURE 5

Report 0372-01FAPPENDIX B
o '-'I '*I ' 'I 'I'II'I' I'.I'~I'*I' I'
.w
JL ld4,
NHa 4,
0 .4,C
* 4,
.I 0 4
A NH4 1 * 0 t
OPEN POINTS: NOT PLATE DATAAMBIENT PrJMME: l-Imm NlINET L ODINS IFc:,et Pg , O
9NMD POINT: WTMom 4u DATA .A*il NT PWWWKRIfl: -w I10 fm He u -
Oil LO ItL 4 UI I1AI O U 1. 4 LS P U SAI 34nKCPWlCA. 011TlACIE 1TMRATru, I/lM 1 1 "Iq
LINE.AR RATE OF SUBLIMATION OF THE AMM011gUW HLII)ES
tFIGURE 6
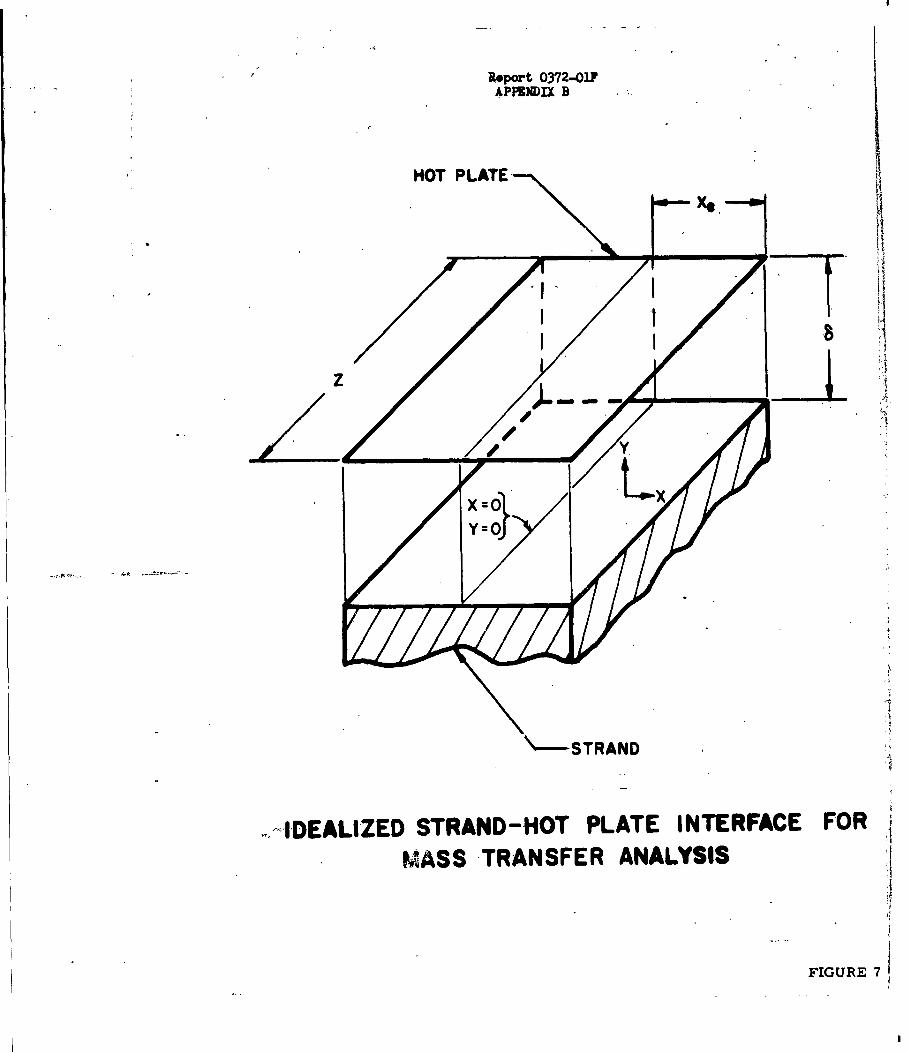
Report 0372-01FAPPENDIX B
HOT PLATE-I
ID0EALIZED STRAND-HOT PLATE INTERFACE FORMASS TRANSFER ANALYSIS
FIGURE 7
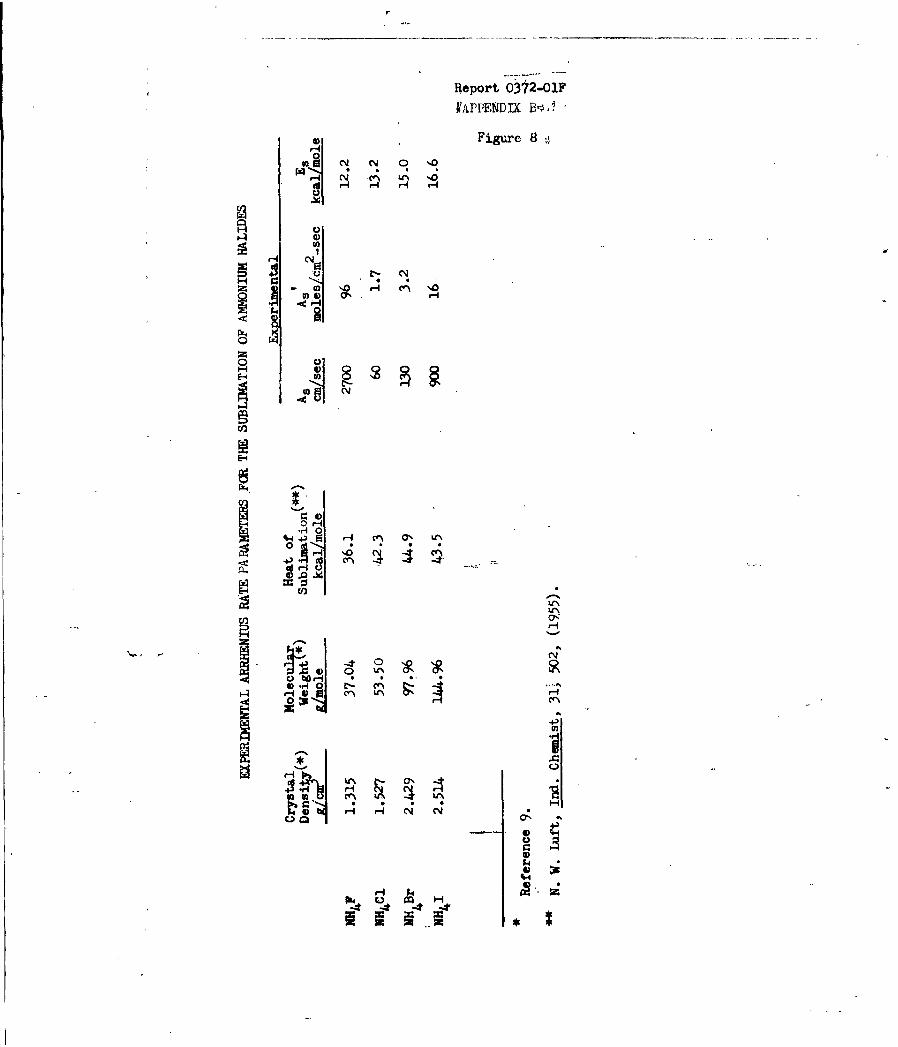
Report 0312-01F
1r5LP"END.tX B3,
Figure 8 .
N 0 0
H NOH
V- 0
H o
ORQ 0'
c--k.].10 r- 0 ~--
HVI, U' 0'. -4 H
00tA.)
-H .- C..
0~ H
04 -4c -4

Report 0372-01?
APPMDIX B
COMPARISON OF EXp&RIWNT WTTH THE SCHuLTz-D=K R THRUlY
Experimental Values Schultz-Dekker TheoZ
As Es As Es
cmmec kcal/mole cm/ses kcal mle
NHJF 2700 12.2 654 10.04
NH CI 60 13.2 362 12,35
NH4Br 130 15.0 312 12.82
NH4I 900 16.6 300 13.50
i
I.4

1 .... . . - - . . -- -- ° . . , ,, -
Report 0372-OIF
APPENDIX B-2
ANAIYSIS
Consider a strand of solid with a cross-sectional area of 2XeZ gasifytng
at the surface of a hot plate. Under steady-state conditions, a layer of gas
of constant thickness, 6 , separates the strand surface at temperature Ts, from
the hot plate at temperature Tp (see Figure 7). With respect to the actual
hot-plate pyrolysis experiment, it should be possible ot obtain reasonable
estimates of the temperature drop across 6 by considering a model of couette
type flow between parallel plates, and the following simplifying assumptions*:
1. The mass flow in the z-direction is negligible (this shcld be a
reasonable approximation, since in practice, Z-4Xe).
2. The flow velocity in the x-direction, u(x,y), is symmetrical about
y =6 /2 and x = 0, and is linearly dependent upon x and y, i.e.
u = 2 axy, for y <6/2 (1A)Xe
u = 2 ax ( - for y >6/2 (2A)
3. A sonic point existi at x = Xe, such that u(Xe, y) = a, which is
taken as constant. This assumption should be a reasonable approximation, since
the pressure, P, in the gas layer is generally greater than twice the environ-
mental pressure, Po.
4. The gas moving within the layer 6 expands isobarically along x,
* The tuthors are indebted to B. L. McFarland of Aerojet-General Corporation
for demonstrating the applicability of this approach.

Report 0372-01F
APPENDIX B-2
and isothermally along y; hence for an ideal gas
P(X,y) = RT y=R~y (3k)
wherep(x,y) is the gas density at point (x,y) within5; P(x) is the pressure
at a point x, and is. independent of y; and the gas temperature T(y) is uniform
along x, varying only in a direction normal to the surface.
5. The temperature varies linearly with y across 6, i.e. the energyconservation across planes parallel to the surface can be expressed as
T = Ts + Ey/6 (4A)
or
dT/dy = (Tp - Ts)/6= c16 (N)
6. Momentum changes in the gas layer are negligible.
Now the conservation of mass across any plane normal to the surface
is simply 60/2
ZpBx.Z Jpudy=2Z Pudy (6A)
From equatibns (3A) and (4A), we solve for u in terms of y, and
integrate (6A) to obtain
B '= R+ T5ln 1A)A - Rx eL2 T' + Ts
Since 2Ts/(Tp + TO) is greater than 1/2 we can expand the logaritmic
term in (7A) in series form, i.e.,
Ts )ln ( T + TS ) = - C/2Ts + 1/2 C £/2T) 2- .... (SA)
For reasonable values of C and Ts (i..., LC3000C)0,we canwith negligible
error neglect all terms higher than the square term, and thus obtain the following
expression for 66 2 R XeTssB (9A)
aP-2-
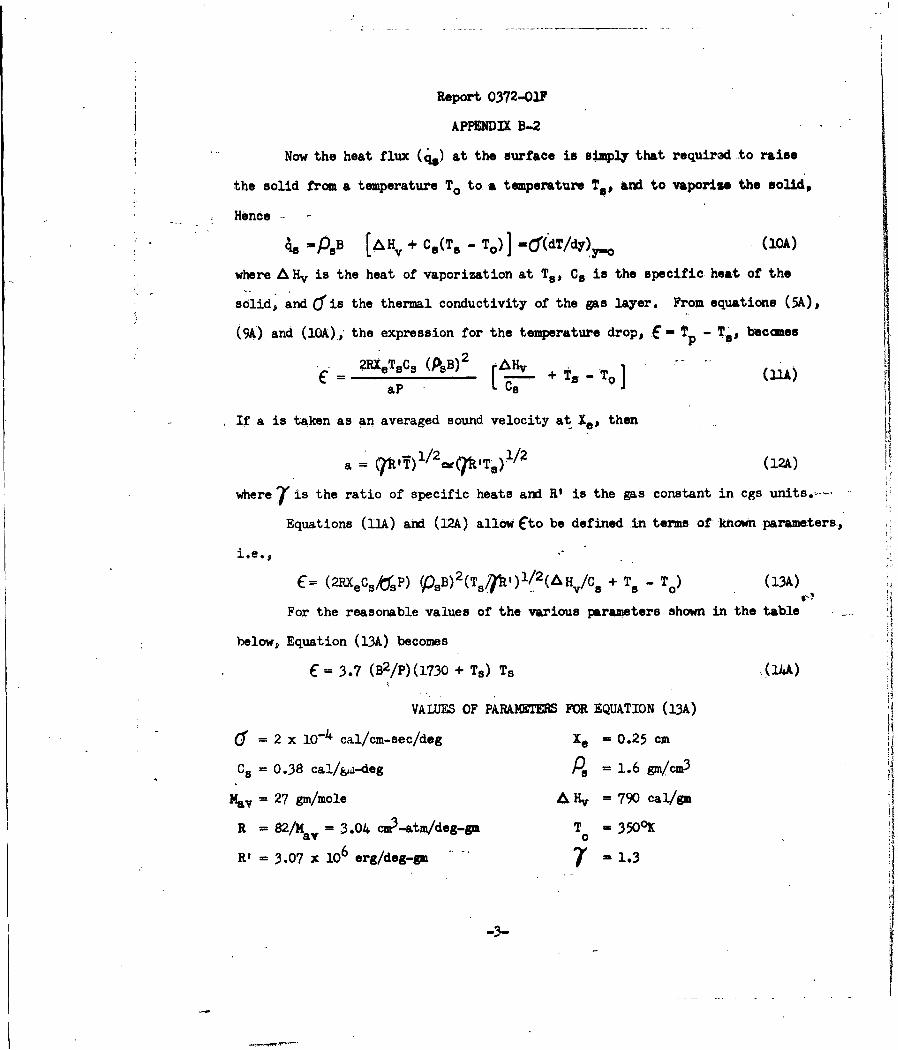
Report 0372-01F
APPENDIX B-2
Now the heat flux at the surface is simply that requird .to raise
the solid from a temperature To to a temperature T., and to vaporise the solid,
Hence
is =0B [LH v + - TO)] - o'(dT/dy) (1A)
where A Hv is the heat of vaporization at T., Ce is the specific heat of the
solid, and dis the thermal conductivity of the gas layer. From equations (5A),
(9A) and (1O), the expression for the temperature drop, f- Tp - T , ecomes
2RXeTsC s (PsB)2 Hv + T o (11A)aP C + o
If a is taken as an averaged sound velocity at Xe, then
a 7 e T)l/2aC T)±/ (12A)
where is the ratio of specific heats and R' is the gas constant in cgs units.-..
Equations (11A) and (12A) allow Cto be defined .in terms of-known parameters,
i.e.,
E= (2RXeCs/1sP) (PsB)2(Ts l/2(AHv/Cs + To T) (13A)
For the reasonable values of the various parameters shown in the table
below, Equation (13A) becomes
E=3.7 (B2/p)(1730 + Ts) Ts ,(14A)
VALUES OF PARAMETE1 FOR EQUATION (13A)
ci- = 2 x 10- cal/cm-sec/dog Xe = 0.25 cm
Cs= 0.38 call -deg P0 = 1.6 gm/cm3
May = 27 gm/mole A Hv = 790 cal/gm
R = 82/May = 3.04 cm3-at/deg-g T - 350°K
R' = 3.07 x 10⁶ erg/deg-gm 7 = 1.3
-3-.
Report 0372-OIF
APPENDIX C
KINETICS OF THE DECOMPOSITION OF
ANHYDROUS PERCHLORIC ACID*
D. J. Sibbett and I. Geller
(To'Be Published in the Journal of Physical Chemistry)
Solid Propellant Research Operations
Solid Rocket Plant, Aerojet-General Corporation
Azusa, California
Research reported in this publication was supported by the AdvancedResearch Projects Agency and technically monitored by the Air ForceOffice of Scientific Research, Contracts AF 49(638)-566 and AF 49(638)-851.
Report 0372-01FAPPENDIX C
KINETICS OF THE DECOMPOSITION OF ANHYDROUS PERCHLORIC ACID
D. J. Sibbett and I. Geller
INTRODUCTION
Study of the decomposition of perchloric acid is of considerable
interest as, an example of a reaction of the only relatively stable anhydrous
oxygen acid of chlorine, because of its importance in the mechanisms of
combustion and decomposition of perchlorates which contain hydrogen(such
as the hydraz.inium -and ammonium salt) and because of the use of concen-
trated solutions in combustion iystems.
Thermal decomposition of perchloric acid has been examined in the
0 0 1vapor phase between 200 and 439 C by Levy who has indicated that the
reaction appeared to be
J. B. Levy, J. Phys. Chem., 66, 1092 (1962).
.0 0heterogeneous between 200 and 350 C and homogeneous in the upper range.
Zinoviev, Babayeva and Tsentsiper2 - 5 have examined the decomposition of
V. P. Babayeva and A. A. Zinoviev, Zhur. Neorg. Khim., 8, 567
(1963).
A. A. Zinoviev and V. P. Babayeva, Zhur. Neorg. Khim., 6, 271(1961).
A. A. Zinoviev and A. B. Ts!ntsiper, Zhur, Neorg. Khim., 4, 724(1959)."
5A. B. Tsentsiper, Zhur. Neorg. Khim., 4, 1086 (1,959).

Report 0372-01F
t1APPENDIX C
anhydrous acid, hydrated systems and mixtu'res at temperatures from 60.
to 1450C. The present study is concerned with kinetics of the decomposition
of gaseous anhydrous acid in the heterogeneous range between 165 and 256°C.
EXPERIMENTAL
Apparatus
Because of the extremely high reactivity of gaseous perchloric
acid to most materials, the decompositions were carried out in carefully
cleaned all-glass vacuum systems. A series of glass by-passes, capillaries,
and break-seals were used in place of stopcocks in the preparation and
reactor sections to prevent the perchloric acid from coming into contact
with stopcock grease. The apparatus was designed so that the reaction was
followed manometrically and in some experiments it was modified to permit
the measurement of chlorine formation by a photoelectric colorimetric
technique simultaneously with measurement of total pressure.
Manometric System
Figure 1 is a schematic diagram of the apparatus, which con-
sists essentially of three basic sections. The reactor section is shown within
the dashed lines on the diagram. The perchloric acid preparation section is
located a-t the left of the reactor. The remainder of the system consists of
various cold traps, a diffusion pump, a McLeod gage, storage bulbs, and
a differential Mercury manometer equipped with a mercury valve. A
description of the sequence of the operations involved in an experiment will
explain the functions of the various parts and the manometric technique
employed.
To start an experiment, a dry-ice-cooled mixture of three
parts of 2016 fuming sulfuric acid one part of 72% perchloric acid was intro-
duced into the apparatus through an opening at the top of Section A. The
-2-
Report 0372-01F
APPEIX C
quantity of the mixture was limited to yield a maximum of 0. 25 g of gaseous
product. After cooling the HC1O 4 -H2 so 4 mixture to approximately -195°C
by placing a Dewar of liquid nitrogen around the base of A, the top of
Section A was sealed with a gas-oxygen flame. The entire system was
-3icarefully evacuated through side arm, E, to approximately 10 torr as
measured by the McLeod gage, J. The by-pass, E, was removed, with
the entire system still under vacuum, to seal the preparatory and reactor
parts of the system (Sections A to F) entirely within glass. The gaseous
perchloric acid was prepared by removilng the coolant from the base of
Section A, and allowing the mixture to warm up slowly to room temperature.
This process permits the dehydration of the 72% perchloric acid by the
fuming sulfuric acid. The dehydrated gaseous product was distilled from
Section A through a drying bed of Mg(C10 4 )2 located at B into the reactor
by cooling the bottom of D with liquid nitrogen. This procedure is, a
modification of that of Smith6 on a microscopic scale. After one to four
6 G. F. Smith, J. Am. Chem. Soc. , 75, 189 (1953).
hours of distillation the reactor D was sealed off at point C, after first
refreezing the mixture remaining in A. This completed the preparation
pha s e.
After warming the reactor to room temperature a silicone
oil bath, made opaque by the addition of carbon black, was raised (from
behind a plexiglas safety shield by means of a specially constructed, re-
mote controlled elevator) into the position indicated by the dashed lines
around sections C, D, E, and F. The temperature of the bath was con-
trolled within 0. 10 C. Manometric measurements were commenced when
the oil bath was in place.
-3-i

Report 0372-01FAPPENDIX C
The system which was used to measure the pressure within
the reactor, D, consisted of four parts: F, G, H, and I. F, a glass
Bourdon gage was employed t) close an electrical circuit when the pressure
above the gage exceeded that inside the reactor by more than the gage
spring constant. Closure of the circuit through the Bourdon gage actuated
a relay and the solenoid surrounding the mercury valve at H. The solenoid
was used to depress an iron collar surrounding a sintered-glass air leak.
Thus, completion of the circuit through the Bourdon gage raised the mer-
cury level and closed off the air leak. The pressure measuring system was
calibrated as a function of pressure at operational temperatures.
Initial pressure measurements at the start of the reaction
were obtained by recording the signal from a pressure transducer, indicated
at G. A recorder of 20-mv range served to record both time and pressure
during the initial rapid pressure changes, which occur as the bath was raised.
After the rate of pressure change becomes kelatively stabilized meap'ure-
ments were made by means of the differential manometer, I, viewed through
a cathetometer.
Calibration of the reactor volume, which includes section D
in Figure 1 and the volume of the inner portion of the Bourdon gage and the
lower section of the break seal at E, was carried out at the end of each
operation after the equilibrated gas samples have been removed through
the stopcocks at R. The calibrated volume of bulb N and its stopcock
served as the standard for each volume determination. It was carefully
calibrated by weighing water volumes prior to the c.onstruction of the
apparatus. At. the end of each decomposition run, before removal of the
gas sample, the volume of the glassware extending from the upper manifold
to the break seal at E was determined by expansion. After destruction of the
break seal, the volume (to the seal at C) was determined. The difference
was the volume of the reactor.
-4i-

Report 0372-01FAPPENDIX C
Colorimetric System
Figure 2 is a diagram of the colorimeter system used for
monitoring the concentration of chlorine in the reactor. The colorimeter
operates independently of the pressure measuring system and, conse-
quently, permitted the simultaneous collection of both types of data.
The reactor itself was designed in the same manner as
described above, with the exception that a cylindrical Pyrex tube was
sealed across the top to give a tee-shaped container. Optica A windows of
Vycor were fused to the ends of the cross-tube. The glass reactor was
mounted in the colorimeter as indicated, seals being maintained with
Viton 0-rings. These seals prevented any oil from leaking into the tubes
and obstructing the optical path. An adjustable front-surface mirror was
mounted at each elbow to direct the light beam through the cell. Mirror
alignment was obtained by adjustment of a rack and pinion device which
operated by means of screwdriver adjustments from the outside of the
optical tube.
The photoelectric system consisted of an ordinary 300 watt
projection lamp, two collimating lenses, a 1. 0 mm pin-hole, a pair of
filter systems, and two IP29 gas-filled photocells. The color filter used
for chlorine detection (Gaertner Scientific Corporation, No. L541C)
0transmitted in the green between 4800 A and 5700 X with maximum trans-
mission at 5260 J. Although its use somewhat decreased the sensitivity of
the analysis, its transmission was outside the known absorption range of
the chlorine oxides which may have transitory existence during decompo-
sition experiments. The spectral response of the 1P29 photocells was
judged satisfactory in the transmitted range although maximum sensitivity
occurred at approximately 4200 A. The circuit used for amplification and

Report, 0372-01F
APFENDIX C
measurement of the output of the opposed photocells wfs similar to that
indicated by Hawes, et. ai. Both the projection lamp and the amplifier
R. C. Hawes, R. R. Davis, H. H. Gary and A. 0. Beckman,Anal. Chem., Z3, 503 (1951).
power supply were operated from constant voltage supplies.
In operation, after the oil bath had been raised, signal
fluctuations caused by the changing thermal 'nvironment were noted. To
minimize these effects, constant temperature water was circulated through
condensers which jacketed the upright sections of the optical path. A plane
ground plate of optical glass was used to close off circulation of hot gases
from the optical tube to the detector photocell. With these modifications,
stable signals were obtained within a few minutes after the oil bath was
raised.
Calibration of the colorimeter was carried out using chlorine
gas (Matheson, 99. 85% minimum purity) at various pressures with the
heated oil bath in the same position and at the same temperatures utilized
in the decomposition experiments.
Utilization of the colorimeter was intermittent. The amplifier
was operated continuously during each experiment but the air-cooled light
source was turned on for five minutes before each reading while the shutter
rema ined closed. It was found that this period was sufficient to establish
stable signals. Longer preheating periods did not change the measured
readings.
PHYSICAL CHARACTERIZATION OF THE PERCHLORIC ACID PREPARATION
For each decomposition experiment, a fresh portion of anhydrous
perchloric acid was prepared. Although the preparation was generally water-
white when prepared in a darkened room, some samples which had been
-6-

ie
Report 0372-01F
APPENDJXG.
exposed to light exhibited yellow coloration. For purposes of characterizing
its purity, the vapor pressure of a typical sample was measured. Figure 3
is a plot of the log1 0 of the vapor pressure against ,the reciprocal of the
absolute temperature from 00 to 61. 80 C. The data of these experiments has
been compared with the measurements of van Wijk8 and Vorlander and
von Schilling9 at 16. 00 and 390 C respectively. These data are considered
H. J. van Wijk, Zeit. anorg. Chem., 32, 115 (1902).
D. Vorlander and R. von Schilling, Liebig's Ann., 310, 369 (1900).
to compare satisfactorily.
The extrapolated boiling point for anhydrous perchloric acid as
obtained from these measurements is 120.50 + 1.3°C. Hantzsch10h -
10 A. Hantzsch, Z. physikal, Chem., 134, 406 (1928).
indicated an extrapolated-V6oling point of about 130°C. The heat of vapori-
zation as calculated from the slope of the plot between 0° and 61.800 is
8.13 + 0..06 kcal/mole. No literature comparison appears to be available.
As a further check on the properties of the initial material and the
nature of the decomposition process, infrared spectra were obtained
using a Beckman (IR 5) infrared spectrophotometer with sodium chloride
windows. The upper section of Figure 4 shows the absorption spectrum of
a typical preparation of perchloric acid at 16. 8 torr using a path length of
100 mm. This pattern was obtained about ten minutes after the gas was
evaporated into the cell.
RESULTS AND DISCUSSION
Results of Manometric Experiments
The general form of the pressure-time curves is shown below in-
-7-7

Report 0372-01F
APPENDIX C
Figure 10 where the experimental points are plotted for comparison with a
computed curve. These data have been analyzed for all experiments in
terms of the established stoichiometry of the decomposition reaction:
SZHC1O 4 )b H 2 0 + C1 +7Z 2. (1)
The total pressure, Pt i.s related to the initial pressure PA and the pressure0
of undecomposed acid PA at time, t by the' expression
(Pt - PA 0PA = A o (--r-- IT
where r is the number of molecules formed per molecule of decomposed acid
On this basis, the amount of perchloric acid remaining
unreacted was calculated as a function of time and the data were analyzed in
terms of simple first and second order kinetic expressions. Figure 5 is an
example of the first order analysis. The ordinate, log (P /P)A is plotted.0..
against time as the abscissa for two initial pressures of perchloric acid.
These experiments were carried out at 200. 1°C with a surface to volume '
2 3ratio of 1. 6 cm /cm 3. After the initial 140 minutes the data fitted the
simple first order analysis and pseudo first order rate constants (k2 ) were
calculated for all data from these slopes. An example of the second order
kinetic test is shown in Figure 6 for the same experiments. In this case,
the ratios of the pressures of perchloric acid decomposed to the pressure
of unreacted acid, (Px/PA) are plotted against time. The initial portions I''1
of the data are linear and these slopes have been used to calculate second
order rate constants, k All of the data collected showed these character-
istic linear relations between 156 and Z65°C at initial pressures between
8 and 373 torr of HC10 4. At the higher temperatures, the duration of the
second order portion became increasingly short, indicating that it would
become undetectible by the manometric method at still higher temperatures.
-8-W

Report 0372-01iFAPPENDIX C
Howeer, the second order linearity remained valid to values of (PX/PA)
of 2. 0 to 2. 5 regardless of experimental conditions. Linearity of the pseudo
first order plot commenced at values of logl 0 (P o/PA equal to 0. 65 to
0.70 and remained valid normally until approximately 95% of the acid was;
converted. A decreasing slopd was noted as equilibrium was approached. EuThese considerations formed the basis for treating the two constants
independently.
Effect of Surface on Reaction Rates
Both rate constants were demonstrated to be extremely
sensitive to the surface to volume ratios of the pyrex reactors which were
utilized. Variation in these ratios was achieved by filling the reactors with
carefully cleaned pyrex spheres of varying diameter. Figures 7 and 8
indicate the relationships between the second order and the pseudo first
order rate constants and the surface to volume ratios for decompositions
carried out at 200 C. The rate constants indicated were averaged values
obtained at the indicated surface to volume ratios. Surface areas were
calculated on the basis of reactor geometry and the number and diameter
of the pyrex spheres required to fill the reactor volume. A roughness
factor of 1. 3 was used to estimate the surface area of the Pyrex from its
geometrically calculated value. Volumes were measured by gaseous
expansion from previously calibrated volumes.
The apparent linear dependence of both rate constants on,
.surface to volume ratios indicates that the reactions as studied between
165 and 256 C are surface processes. In addition, the relationship suggests
that a meaningful separation of the rate constants has been accomplished.
The intercepts on the ordinates of Figures 7 and 8 may indicate the
simultaneous existence df a'gas phase reaction. Unfortunately, the
intercepts may demonstrate a fixed error in the estimate of reactor
-9-
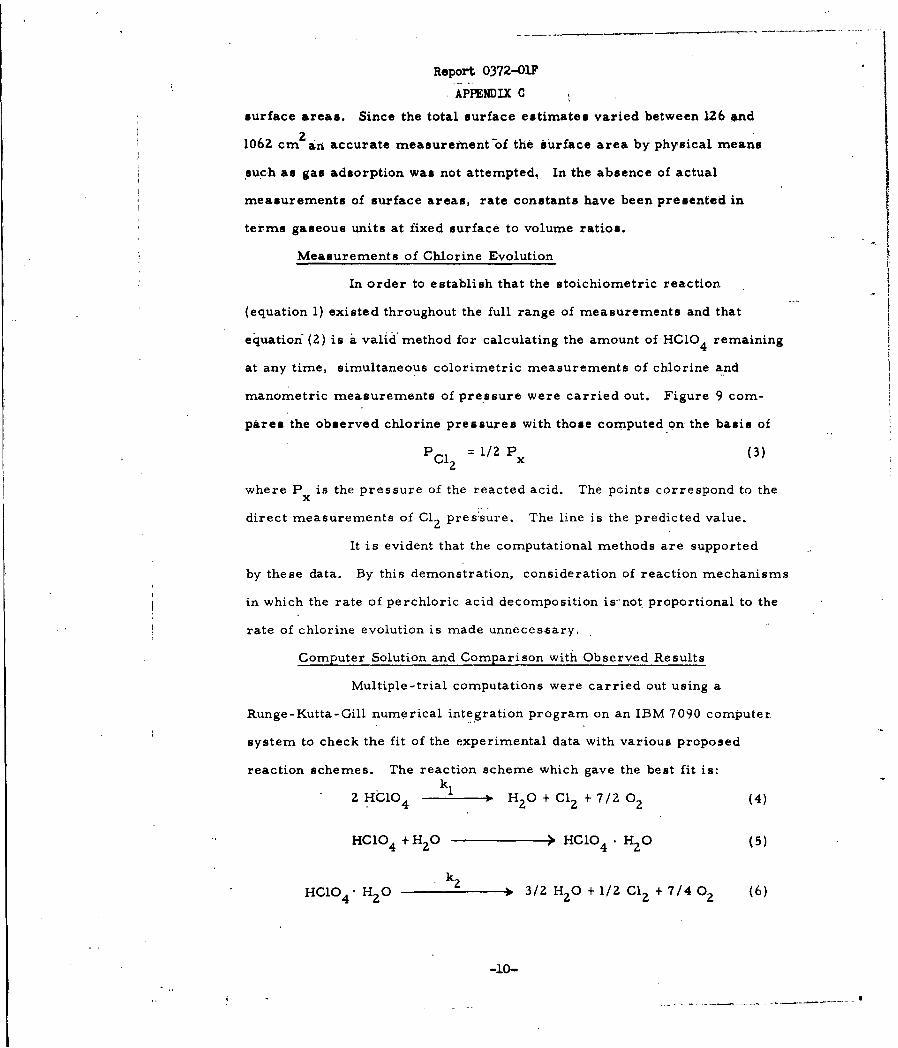
Report 0372-01F
APPENDIX C
surface areas. Since the total surface estimates varied between 126 and
1062 cm 2 ina accurate measurement'of the surface area by physical means
such an gas adsorption was not attempted. In the absence of actual
measurements of surface areas, rate constants have been presented in
terms gaseous units at fixed surface to volume ratios.
Measurements of Chlorine Evolution
In order to establish that the stoichiometric reaction
(equation 1) existed throughout the full range of measurements and that
equation (2) is a valid'method for calculating the amount of HC10 4 remaining
at any time, simultaneous colorimetric measurements of chlorine and
manometric measurements of pre.ssure were carried out. Figure 9 com-
pares the observed chlorine pressures with those computed on the basis of
PC1 = 1/2 Px (3)
where P is the pressure of the reacted acid. The points correspond to thex
direct measurements of Cl pres~sure. The line is the predicted value.
It is evident that the computational methods are supported
by these data. By this demonstration, consideration of reaction mechanisms
in which the rate of perchloric acid decomposition is-not proportional to the
rate of chlorine evolution is made unnecessary.
Computer Solution and Comparison with Observed Results
Multiple-trial computations were carried out using a
Runge-Kutta-Gill numerical integration program on an IBM 7090 computer
system to check the fit of the experimental data with various proposed
reaction schemes. The reaction scheme which gave the best fit is:k 1
2 HC104 H 2 0 + Cl2 + 7/2 O z (4)
HC1O 4 +H 2 O > HCIO 4 * H20 (5)
HCI0 4 " H2 0 2 3/2 H2 0 + 1/2 Cl 2 +7/402 (6)
-10-
- 0

Report 0372-01FAPPENDIX C
Let the following letter designations correspond to the pressures of the
molecular species in torr.
A = HC1O4
B = 2 0
C = Cl1
D =0
E = HCO 4 . H2 0
Based on the assumption that the steps designated in equations (4) through (6)
occur on the glass surface, solution to the kinetics was formulated in terms
of the following equations:klA2 k A.B
-A = ZkA + 1 + K B (7)* B
C2 (8)
-.. 7/4A (9)
and Pt A t + Bt + Ct + Dt (10)
A, ], and 5 are the time derivatives of the species, A, B, C and D.
(The existence of E is limited to the surface of the reactor. ) PtP At, BtI
Ct, D correspond to the total pressure and component pressures at time, t,t
K is the equilibrium constant for the adsorption of some inhibiting species,B
presumed to be HZO on the reactor surface. Implicit in each of the rate
constants kI and k2 are equilibrium constants as required by adsorption
considerations. Two possible cases where equilibrium constants for
-11-
Report 0372-01F
APPENDIX C
adaorption change the interpretation of these rate constants are indicated
-briefly below.
kI, k 2 and KB were obtained directly from experimental
data. The value for kI was the numerical value obtained from the routine
second order plot as indicated above.
In order to solve for a value of KB, the second term of the
overall rate equation, (7) was inttegrated in closed form independently of
the first term. That is, the conversion of perchloric acid by the second
process may be expressed as
k2AB (11)
I+ KB B
This may be integrated to
Aot 1 + A K ln(Ao/A) 1. (12) i
In (A k (Ao-A) k
This solution is based on the assumption that as (A A) approaches zero,0
in (A o-A) approaches zero*. Then, the slope, m of the plot of A t/In (Ao-A)
The same result can be obtained by integrating between
A = A -l and A = (A -A) followed by the assumption that0---*
(A ° -1 -) 5A.0
vs In (Ao/A)/ln (Ao-A) gives
1 + A Km = B2 (13)
Using the data from experiments at 200°C which have initial values of the
perchloric acid pressure ranging from 136. 4 to 218. 5 torr, three slopes were
obtained. A plot of these slopes against the initial pressures of acid yielded
values for k and KB. The slope of the latter plot provided an estimation of
-12-

Report 0372-01F M
APPENDIX C
the ratio KB/kZe The intercept was used to evaluate k2 . The values ob-
tained from the data at a surface to volume ratio of 3. 3 were k = 1. 04 x i0
ml/mole-min and KB= 1. 55 x 106 ml/mole.
For the experiment which started at 218. 5 torr of perchloric
acid, the rate constant for step (4) was, k1 = 6. 46 x 102 ml/mole-min.
Using these values, equation (7) was evaluated using the computer program.
Figures 10 and 11 indicate the results of these computations.
Figure 10 compares the results of the computations of the total pressure
(solid line) with the experimental points. Figure 11 shows the calculated
distribution of products during the reaction. The fit of the data with com-
putations indicate that the data are well explained in terms of the-three step
process, reactions (4) through (6).
Examination of the Adsorption Processes
The form of equation (7) implies that a number of adsorption
equilibria may be involved in the surface decomposition processes. If
standard Langmuir - Hinshelwood adsorption considerations are accepted,
it follows that step (4) occurs by a mechanism in which the perchioric acid
is weakly adsorbed and surface coverage is relatively slight. Then, the
initial bimolecular process, step (4) can be described by a rate equation
such as:
v - 2k' KA 2 (14)W, 1
The experimental rate constant, k kI where K is the equilibrium con-
stant for adsorption of perchloric acid on pyrex. This expression requires
that the obsexved activation energy for the process, E bea1
EaI ET 2 lHCIO4 (15).
-13-

Report 0372-01F
APFENDIX C
where XHCO 4 is the heat of adsorption of HCIO4 and ET is the true
activation energy for the homogeneous gas phase decomposition of HC10 4 .
Two alternate possibilities exist for explaining the surface
processes involved in steps (5) and (6). Either both HCIO and the inhibiting4
reaction product which is assumed to be HzO, (1) compete for thesame sites
on the pyrex surface or (2) reaction occurs between the two adsorbed gases
but the gases are adsorbed on two different types of surface sites so that
they do not displace each other from the surface.
1. Competitive Adsorption
In the case of adsorption of HC1O 4 and H2 0 on the
same sites, the form of equation (7) implies that during the second part of
the reaction, water is adsorbed much more strongly than HC10 alone. In- 4
effect, the reaction takes place between a gaseous HCIO4 molecule and an
adsorbed H2 0 molecule. The rate expression for the inhibited reaction has
the formk? KBAB
v= i+ KB (16)
This treatment does not necessarily assume that there are no adsorbed
HClO 4 molic'ules, but rather that the role of any adsorbed acid molecules
in affecting the rate of HC10 4 (gas)-H 2 0 (surface) reaction is through their
competition with water molecules for the available surface sites. When
HCIO 4 occupies a site adjacent to HzO a rapid combination to HCIO 4 . H O .
occurs, and the lifetime of HCIO4 . H2 0 on the surface is >> the lifetime
of adsorbed HCIO . Based upon these considerations, the measured
activation energy, E is the difference between the true activation energy
for decomposition ET, and the heat of adsorption of water, H HH2
Ea =E - H (17)
a 2 -T .--
-14

Report 0372-OW*i
2'. Non- Competitive Adsorption i
The kinetics of the second step may also be explained
in terms of a reaction between gases adsorbed on different types of sites
so that the gases do not displace each other from the surface. This type of
adsorption would give rise to rate expressions ofthe form
Sk' 2 AKBABV, (1+KAA) (1+KBB) (8)
If the adsorption of the acid is small so that I )) KAA then
k' KAKBAB•~~ 2 A.... B2 (19).
1+ KB B)
The apparent and true activation energies have the following relationship:
E =E- -a T" HO HClO (20)2 2 4 (0
where ?AHC1O is the heat of adsorption of HC1O 4 and the other symbols4
have their previous significance.
Consideration of the data indicates that the competitive
adsorption process is more probable.
Apparent Energies of Activation
Figure 12 is a plot of the second and psuedo first order.
rate constants, k1 and k. respectively against the reciprocal of absolute1 2.
temperature for data obtained at a surface to volume ratio of 1. 4. These
data were obtained at temperatures between 165 and 256 0 C. The following
table summarizes the terms associated with the Arrhenius equation:
kA exp(-Ea/RT) RIO
*-15-

Report 0372-01
APPENDIX C
for the two specific reaction rates at surface to volume ratios of 1.4 and 4. 7.
Surface /Volume Ea Temper tureRate Constant Ratio A (kcal/mole) Range ( C)
k1 molsin) 1.4 6.5 x l07 13.4 165-256
k 4.7 9.7 x 0 .3 200-240
k (min)- .4 1. 0 x 1010 27. 0 165-256
k 4.7 7.9 x 101 0 28.7 2002-40
When the psuedo first order constant is treated as indicated above to
separate k., the second order rate constant and"KB, the equilibrium constant
for adsorption of the inhibitor, the following values were obtained at a surface
to volume ratio of 4. 7
k' = 1. 9 x l05 exp (-20, 500/RT) (22)
KB = 9. 8 x 10³ exp (-13, 300/RT) (23)
From equation 15 and the value of the activation energy for3
decomposition of perchloric acid, found by Zinoviev and Babayeva, a value
for the heat of adsorption of HC10 4 on pyrex may be estimated. On this
basis, the estimated heat of adsorption'between 165 and 2560C is 9.7 kcal
per mole.
Heats of adsorption of water on different glasses have been
determined by Rand and by Tuzi and Okamoto I12
M. J. Rand, J. Electrochem Soc., 109, 402 (1962).
12 Y. Tuzi and H. Okamoto, J. Phys. Soc., Japan, 13, 960 (1958).
Rand found values between 13. 5 and 11. 6 kcal/mole on vycor as a function of
coverage. Tuzi and Okamoto obtained .11 kcal/mole on lead borosilicate glass.
These values are in reasonable agreement with the 13.3 kcal/mole estimated
for the heat of adsorption of the inhibitor on pyrex. Thus water appears to
be the inhibitor.
-16-
Report 0372-017APFEI )[ .
It is possible to choose between the competitive and non-
competitive adsorption mechanisms on the basis of the activation energy
values for the processes represented by k2 and KB. The competitive ad-
sorption mechanism for which the relationship of equation (17) applies gives
rise to a value of the true activation energy, ET x 33, 8 kcal/mole. The
non-competitive mechanism results in an estimated value of Z x 43.4
kcal/mole. Thus, the competitive adsorption mechanism appears more
probable. The value of 33. 8 kcal/mole compares satisfactorily with the
activation energy of Zinoviev and Babayeva 3 , who reported 32.A kcal/-mole.
It suggests that the same rate controlling process ma , be operational as was
found by Figini, Coloccia and Schumacher 13
13 R. V. Figini, E. Coloccia and H. J. Schumacher, Z. Phys. Chem
14, 32 (1958).
for C 2 0 7 . They obtained an activation energy of 32. 9 kcal/mole.
The Effect of AluminaA few experiments were carried out to determine the effect of
alumina on the decomposition rate of perchloric acid at 200 C. The addition
of 0. 25g of Al 2 0 3 (.surfaeearea, 75 m2 / g) as a pellet in the bottom of a pyrex
reactor which had a 1. 4 cm /cm 3 surface/volume ratio increased the second
order rate constant, k1 by a factor of 2. 9. However, the psuedo first order
rate constant, k2 , remained unchanged within the experimental limits of
precision. It may be concluded that the initial second order reaction, which
represents the decomposition of the anhydrous acid was considerably
accelerated in the presence of alumina. The reason for the unchanged rate
of decomposition by the second reaction cannot be clarified without further
experimentation. It in possible that stronger- adsorption of the inhibiting
-17-

Report 0372-MYPAP UIX C
species on Al 203 than on glass is a factor. However, since the reactor
was not packed fully with alumina, the possible role of diffusion in the
reaction rate determination makes an unequivocal conclusion impossible.
Some Geometrical Considerations
The bimolecular nature of the initial reaction gives rise to
a number of interesting speculations concerning the form of the activated
complex on the surface.' Figure 13 shows the calculated dimensions of a
possible model which may be similar to a hydrated G].2 0 7 species. The0
computations were based on the assumptions of a CI-O distance of -. b9 A0
in the C10 4 tetrahedra, 0.96 A as the H-O bond length ir. -later a, I an
H-O-H angle of 104°30 '. Assuming reaction occurs between adjacent
adsorbed molecules of HCO 4 , this model requires that the adiorption0 0
sites be within 5. 46 A of each other. A 2. 43 A minimum distance is
required for two point attachments of the undistorted activated species.
In this model it has been assumed that two hydrogen bonds
exist between the water molecule and the adsorbed C1 2 07 which stabilize
the configuration. Figini, Colloccia and Schumacher 1 3 have reported an
activation energy for decomposition of C1.0 7 of 32.9 4+1. 5 kcal/mole in
the temperature range between 100 and 1200 C. The value of 33. 8 + 3. 0
kcal/mole which has been derived from these data suggests that the same
process may be rate controlling in HC1O 4 and C12O 7 decompositions.
The hydrogen bonding of the water molecule to the adsorbed
Cl 27 which is indicated in the model has been shown to fit reasonably
satisfactorily into known bond length requirements. Using a distance0
between centers of the oxygen atoms of 2. 76 A such as is found for water,
a distortion of the HOH angle from 104. 5 to 117. So would be required. If
the water molecule is assumed to remain undistored, the calculated0
distance between centers of the oxygen atoms would be 2. 99 A. The str#in
-18-

Repolt 0372-01?APONA 0.
energy for distorting the 0-H---o bond would involve only 0. i3 kcal/mole
according to Pauling. 14
14 L. Pauling and R. B. Corey, Fortschr. Chem. org. Naturstoffe,
11, l0 (1954).
Thus, it may be considered that such a model satisfies the geometrical
requirements for a ClZO 7. H2 0 activated state on the surface.
Reaction Mechanism
On the basis of the results indicated above the decomposition
of anhydrous perchloric acid appears to be a surface catalyzed, consecutive
step process between temperatures of 165 and 256°C. The initial step
appears to be., HC1O4 + HC1O 4 - H2 O.ClZO7 (24)
The decomposition of the latter species appears consistent with the
mechanism suggested by Figini, Colloccia and Schumacher 13 for C1.0 7 .
However, the presence of water is believed to inhibit the surface reaction
by competing more strongly for the reactive sites than can HCO 4 . As the
concentration of adsorbed water increases the reaction
HC1O 4 +;HzO 20 H2 0. HC1O 4 (25)
forms a relatively more stable species than the anhydrous acid. The decom-
position of the monohydrate is believed to c-ontinue until all of the species,
HC1O 4 is exhausted. It appears possible that a relatively minor part of the
decomposition proceeds by a gas phase reaction under the conditions of
these experiments.
ACKNOWLEDGEMENTS
The authors are pleased to acknowledge the fruitful discussions of this
work which took place with their colleagues at Aerojet-General Corporation
in Azusa, California. Mssrs. F. J. Cheselske and R. F. Chaiken were
especially helpful with their constructive considerations. A future paper
examining the reaction mecbami.. from a more statistical viewpoint is planned.
-19 -

RePort 0372-01FAPPINDIX C
.jIL
000
=0-- cy I -
0 ft z
09 3
Fiur
Report 0372-01FAPPENDIX C
CHLORINE COLORIMETER SYSTEMFOR PERCHLORIC ACID DECOMPO.TION STUDIES
r n STANDARD PHOTOCELL
BALANCING FILTER
LIGHT SOURCE
LENS SYSTEMd_._I DETECTOR
PINHOLE PHOTOCELLSHUTTER .. OPTICALLIGHT FILTER WINDOW:
WATER JACKET *
LI
OIL LEVEL
Z REACTION VESSEL
FRONT SURFACE TO BOURDON GAGE FRONT SURFACEMIRROR O-RING SEALS MIRROR
Figure 2
Report 0372-03?
VAPOR PRESSURE OF PERCHLORIC ACID
2.2
2.0
*1.8
1.6
1.401
E3 REFERENCE 8*REFERENCE 9
0.8
0.6130 32 34 36
RECIPROCAL TEMPERATURE - /T X 10*3 (OK)
Figure

Weort 0372-031APPEIDIX C
INFRARED SPECTRUM OF PERCKLORIC ACID DECOMPOUTIoW100 ow PATH - MoId WINDOWS
UPPER: 16.8 TORR AT 10 MIN AFTER VAPORIZATIONMIDDLE: AFTER 3 HOURS AT 25RCBOTTOM: AFTER SEVERAL HOURS AT 2WC
4= 30 00 150 10.10 100 g 1l
10
400 300 200 1500 130C 13001000 900 goo 700
- Q41Figure 4
Report 0372-01.7APPENDIX C
1.2 .
DECOMPOITION OP PERCHLORIC ACIDAT 200.10C
FIT OF FIRST ORDER KINETIC EQUATION-
ki 4.68 X 10"3/MIN
T.03XE-MINMI
1--------------------Fgr0

Report 0372-01?APPENDIX C
12.0
DECOMPOSITION4 OP PERCHLORIC ACIDAT 200. IOC .
FIT OF SECOND ORDER KINETIC EQUATION
10.0
9.0 -SLOPE - k 2 .ci}
/
7 .0
LO LO ~/
kj "1202 X 103 cc/m.l..min / *
40
"AZ5.0
3.000 .0 k2 =1 .6 X 103 ec/0m.Is~
S1 zzt'1JII____40 0 120 10 no 24111 33 360
Figure 6

Report 0372-031APPUDIX C
C C
00
tuuIL1
0oo4- UUU.
LU %0c 1J
0. 0900II-I
C44
FigureT7

Report 0372-0I7
APPUDIX C
EFFECT OF WiFACE ON
SECOND RER RATE CmSTA.?
.x
40
I
0 2 46 8 I0 12
I
Figure 8 ,
.3.0!
Ur

Report 0372-01FAPPENDIX C
m2
-(
z191
0 U
A -A
00
w wz
a\
\o
F r
1. \.~lI~dNI~IFiur

paort 0372-03YAPPED C
COMPARISON OF COMPUTED AND EXPERIMENTAL PRESSURES
440
- COMPUTED .
+ EXPERIMENTAL
400---------------------
340 --
U 320
IL 30
2 08
260-
240-
2001 1 10 10 20 30 40 50 60 70 80 90 100 110 120 130 140 150
TIME - MIN
Figure 10
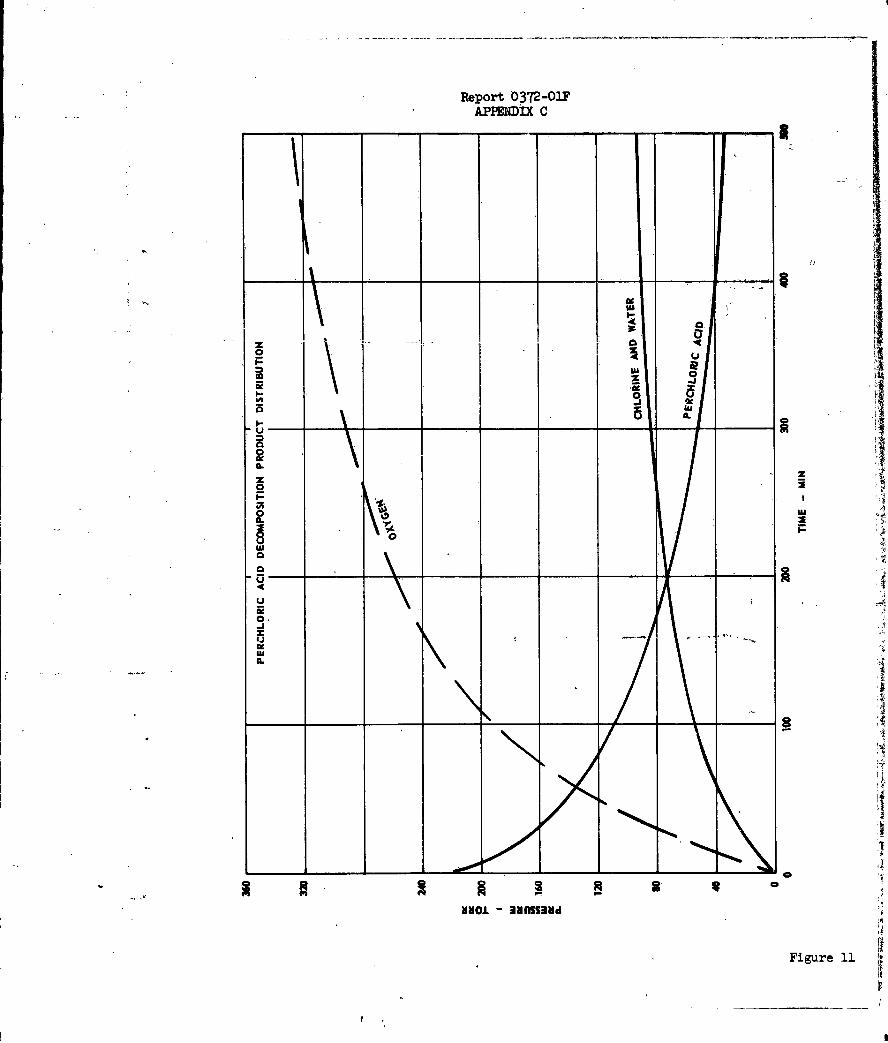
Report 0372-011'APPIEDIX C
-~ 0 jm I
09
__ _ _ _ __:
avol 3fissav
Fiur 1
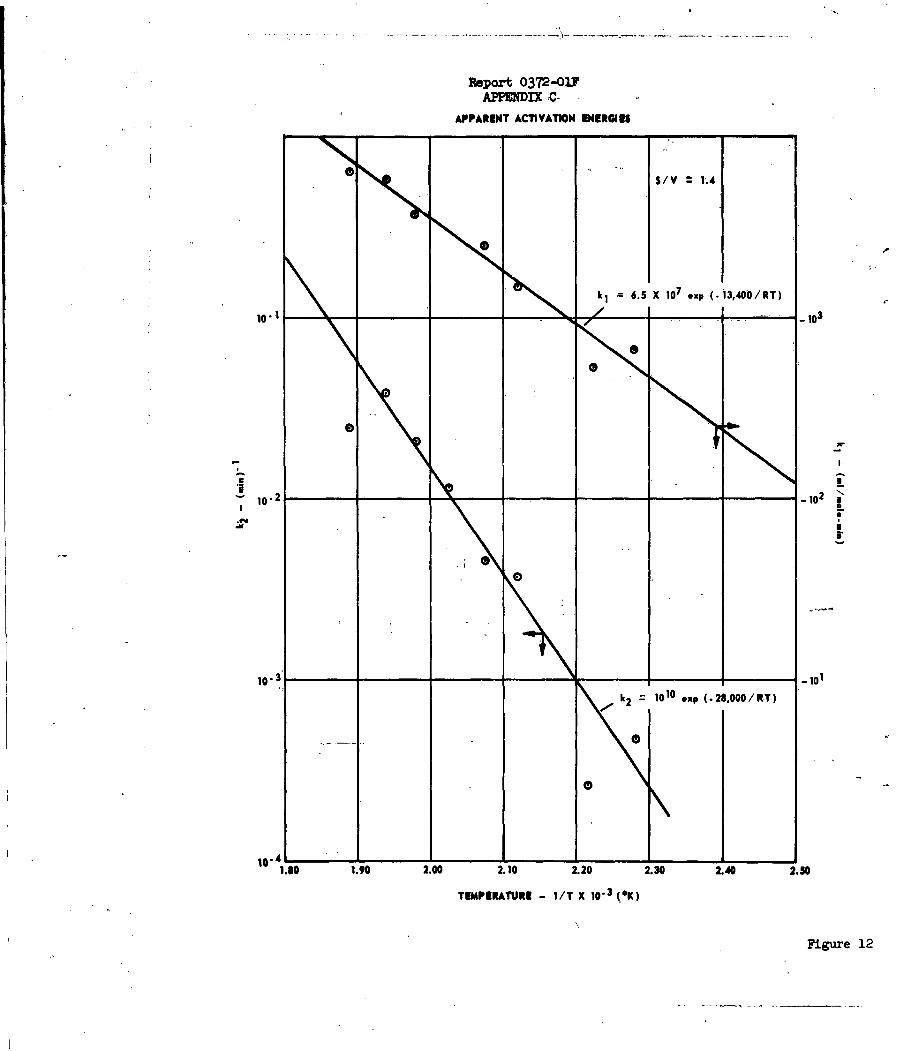
Report 0372-03.?APPENDIX;C-
APPARENT ACTIVATION ENERGIES
S/V 1.4
k 6.5 X 107 ex (13,40b/RT)
10.1 10
10-4
Fiur 10

Report 0372-0YAMP IX C
104.50
1000,
H N
/ N
7 7\ N
0N
2.73 A . .. .
iii4.73A
2.43 A"MINIMUM DISTANCE. FOR
UNDISTORTED C1207
MODEL FOR:ACTIVATED STATE IN HaIO4 DECOMPOSITION
Figure 13

Report .0372-OlF
APPENDIX D
ON THE EXTINCTION OF OPPOSED-JETDIFFUSION FIAMES:
A PHYSICAL CRITERION FOR EXTINCTION
By
R. F. ChaikenTechnical Consultant
Aerojet-General CorporationSacramento, California
I.- INTRODUCTION
The extinction of opposed-jet diffusion flames, which were first
investigated by Potter and his colleagues,(-3) and the Spalding theoretical
treatment of the phenomena(4) have demonstrated the potential usefulness of
the extinction process as a means for determining chemical reactzn rates
in flames. In the studies by Potter et. al., the technique involves the
extinction of flames which have first been stabilized in the impingement
zone between two opposed gas jets, one of which contains fuel, and the
other oxidant. Such flames exhibit a well defined "Apparent Flame Strength"
or maximum mass flux which can be burned along the axial direction. Gas
flow rates which exceed this "Apparent Flame Strength" (referred to here-
after as AFS), results in extinguishment of the axial portion of the flame
and its reestablishment in a region encircling the gas jet impingement
zone.
According to the Spalding theoretical treatment, the AFS should be
directly--proport-ional to the volumetric rate of chemical reaction at
extinguishment, and hence, the pressure dependence of the AFS should be
the same as the overall order of the chemical reactions giving rise to the
flame. These conclusions appear to have been reasonably well verified in
flae studies with propane-oxygen( 3 ) (reaction order= 2.0), aaonia-ozygen(5)
-1-
Report 0372-017
APPEDIX D
(reaction drder = 1.7), and amonia-nitrogen dioxide(5) (reaction order - 2.5).
Unfortunately, the Spalding Theory requires prior chemical kinetic
knowledge (or assumptions) about the flame reactions in order to relate
quantitatively AFS data with the maximum volumtric reaction rate at
extinction. Thus, it is difficult to interpret comparisons between
estimates of flame reaction rates obtained by the opposed-jet
technique and those obtained by other methods (e.g., from laminar flame
speed data).
Recently, Pandya and Weinberg( 6 ) have studied the internal structure
of flat opposed-jet diffusion flames between ehtylene and oxygen utilizing
jet flow rates far less than the AFS for this system. In connection with
the aerodynamic structure of the impingement zone, these investigators found
two types of flow patterns: (1) when the flame zone is displaced from the
center of the aerodynamic system, a single plane (the stagnation plane),
exists across which no particles can cross. Here, the flame zone is fed by
both convective and molecular diffusion of reactant; and (2) when the centers
of the flame and aerodynamic systems are made to coincide, two stag-
nation planes exist across which no particles can cross. In this case, the
flam zone, which is bounded by the two stagnation planes, is fed reactants
solely by molecular diffusion.
It is believed that the change in reactant flow rate process with
different positions of the flame reaction center (relative to the aerodynamic
centw) offers a possible physical criterion for the extinguishment of
opposed-jet diffusion flames. It is the purpose of this paper to describe
this physical criterion, and to demonstrate how it can be .utilized in
conjunction with the Spalding treatment of the mixing of opposed-jets to obtain
-2-
Report 0372-01F
APPENDI D
a quantitative relationship between AFS and chemical reaction rate.
This new approach leads to results similar to those obtained by Spalding
and dQes ,not require prior detailed chemical kinetic kneledge about the
flame.
I. SPALDING THEORY OF MIXING IN OPPOSED JETSThe aerodynamic model considered by Spalding() is based on the
impingement of two opposed inviscid gas jets of equal strength on a
thin, infinite plate held perpendicular to their axes (see Figure 1).
The following conditions were assumed:
(1) Stationary-state one-dimensional flow in the axial direction.
(2) The one-half thickness of the impingement region (i.e.
distance along the axis measured from the aerodynamic center) is less than
0.1 times the jet diameter.
(3) The diffusion coefficients of all molecular species are
equal at any point along the axis.
(4) The product of the square of local gas density and the
diffusion coefficient is a constant.
For the purposes of this paper it will suffice to just state some
of Spalding's results, viz.
f Q=() [1+ erf (YVPeU/2tr)] (1)
df. ro] ex [ Y~ (2)
and, v=- U Y/r o
where f = fraction of mass in the local mixture which is derived fromthe fuel bearing jet.
-3-
Report 0372-01F
APPEDIX D
Y - transformed coordinat related to distance along the axis
(y-dfrection); Y (P/)OQ)dy
Cd - local density 0
S- local exchange coefficient (equal to the product of thelocal density with the diffusion coefficient.
U - initial axial velocity of the jet
v = axial velocity of the jet at point y
r o =-radius of jet
subscripts +oorefer to conditions at y co(the fuel Jet is taken as originating at y - +00and the oxidant jet at y -
The relationship between f and the composition of the local mixture
can be readily derived from the following considerations. Let the reaction
stoichiometry be independent of y, and such that X/( ( + 1) gm of oxidant
reacts with l/((X+ 1) gm of fuel to give 1 gm of products. Then the mass
in the local mixture which is derived from the' fuel jot is
+ i(
where =TF total mass from fuel jet
Mfu - mass of fuel
Kinfu = mass of inert from fuel jet
M = mass of reaction products
likewise for the total mass from the oxidant jet,
a~+ 1 (5)
Now since the diffusion coefficients of all species are the same, Nnfu/FMTF
and Ninox/*1ox are independent of y. Also, Np =0at y=+wo; ox 0
at y -am; and Kfu - O at Y - -o. Normalization of the compouent
-4-

Report 0372-01F
APPENDIX D
masboi to the total mass present (i.e. Yox + Tff) leads eventually to
f = f , = /' (+ mx, - o /a (6)afu, oo + mox, -CO/CX
where the a's refer now to component mass fractions, and the +±Wsub-
scripts refer to initial values before mixing of the jets (i.e., at y -
In anticipation of the discussions to be presented, it is of interest
to determine the relationship between f and mfu under the limiting condition
of infinitely fast reaction occurring. In this case, oxidant cannot exist
in regions where fuel exceeds its stoichiometric value; likewise fuel
cannot exist in regions where oxidant exceeds its stoichiometric value.
Thus, Uf = 0 for m > 0; m = 0 for mfu >0, and the expressionfu ~ ox f
for f on the fuel jet side of the flame front is
ffuel mfu + m, /2side x-o()
mffuo + mox, -o/(
Also, the position of the flame front (locus of stoichiometry) is determined
by f(fu -o; mox =0) or
ft= m~x .-0 /G(
fat / 8mfu,OD + Mox,_AX
Equation (8) in conjunction with Equation (1) can be solved for
the position of the flame front in the transformed axial coordinate system,
I, i.e.,
erf (YstPOO U/2 =ro) 2fst (9)
It is noted that, since erf (± lxI ) =- erf( lxl ),Equation (9) indicates
that YetUi must be a constant for a constant flame stoichiometry. Hence
as the jet velocity U increases, Yst decreses, and the flame front is
Report 0372-O1F
APFSU3X D
established closer to the stagnation plane (at Y 0 0). This can also be see"
from Figure 2e which shows the variation of! YVjQU/2 4r* vs f,
Now the fuel flow/unit area/unit time along y is given in general by
the sa of the diffusion and convective flux, i.e.,
*1 =Pvmf. - ((da_ /dy) (10)
or from Equation (3) and the definition of the transformed axial
coordinate, Y,
(a , 7 u/d) (11)0*-ifu -ro PO
From Equation (11), it is noted that the convective flux (given by
the first term) is zero at the stagnation plane (Y - 0) as well as at points
in the flame where mfu = 0.
In the case of infinitely fast reaction, Equations (2), (7), and (11)
yield the following expression for the fuel flux into the flame front,
-Af a f'T s .0 + a 3 0/XYa (12)L2 =(m o+- 24r0 st (),
or in terms of Spalding's dimensionless quantities
-*fu I Tr U-(3
I I Its=fu,0Wow U POO
where at - xp[.U~t2rS(1-f at)
* Taken from 4palding's paper (Reference 4).A negative value of fuel flux implies a fuel flow towards y -o;
hence, Equation (11) is written in the sense of fuel flow into the flame
front for values of Y on the fuel jet side of the flame.
-6.

Report 0372-031
APP=)3X D
The linear term in brackets on the left-hand side of Equation (13)
is equal to the mass rate of fuel burned per unit area of flame divided by
the mass flow rate of fuel per unit area of fuelbeqring jet. The square
root term is a Peclet number for the jet. In this form, it is more clearly
seen that the fuel reaction rate for infinitely fast reactions is independent
of the local transport properties of the gas mixture in the region of the
flame.
III. FINITE CHD(ICAL REACTION RATES
A. DESCRIPTION OF THE FLAME ZONE
In the previous section, the flame zone for infinitely fast
reaction rates was represented as a plane of zero thickness at f - ft (see
Equation 8). In the model to be considered in this section, it is assumed
that finite extent in the axial direction which can be approximated by a
definite reaction zone of thickness 6 (see Figure 1). It is further assumed
that this reaction zone is centered symmetrically with respect to chemical
reaction rate on the plane corresponding to f = fst. In this connection, it
is noted that Pandya & Weinberg( 6 ) found the profile of heat release rate in the
ethylene-o.ygen opposed-jet -flat flame to be highly synmetrical about the
flame center (peak value). This symmetry existed even when the flame was
positioned at some distance from the aerodynamic center (within, the gas-
jet impingement zone).
Now the simple mixing theory of Spalding predicts that a single
stagnation plane (at the aerodynamic center, y = 0) should occur for all values
sof t . However, Pandya and Weinberg found that this conclusion is
valid only when the flame zone does not coincide with the aerodynaic center.
When these regions do coincide, the flame apparently behaves as a weak gas
-7-

Report 0372-O11
API3 D
source which Ppplts the single stagnation plans into two planes across whisk
no Particles can cross by convective flow. From these experimental. reaults.,
it can be inferred that under conditions of flow or stoichinnotry
whore the f lam zone is positioned amay from the aerodynamic center, at least
one of the reqctants will be fed into the flam reaction sons (i.e. in the
diretio oftheflae) y both diffusive and convective flo.* owvr
when conditio~s prevail where the flame reaction~ son* and the aeodynamic
center coiftci~e, the appearance of two stagnLtioa planes winl result in the
flawe reaction zone being fed both oxidant A-M fiael solely by d"I*tfus flow.
B, THE EXTINCTION C~RrTMUD
In view of the above coments it is'now possible to develop a
physical criterion for the extinction of opposed-jet diffusion flame. First,,
consider a flame zone whosecenter at..y - y*et is initially displaced from
the aerodynamic center at y - 0 by distance greater than 6 /2, which by
definition is the half thickness of the effective chemical reaction sonob.
From the relationship between yet o t s~ ie
I f ty ( /P4 )dy(1)
and the reltionship between T st and jet velocity (see Equation"9),s it is
seen that as the jet velocity U increases, jet~ decreases, awl the- flam
center will1 approach the single stagnationi ple At! Yii-0
T or the case depicted in Figure 1, oxidant is fed into the flam reactionzone by both diffusive awl convective flow, awl fuel by diffusive flowalone. The reverse situation would hold.-for a flame positioned on thefuel side of the aerodynamic center,
In Figure 1, t~e initial flamie sone is positioned on the neoaive y-auis, jhence, y (- 6/2. If the initial flam were postioned on the poeitivey-axin, yleyt> 0/2.

Report 0372-021'
APPKIX D
Now consider an increase in U to a value where y 6/2.
Then, any further increase in U will cause the finite flame zone to
envelop the single stagnation plane at the aerodynamic center. In accordance
with the findings of Pandya and Weinberg,(6) it might be supposed thlt
under these flow conditions the single stagnation plane will be split into two
stagnation planes such that the rate of reactant flow into the flame zone
suddently decreases. This decrease in reactant flux will be associated with
the sudden change from a combined diffusive and convective flow process
to a solely diffusive process.
Now while the rate of chemical reaction (and therefore rate
of heat release) within the flame zone must suddenly decrease when st i
6/2, there should be no drastic change in the rate of cooling of the
flame reaction zone due to radiation and heat conduction to the environment..
Hence, it might be expected that the sudden appearance of two stagnation
planes could result in complete and sudden extinction of the axial portion
of the fIlame. This physical criterion for extinction would lead to an
"Apparent Flame Strength" (i.e., P U )which is determined by the valueO ext
of U. for which yet = 6/2, or
'sti .(/ (p/c~)dg (15)
The above expression combined with Equation (9) with a t
y * and U = Uex t define the physical extinction criterion.
C. RELATIONSHIP BETWEEN AFS AND RATE OF CHDICAL REACTION
Now the nass flux of reactants into the flame zone at any time
... l bso _fl_, awthe planes at y t+ 6/2 which define the effective
-9.'

Report 0372-O21
APMPUIX D
boundaries of the chemical reaction zone. For the case of fuel flux Into the
flam depicted in Figure 1, this will be given by Eqution (1i) evaluated at
!(y) - v(yst + 6/2). Howver, at ,ztination yt ".45/2, m Y - 0,
and Squation (11) simply becomes
: % 1,4a -o " ,.,~P O Y - 0u = Ut-= u..
IU U et po-fu 'U r- (U)
The gradient of fuel mass ratio at ! - 0 is readily evaluated
from Equations (2) and (6), since it is reasonable to expect thit there is
little oxidant(i.e. 1o 0) at the flame boundary facing the fuel jet
(likewise afu - 0 at the flame boundary facing the oxidant jet). For these
conditions, the mass flux of fuel into the flame is a maxim, and Eqution (16)
can be written as
1%J)17(17)fu =x- (Lfu, x=, 27Tro,I.:-. "r0 -J 1 )
where the absolute quantity of ifu signifies that the flux is into the flame
zone. It should be noted that the AFS (i.e.,o Uex) depends on the flame
stoichiometly through Equation (9) which states that is a constant that
is established by the value of Gt" At the point of extinction this fact can
be represented bythe following expressions: -"
P Uext (Y 2 M C2 (18)
27r °
,..c - ] (19)2 0, ro 0 ...=-
Here, C is a positive constant which depends only on the flame stoichiometry
and not on jet velocity or flam position alone.
-10-
Report 0372-011
APPFMDU D
Now in terms of a kinetic treatment of the rate of flme
reactions, it is considered that the overall reaction consists of
Fuel + Oxidant---> products + heat
with a mess rate of reaction of fuel/unit volve of flame sone Livn by(Rr -kr Wfulfalb (20)
where r -volumetric meass rate of reaction of fuel. kis a functionof temperature and time through the temperatbre dependence of krand the time dependence of nfu and nox
kr - specific reaction rate constant
Wfu = molecular weight of fuel
nfu = mole concentration of fuel
n = mole concentration of oxidantOX
a+b - overall order of the reaction
Effecting a mass balance in the opposed-jet geometry between
the rate of reaction of fuel in the flame zone and the rate of flow of fuel into
the flame zone, it is found that
Rr averaged "effective" volumetric mass reaction rate in the flame
zone.
Thus, combining Equations (17) and (21), it is seen that the
- maximum effective volumetric reaction rate at extinction is.,
rXu + meWa ?PM U.t (22)'r~ a 2 7TroIr
From Equation (19)s 6 is related to the AFS through the constantC, hence the above expression serves to relate the maximum effective volumetric
reaction rate to the AFS. However, in order to ovaluate' R,.. from AFS data,
it is necessary to determine 6 explicity as a function of AFS, by evaluating
-. ...1-.. .

Report >0372-01F
APF3X D
the integral of Equation (19). In essence, this requires evaluating the
relationship between the real axial coordinate y, and the transformed
axial coordinate T through the flame zone (see Equations 14 and 15). While the
exact evaluation of this relationship would require &yriori knowledge of the
temperature profile through the flae gone, it is possible to show that
~Y~ I B6 wtiere Ais a constant and should be a relatively good approxination
* to the integral.
Expressipg the local gas density in terms of the perfect gas
law and assuming uniform pressure throughout, Equation (15) can be written as
6,6/r!* Y6 2 R!md 'Ro To d (23)
where R /R is the ratio of the gas constant applicable to the fuel jet to
that applicable to the local mixture, This ratio should be far less sensitive
to variation than TO/T. Hence for many flame reactions of interest, it is
reasonable to consider R /R=0 /Rst, where Ret is the gas constant applicable
to th'e flime reaction products.
Now from the Rosentbal treatment of moving heat sources,(7)
it can be expected that the real temperature profile can be approximated by
an expression of the form
whereT(t -l~ ( Tet- ) b6/2- (24a)_ (bT 1where
Tot -i ep-6/2)<<c(2b
Here, T t and T 0 are the temperatures at the flame center and initial fuel
jet respectively; blis an adjustable constant with a minim value such that
Substituting T ( ) from Equation (24a) into Equation (23), evaluating
-12-

Report 0372-0F
APPENDIX D
the integral, and then applying the condition of Equation (24b) yields
"t *1 t .2 b I. I |
For most flames of interest in (Tst/T.o) will be TeativeJly constant
with a value of -2; and b will have some value greater than 10/6 in orderto satisfy Equation (24b). Therefore, it is easily seen that the relationship
Rstt
should be reasonably valid since at most,2 would be expected to vary between
0.23 and 0.5, In view of the uncertainties in other constants (e.g., averaged
transport coefficient), it should be adequate to consider,' as having a
constant value of 2/5. Using this value ofP3, Equations (26) and (19)
yield
which when combined with Equation (22) yields as a final expression for
relating effective maximum volumetric reaction rate to AFS:
Rst 57 C/ ro
Since C is determined solely by the flame stoichiometry through Equations (8)
and (9), Equation (28) allows Rrmx to be calculated from AFS and fst
data alone. Also, in keeping with the Spalding Theory, Equation (28) implies
that the 1 ,max - AFS relationship does not depend upon transport properties
in the flame.
It is perhaps worthwhile to point out that the above expression
has been derived for a flame which is initially positioned on the oxidant
side of the aerodyamic center of the jets- (ie., yst <0), hence the
-13-
Report 0372-017
APPEDMI D
gas constant R., refers to the fuel jet. Due to the symtry properties
of the flame., Equation (28) will also be valid when the initial flame is
positioned on the fuel side of the aerodynamic center (i.e., Yst<O); however
in this case R,, will be the gas constant applicable to the oxidant jet.
This arises from the method by which Equation (15) was evaluated.
IV. COMPARISON WITH SPAIDM'S APPROXIKATE THE Y FOR FINITE CECI"ATLRECTIONS
A, THE RELATIONSHIP BETWN REACTION RATEAND AFS
Spalding's exact theoretical treatment of finite chemical
reaction rate in the flame zone(4) involves numerical solutions of the
differential equation in the mfu-f plane for conservation of the fuel species.
It is this exact treatment which requires a priori chemical kinetic knowledge
(or assumptions) concerning the flame reactions. However, for high activation
energy reactions, Spalding(4) showed that it is possible to employ the
Zeldovicfi(8)-Spalding(9) approximation to evaluate the conservation equation
in closed form; thereby obtaining an. analytic relationship between AFS and
chemical reaction rate. This relationship can be written as
R( / /UXt ] M (29)
2 ro 2-st fast
Here, Rr.max is the local maximum rate of reaction of the fuel
in the flame zone just prior to extinction and 'Yst is the effective average
value of the ratio of local reaction rate to the maximum reaction rate; (i.e.
y Rr/Rsx). In the high activation energy approximation, Spalding found'4to vary between 1/3 and 1/6; hence, he assumed~st to have a constant
value of 1/4. The ratio /iO was assumed to be given by the initial gas
jet density and the density of the reaction products at complete reaction.
A quantitative comparison between Spalding's APB-reaction rate

Report 0372-01F
APPENDIX D
expression and that given by Equation (28) is not readily discerned since the
former, expression relates AFS to the local maxiuum reaction rate while the
latter expression relates AFS to the average effective Maximum reaction
rate (i Oe. 1 r max)
However, since Rr.,max can be defined for the flame son* depicted
in Figure 1 by
where Rr is the local reaction rate and the asterik refers to conditions within
the flame zone just prior to extinction, it is readily seen that for thin
reaction zones (i.e., high activation energies), Rr'mx should be approximately Iequal to Rr,m="
Figure 3 shows a comparison of reaction rates calculated from
experimental AFS data several using both equations (28) and (29). It is V
evident that both expressions yield similar results.
In any case, both expressions predict that the AFS should be
directly proportional to the chemical reaction rate, and to the jet diameter.
Since the reaction rate is proportional to the pressure raised to a power
equal to the overall reaction order (see Equation 20), the AFS will likewise
b%_proportional to the same power of pressure. These.-predictions are consistent
with theexperimental data. 3' )
B. THE RELATIONSHIP BETWEEN AFS AND LAMINAR FLAME SPEED
(4)Spalding extended his approximate theoretical treatment
(i.e., the high activation energy approximation) to derive a relationship
between the. AFS of opposed-jet diffusion flames and the laminar flame speed
-15-

Report 0372-01F
APPENDIX D
of premixed gaseous diffusi~n.:flames...corresponding to the.-ame, stoichiometry
(L.. ft ). The laminar flame speed for such a stoichiometric gas mixture
is given by the expression
[2 jfuO stf Jo Rrdmfu (31)
where G is the mass flux normal to the laminar prem~xed flame which is pro-
pagating steadily through a homegeneous stoichiometric mixture of fuel and
oxidant. G relates directly to the flame speed through the expression
G = OmSu (32)
where Pm is the initial density of the reactant gas mixture and Su the laminar
flame speed.
Evaluation of the integral of Equali-31 in terms of the
parameter lyst led Spaluing to predict a quadratic dependence of AFS on laminar
flame speed; vis.,2ro (,
14L U~t = [ 7.o(Mf,, st)2 ] (mfu,0o fstG)2 (33)
Now in the present theoretical treatment, the AFS can be related
to G through Equation (30), which defines Rr max" Due to the flame zone
symmetry, this definition can also be written as
" ! -- 2 rmfu,.ofst ."
Rr= f ~ 7Rr * d~fu (34)
0 (cduf,/dY)*

Report 0372-OI1
APPENDIX D
Here, the lower limit of the integral corresponds to Mfu(Y= -6 ), and the
upper limit to mfu(y- - 6/2), thus, the integration occurs over that portion of
the flame zone which faces the oxidant Jet.
When the flame zone"in the region of interest is relatively thin,
a linear relationship between mfu and Y should be a reasonable approzimation.
Therefore, (d T./dY) can be replaced by a constant given by'(dmfuldY')* mfu,* fst (35)
Y~st*
Under this condition, Equation (34), when combi ed with Equation
(31), becomes
6Rr max [?OMu fst (36)ua fD-sst fst.) 2
making use -of the previously derived expressions for 6 1r an Y.
finally yields2VFroC(l-fst)2
/o Ue (Mfu,.. f t (37)Mf st
Thus, the use of the physical extinction criterion also leads to
a quadratic dependence of AFS on laminar flame speed.
However, itshonld-b- pointd mJ. thaLthe.propronality factor
(i.e., the term in the square bracket) is a function of ft; hence, Equation
(37) could be considerably different from Equation (33).
To demonstrate this point, the ratio formed by dividing the
right hand side of Equation (37) by the right hand side of Equation (33) is
plotted vs fst in Figure 4. It is readily seen that near certain values of
17
-17-

Report 0372-01F
APPENDIX D
fst' the Spalding proportionality factor could be orders of magnitude greater
than that given by the present treatment. The zero value of the ratio at fat
0 ard 1.0 simply reflects the fact that the proportionality factor of Equation
(37) approaches zero faster than that of Equation (33). However, the zero value
of the ratio at fst = 0.5 reflects the singularity introduced by employing the
physical criterion for extinction.. For fst = 0.5 is initially centered at the
aerodynamic center (i.e., Y t 0), hence, the flame is unstable at all values
of jet velocity.* On the other hand, the Spalding proportionality factor remains
finite at fst = 0.5. This probably arises from the fact that the Spalding
theroetical treatment does not take into account the existence of two' stagnation
planes when the flame zone is centered on the aerodynamic center.
In Figure 5, Equations (33) and (37) are tested against the
experimental data on AFS and G which Potter and Butler (1 ) first reported. If
Equation (33) were obeyed, the quantity tabulated-in the next to the last
column should have the same numerical value for each flame system. Likewise,
for Equation (37) and the quantity tabulated in the last column of Figure 5.
From the results, it would appear that the data conform to Equation (33) some-
what better than to Equation 37. However, it is evident that both theroetical
AFS vs G expressions are only approximately obeyed. This could be due, as
Spalding suggested, to an unknown experimental variation in fst, or an improper
flow pattern in the impingement zone during the AFS determination..
. It has bee n.tacitly assumed throughout this treatment that the gas Jet flowclosely resembles Spalding's idealized fno!. Th~s automatically requires afuel jet flow with a Peclet number (i.e., 1r11/% ) greater than°I00.()The Peclet number for the jet in Pandya and Werhberg's studies was about afactor of 5 less than this minimum value. Therefore, the fact that theywere able to stabilize diffusion flames at the aerodynamic center of theiropposed jet flow system does not necessarily contradict the physical criterionfor extinction as applied here.It is assumed here that the value of e. is-the same *for each flame system.
***It is interesting to note that in a subleuent study of the propane-oxygenflame with higher velocity jet-streams,(U) the AFS was found to be 10 ii/Mu-sec as compared to the 5.1 jM/c 2 -sec value shown in Figure--S.
-18-

Report 0372-OF
APPENDIX D
Alternatively, the apparent trend to constant values of the
tabulated quantities (Figure 5) for the flame systems with higher AFS values
(and hence higher reaction rates), suggests that the thin flame zone approxi-
mation may not be valid for flames with AFS values less than-O.2 gm/cm2 -sec.
In any case, the available experimental data are insufficient to
adequately test the validity or comparative mertis of the two theoretical AFS
vs G expressions. From Figure 4, it is seen that a definitive evaluation of the
comparative mertis of Equations (33) and (37) should be obtained with experimental
AFS and laminar flame speed data at stoichiometric mass fractions near fet - 0.5.
V. SUMMARY
The extinction of opposed-jet diffusion flames has been defined in terms
of a physical criterion for the extinction process. In essence, it is considered
that the stagnation plane at the aerodynamic center of equal strength opposed gas
jets is a barrier across which no stable flame can cross.
Although this physical criterion, at present, lacks a theoretical
foundation, it does fall within the framework of both the Spalding theory of
mixing in opposed gas Jets, and the experimental findings by Pandya and
Weinberg of the existence of two stagnation planes when counter-flow flat
diffusion flames are stabilized centrally between the two opposed gas streams,
The physical criterion, when utilized in conjunction with the Spalding
theory of mixing, yields analytic expressions, for relating apparent flame
strength with chemical reaction rate and laminar flame speed in equivalent
premixed diffusion flames, These relationships differ somewhat from those
given in Spalding's approximate theoretical treatment of the extinction
phenomena, but do yield quantitatively similar results when both are compared
with the available experimental data on hydrocarbon and ammonia oxidation
flames.
-19-
__

Report 0372-017
APPENDIX D
However, it is believed that the available data are insufficient to
adequately test the validity or relative merits of either the Spalding
approximate treatment or the current treatment of the extinction process.
A definitive test will require experimental apparent flame strength data taken
under flow conditions which satisfy the requirements of Spalding's mixing theory;
i.e., (1) high Reynold's number jet flow, and (2) equal strength oxidant and
fuel jets. Also, the apparent flame strength and-iaminar flame speed for
equivalent flame systems should be determined where the stoichiometric mass
ratio has values near 0.5.
It is evident from the current and previous analyses of the extinction
of opposed-jet diffusion flames, that the technique is an important and useful
method for determining chemical reaction rates in flames; particularly for
those flame systems where the oxidant and fuel are too reactive to allow a
study of laminar flame speed in a premixed gaseous medium.
ACKNOCaD NT
The many stimulating and helpful discussions with Mr. F. J. Cheselske
of the Advanced Propellants Department, Aerojet-General Corporation, Sacramento,
California is gratefully acknowledged.
-20-
Report 0372-01F
APPENDIX D
REFERENCES
i. Potter, A. E., Jr., and Butler, J. N., "A Novel Combustion MeasurementBased on the Extinguishment of Diffusion Flames", ARS Journal, Vol. 29,1959, pp. 54-56.
2. Potter, A. E., Jr., Heimel, S. and Butler, J. N., "Apparent FlameStrength: A Measure of Maximum Reaction Rate in Diffusion Flames",Eighth Symposium (International) on Combustion, Williams .& WilkinsCo., Baltimore, 1962, pp. 1027-1034.
3. Anagnostou, E. and Potter, A. E., "Flame Strepgth of Propane-bygenFlames at Low Pressures in Turbulent Flow", Ninth Symposium (International)on Combustion, Academic Press; New York, 1963, pp. 1-6.
4. Spalding, D. B., "Theory of Mixing and Chemical Reaction in the Opposed-Jet Diffusion Flame", ARS Journal, Vol. 31', 1961, pp. 763-771.
5. Cheselske, F..J., Chaiken, R. F., and Sibbett, D. J., "Oxidation ofAmmonia in Opposed-Jet .Diffusion Flames", in preparation for publication(1965). -.
6. Pandya, T. P. and Weinberg, F. J., "The Structure of Flat, Counter-FlowDiffusion Flames", Proc. Roy. Soc., ud. 279A, 1964, pp. 544-561.
7. Rosenthal, D., "The Theory of Moving Sources of Heat and Its Applicationto Metal Treatments", Trans. Amer. Soc. Mech. Eng., Vol. 68, 1946, pp.849-866...
8. Zeldovich, Y. B. "On the Theory of Combustion of Initially Unmixed Gases",J. Tech. Phys., Moscow, Vol. 19, No. 1199, 1949; NACA Tech. Transl. 1296,1951. J
9. Spaldin ,.DI B.$"A Theory of the Extinction of Diffusion Flames", Fuel,Vol. 33, No. 3, 1954, pp. 255-273.
-21-

Report 0372-03YApperMax D
SCHTIC REPRESENTATION 0F OPPOSED-JET DEIFI FIAIS
Figure 1
0 -
Fz4

Report 0372-0]!Appendix D
a nd Yv/PD /yPotted Versus f
Figure- 2
2..0
1.5
1.0
0.5-.,.h~ii*5
0
-0.5 i
-1.0
-1.5
0 - .2 . .6 .8 1.0f
Report 0372-01P
APPEIX D
Figure 3
COMPARISON OF CALCUIATED NAXIWN VOI SHICREACTION RATES IN OPPCD.-T DIMFSION FIlAN
Kmximum Volumetric Reaction VolumetricAFS Rate. -/c= 3-sec Rkte of
(d) ( a?) ____ H Rec,-sec (.-,,W=W
C3H8 t r (a) 0.057(-) 0.,3 0.036 0.096 1.63r
C3H .- 02 (b) 0.216(-) 10.0 8.1 15.6 265.0
NH3-C12 (c) 0.36(-) 1.30 3.67 1.24 3.35
NH3-02 (c) G.47(-) 2.20 7.35 16.0 55.0
NH3 N (c) 0.46(-) 0.65 2.93 2.5 6.15
N- 20 o.67(+) 2.35 1.5 12.0 21.4
(a) Reference 1
.(b) Reference 3
(c) Reference 5
(d) The (+) or (-) notation refers to the position of the initial stable flame;(+) referring to the fuel, jet side of the aerodynamic center and (-) to theoxidant jet side.
(e) Calculated by multiplying Rr,x by the heat of combustion of the fuel.

Report 0372-01FAppewlix D
PATIO OF PROPORTIONALITY CONSTUA PWLTSDVERSUS faFigure 4
0
0
0
0
0
0 co 0
Rto Ccl f at 41 f
Vi*
H 0
Rai [i C-/
.... ,
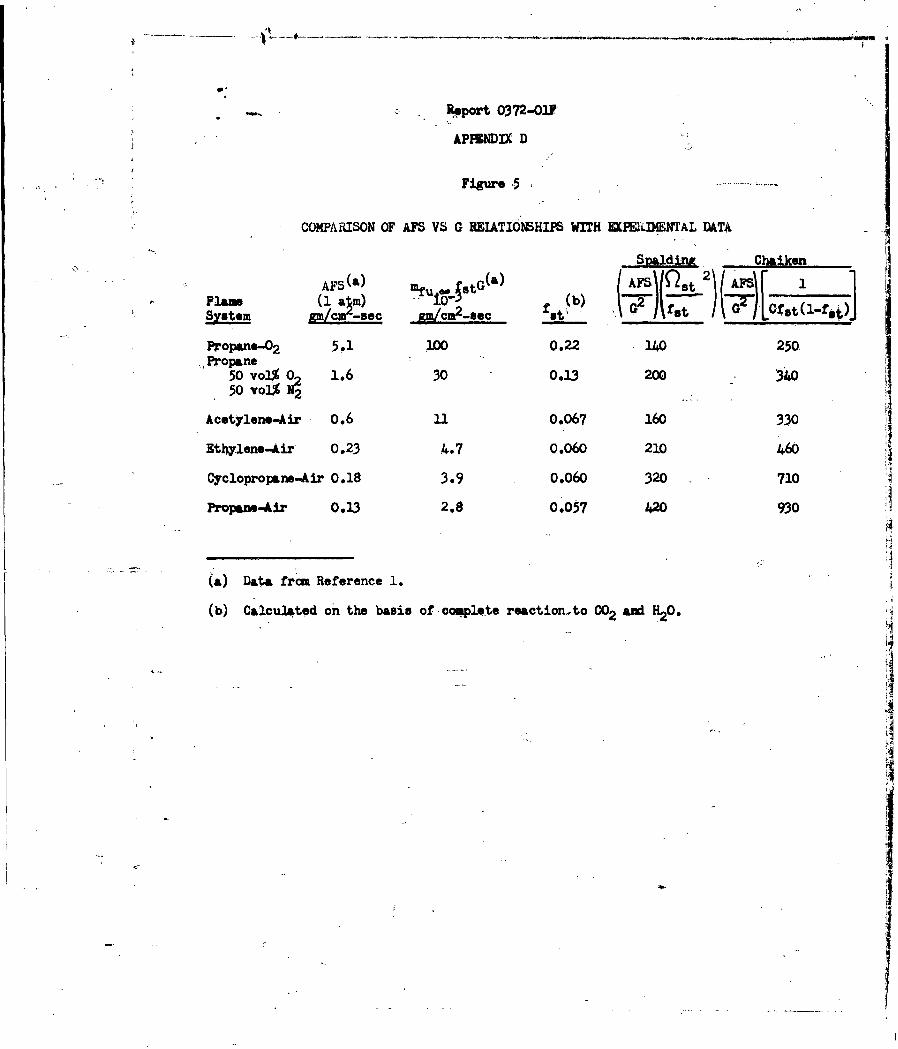
-Aport 0372-01
APENDfIX D
Figure .5 .........
COMPARISON OF AFS VS G REIATIONSHIPS WITH EU1i14ENTAL DATA
SDaldina Chaiken
mF(A fu..sjtG(Q (A3r 2 Fpano (I ab) (at 2 )( -4s1
_ . = _ a - ' _ _ _ __ , st.-
Propane- 2 5.1 100 0.22 140 250Propane 2
50 volo 1.6 30 0.13 200 34
Acetylene-Air 0.6 1. 0.067 160 330
Ethylene-Air 0.23 4.7 0.060 210 460
Cyclopropan-Afr 0.18 3.9 0.060 320 710
Propaw-Air 0.13 2.8 0.057 420 930
(a) Data from Reference 1.
(b) Calculated on the basis of complete reaction-to 002 and H20.
20

Report 0372-OIFAppendix E
(To be Published in the Journal of the AmericanInstitute of Aeronautics and Astronautics)
A MODEL FOR LOW PRESSURE
EXTINCTION OF SOLID ROCKET'MOTORS*
R. F. ChaikenTechnical Consultant
Aerojet-General CorporationAzusa, California
* This work was supported in part by Aerojet-General Corporation,Solid Rocket Research and Development Division, and in part by theAdvanced Research Projects Agency under Contract AF 49(638)-851monitored by the Air Force Office of Scientific Research,
I .... .....I

,Gport 0372-OW~APF6= 3
NOMENCLATURE
Rocket Chamber Parameters
A - propellant burning area
A - nozzle throat areat
CD - nozzle discharge coefficient
P - chamber pressure
P - critical chamber pressure for onset of "low frequency"cr instability
P . extinction chamber pressure
V - chamber volumec
L* V /Ac t
Propellant Parameters
r. - propellant burning rate
n - steady-state burning rate pressure exponent, r =cP
-- /Op - propellant density
'PDL - low pressure stable deflagration limiti4
M- average molecular weight of gaseous combustion products
T- adiabatic flame temperature of propellant
T - a temperature palT'amter which is approximated by the adiabaticg
flame temperature of the ammonium perchlorate monopropellant
flame,.
k rate constant for the ammonium perchlorate monopropellant flameg
reactions, kg= A exp (-E /RT
Miscellaneous Parameters'
g - gravitation constant
R - gas Constant
t - time- critical time constant
-1-

Report 0372-0
APPMI I
INTRODUCTION
Anderson, Strehlow and Strand' have shown that vacuum firings of
solid propellant rocket motors using regressive burning grains exhibit a low
pressure burning limit which is generally higher than the low pressure stable
deflagration limit of the propellant as determined in a Crawford bomb strand
burner. Their studies with ammonium perchlorate composite propellant with
varying aluminum content suggest that the extinction pressure (Pe), while
independent of burning geometry, is strongly dependent upon Al content and
motor L* (ratio of chamber volume to nozzle throat area)._, Their data could
be curve-fitted by an expression of the form
L,* = A(Pe U- ()
where the constants A and OC varied with Al content.
For non-aluminized propellant, the value of the exponent oC was
approximately twice the value of the steady-state burning pressure exponent (n)
at the pressure P . In this case, equation (1) becomes almost identical to
theoretical expressions derived by Akibo and Tanno, Sehgal and Strand, and
Cohen for describing the critical pressure (P cr) for onset of "low frequency"
combustion instability, i. e.,L ', = A'(P )_ (2)
cr
The theoretical derivations considered the instability as arising from
a coupling between the lag of burning-rate response due to the propellant thermal
gradient, and the lag in exhausting the chamber due to nozzle flow.
The strong resemblance between. the theoretical and empirical expressions
suggested to these authors 1' 3, 4 that-the critical pressure for onset of unstable
burning (i. e., Pcr) should correspond to the observed extinction pressure
(i. e., Pe). However, there are two serious discrepancies which arise from
this approach:
1) The value of OC for the case of aluminized propellants (8-16%) is much
greater than 2n; and 2) The extinction pressure is. zero for an infinite L*. Since
in a Crawford bomb, L* can be constrUed as approaching infinity,. i t .m ig e
expected that P should have a limiting value approaching the low pressure stablee
deflagration limit.
-2.
rI
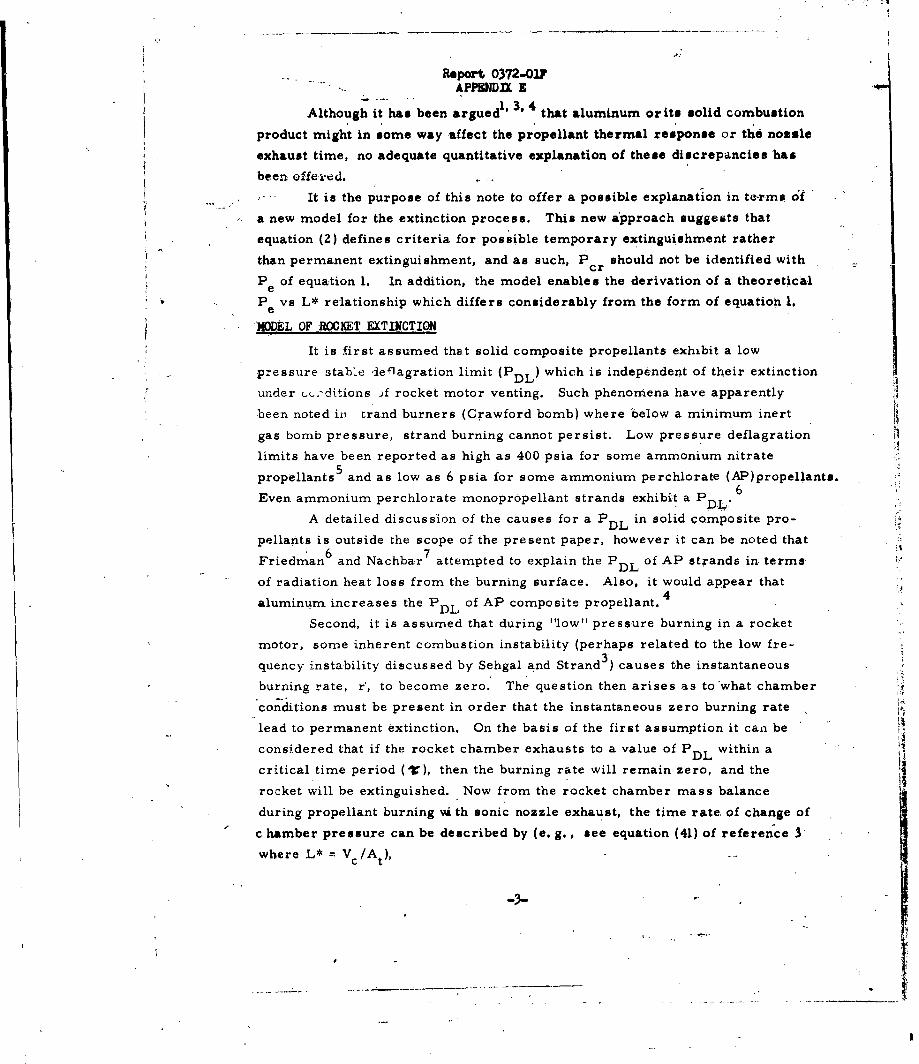
. Report 0372-01PAPPENDIX 9
Although it has been argued' 3,4 that aluminum orits solid combustion
product might in some way affect the propellant thermal response or the nossle
exhaust time, no adequate quantitative explanation of these discrepancies hasbeen offered.
It is the purpose of this note to offer a possible explanation in te-rms of
a new model for the extinction process. This new approach suggests that
equation (2) defines criteria for possible temporary extinguishment rather
than permanent extinguishment, and as such, Pcr should not be identified with
P of equation 1. In addition, the model enables the derivation of a theoreticale
P vs L* relationship which differs considerably from the form of equation 1.e
S"MODEL OF ROCKET EXTINCTION
It is first assumed that solid composite propellants exhibit a low
pressure stable deflagration limit (P which is independent of their extinction
under (-u.-ditions if rocket motor venting. Such phenomena have apparently
been noted in trand burners (Crawford bomb) where below a minimum inert
gas bomb pressure, strand burning cannot persist. Low pressure deflagration
limits have been reported as high as 400 psia for some ammonium nitrate5propellants and as low as 6 psia for some ammonium perchlorate (AP)propellants.
Even ammonium perchlorate monopropellant strands exhibit a P 6DL
A detailed discussion of the causes for a P in solid composite pro-DL
pellants is outside the scope of the present paper, however it can be noted that6 7
Friedman6 and Nachbar 7 attempted to explain the P DL of AP strands in terms
of radiation heat loss from the burning surface. Also, it would appear thataluminum increases the PDL of AP composite propellant.
Second, it is assumed that during "low" pressure burning in a rocket
motor, some inherent combustion instability (perhaps related to the low fre-
quency instability discussed by Sehgal and Strand3 ) causes the instantaneous
burning rate, r', to become zero. The question then arises as to what chamber
conditions must be present in order that the instantaneous zero burning rate
lead to permanent extinction. On the basis of the first assumption it can be
considered that if the rocket chamber exhausts to a value of P within aDL
critical time period (T), then the burning rate will remain zero, and the
rocket will be extinguished. Now from the rocket chamber mass balance
during propellant burning vi th sonic nozzle exhaust, the time rate of change of
c hamber pressure can be described by (e. g. , see equation (41) of reference 3
where L* Vc/At),
-3-
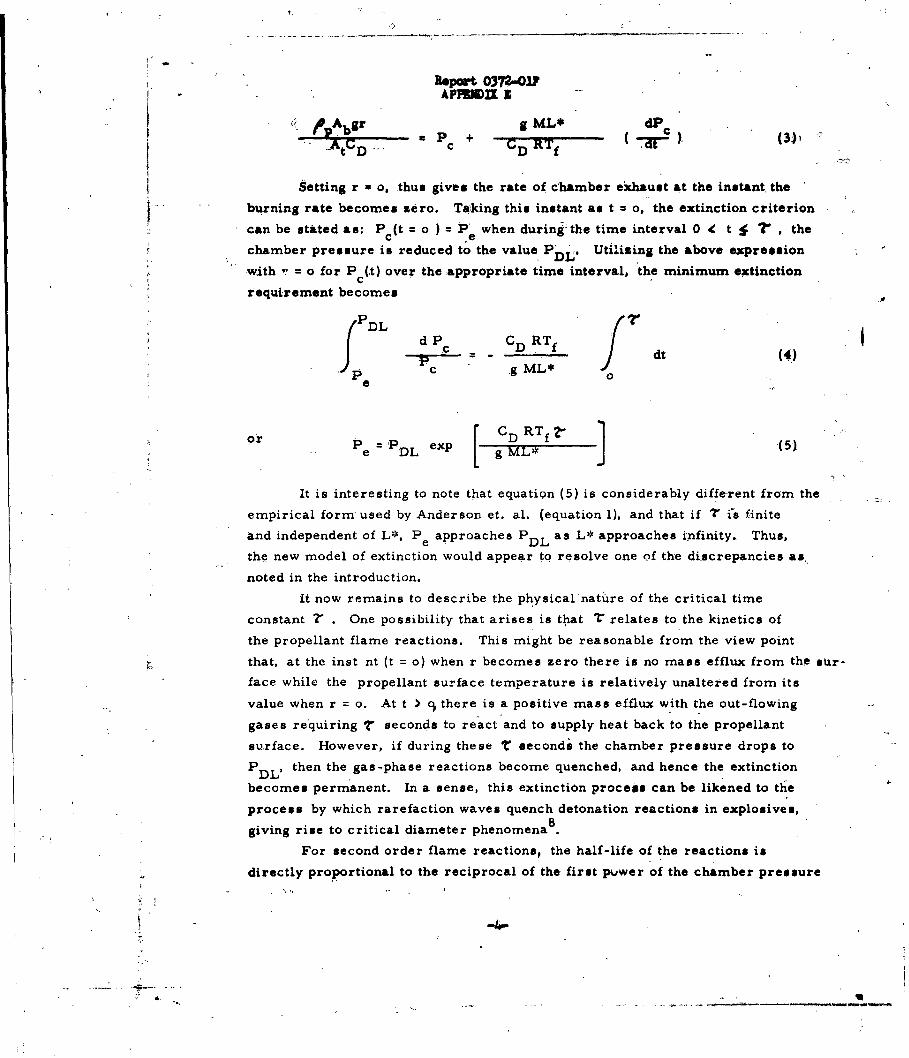
Rpawt 0372-"1
APPM3M Z
&r A gML* dP c
D .c CD RTf 7ar)
Setting r = o, thus gives the rate of c-hamber exhaust at the instant the
burning rate becomes zero. Taking this instant as t = o, the extinction criterion
can be stated as: P (t =0) = P when during-the time interval 0 . t ? ,the
chamber pressure is reduced to the value PD'" Utilizing the above expression
with ' = o for P (t) over the appropriate time interval, the minimum extinction
requirement becomes
f DLrd P C RT (
SJ dt (4)P c gML*
e
orC D RTf r"
or Pe = DL exp g ML* 1 (5)
It is interesting to note that equation (5) is considerably different from the
empirical form used by Anderson et. al. (equation 1), and that if " is finite
and independent of L*, Pe approaches PDL as L* approaches infinity.. Thus,
the new model of extinction would appear to resolve one of the discrepancies as
noted in the introduction.
It now remains to describe the physical'nature of the critical time
constant ? . One possibility that arises is that *T relates to the kinetics of
the propellant flame reactions. This might be reasonable from the view point
that, at the inst nt (t = o) when r becomes zero there is no mass efflux from the sur-
face while the propellant surface temperature is relatively unaltered from its
value when r = o. At t ) c there is a positive mass efflux with the out-flowing
gases requiring "2 seconds to react and to supply heat back to the propellant
surface. However, if during these T seconds the chamber pressure drops to
PDL' then the gas-phase reactions become quenched, and hence the extinction
becomes permanent. In a sense, this extinction process can be likened to the
process by which rarefaction waves quench detonation reactions in explosives,8giving rise to critical diameter phenomena
For second order flame reactions, the half-life of the reactions is
directly proportional to the reciprocal of the, first pvwer of the chamber pressure

Report 0372-01?APPKNDX B
(e.g., see reference 9); hence, identifying with the half-life of the ftme
reactions yields
'c
For the case where the ammonium perchlorate gas-phase redox
reaction controls the flame kinetics ("thermal layer" theory of combustion
the constant / can be equated to 2 RTg/ kg, where Xg refer., to the rate c onstant
of the NH3 + HClO 4 flame reaction at the temperature Tg, approximately theadiabatic flametemperature for this reaction.
Using the above expression for r , equation 4 becomes
p = exp P L (7e DL L,
where E C DRTf //gM is a constant for any given propellant composition.
To test the possible validity of equation 7, the data of Anderson, et. al.
have been plotted as log Pe vs. (L*P e' in figure 1. It is readily seen that the
theoretical expression offers a reasonably good fit to the data. Also, it is noted
that for JPL 534 and 540 ( ., 0%6 Al), extrapolation to infinite L* gives a valueIof PDL 8 psia in good agreement with the reported value of PDL = 6 psia.
Similar extrapolations for the propellants containing 8%6 and 16% Al
yield higher values of PDL (29 psia and 42 psia respectively) as might be expected..
Unfortunately, Anderson, et. al.., did not report PDL values for these propellants
so that a more precise comparison of results can not be made at this time.
It is interesting to calculate the expected order of magnitude of. E when
2 RT /.k . Although the value of k to be used in 'this expression is quiteg g g 10uncertain, it can be estimated from previous work that a reasonable order of
magnitude is k el109 cm /mole-sec. Using this value and reasonable estimatesg 2.
of the other parameters, * E is approximately 10 inch-psia. The slopes of the
curves of Figure 1 (i.e., experimental E) lie in the range of 1.6 x 10³ to 4.0 x 10³
inch-psia (increasing with decreasing Al content), which differ from the
theoretical calculated E by less than a factor of 100. In view of the gross
uncertainty in kg, this comparison of theoretical and experimental E can be
considered favorable but not necessarily significant. However, assuming the
10 (sec) ; R = 8. 31 x 10 erg/deg-mole = 82 cm -atm/deg-mole;
M 30 gm/mole; g = 980 cm/sec ; Tf = 3000 K; Tg = 1400 K.
-5-

Report 0372-01?4PE. X 3
calculations to be reasonably valid, it would suggest that increasing :, dent
may cause an increase "n the affective temperature at %hlch the bulk of
AP redox flame reactions occur (i. e., Tg)*. Alternatively, it ma, be
speculated, that the nosle C.ischarge roeffir lent (Cr.) decreases as thc amo,
of solids in the exhaust increases. In, eiW.er case, there is insufficient data
at this time to allow tor a more precise account of the eftect of aluminum on
the L* vs. P relationship.e -
CONCLUSIONS
The model of solid rocket extinction presented here would appear to
resolve some of the difficulties which are apparent when attempting to-identify
criteria for "low frequency" ombustion instability with low pressure extinction
criteria. The model also enables a treatme nt of extinction in terms of the
kinetics of the propellant flame reactions, yielding a new form of equation for
relating motor L* and extinction pressure, whicn is in satisfactory agreement
with the available data. However, it is clear that the exisiting data encompasses
only a narrow part of the spectrum of experimental res.ults required for an
adequate test of thie or any other thernreticaJ treatment.
In the case being considered E ; R T T /gMk with k A exp (-E /RT Y.D fg g g g g gThe exponential dependence of k on temperature in the denominator will
outweigh the linear dependence in the numerator.

REFERENCES
* 1. Anderson, F. A., Starehlow, Rt. A. and Strand, L. D., "Low pressurerocket extinction," "AIAA Journal 1. P6694671 (1963).
2.. Akiba, R. and Tanno, K., "Low frequency instability in solid ppopelUantrocket motors, "1 Proceeding a of the First Symposium (International) onRockets and Astronautics (Thokyo, 1959) pp. 7 4-8Z.
I . Sehgal, R. and Strand, L., "A theory of low-frequenicy combustioninstability in solid rocket motors", AIAA Journal 2., 696-702 (1964).
4. Cohen, N. S., "Solid propellant extinguishmaent by pressure perturbation"unpublished work at Aerojet-General Corporation, Solid Rocket Researchand Development Division (1964).
5. Andersen, W. H., Bills, K. W., Mishuck, .,Moe, G, and Schultz,R. D., "A modeil describing combustion of solid composite propellantscontaining ammonium nitrate, "1Combustion and Flame 3, 301-318 (1959).
6. Friedman, R., Levy, J. B. and Rumble, K. E., "The me hanism ofdeflagrationi of pure ammonium perchlorate. "1Atlantic Research Corp.,AFOSR-TN-59--173, Contra'ct AF 18(600)-1502 (February 1959).
7. Johnson,, W. E., and Nachbar, W., "'Deflisgration :l1mits in the Oteadyllinear burning of a monpropellant with application to ammonium per-chlorate, "1Eighth Symgosium (Interng.tiona1) on Combustion. (Williamsand Wilkins, Co., Baltimore, Mdz, 1962) pp. 678-689.
8. Eyring, H.,* Powell, R. E., Duffey, G. H. and Parlin, R. B., PThestability of detonation," Chem. Rev.. 45, 69-181 (1948).
9, Chaiken, R. F., "A thermal layer mechanism of combustion ofisolidcomposite propellants: application to ammoniium nitrate propellants".Combustion and Flame 3, 285-300 (1959).
*--*10. Chaiken, Rt. F. and Andersen, W. H., "The role of binder in c~mpobitepropellant combustion, "ARS Progress in Astronautics and RocIk*tgriSolid Propellant Rocket MResearghj- -ditid'by hie GS "_wlaew CAKa4ericPress, New York, 1960), Vol. 1, pp. 227-249.
-7-.

Report 0'-072-i
I1 100"
70-
0--
50--
20-- a,-
J* 4n
3 3D
2"
P4
5 -- -
P4a
M 10 VARIATION OF EXTINCTION PRESSURE WITH L*
r. e PDL LeJp
5~~ JPL 54 (2% Al)% l
4 JPL 54o Mod A (8% Al)
7 JPL 540 (16% Al)
3 Note: Data points determined frorsmoothed curve of form logL* I log A- @ log P which wasfit to experimental data by
2 Anderson, et. al. (Reference l)
10 20 30 40 - 50 60
(L*P )- (inch-puia)-i lO.-5 r
: ... Figure.i

Report 032.1
APPENDI F
DMLICATION OF A STEALY-STATE SOLID MML U COD
MUL TO A LOW PR1SSURE DEFIA(ATIOII LIMT
R. F. ChaikenTechnical Consultant
Aerojet-General CorporationSacramento, California
I. ITOUTO
Mare experimental and theoretical studies on solid propellant
combustion, have led to a concept of combustion in which the a l ,ingrediopts
gasify under the thermal influence of a flame to form reactive species
which then undergo gas-phase redox reactions to propate that flame.
The uos-flow and energy of each reaction in the buriing process is of
_-necessity coupled to each other by the conservation equations. Several
mathemtical models of varying complexity have been developed to describe
the steady-state coupling process(I-6), but few theoretical studies have
been.mde of extending these models to low pressure deflagration limits.
A notable exception to this is the work of Johnson and Nachbar ( 7 )
in describing the pressure deflagration limit (PDL) of burning strand. of
ammonium perchlorate (AP) monopropellant. These authors attempted to
ascribe the low PDL of AP strand burning to radiation heat losses from the
burning surface. Unfortunately, the detailed rigorous treatment .given, which
reqires nminerical methods of solution, cannot be readily extrapolated
to the problem of low pressure extinguishment of composite propellant
A somwhat simpler approach to the PDL problem can also be
obtained from the two-temperature postulate and thermal-lqer treatnt

Report 0372-01F
APFEMDZI F
of steady-state cobtustion(2-4). This somewhat heuriatic, trantmnt of
composite propellant burning yields a generalized. burning rate amprassicu
in terms of parameters which can, be readily 'related .to-,the hemical kinmt s
processes occurring during combustion. It is the. purpose of this, ncQt
to snow that this treatment also leads directly to aamniabang--.rats
with implications towards a low pressure deflagration limt.
II. THE TWO-TEEMATE AMD THCMML IATER THDRI OF SOLID MOFKULNCO1MBUSTION
Basically, the "twotemperature" postulate of composite. solid
propellant combustion, as stated by Schultz and Dekker 8 , proposed- tkat
the decompositions of oxidizer and binder are nearly independent proce~seas
when viewed on a microscopic scale. This concept aroas. .a..&. caon
of the temperature necessary to achieve equal rates. of linear .eessiom for
the oxidizer and binder components separately. During steady state burain,
the mean rate of linear regression of oxidizer, B is .IeqaJ to. the -man 14=a0'
rate of consumption of the binder surface B b and both. are equal to Mls .s
linear rate of burning of the propellant Bp, or,
Bp = As O exp(-Es, /RTs,o) = Asb exP(- ,b/RTs,b) (L)
where the. linear rates of regression are expressed in .tzmas of Arrhenius Fate
equations. Since the pre.exponential factors, A and the activation. e.nrgis.,
E are generally unlike for the oxidizer and binder Lespectively, it fclLes
that the surface temperatures at which these components decompose must be
different..
In attempting to formulate a mathematical model of the .burning poocess,
a steady state has been assumed. The two-temperature concept .s applied
to umke possible. the asslgusnt of definitive temperature and heat tranau
-2.
0

Report 0372-01?
APPNDTX F
boundary conditions. As applied to ammonium nitrate ,capoeite p 6oelstso
the wecairn took the :form of four idealized steps.(2)
(1) Gasification of the dxidisz.-by a kinetic rate
controlling step which involves surface dqsorption (.endothermic reaction).
(2) Oxidation-reduction gas phase rs.ctions of the -4,44
pyoylsis. products to establish a flame. (exothermic reaction)
(3) Pyrolysis of binder in the established flae Cendo-
therm c reaction).
(4) Gas phase reactions of oxidizer and binder pyrolysis
products (exothermic reaction).
For AN propellants, exothermic reactions between the initial pyrolysis
products of 1H4 MN3 (HNO 3 and NH 3 ) are assumed to occur in the gas phase,
establishing a flame zone wit-h'a maximum temperature of about 12500K. Heat
from this. flame causes gasification of the birdler. EvntualIly, binder and
oxidizer decompositi'on products react in a diffusion flae at some distance
from the surface. There is evidence that little heat from the outer
diffusion flame gets back to the decomposing surface. For exampis, sub-
stitution of polystyrene binders of drastically different decomposition rates
had little or no effect on the burning rates of the propellant. Since large
variations in binder decomposition properties should greatly effect the outer
diffusion flame, it has been assumed that the surface is heated mainly from Ithe redox flame close to its surface. The inner flame layer which is
believed to heat the surface of the propellant, causing decomposition, has
been named the "thermal layer".
From considerations of the boundary value problem of steady-state
heat transfer by thermal conduction across the thermal layr , it ws
-3-

Report 0372-01F
APMDIX F
shown that the thermal layer-thicknesm, (5 can be apWpzrimatd
6 -Mr / [ + ro/ViTI, (2)
where r. is the average paAtie radius, .K is the average .thermal. diffrsivit .--
of the gaseous. medium, Tis the half life of the gas phase redox re&tion , a
(X is a proportionality constant of the order of unity. Essentially 6 is
determined .by the velocity with which the gas expands away fromthe surface,
which in turn is proportional to the rate at which the gas phase reactions
take place.
The thermal layer thickness is a function of presaure, since
K = M '/C (3)p *g
where N is the average molecular weight of the gases, Uis the average thermal
conductivity of the gas phase, g is the total density of the gase ,and Cp
is the average molar heat capacity.
If the redox gas reaction is. second order
_T l/Cgkg = 2M/ Pgkg (4)
where Cg is the concentration of one of the gaseous reactants and k is the
rate constant for the redox reaction. These expressions yield
6 0."-"= ° (5)
6 1 + r 7)
R Tg [2X'
where R is the gas constant, P the pressure and Tg the temperature at which
the gases react. 0 and Tg may be considered as. constant for a given gas-
phase redox reaction.
.-4
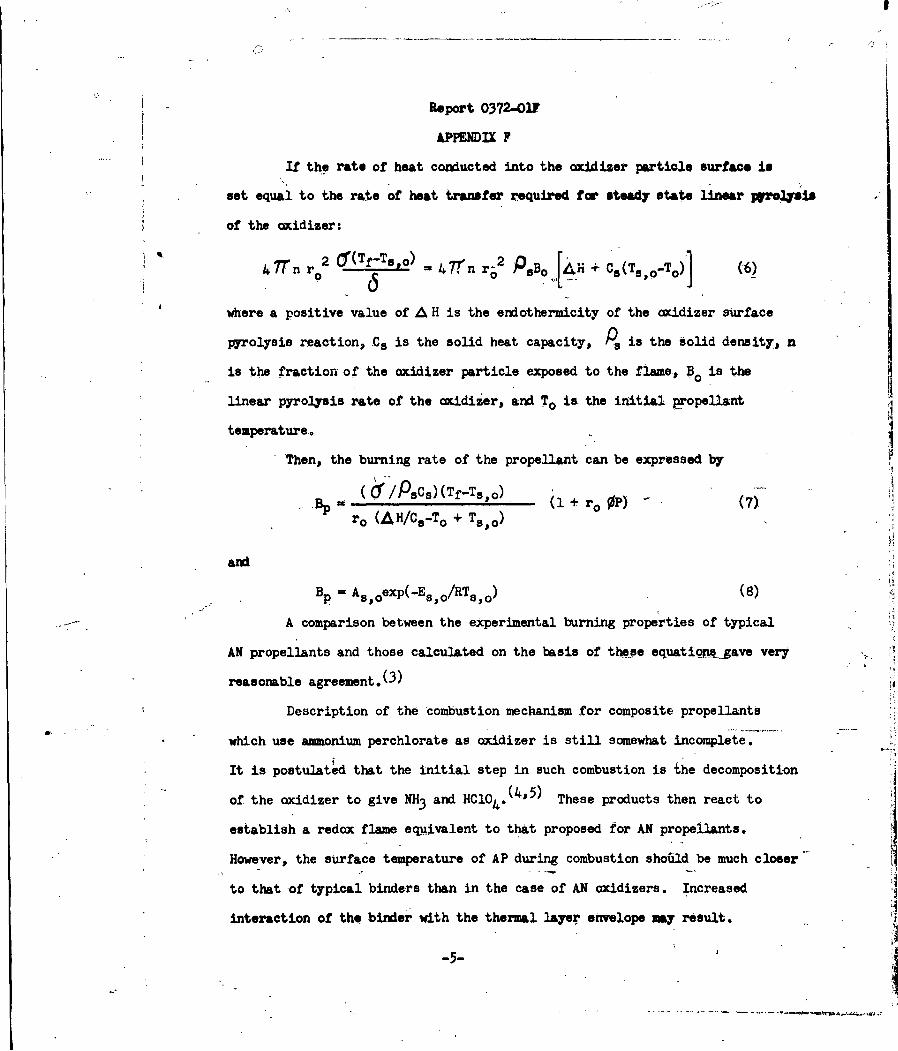
e
Report 0372-OWF
APPENDIX F
If the rate of heat conducted into the oxidizer particle surface in
set equal to the rate of heat transfer required for steady state linear plpisi
of the oxidizer:
47nr 2 O'(Tf-Tspo) -lnr 2 P5B + Cs(T 5,s o) 6
6where a positive value of A H is the endothermicity of the oxidizer surface
pyrolysis reaction, CS is the solid heat capacity, P is the solid density, n
is the fraction of the oxidizer particle exposed to the flame, B0 is the
linear pyrolysis rate of the oxidizer, and To is the initial propellant
temperature.
Then, the burning rate of the propellant can be expressed by
(Y /-'sC.) (Tf-T., 0) .-Bp (/csT+, 0 (1 + ro P) (7).ro (AH/Cs-To + Ts'o) .
and=A Oo(8)
p Aoexp(-Es,o/RTso)
A comparison between the experimental burning properties of typical
AN propellants and those calculated on the basis of these equatioM._gave very
reasonable agreement.(3)
Description of the combustion mechanism for composite propellants
which use ammonium perchlorate as oxidizer is still somewhat incomplete.
It is postulated that the initial step in such combustion is the decomposition
of the oxidizer to give NH3 and HCIO4 .(4o5) These products then react to
establish a redox flame equivalent to that proposed for AN propellants.
However, the surface temperature of AP during combustion should be much closer
to that of typical binders than in the case of AN oxidizers. Increased
interaction of the binder with the thermal layer envelope my result.
--5-J

Report 0372-OlF
APPDUIX F
Chaiken and Andersen() have discussed the role of binder and its effect an
composite so=d propellant combustion.
For the Lparticular case where binder dif fuses.. into the. themeal layer
and reacts suddenly at the- temperature Tg, the role of binder can be. coa sidted
to be one of raising the effective flame temperature, i.e.
Tf = Tf,o + C (9)
where Tf.0 is the pure oxidizer flame temperature and C is the effective
increase in that flame temperature. It is noteworthy that C should depez_
upon the diffusion coefficient, and hence be inversely proportional to the
pressure. Also, there is a maximum value of C such that Tf should not
exceed the maximum adiabatic flame temperature for the propellant comppsition.
(9)This treatment is in good accord with the burning rate data of Bastress et .al,(
These authors found that at higher. burning pressure (~1000 psi), AP
composite propellant burning rates approached those of pure AP (i.e.,
C--*'0 as preisure increased).
It has also been pointed out(4,lO) that preceding the decomposition
of AP in combustion, small regions of the crystal undergo partial decomposition
by exothermic solid phase reactions. These reactions are believed to occur
in the intermosaic (defect lattice) crystal structure. Heat release by such
presurface reactions would lower the overall end othermicity of the oxidizer
gasification. It is still uncertain as to whether or not this effect is
pressure dependent. However, from Unpublished studies at Aerojet,(ll), it
would appear that the effect is independent of pressure at normal burning
pressures (i.e., < 1500 psi).
.4

Report 0372IP1
APPZDIX F
III. APPLEATION TO A IWW PRE SURE EFIAGRATION LIMIT
In applying, the thermal layer treatment of steady-state coaaation to
the problem, of a low pressure deflirition limit, it will be..instintive
to first consider the case of a monopropellant oxidizer whose surface tamparstare
is relatively independent of pressure. In. this case. the b rt e- as ai
of pressure is simply
B- bAT(l + r;O0) f(1)r o C
where, b, C and .AT are constant, independent of pressure and oxidizer
particle size. The function B(P) represents the entire set of values of B for
which solutions to the boundary value problem representing steady-state
combustion exist. It is readily seen that as P-3 O, B approaches a ini
finite value greater than zero, i.es,
Bin- b ATro C (11)
Thus Bmin can be considered the minimum steady-state burning rate of
the propellant. Now, if one considers in the heat balance expression of '1
equation (6) the existence of heat loss terms such as radiation, conduction,,
etc., it is obvious that Bmi will occur at some pressure P > 0. This Ipressure, which would be defined by the type of heat loss terms, would be the
low pressure deflagration limit, PDL" An expression for PDL can be found by
rewriting equation (6) (while keeping the approximtions noted above) a
r ro b T r 2 BC+ HL
where HL is the additional heat loss term. Solving for the pressure, we have
-7-
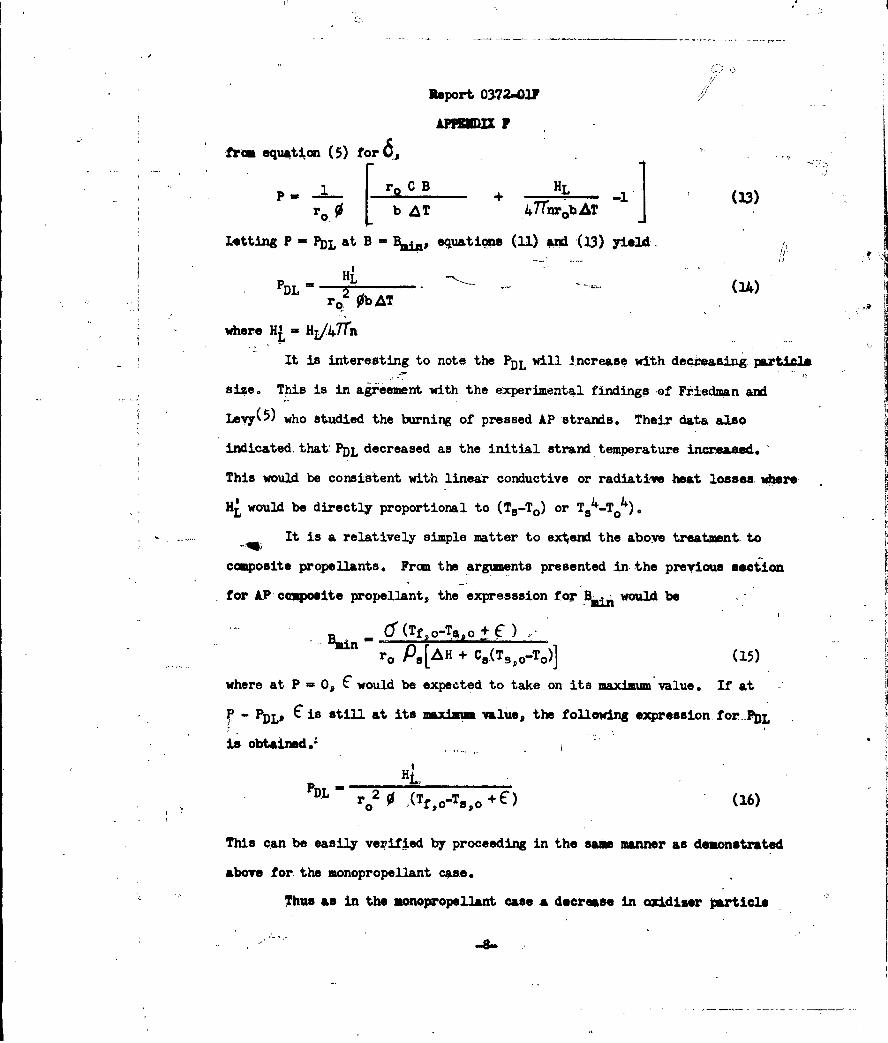
rri
Report 0372-O.IF
fra equation (5) for 6 , ... ,
p 1 ro C B HL
r 0 b AT 4 7rnrb,AT
Ltting P - PDL at B Bms.i1 , equations (11) an (13) yield,
PDL = HL " ,. (1),. ro2 0bAT .
Swhere HL - HI47n
It is interesting to note the PDL will increase with dec'reasing particle
size. This is in agreement with the experimental findings of Frfiedman and
Leg(5) who studied the burning of pressed AP strands. Their data also
indicated, that: PDL decreased as the initial strand temperature increased.
This would be consistent with linear conductive or radiative heat losses where
Hil would be directly proportional to (Ts-To) or Ts-To
It is a relatively simple matter to ex1end the above treatment to
composite propellants. From the arguments presented in. the previous section
for AP cempoite propellant, the expreassion for would be
B~n - (.Tf,o-T.,o+E) ("i:)
ro Ps[AH + Cs(To-To)]
where at P = 0, E would be expected to take on its maximum value. If at
P DL' C is still at its maximm value, the following expression for- PDL
is obtained,-
oL r 2 o (Tfo-T,o +C) (16)
This can be easily verified by proceeding in the same manner as demonstrated
above for the monopropellant case.
Thus as in the monopropellant case a decrease in oxidiser particle

Report 072-W
APFlDII .F -
size and/or a decrease in initial propellant temperature should. ause -an
increase in PDL o
Mow C. Ciapluch(12 ) has studied the extinguishmant of '.MAnig
propellant during a rapid pressure decrease. He found that propellants
based upon. nmaae oxidizer particles required more rapid rates of pressure
decrease to effect eztaient than did similar propellants based. upon
finer oxidimer particles. That is to say, the propellant became more difficult
to e4inguish as the oxidizer particle size was increased. This might also
be interpreted as indicating that burning was more stable at low pressures
with propellants based updn the larger size oxidizer particles, and, hence
such propellants have a smller value of PDL o This hypothesis is in. agres-
wnt with the expression derived above for PDL (io e., equation, 16). if
we follow the ma type of reasoning, we might expect that, since 0 for
AP is believed to be greater than 0 for AN (4), AN propellants would be
easier to extinguish than AP propellants. It is well known that it is
difficult to obtain AN propellants which burn at low pressure.
Another point of interest with regard to the variation of propellant
.- extnguishability with oxidizer type, is the effect of exothermic surface
reaction. As indicated previously for AP propellant, such reactions can be
considered to effectively decrease the overall endothermicity of the oxidizer
surface pyrolysis reaction. Alternatively, exothermic surface (or substrate)
reactions can be considered as heat sources within the oxidizer which in effect
act in an opposite manner to the heat loss terms, i. e., they will cause
a decrease in the value of HL in equation 16. Thus, it might be expected that
propellants based upon oxidizers (or binders), which will undergo partial
exothernic reaction in the solid-phaseo will have a low ftL, and hsnce will
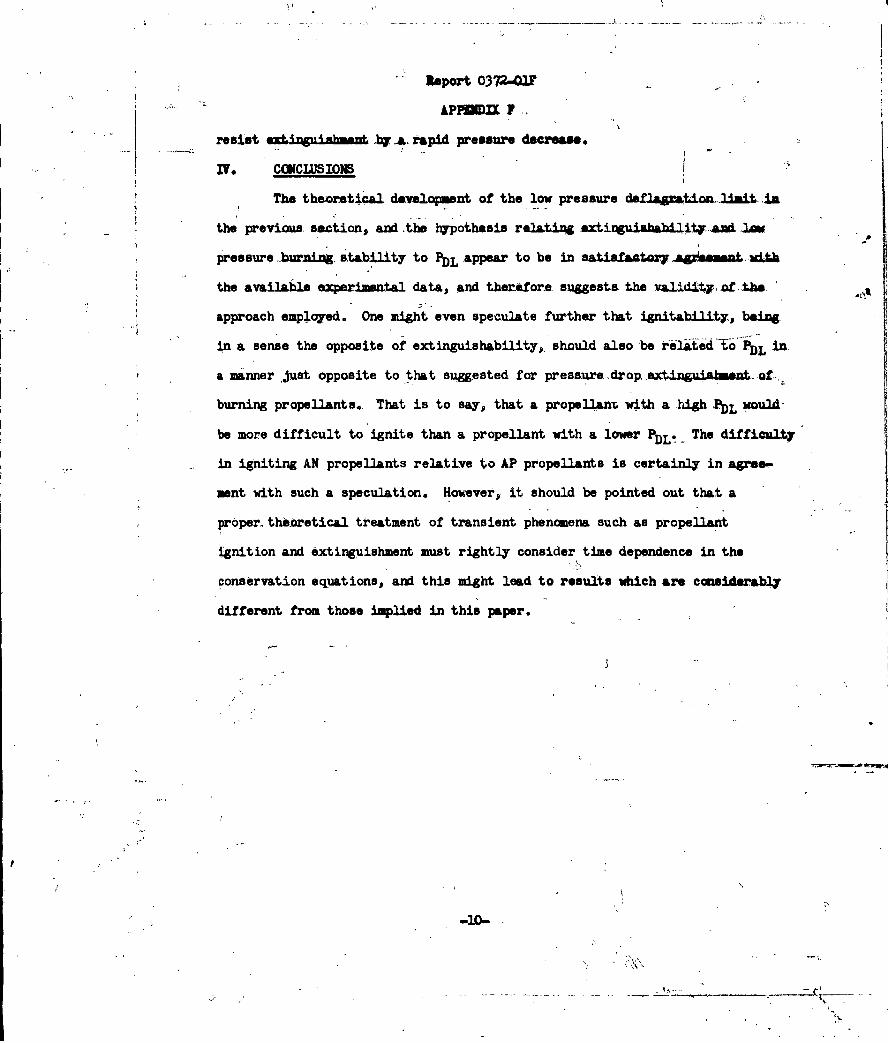
Report 0372-O2..... AFFUDIX F
resist extinguJabnt ' a, rapid pressure decrease.
IV. CG1CLUSIOS IThe theoretical davalopment of the low pressure def amaion-limit-in
the previous section, and .te hypothesis relating .xtirguiahebLli tv And "
pressure burning stability to PDL appear to be in satiafltaatory &Amsn. -vit
the available experimnwtal data, and therefore suggests the valdi.ty-of -the
approach employed. One might even speculate further that ignitability, being
in a sense the opposite of extinguishability, should also be relatedto n
a manner Just opposite to that suggested for press.ure.drop, extinguis mt.. of...
burning propellants. That is to say, that a propslUanx, with a gh PL would:
be more difficult to ignite than a propellant with a lower PDL*- The difficulty
in igniting AN propellants relative to AP propellants is certainly in agree-
sent with such a speculation. However, it should be pointed out that a
proper theoretical treatment of transient phenomena such as propellant
ignition and extinguishment must rightly consider time dependence in the
'conservation equations, and this might lead to results which are considerably
different from those implied in this paper.
-10-
N .- _ _ _ _ _ _ _
'V
I* ..Report 0372-03Y
APPENDL( F
REFERE,-
1. D. W. Blair, E. K. Bastress, C. E. Heriance, K. P. Hall andM. Sumerfield, Proress in AstrorAutics and Rocketr, Volos I,Solid Propellant Rocket Research, Academic Press, New York, 1960,p 183-206.
2. W. H. Andersen, K. W. Bills, E. Mishuck, G. Moe,and R. D. Schultzs"A Model Describing Combustion of Solid Composite Propellants;Application to Ammonium Nitrate," Ccmbustion and Flame, Is 301 (1959).
3. FR-F. Chaiken, "A-Thez=al layer Mechanm of Combustion of SolidPropellants; Application to Amonium Nitrate Propellants,," Combustionand Flaw, -,, 285(1959).
4. R. F. Chaiken and W. H. Andersen, "The Role of Binder in CompositePropellant Combustion," Proress in Astronautics and Rocket, ..Volume I, Solid Propellant k et Research, Academic Press, New York,1960, p 227-249.
5. R. Friedman, J. B. Levy, and K. E. Rumble, AFOSR-TN-59-173(February 5, 1959).
6. W. Nachbar, Progress in Astronautics and Rocketry, Volume Is SolPropellant Rocket Research, Academic Press, New York, 1960, p 2 06 -2 2 6 .
7. W. E. Johnson and W. Nachbar, Eighth Smwosium (International) onCombustion, Williams and Wilkins Co., Baltimore, Maryland, 1962,p 678-689.
8. R. D. Schultz, L. Green and S. S. Penner, Cobustion and Propulsion,Pergamon Press, New York (1958) p 367-420.
9. E. K. Bastress, K. P. Hall and M. Summerfield, ARS Solid PropellantRocket Conference, February 1961, Salt lake City, Utah, Paper No. 1597.
10. W. H. Andersen and R. F. Chaiken, "On the Detonability of Solid CompositePropellants," ARS Journal, 31, 1379 (1961).
11. AeroJet-General Corporation Quarterly Project Report No. 0372-01-12,Contract AF 49(638)-851, 31 December 1962 (Unclassified).
12. C. C. Ciepluch, IASATN-D1559 (Deeenber 1962).
'-n-
•-U.

Report 0372-O?
APPKDXHG
j LIST OF MRTIEN .IUTIOI
A .. CONTRACT AI 1(600)-1026 Al
R. D. Schultz and A. O. Dekke *The Absolute Thermal Decom tio
Rates of Solids', Part I, Fifth DSmosim (1nte 4 a bau1-
•Cbustion, Reinhold, New York (1955), p. 260.
R. D. Schilts and A. 0. Dekker, "The Absolute Decomposition Rates
of Solids", Part II, J. Chem. Mhn.,ls 2133-38 (1955).
R. D. Schultz and A. 0. Dekker, "The Effect of Physical Adsorption
on the Absolute Decomposition-Rates of Crystalline Ammonium Chloride
abd Cupric Sulfate Trihydrate", J. Phs.- Che., ,60, 1095 (1956).-
R. D. Schultz and A. 0. Dekker, "Transition-State Theory of the
Linear Rate of Decomposition of Amonium Perchlorate', Sixth
Symposium (Unter .tiona) on Combustion, Reinhold, New York (1957),
p. 618.
B. CONTRACT 0 18(603)-74
16 K. Barsh, W. H. Andersen, K. W. Bills, G. Moo and R. D. Schultz,
"An Improved Instrument for the Measurement of Linear Pyrolysis
Rates*, Rev. Sce I.nstr..2, 392.(1958).
W. H. Andersen, K. W. Bills, A. 0. Dekker, E. Mishuck, G. Moe, and
R. D. Schultz, "The Gasification of Solid Aonim Nitrate', J
PH I a 9
4-7 _ _. ' - -

Report 0372-01P
APTENDHG
W. H. Andersen and R. F.. Chaiken, *Application of Surface
Decomposition Kinetics to Detonation of AmixisA Mitrate', -'Jrqnal, 320 49--(1959).
'R. Fe Chaiken abd D. K. Van do Mark, mThermocouple Junction for Hot-
4Plate Linear Pyrolysis Apparatus!!., Re. Sci. Instr. P_# 375 (l9s9).'
R, F. Chaiken, 'W. H. Andersen, M. K. Barsh,i,.. Mishuck, G. Hoe, and
R. D. Schultz, "Kinetics of the Surface Degradation of Polymthyl-
methacrylate"t, J. Chem. Ebys,J,,2, 14,1 (1960).
C. CONTRACT AF 49(638)-566
R. F. Chaiken and W. H. Andersen,."The Role of Bin~der in Composite
Propellant Combustion!', Protress in Astronautics and Rocketry, Volume
4.-I, Solid Propellant Rocket Research, Academic Press, TNev York, 1960,
p. 227-249.
D. COTRACT NOr 2804(00)
R. F, Chaiken, "Comments on Hypervelocity Wave Phenomena in
Consensed Explosives", J.. Chem. Phrse., ~,760-761 (1960).
R. F. Chaiken, D.J. -Sibbett, J. E-. Sutherland,. D. K. Van de Mark
4 and A, Wheeler, "The Rate of Sublimation of Amonim Halides'".
JCG1 h.qs 233. (1962).
Report 0372-OW1
APPENDIX G
ho .. MEATED PERTINENT PUBLICATIOS
R. D. Schults, L. Green, and S. S. Penner, *Studies of the
Decomposition Xechanim,, Erosive Buring, Sonnane and Renensnee
for Solid Composite Propeliants Combustion z
sPergamon Press, New York (1958), p. 367-420.
W. H. Andersen, K. W. Bills, E. Mishuck, G. Moe, and R. D. Schulti.,
*. A Model Describing Combustion of Solid Composite Propellants;
Application to Amonium Nitratew, Combustion and Flame, 3, 301 (1959).
R. F. Chaiken, "A Thermal Layer Mechanism of Combustion of Solid
Composite Propellants; Application to Ammonium Nitrate Prellants*,-,
Combstion.and Flame, 3, 285. (1959).
SR.F. Chaiken, "A Kinetic Approach to Detonation of Homogeneous
High Explosives", Eighth Symposium. (International) of Combustion,
California. Institute of Technology, Pasadena, Calif., August 29 -
September 2, 1960, Paper No. 104. .
I. TECHNICAL MOTES AND REPORTS (UNCLASSIFIED)
A. CONTRACT AF 18(600)-1026
R. D. Schultz And A. 0. Dekker, *The Absolute Decompeltion Rate. -
of Solids"
a. Part I, OSR-TN-54-127 (1954)
b. Part II, OSR-TN-54-367 (1954) "
c. Part III, OSR-TN-55-138 (1955)
d. Part IV 06l-T-55-l4 '(1955)
-3.

Report 0372-0M1
l.D. Schultz and A. 0. Dekkers 'Transition. State Theory of the
Linear Rate of Deomposition of hmii 1wblaee
14i2 (19$5).
K. W. Bills# M. Therneaus B . ihuck, and Re D, Schultz, "The Linear
Vaporization Rate of Solid Ammonium Chloride',, OSR-TN-5.5-U-7 (19-55)..-
R. D. Schultz and A. 0. Dekker, *Advances in the Kinetics of
Decomposition, Fusion, and Sublimation of Solids", OSR-TR-35-22;
Final Report, Contract A? 18(600)-026s April 1955.
B. CONTRACT A? 18(603)-74
M. K. Barsh, 'An Improved Instrument for the leasurement of Linear
Pyrolysis Rates of Sois, AFOR-TN-57-513 (1957).
W.-H. Andersen and R. F. Chaiken, *Application of Surface
Decomposition Kinetics to Detonation of AsonimsNitrate*
APOS-TV-58-617 -(1958).
R. F. Chaiken, W. H. Andersen-, M. K. Barsh, Be Mishuek, G. Not$
and R. D. Schultz, "Kinetics of the Surface Degradati on of Poly-
methylmethacrylate"', AFOSR-TN-59-619 (1959).
C. CONTRACT A? 49(038)-573
Re F....Chaiken, 1. 0.11cr, J..E. Sutherland, and A. Wheeler, 'Sudy
of the Kinetics of Solid Phase Reaction',q APCSR-T-60-44, Much 1960;
SuimrY Final Report.
'.Report 0372-MY
r AAMI G
D. CONTRACT A? 49(638)-566 -
R. F. Chaiken and W. H. Anderseon, *The Role o" Bidtr in COMp w
Propellant Combustion", AFOSR-TN-59-540O ASTIA' Pooi"en I!o.
AD 216-5571 Aerojet Repor TM30, July 1959.
D. J. Sibbett, and J. M. Lobto, "Investig&tift of the 1oohArA,
of Combustion of Composite Solid Propell°te's A60 ', m.
April 1960; Susmary Final Report.
E. 'CONTRACT NOnr 2804(00)
R. F. Chaiken and K. J. Schneider, "Research on Kechanism. of
Detonation Processes",-Report No. 1772, Contract NOue 2804(00);
U.S. Navy, Office of Naval Research, Wahislom Do.\O. 15 March
1960.; SuIMa Report.
A/
/'/
1JI
-'U.,