ufi global exhibition barometer · the outlook of the global exhibition industry as well as on 14...
TRANSCRIPT
Barometer 19th Edition Report based on the results of a
survey concluded in July 2017
UFI Global Exhibition
Southern Africa
Global
United Kingdom
Central & South America
Mexico
US
Thailand
India
Brazil

219th UFI Global Exhibition Barometer / July 2017 ©
Contents
Introduction 03
Results by region 1. Gross Turnover Development 04 2. DevelopmentofOperatingProfits 063. Most Important Business Issues 08 4. Actions Towards Digitisation 11
Detailed results for selected countries or zones
North America: Mexico, US 22 CentralandSouthAmerica:Brazil,othercountriesinCentral&SouthAmerica 26Europe: Germany, Russia, UK, other countries in Europe 30 Africa: South Africa 38 Middle East 40 Asia-Pacific:China,India,Thailand,othercountriesinAsia-Pacific 42
Conclusion 50
Appendix Answers per country/region 51
319th UFI Global Exhibition Barometer / July 2017 © 319th UFI Global Exhibition Barometer / July 2017 ©
Introduction
Important remarks
It should be noted that the number of replies to the current survey (257from56countries-seefulllistattheendofthedocument)provides representative results. However, the consolidated regional resultsmaynotreflectthesituationofspecificcountriesinthatregion. This is why the report also includes a set of detailed results forthe14countriesorzoneswhereasignificantnumberofanswerswere obtained are included.
Questions related to this survey can be addressed to Christian Druart, UFI Research Manager, at [email protected].
This research is available online at www.ufi.org/research.
Welcome to the 19th edition of the “UFI Global Exhibition Barometer“ survey. This study is based on a global survey, concluded in July 2017. It represents up to date information on the development and theoutlookoftheglobalexhibitionindustryaswellason14specificcountries and zones. UFI began assessing the impact of the global economic conditions on the exhibition industry twice a year in 2009. In 2010, this semi-annual survey became the “UFI Global Exhibition Barometer“. For the United States, this survey includes Members of SISO (Society of IndependentShowOrganizers)andthescopeoftheResearchhassince been broadened to include members of AEO (Association of EventOrganisers,UK),AFIDA(AsociaciónInternacionaldeFeriasdeAmérica),AMPROFEC(AsociaciónMexicanadeProfesionalesdeFeriasyExposicionesyConvenciones),AAXO(TheAssociationofAfricanExhibitionOrganizers)andEXSA(ExhibitionandEventsAssociationofSouthernAfrica)inSouthAfrica,TEA(ThaiExhibitionAssociation)andUBRAFE(UniãoBrasileiradosPromotoresFeiras)in Central and South America. IEIA (Indian Exhibition Industry Association)joinedtheresearchasfromthislastsurvey.
419th UFI Global Exhibition Barometer / July 2017 ©
Gross Turnover Development
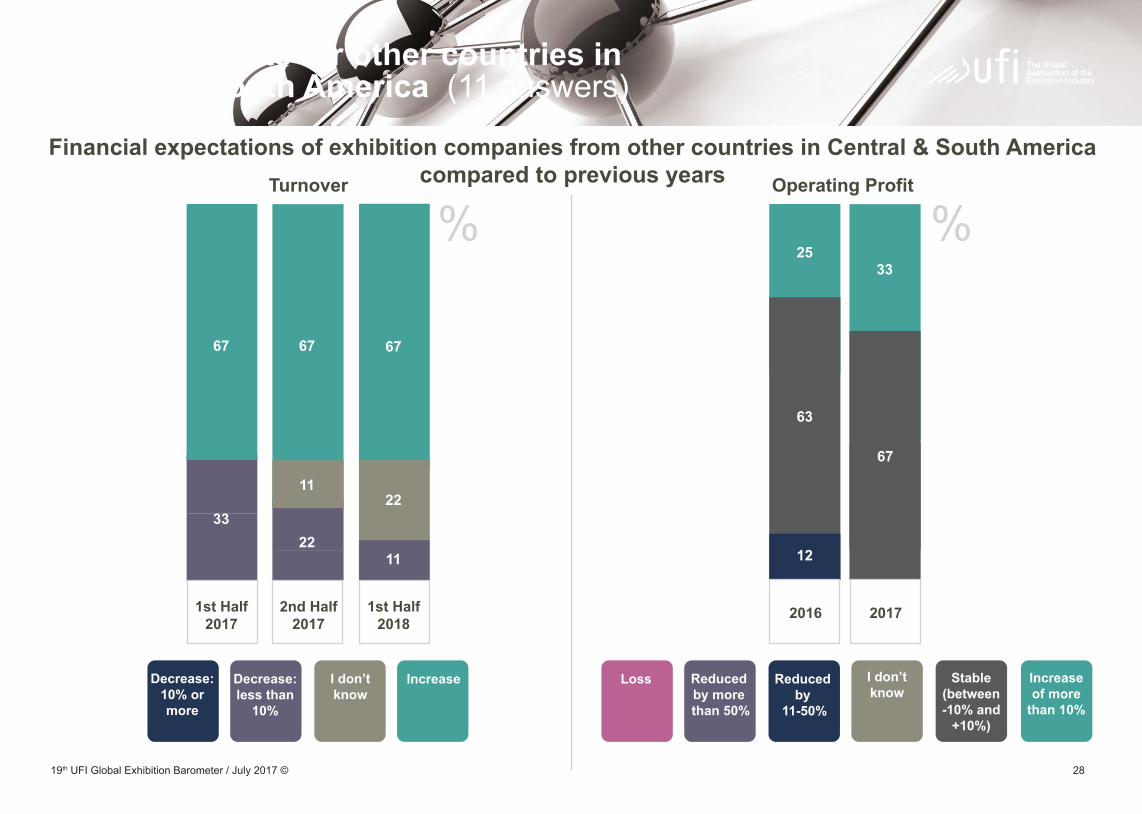
• In Central and South America, the situation appears more stable overtheperiod:50to70%ofcompaniesinBraziland67%inthe other countries declare an increase for the 3 periods
• In Europe, all four sub-markets analysed (Germany, Russia, UKandrestofEurope)presentaverypositiveandstable situationdeclaringanincreaseofturnoverfrom70%(inRussia) to83%(intheUK)onaverageovertheperiod;
• IntheMiddleEast,thefirsthalfof2017wasratherflat(only55% ofcompaniesdeclaredanincrease)butthenext2halvesindicate animprovement(between64and67%);
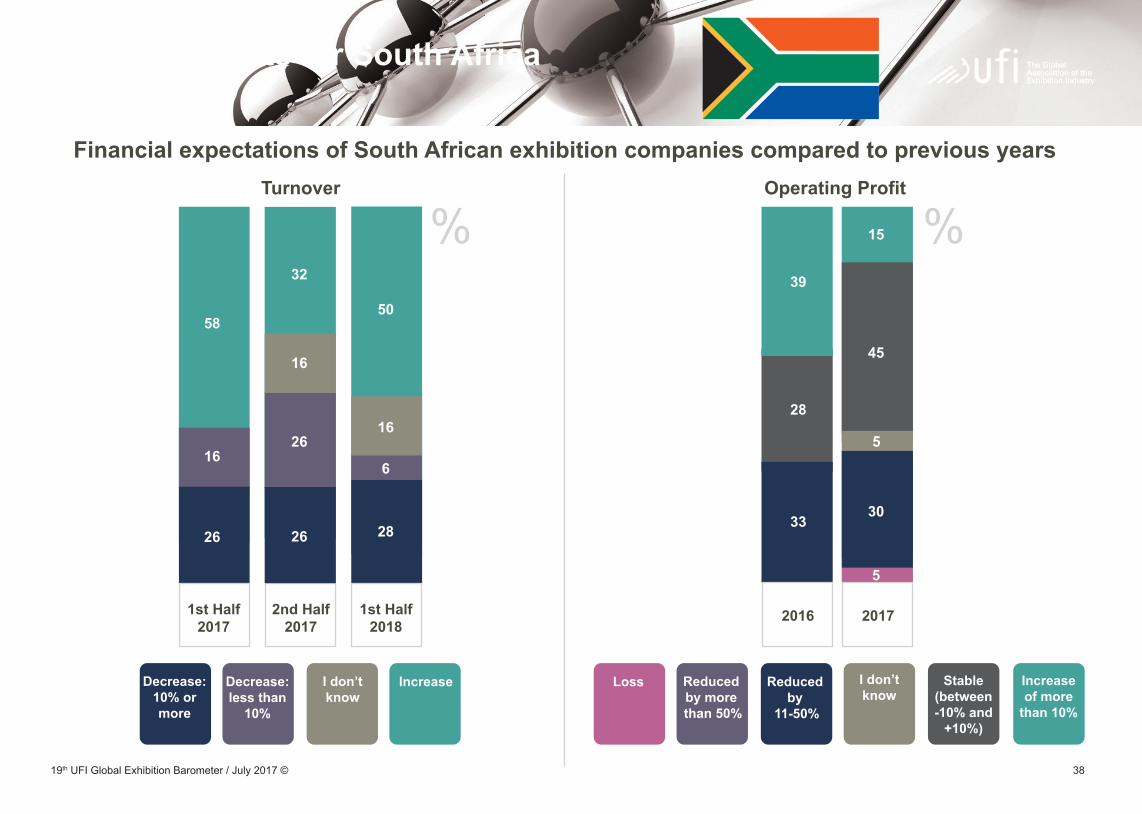
• In South Africa, the situation appears to degrade, from 58% of companiesdeclaringanincreaseforthefirsthalfof2017,butonly 32and50%forthenext2halves;
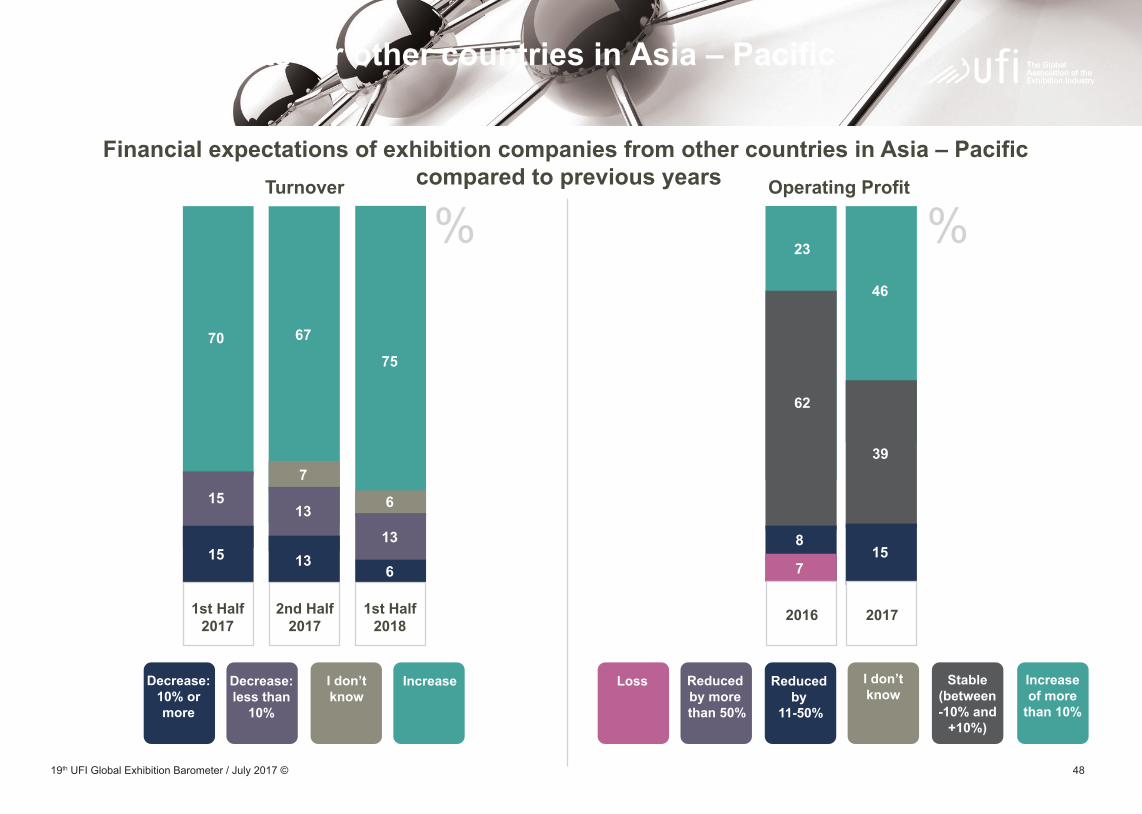
• InAsia-Pacific,allfoursub-marketsanalysed(China,India, Thailandandrestoftheregion)declareaverypositivesituation declaringanincreaseofturnoverbetween67and78%on average over the period. However, 2 exceptions related to the firsthalfof2018forChinaandThailand,wherethislevelsdrops to57/59%,togetherwithasignificantshareof“unknown”answers (35%inChina).
The 19th Barometer surveyed the evolution of participants’ gross turnoverexpectationsforthetwohalvesof2017andthefirsthalfof 2018 compared to their turnover during the same period in the previousyear(regardlessofpossiblebiennialeffects).
The chart on the next page presents, at regional level, the percentage of companies declaring an increase in their turnover. It combines these results with those of previous surveys since 2008 anditdoesnottakeintoaccountthe“unknown”or“notapplicable”answers.
It shows a very positive outlook for Asia - Pacific and Europe, where at least 74% of respondents declare an increase for these periods. The levels registered for the Americas and the Middle East are a bit let positive and unstable, with an average of 66% for the Americas and a peak for the second half of 2017, and an average of 58% for Middle East – Africa and a drop in the second half of 2017).
The charts included in the second part of this report (“Detailed results forselectedcountriesorzones”)detailtheseregionalresults,addingthe percentage of companies declaring decreases in their turnover andthepercentageof“unknown”answers.Theyshowavarietyofsituations:
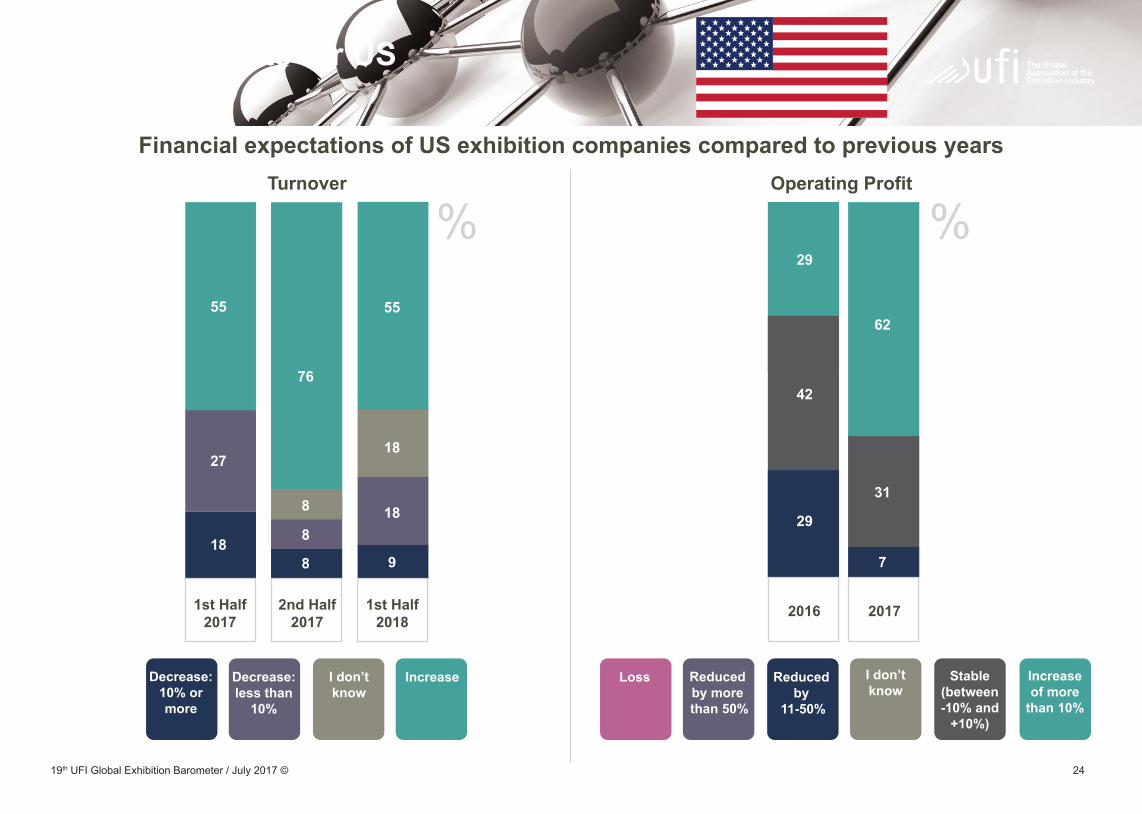
• North America, the US and Mexico present an irregular trend with around 80% of companies declaring an increase for the second half of 2017, but only 55% for the halves before and after (and 33%onlyinMexicoforthefirsthalfof2018);

519th UFI Global Exhibition Barometer / July 2017 ©
% of companies declaring an increase in turnover when compared to their projections for the same period the year before (regardless of possible biennial effects)
619th UFI Global Exhibition Barometer / July 2017 ©
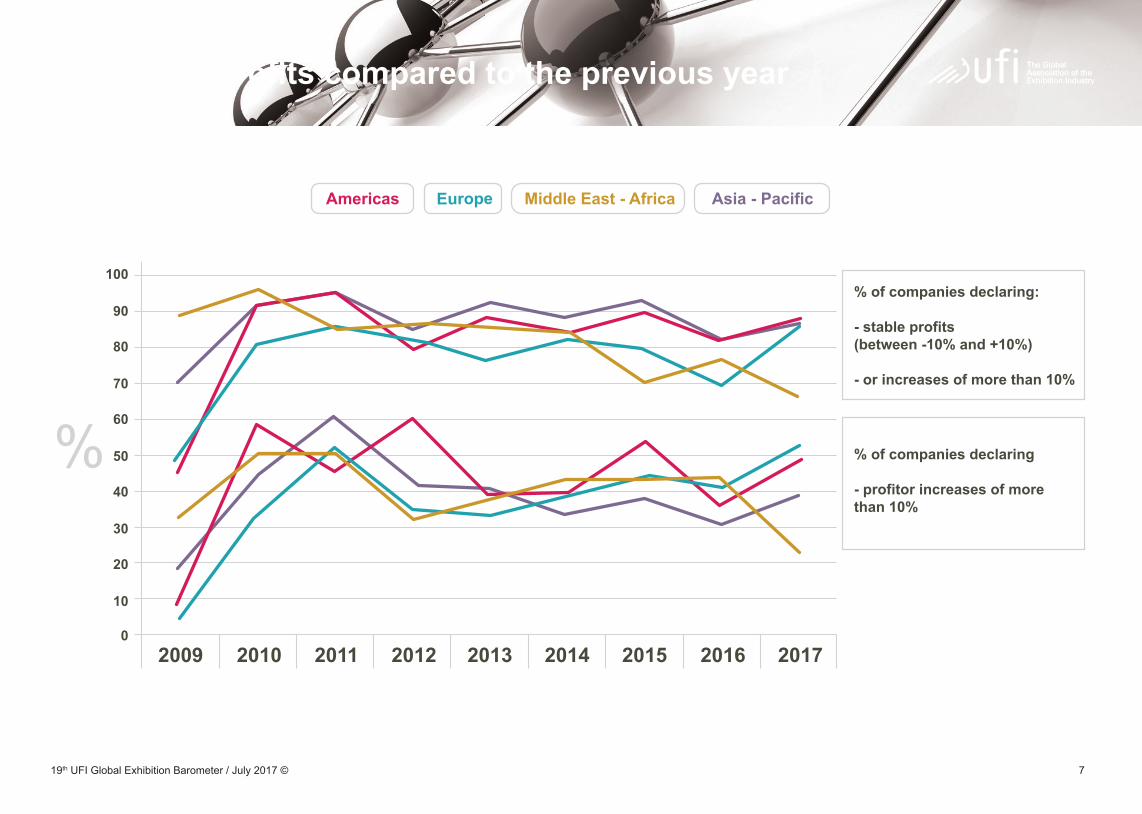
Development of Operating Profits
o in Russia and the rest of Europe, the situation was not as good for 2016 but it reaches the same levels as those anticipated in Germany or the UK for 2017: from 12% of companies declaring an increase of more than 10% in annual profits for 2016 to 45% for 2017 in Russia and from 40% to 50% in the rest of Europe;
• In both the Middle East and South Africa, the levels recorded for 2016 are anticipated to drop for 2017: from 55%% of companies declaring an increase of more than 10% in annual profits for 2016 to 20% for 2017 in the Middle East and from 39% to 15% in South Africa;
• In Asia - Pacific, the lower levels of companies declaring an increase of more than 10% in annual profits for 2016, when compared to the other regions of the world are anticipated to remain flat for 2017 in China and India (between 28 and 35% for both years) and to improve in Thailand (from 33 to 60%) and the other markets of the region (from 23 to 46%).
Footnote: The charts included in the second part of this report (“Detailed results for selected countries or zones”)detailtheseresults,addingthepercentageofcompanieswithreductionsinprofitsorlosses.
The 19th Global Barometer survey questioned the evolution of operatingprofitsfor2016and2017comparedtothepreviousyear.
The chart presented on the following page combines these results with those of previous surveys which track the development of operatingprofitssince2009.Ithighlightstheresultsofcompaniesdeclaring an increase of more than 10% and those declaring a more stableresult(between-10%and+10%)–seefootnote.
The detailed results show that most regions maintained a good level ofperformancein2016,eventhoughitwasgenerallylowerthanthelevelrecordedin2015.Profitsfor2017appeartobeontheriseinmost regions, except in the Middle East and Africa.
• In the Americas, all four sub-markets indicate a stable or improving trend between 2016 and 2017 in terms of companies declaring an increase of more than 10% in annual profits: from 29% for 2016 to 62% for 2017 in the US; 45%/42% in Mexico; 30%/46% in Brazil and from 25%/33% for the other markets in Central and South America;
• In Europe the situation appears more contrasted:
o in Germany and the UK, the high levels recorded for 2016 are anticipated to drop for 2017: from 72% of companies declaring an increase of more than 10% in annual profits for 2016 to 54% for 2017 in Germany and from 80% to 44% in the UK, based on the usual show cycles;
719th UFI Global Exhibition Barometer / July 2017 ©
Operating Profits compared to the previous year

819th UFI Global Exhibition Barometer / July 2017 ©
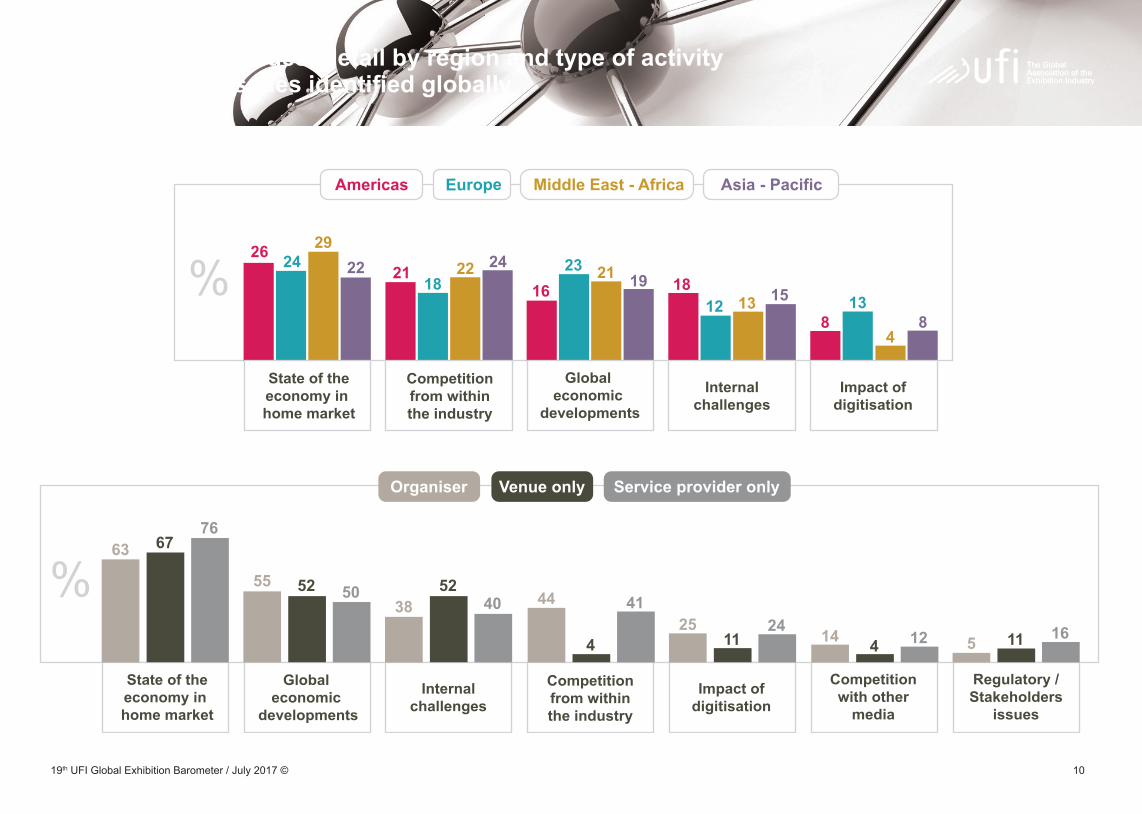
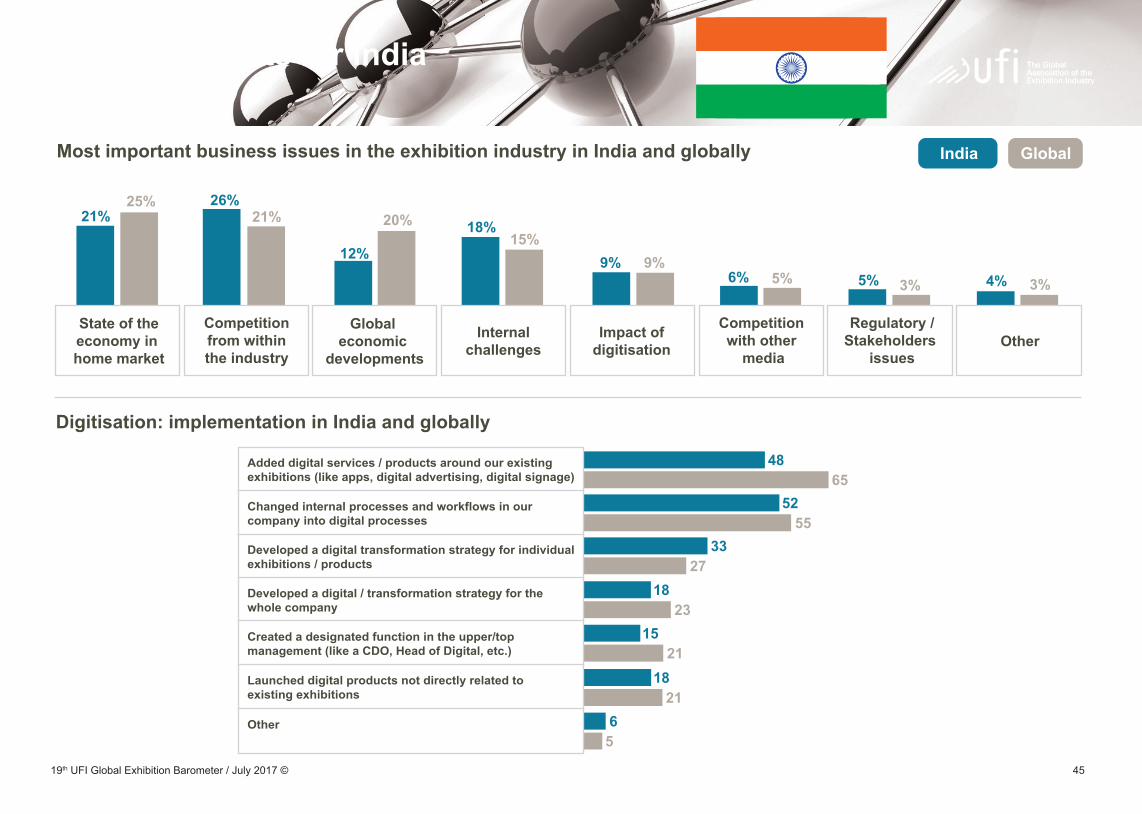
Most Important Business Issues
“Impactofdigitisation”(“Respondingtocustomerdigitisationneeds”,“Newdigitalproducts”or“Internalprocesses”),“Competitionwithothermedia”(“Internet”,“Socialmedia”,“Virtualtradeshows”or“Other”)and“Regulatory/Stakeholdersissues”(“Sustainability”,“Health&safety”or“Other)keepthesamelevelsasinthelastsurvey.
The next slide shows the consolidated global results, including further insights. The following page details those results by region and by typeofactivity(for3mainsegments:“Organiser”,“Venueonly”and“Serviceprovideronly”).Resultsshowsomerecentdevelopments:
• “Impact of digitisation” becomes the fourth most important business issue in Europe, and also receives more relevance from organisers or service providers than venues;
• “Competition from within the industry”, which is the third most important issue for organisers and service providers, but one of the last one for venues (for which “Internal challenges” are ranked higher).
Companies were asked to identify the three most important issues fortheirbusinessinthecomingyearfromapre-definedlistofsevenissues. Multiples choices were proposed to get further insight for some answers.
As in previous surveys, around 80% of all answers relate to the following 4 issues:
• “State of the economy in home market” (25% in the current survey, down 1% compared to 6 months ago);
• “Competition from within the industry” (21% in the current survey, up 1% compared to 6 months ago);
• “Global economic developments” (20% in the current survey, down 2% compared to 6 months ago);
• “Internal challenges” (15% in the current survey), up 2% compared to 6 months ago, where “Human resources” are named as the most important aspect.
It can be noted that, compared to the results a year ago, “Competition from within the industry” climbs up by +4% and now ranks as the second most important issue.

919th UFI Global Exhibition Barometer / July 2017 ©
Top Issues: Global Results
1019th UFI Global Exhibition Barometer / July 2017 ©
Most important issues: detail by region and type of activity for the five top issues identified globally
1119th UFI Global Exhibition Barometer / July 2017 ©
Actions Towards Digitisation
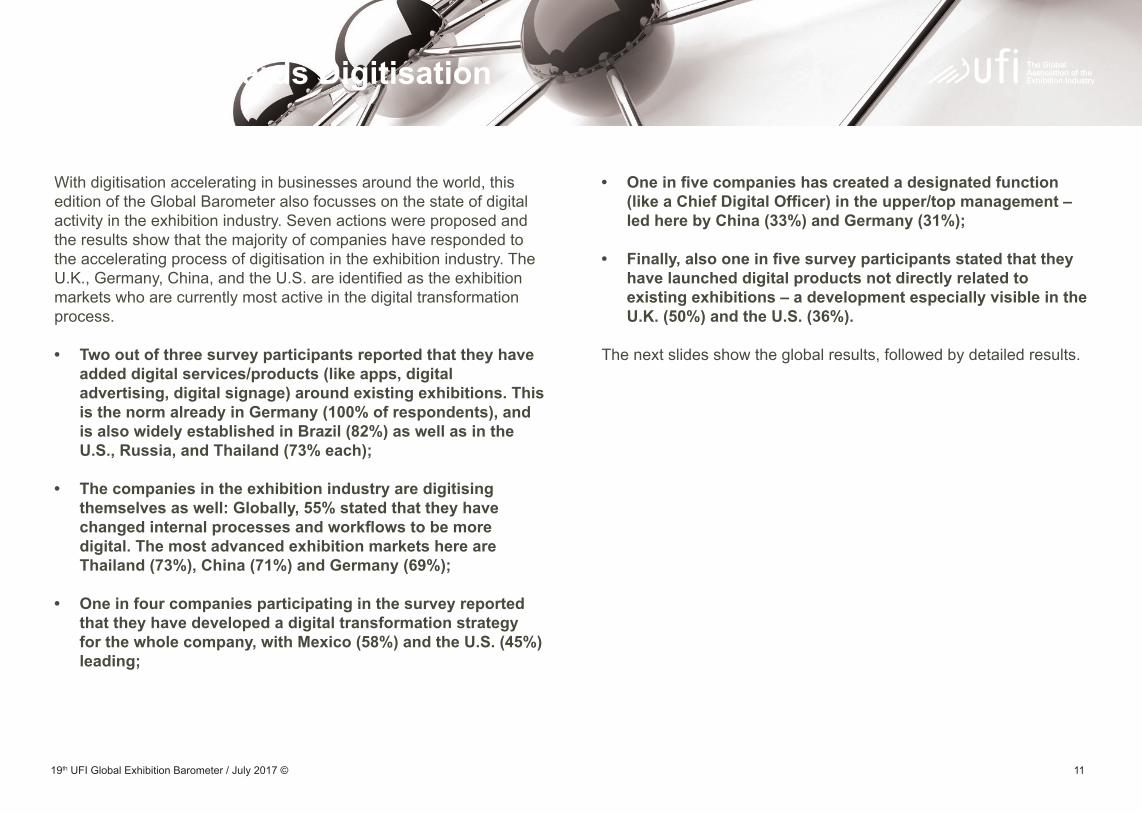
• One in five companies has created a designated function (like a Chief Digital Officer) in the upper/top management – led here by China (33%) and Germany (31%);
• Finally, also one in five survey participants stated that they have launched digital products not directly related to existing exhibitions – a development especially visible in the U.K. (50%) and the U.S. (36%).
The next slides show the global results, followed by detailed results.
With digitisation accelerating in businesses around the world, this edition of the Global Barometer also focusses on the state of digital activity in the exhibition industry. Seven actions were proposed and theresultsshowthatthemajorityofcompanieshaverespondedtothe accelerating process of digitisation in the exhibition industry. The U.K.,Germany,China,andtheU.S.areidentifiedastheexhibitionmarkets who are currently most active in the digital transformation process.
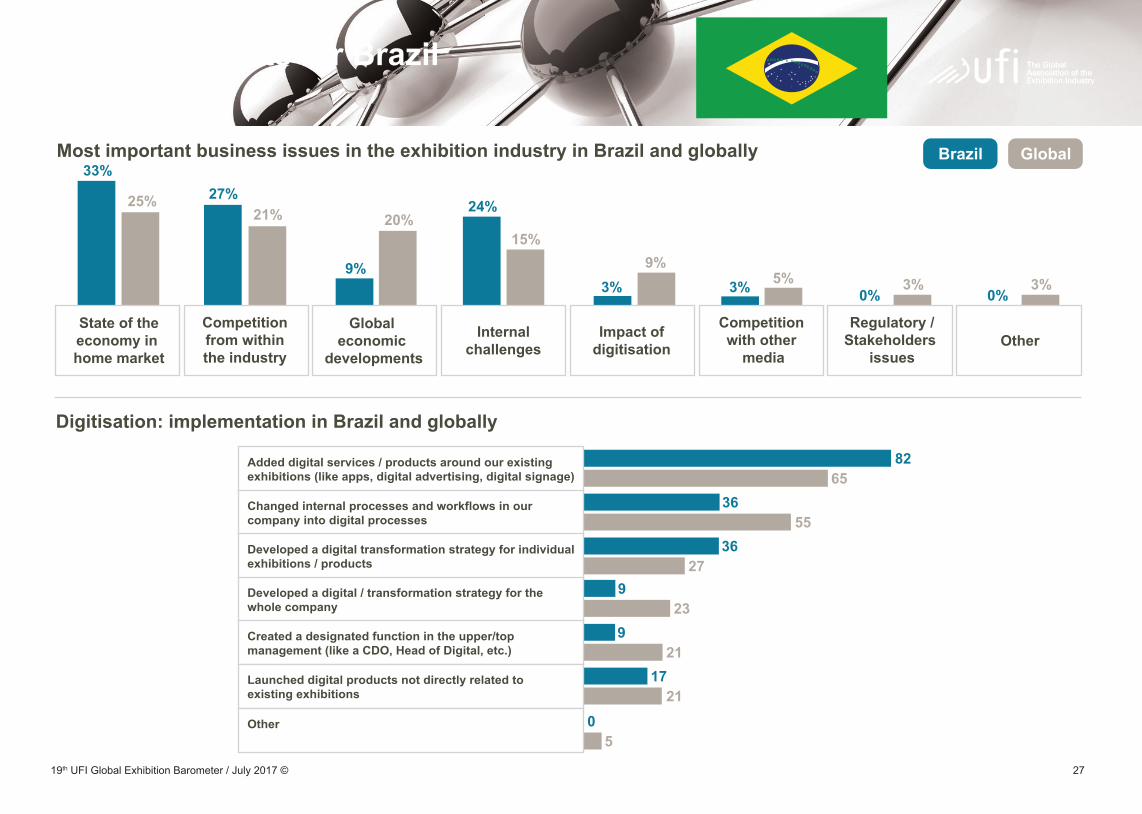
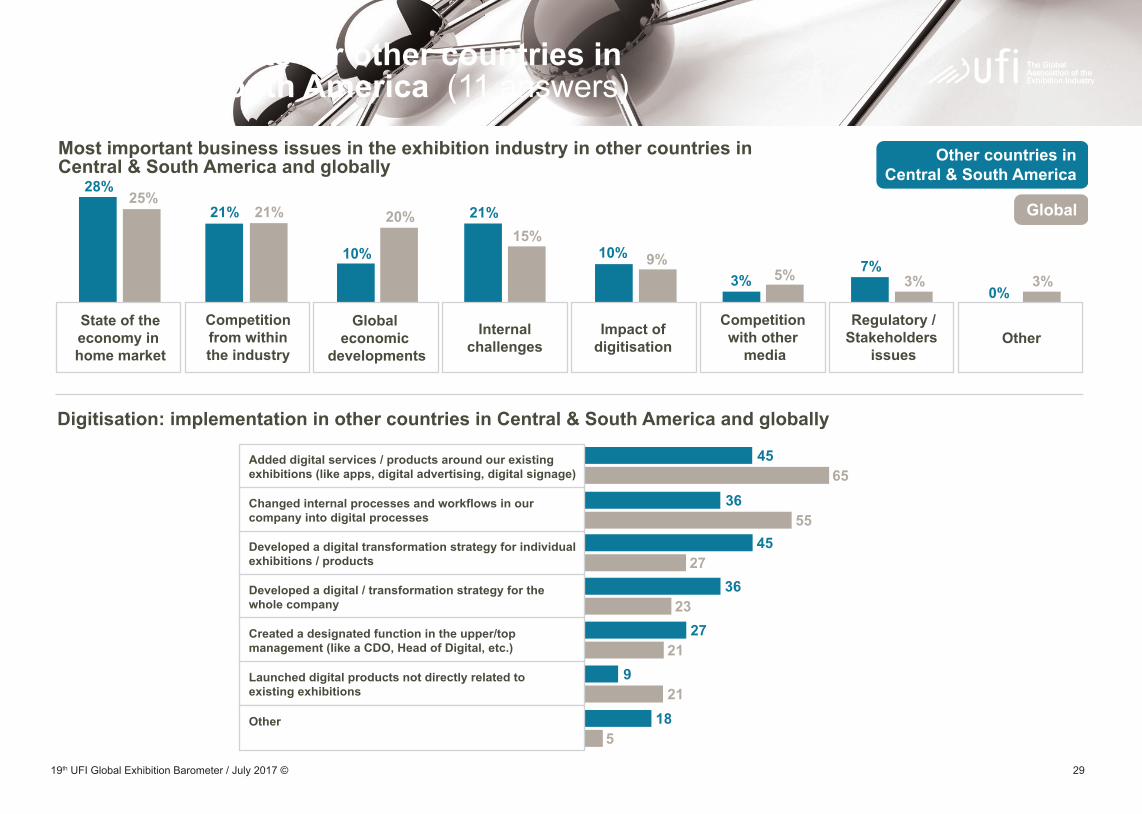
• Two out of three survey participants reported that they have added digital services/products (like apps, digital advertising, digital signage) around existing exhibitions. This is the norm already in Germany (100% of respondents), and is also widely established in Brazil (82%) as well as in the U.S., Russia, and Thailand (73% each);
• The companies in the exhibition industry are digitising themselves as well: Globally, 55% stated that they have changed internal processes and workflows to be more digital. The most advanced exhibition markets here are Thailand (73%), China (71%) and Germany (69%);
• One in four companies participating in the survey reported that they have developed a digital transformation strategy for the whole company, with Mexico (58%) and the U.S. (45%) leading;

1219th UFI Global Exhibition Barometer / July 2017 ©
Digitisation: global results

1319th UFI Global Exhibition Barometer / July 2017 ©
Digitisation: detail by region and type of activity
1419th UFI Global Exhibition Barometer / July 2017 ©
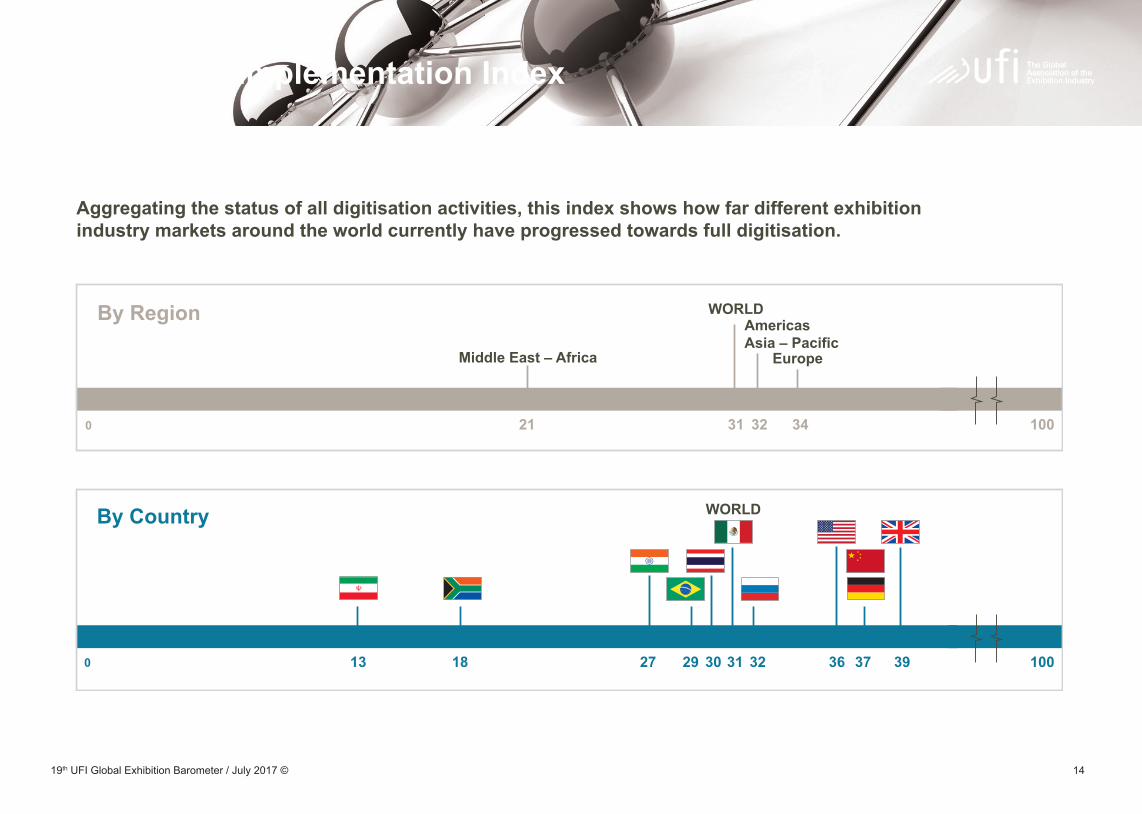
Digitisation Implementation Index

1519th UFI Global Exhibition Barometer / July 2017 ©
Actions Towards Digitisation

1619th UFI Global Exhibition Barometer / July 2017 ©
Actions Towards Digitisation

1719th UFI Global Exhibition Barometer / July 2017 ©
Actions Towards Digitisation

1819th UFI Global Exhibition Barometer / July 2017 ©
Actions Towards Digitisation

1919th UFI Global Exhibition Barometer / July 2017 ©
Actions Towards Digitisation

2019th UFI Global Exhibition Barometer / July 2017 ©
Actions Towards Digitisation

2119th UFI Global Exhibition Barometer / July 2017 ©
Part 2: Detailed results for 14 selected countries
North America: Mexico US
Central and South America: Brazil Other countries in Central & South America
Europe: Germany Russia United Kingdom Other countries in Europe
Africa: South Africa
Middle East: Middle East
Asia-Pacific: China India Thailand OthercountriesinAsia-Pacific

2219th UFI Global Exhibition Barometer / July 2017 ©
Detailed results for MEXICO (12answers)

2319th UFI Global Exhibition Barometer / July 2017 ©
Detailed results for MEXICO (12answers)
2419th UFI Global Exhibition Barometer / July 2017 ©
Detailed results for US (15answers)

2519th UFI Global Exhibition Barometer / July 2017 ©
Detailed results for US (15answers)

2619th UFI Global Exhibition Barometer / July 2017 ©
Detailed results for Brazil (11answers)
2719th UFI Global Exhibition Barometer / July 2017 ©
Detailed results for Brazil (11answers)
2819th UFI Global Exhibition Barometer / July 2017 ©
Detailed results for other countries in Central & South America (11answers)
2919th UFI Global Exhibition Barometer / July 2017 ©
Detailed results for other countries in Central & South America (11answers)

3019th UFI Global Exhibition Barometer / July 2017 ©
Detailed results for Germany(15answers)

3119th UFI Global Exhibition Barometer / July 2017 ©
Detailed results for Germany(15answers)

3219th UFI Global Exhibition Barometer / July 2017 ©
Detailed results for Russia (13answers)

3319th UFI Global Exhibition Barometer / July 2017 ©
Detailed results for Russia (13answers)

3419th UFI Global Exhibition Barometer / July 2017 ©
Detailed results for UK (11answers)

3519th UFI Global Exhibition Barometer / July 2017 ©
Detailed results for UK (11answers)

3619th UFI Global Exhibition Barometer / July 2017 ©
Detailed results for other countries in Europe (36answers)

3719th UFI Global Exhibition Barometer / July 2017 ©
Detailed results for other countries in Europe (36answers)
3819th UFI Global Exhibition Barometer / July 2017 ©
Detailed results for South Africa (22answers)

3919th UFI Global Exhibition Barometer / July 2017 ©
Detailed results for South Africa (22answers)

4019th UFI Global Exhibition Barometer / July 2017 ©
Detailed results the Middle East (18answers)

4119th UFI Global Exhibition Barometer / July 2017 ©
Detailed results the Middle East (18answers)

4219th UFI Global Exhibition Barometer / July 2017 ©
Detailed results for China(21answers)

4319th UFI Global Exhibition Barometer / July 2017 ©
Detailed results for China(21answers)

4419th UFI Global Exhibition Barometer / July 2017 ©
Detailed results for India (37answers)
4519th UFI Global Exhibition Barometer / July 2017 ©
Detailed results for India (37answers)

4619th UFI Global Exhibition Barometer / July 2017 ©
Detailed results for Thailand (11answers)

4719th UFI Global Exhibition Barometer / July 2017 ©
Detailed results for Thailand (11answers)
4819th UFI Global Exhibition Barometer / July 2017 ©
Detailed results for other countries in Asia – Pacific (17answers)

4919th UFI Global Exhibition Barometer / July 2017 ©
Detailed results for other countries in Asia – Pacific (17answers)

5019th UFI Global Exhibition Barometer / July 2017 ©
Conclusion
• Finally,amajorityofcompanieshaverespondedtotheaccelerating process of digitisation in the exhibition industry. The two actions most frequently undertaken were “Added digital services/products around existing exhibitions (i.e.: apps, digital advertising, digital signage)and“Changedinternalprocessesandworkflowsinour companyintodigitalprocesses”withrespectively65%and55%of respondents having implemented these actions.
THANK YOU TO ALL SURVEY PARTICIPANTS FOR YOUR CONTRIBUTION!
THE NEXT GLOBAL BAROMETER SURVEY WILL BE CONDUCTED IN DECEMBER 2017 – PLEASE PARTICIPATE!
The Global Barometer survey has been measuring the pulse of the exhibition industry since 2008. The 19th survey, conducted in June 2017, wasansweredby257companiesfrom56countries.Theresultsaredetailedfor14geographicalzones,including10majornationalmarkets.Survey results reveal very positive trends at different levels:
• Regarding turnoverforthetwohalvesof2017andthefirsthalfof 2018,atleast74%ofrespondentsinAsia-PacificandEuropedeclared an increase for these periods. In the Americas and the Middle East - Africa, the results were a bit less positive: on average for the three semesters,66%ofrespondentsintheAmericasreportedincreases in turnover and 58% of respondents in Middle East - Africa. The reported turnover across these regions was, however, not always stable as the Americas reported a peak for the second half of 2017 and the MiddleEast-Africareportedadropinthesecondhalfof2017;
• In terms of operating profit, most regions maintained a good level of performancein2016,eventhoughitwasgenerallylowerthanthelevel recordedin2015.Moreover,profitsfor2017appeartobeontherisein all regions, except in the Middle East and Africa.
• When asked about their top business issues, the “state of the national/ regionaleconomy”wasconsideredmostimportant,with25%ofall respondentsnamingthisasatopbusinessissue,andalsomostmajor exhibitionmarkets.“Competitionfromwithintheindustry”was considered a top business issue by 21% of survey respondents. Companiesindicatedthat“globaleconomicdevelopment”wasless important than it had been in previous surveys, with 20% of respondents naming this as a top issue. Regarding additional top issues,“InternalChallenges”and“Impactofdigitisation”takethenext places.
5119th UFI Global Exhibition Barometer / July 2017 ©
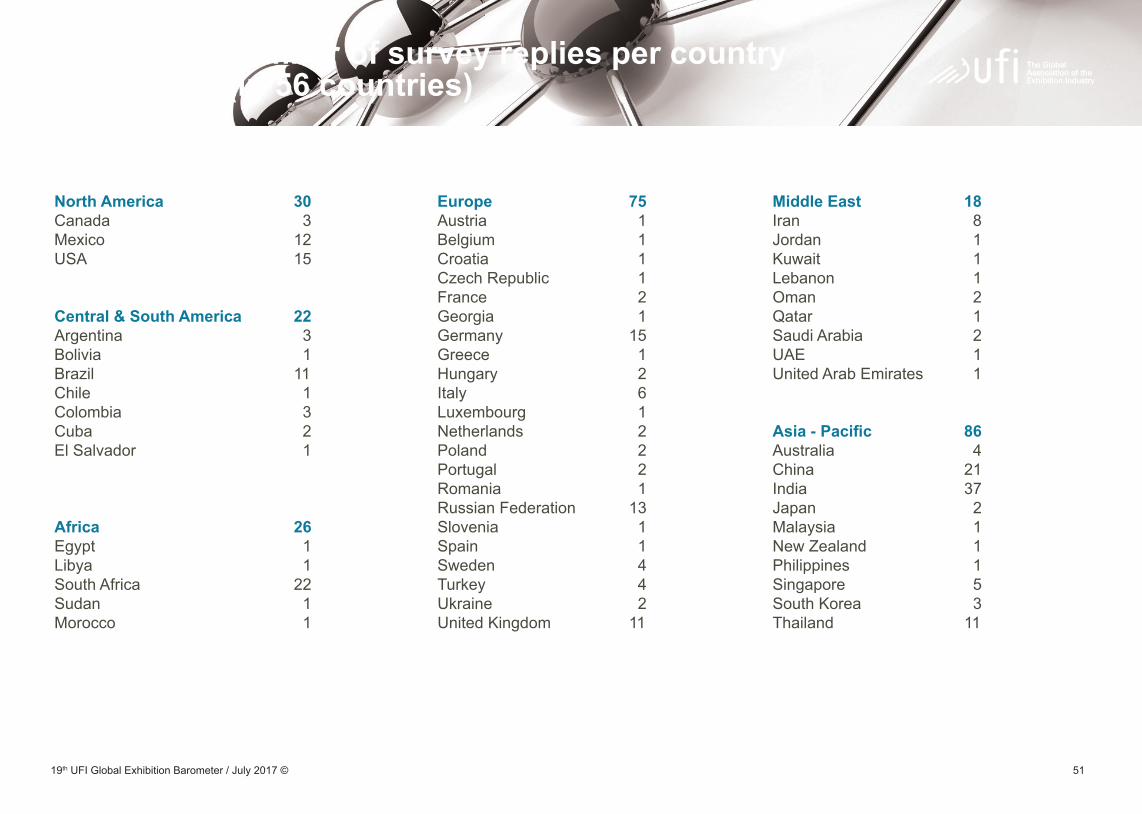
Appendix: Number of survey replies per countryTotal = 257 (in 56 countries)
North America 30 Europe 75 Middle East 18Canada 3 Austria 1 Iran 8Mexico 12 Belgium 1 Jordan 1USA 15 Croatia 1 Kuwait 1 Czech Republic 1 Lebanon 1 France 2 Oman 2Central & South America 22 Georgia 1 Qatar 1Argentina 3 Germany 15 Saudi Arabia 2Bolivia 1 Greece 1 UAE 1Brazil 11 Hungary 2 United Arab Emirates 1Chile 1 Italy 6 Colombia 3 Luxembourg 1 Cuba 2 Netherlands 2 Asia - Pacific 86El Salvador 1 Poland 2 Australia 4 Portugal 2 China 21 Romania 1 India 37 Russian Federation 13 Japan 2Africa 26 Slovenia 1 Malaysia 1Egypt 1 Spain 1 New Zealand 1Libya 1 Sweden 4 Philippines 1South Africa 22 Turkey 4 Singapore 5Sudan 1 Ukraine 2 South Korea 3Morocco 1 United Kingdom 11 Thailand 11

UFI Headquarters
17, rue Louise Michel 92300 Levallois-Perret France
T: +33 1 46 39 75 00 F: +33 1 46 39 75 01 [email protected]
UFI Asia – Pacific Regional Office
Suite 4114, Hong Kong Plaza 188 Connaught Road West Hong Kong, China
T: +852 2525 6129 F: +852 2525 6171 [email protected]
UFI Middle East – Africa Regional Office
Expo CentreSharjahUnited Arab Emirates
T / F: +971 6 5991352
web www.ufi.org
blog www.ufilive.org
@UFILive
www.facebook.com/ufilive
www.UFI.tv
www.linkedin.com/groups/4048434
UFI Official Account
UFI Diamond Sponsors