ultra-fast dynamics in atoms and molecules during ... · direct double ionization was studied in...
TRANSCRIPT

LUND UNIVERSITY
PO Box 117221 00 Lund+46 46-222 00 00
Ultra-fast dynamics in atoms and molecules during photoionization: from attosecondsto femtoseconds
Månsson, Erik
2014
Link to publication
Citation for published version (APA):Månsson, E. (2014). Ultra-fast dynamics in atoms and molecules during photoionization: from attoseconds tofemtoseconds. Division of Synchrotron Radiation Research, Department of Physics, Lund University.
General rightsCopyright and moral rights for the publications made accessible in the public portal are retained by the authorsand/or other copyright owners and it is a condition of accessing publications that users recognise and abide by thelegal requirements associated with these rights.
• Users may download and print one copy of any publication from the public portal for the purpose of private studyor research. • You may not further distribute the material or use it for any profit-making activity or commercial gain • You may freely distribute the URL identifying the publication in the public portalTake down policyIf you believe that this document breaches copyright please contact us providing details, and we will removeaccess to the work immediately and investigate your claim.

Ultra-fast dynamics in atoms and
molecules during photoionization:
from attoseconds to femtoseconds
Doctoral thesis
2014
Erik P. Mansson
Division of Synchrotron Radiation Research
Department of Physics
Lund University

Front cover illustrations:(top) Do not look into laser beam with remaining eye!(waves) Mono-energetic components of a photoelectron wave packet.(bottom left) Dalitz plot for energy correlation between atomic fragments of a carbon
dioxide molecule.(bottom right) Iso-density surfaces for the three-dimensional momentum distribution
of a photoelectron, from helium ionized by high harmonics.
c© Erik P. ManssonLund, April 2014
ISBN: 978-91-7473-953-4 (print)ISB(N+1): 978-91-7473-954-1 (PDF)
Printed in Sweden by Media-Tryck, Lund University
iii
Abstract
Treating the correlated behaviour of multiple particles is challenging for both theoryand experiment. This thesis reports on a variety of experimental investigations aimingto advance the understanding of fundamental processes in atoms and molecules:double ionization, isomerization and dissociation. The emphasis lies on ultra-fastprocesses, where multiple electrons interact or nuclei move so rapidly that couplingbetween electronic and nuclear dynamics can not be neglected.
Pulses of light from a synchrotron or laser were used to excite or directly ionizemolecules or atoms in the gas phase. The momenta (norms or vectors) of the resultingcharged fragments were measured in coincidence using different types of time-of-flight spectrometers. Two papers report on the optimization of momentum imagingspectrometers, one for ions and one adaptable electron–ion hybrid.
Direct double ionization was studied in the time domain for the first time, using apump–probe method with attosecond pulses and electron interferometry (RABBIT).Theoretical development in combination with a coincident measurement of the photo-electron pair from xenon revealed a 500 as group delay, with respect to propagationin a plain Coulomb potential. Electron correlation was also investigated in single ion-ization, via the angular distribution of a photoelectron. It was shown that the delayof an electron emitted from C60 can be altered by 100 as depending on whether thephoton energy lies below or above the resonance frequency of a collective electronoscillation (plasmon).
Soft x-rays were used to core-excite molecules to specific orbitals. The subsequentautoionization and dissociation steps were traced by analysing the momentum vec-tors of multiple ionic fragments. For carbon dioxide, ultra-fast bending initiated bythe Renner–Teller effect could bring the two oxygen nuclei together as O+
2 before dis-sociation. For few-femtosecond proton migration in water, the kinetic energy releasewas found to be correlated with the bond angle. Laser-based pump–probe experi-ments were made on the femtosecond time scale for singly ionized acetylene, C2H
+2 .
Isomerization and dissociation dynamics with time scales of 50–500 fs were observedand analysed.

iv
Popularvetenskaplig sammanfattning
Att en elektrisk urladdning ger upphov till ljus syns varje gang blixten slar ner. Denomvanda processen, att ljus kan skapa en elektrisk urladdning, upptacktes av Hertz1887 som en parentes i utvecklingen av radiomottagare. Undersokningar av dettafenomen visade att elektroner bara kunde frigoras av ljus som hade tillrackligt hogfrekvens (ultraviolett). Forklaringen av detta, dar ljus betraktas som partiklar (fo-toner) och frekvens oversatts till energi, bidrog till kvantmekanikens tillkomst. Okasfotonenergin far den frislappta elektronen hogre fart, vilken kan matas med sa kalladespektrometrar. Senare kom elektronspektroskopi att anvandas som en metod for attidentifiera och studera material. En kombinerad matning av ljusets frekvens ochelektronens fart berattar hur mycket energi som kravdes for att avlagsna elektronen,alltsa vilka energinivaer materialet har. Energinivaerna ar troligen den viktigaste de-len av den kvantmekaniska beskrivningen av material – de bestammer vilka amnensom finns och vilka reaktioner som kan ske.
Vad som hander under en kemisk reaktion ar svarare att mata, eftersom det iallmanhet gar fort och molekylernas tillstand hela tiden forandras. Under 1980-taletutvecklades metoder for att med korta laserpulser folja forloppet i reaktioner sominitieras av ljus. De tidiga experimenten, liksom de som presenteras i denna avhan-dling, galler enstaka molekyler i vakuum. Eftersom de da inte paverkas av nagonsarskild omgivning kan vi lara oss nagot om grundlaggande, universella processerinom en molekyl snarare an hur den interagerar med en viss kombination av om-givande amnen. I gransdragningen mellan kemi och fysik kan man saga att dettaforskningsfalt fokuserar pa att fordjupa forstaelsen for de allra enklaste kemiska pro-cesserna i hopp om att det pa sikt kommer till nytta aven for att forsta eller designastorre system. De typer av processer som studeras i den har avhandlingen ar:
• jonisation – da elektroner frigors fran en atom eller molekyl,
• deformation – da molekylen andrar form genom att atomkarnor flyttar sig och
• dissociation – da en molekyl delas genom att bindningar mellan atomer bryts.
Lasertekniken for att folja forloppet i reaktioner bygger pa att en forsta puls avlaserljus ger molekylen ett energitillskott som gor den instabil och satter atomerna irorelse. En andra ljuspuls anvands sedan for att fa reda pa till exempel vilka atomersom ror sig och hur lang tid det tar innan en bindning ar helt bruten. Denna typav matning presenteras i slutet av avhandlingen for acetylen, en av de minsta or-ganiska molekylerna med tva kolatomer och tva vateatomer. En annan metod kanstudera samma processer med bara en ljuspuls genom att anvanda sa hog fotonenergi(mjukrontgenljus fran en synkrotron) att flera elektroner frigors och molekylen gari flera positivt laddade bitar. Da kan matningar av bitarnas massa, fart och rikt-ning tillsammans ge en beskrivning av forloppet – vilka bindningar bryts, i vilkenordning och var hamnar de kvarvarande elektronerna? Den har metoden anvandsfor att studera en snabb bojning av koldioxid och vatten i artiklarna III–IV. I allatre artiklarna om molekylar deformation hander det att atomer fran olika andar avmolekylen narmar sig varandra och utgor ett av fragmenten. Detta kan ses som enprototyp for den typiska kemiska reaktionen, dar bindningar bade bryts och skapasfor att omfordela atomer mellan de amnen som reagerar.

v
Alla metoder i den har avhandlingen handlar om att mata elektriskt laddadepartiklar (elektroner och joner), vilka kan styras till detektorer med hjalp av elektriskaoch magnetiska falt. Artiklarna V–VI handlar om att designa de elektriska falten ispektrometrar for att mata elektroners och/eller joners hastighet med bra upplosning.Experimenten utfors i vakuum for att undvika paverkan fran omgivningen, dels iprocessen som studeras och dels pa partiklarnas vag till detektorn.
Samspelet mellan atomkarnor och elektroner ar avgorande for alla kemiska reak-tioner liksom for processer inom en molekyl. Elektronerna har mindre an en tusendelav atomkarnornas massa och ror sig darfor mycket snabbare. Med traditionella lasrargar det inte att gora ljuspulserna kortare an en femtosekund (en biljarddels sekund),vilket ar tiden for en svangning hos violett ljus. Det ar, som beskrivits ovan, tillrack-ligt kort for att mata hur atomkarnorna ror sig i kemiska reaktioner men rackerinte for att fa information om elektronernas rorelse. Annu kortare pulser, dar varak-tigheten mats i attosekunder (triljondelar av en sekund), gar att skapa som overtonerav ljuset fran en tillrackligt ljusstark laser. Forhallandet mellan 100 attosekunder ochen sekund ar som forhallandet mellan en sekund och 300 miljoner ar (tiden sedanreptiler uppstod). Den inblick i vad som hander pa elektronernas tidsskala som kanges av experiment med sadana ljuspulser ar alltsa valdigt exotisk.
De senaste fem aren har olika metoder som anvander attosekundpulser utvecklatsfor att fa inblick i sjalva jonisationsprocessen och mata antingen nar under en laser-puls som en elektron lamnar sin atom eller hur lang tid det tar for den att avlagsnasig, vilket beror pa den attraktiva kraften mellan atom och elektron. For nastan allagrundamnen blir det elektroner kvar i atomen och det ar da inte mojligt att beskrivaderas beteende exakt. Det gar att gora bra approximationer och berakningar anda,vilket anvands i all simulering av grundlaggande kemi, men forstaelsen for systemmed flera elektroner behover forbattras och nya fenomen upptacks fortfarande. Pro-cesser dar atomkarnornas rorelse sker sarskilt snabbt eller som kraver samverkanmellan flera elektroner studeras experimentellt i denna avhandling.
Den mest grundlaggande fler-elektronprocessen ar direkt dubbeljonisation, darabsorptionen av en foton leder till att tva elektroner kastas ut ur atomen. I artikel Ilyckas vi for forsta gangen studera denna process med attosekundpulser. Vi visar attdet gar att mata fordrojningar i tiden det tar for elektronparet att lamna atomen(omkring 500 attosekunder). Eftersom sadana fordrojningar beror pa samverkan mel-lan flera elektroner och inte har kunnat matas forut ar det intressant att jamfora demmed forutsagelser fran berakningar, vilket ocksa gors i artikeln. Det finns tva olikabeskrivningar for hur energi overfors mellan elektronerna i direkt dubbeljonisation,vilka leder till nagot olika forutsagelser om fordorjningen. Resultatet vi fick liggerungefar mitt emellan och kan inte utesluta nagon av mekanismerna. Med forbattradprecision vore det i princip mojligt att avgora hur mycket de olika mekanismernabidrar eller utesluta nagon av dem genom den har typen av experiment. Artikel IIdemonstrerar aven ett indirekt satt att studera elektronfordrojning vid fenomen darvaldigt manga elektroner ar inblandade – har i en fotbollsformad molekyl bestaendeav 60 kolatomer.

vi

vii
Summary of papers
This thesis is based on the following publications and manuscripts, which will bereferred to by their Roman numerals.
Paper I:
Double ionization probed on the attosecond time scale
Erik P. Mansson, Diego Guenot, Cord L. Arnold, David Kroon, Susan Kasper,J. Marcus Dahlstrom, Eva Lindroth, Anatoli S. Kheifets, Anne L’Huillier, Stacey L.Sorensen and Mathieu GisselbrechtNature Physics, 10, 207–211 (2014) DOI: 10.1038/nphys2880
Access to many–particle dynamics in real time is important for understandingprocesses induced by electron correlation in atomic, molecular or more complex sys-tems. Direct double ionization constitutes the most fundamental example of sucha process. We report the first measurement of electron time-delays in direct dou-ble ionization, made possible by combining attosecond light pulses, electron wavepacket interferometry and coincident electron detection. An analysis of the electronpair spectrum reveals that non-sequential sidebands are formed for direct one-photondouble ionization of xenon. With photon energies around 40 eV, the measurementfor the Xe2+ 1D2 final state is consistent with a Wigner-like group delay of 500 as.
I participated in the experiment, made software for the detection and analysis,
performed the spectral analysis, made the figures and participated in the writing of
the manuscript.
Paper II:
Plasmon resonance effect on C60 photoelectron angular distri-
bution
T. Barillot, C. Cauchy, P-A. Hervieux, M. Gisselbrecht, S. E. Canton, P. Johnsson,J. Laksman, E. P. Mansson, M. Dahlstrom, E. Suraud, M. P. Dinh, P. Wopperer,K. Hansen, V. Loriot, C. Bordas, S. Sorensen and F. LepineSubmitted.
A giant surface plasmon resonance is excited in C60 during photoionization at20 eV photon energy. The effect of the plasmon field on the photoelectron’s angulardistribution is investigated as function of photon energy via two-dimensional momen-tum imaging. When the photon energy is scanned across the resonance the angulardistribution becomes more isotropic at the resonance. We explain this as a change ofup to 100 as in the photoelectron emission time due to acceleration or decelerationby the plasmon’s electrical field. Such an effect should be general for all autoionizingsurface plasmons and in principle measurable also with attosecond light pulses.
I participated in the experiment and commented on three versions of the manuscript.
viii
Paper III:
Role of the Renner–Teller effect after core hole excitation in
the dissociation dynamics of carbon dioxide dication
J. Laksman, E. P. Mansson, C. Grunewald, A. Sankari, M. Gisselbrecht, D. Ceolinand S. L. SorensenThe Journal of Chemical Physics, 136, 104303 (2012). DOI: 10.1063/1.3692293.
Resonant excitation of CO2 by 290 eV photons leads to double autoionization,where the Auger lifetime of the initial O 1s or C 1s hole is 3.5–6 fs. To what extentthe nuclei in the molecule have moved before the ionization occurs and whether thebonds are broken simultaneously or sequentially is reflected in the 3D momentumdistribution of the fragments. We report on the kinetics of several such processes,particularly the change of molecular symmetry from linear to bent before the Augerdecay, via the Renner–Teller effect. Electronic and nuclear dynamics occur on similartime scales in this case, which invalidates the Born–Oppenheimer approximation.The signature of this event is an O+
2 fragment detected in coincidence with C+ –a complete folding of the molecule from the initial linear (OCO) geometry beforedissociation.
I participated in the experiment, made the detection software and participated in
the writing of the manuscript.
Paper IV:
Rapid bond rearrangement in core-excited molecular water
Joakim Laksman, Erik P. Mansson, Anna Sankari, Denis Ceolin, Mathieu Gissel-brecht and Stacey L. SorensenPhysical Chemistry Chemical Physics, 15, 19322 (2013). DOI: 10.1039/c3cp52625a.
This study is similar to Paper III except that water is bent already in theground state. The small mass of hydrogen lets bending and bond rearrangementoccur quickly. It also allows up to 60 eV of total kinetic energy for the fragments.We report on the simultaneous breaking of both bonds as well as the alternativebond-rearrangement into H+
2 in coincidence with O+. Upon O 1s excitation to eitherof the lowest unoccupied molecular orbitals the rearrangement is enabled by a sym-metric bending vibration and completed well before the molecule rotates appreciably.It does not occur if the photon energy is high enough to directly ionize the molecule.
I participated in the experiment, made the detection software and participated in
the writing of the manuscript.

ix
Paper V:
Development and characterization of a multiple-coincidence
ion-momentum imaging spectrometer
J. Laksman, D. Ceolin, E. P. Mansson, S. L. Sorensen, and M. GisselbrechtReview of Scientific Instruments, 84, 123113 (2013). DOI: 10.1063/1.4853435.
The design of a 3D momentum-imaging spectrometer for ions is presented. Theeffects of an extended ionization volume are simulated and it is shown that Wiley–McLaren focusing of the time-of-flight is in no conflict with radial focusing of thedetector image. The analysis of energy and angle is demonstrated for carbon monox-ide. Using core-excited C60 and its 13C-isotope distribution, mass resolution beyond720 u is demonstrated. We also obtain information about life-times and energy releasein its autoionization and multi-step fragmentation by evaporation of carbon dimers.
I participated in experiments, made the detection software, made the simulations
for Fig. 3 and participated in the writing of the manuscript.
Paper VI:
Multi-purpose momentum imaging spectrometer with three
field-regions
Erik P. Mansson, Stacey L. Sorensen, Cord L. Arnold, David Kroon, Diego Guenot,Thomas Fordell, Franck Lepine, Per Johnsson, Anne L’Huillier and Mathieu Gissel-brechtTo be submitted to Review of Scientific Instruments.
The compromises necessary for 3D momentum imaging of electrons and ions inthe same spectrometer are investigated analytically and by simulations. By selectingthe acceleration or deceleration in a second region and having an adjustable lens cur-vature, the spectrometer design can be adapted to diverse applications and sourceproperties without breaking the vacuum. Using light in the infrared or extreme ul-traviolet and a molecular beam for the sample delivery, we demonstrate three verydifferent applications: 1) mass resolution of Xe+ isotopes, 2) momenta of N+ from thedissociation of N+
2 and 3) electron momenta from acetone or acetylene distinguishedby the ion mass in coincidence.
I analysed the spectrometer design analytically and numerically, built it together
with M. Gisselbrecht, performed the experiments and wrote most of the manuscript.

x

Contents
1 Introduction 1
2 Light–matter dynamics 32.1 Ultra-fast processes . . . . . . . . . . . . . . . . . . . . . . . . . . . . . 32.2 Approaches to retrieve time-information . . . . . . . . . . . . . . . . . 72.3 Angular distribution . . . . . . . . . . . . . . . . . . . . . . . . . . . . 8
2.3.1 Molecular dissociation . . . . . . . . . . . . . . . . . . . . . . . 82.3.2 Scattering phase . . . . . . . . . . . . . . . . . . . . . . . . . . 9
2.4 Pump–probe methods . . . . . . . . . . . . . . . . . . . . . . . . . . . 122.4.1 Femtosecond time scale . . . . . . . . . . . . . . . . . . . . . . 132.4.2 Attosecond time scale . . . . . . . . . . . . . . . . . . . . . . . 14
3 Light-source specific methods 173.1 Synchrotron radiation . . . . . . . . . . . . . . . . . . . . . . . . . . . 183.2 Generation of attosecond pulse trains . . . . . . . . . . . . . . . . . . . 203.3 Electron interferometry: the RABBIT method . . . . . . . . . . . . . . 24
4 Spectrometry of charged particles 294.1 Coincident detection of ionization products . . . . . . . . . . . . . . . 294.2 Magnetic bottle electron spectrometer . . . . . . . . . . . . . . . . . . 334.3 Electrostatic spectrometers . . . . . . . . . . . . . . . . . . . . . . . . 39
4.3.1 Mass spectrometry . . . . . . . . . . . . . . . . . . . . . . . . . 404.3.2 Momentum imaging . . . . . . . . . . . . . . . . . . . . . . . . 41
5 Applications 475.1 Attosecond electron dynamics . . . . . . . . . . . . . . . . . . . . . . . 47
5.1.1 Time-resolved double ionization of xenon . . . . . . . . . . . . 475.1.2 Plasmon resonance in photoionization of C60 . . . . . . . . . . 61
5.2 Femtosecond dynamics in molecules . . . . . . . . . . . . . . . . . . . 655.2.1 Core-excited tri-atomic molecules . . . . . . . . . . . . . . . . . 665.2.2 Pump–probe study of the dissociation of acetylene . . . . . . . 73
5.3 Outlooks . . . . . . . . . . . . . . . . . . . . . . . . . . . . . . . . . . . 83
Acknowledgements 85
xi

xii CONTENTS
Common abbreviations, symbols and terms
1 as 10−18 s, an attosecond1 fs 10−15 s, a femtosecond1 ps 10−12 s, a picosecond1 ns 10−9 s, a nanosecondcation Ion with charge +1 (in units of the elementary charge)dication ion with charge +2DI Double ionizationEn, EI Atomic/ionic energy with respect to neutral ground stateǫ Kinetic energyεr Relative permittivityIR Infrared lightMBES Magnetic Bottle Electron SpectrometerRABBIT Reconstruction of Attosecond Beating By Interference of
Two-photon transitions (a method involving photoelectroninterferometry)
SI Single ionizationt Time, for instance time-of-flightτ Time delay in interferometry, for electrons or lightXUV Extreme ultraviolet light: 10–124 eV, wavelength 10–124 nmX ∝ Y X is proportional to YX ∼ Y X is of the same order of magnitude as YX∗ An excited electronic configuration of the atom or molecule X

Chapter 1
Introduction
Photoionization is a fundamental process but also a powerful tool for understand-ing the electronic structure of matter and dynamics within atoms and molecules.Hertz’ discovery of the photoelectric effect in 1887 and Einstein’s explanation usinga quantum of light (a photon) in 1905 [1–3] contributed to the development of quan-tum mechanics and the wave–particle duality [4] that underpins modern physics andchemistry. In the language of this thesis, concerning isolated molecules or atoms invacuum, the photoelectric effect corresponds to one-photon single ionization. Doubleionization by one photon is even more interesting, because it involves multiple in-teracting bodies and requires quantum mechanical correlation between electrons (oreven nuclei) to be explained.
Electronic relaxation has been a key concept, studied in atoms by electron spec-troscopy since the discovery of the Auger effect [5–7] to direct double ionization [8, 9].More recently, few-femtosecond laser pulses have been used to access Auger decay inthe time domain [10]. Complex relaxation mechanisms involving the delocalization ofelectrons between atoms or even molecules (in a cluster or at a surface) are activelybeing examined using the tunable x-rays from synchrotrons [11–13]. Development ofspectrometer technology has allowed the coincident study of a correlated electronpair emitted in double ionization [8, 14, 15]. One-photon double ionization of thehelium atom, the most fundamental three-body system, has been studied in greatdepth [9, 16].
The combination of advanced light sources and spectrometers is utilized in thepresent work to study dynamics on the quantum-mechanical level in matter. In atoms,we use attosecond pulses and a probing laser pulse to study direct double ionizationand delays in the time it takes for the electrons to leave the atom. In molecules, theelectronic relaxation itself can be used as an indicator of the time scale for nuclearmotion [17, 18]. In that case we excite an inner-shell electron with soft x-rays andin the core-excited state the molecule can deform and dissociate in various ways,with different localizations of charge between the fragments. We use spectrometersthat can measure the kinetic energy and angular distribution of multiple ions orelectrons coming from one original molecule. The design and optimization of suchspectrometers for different applications is another part of the work presented here.
This thesis emphasizes the temporal perspective: What are the time scales for dif-
1

2 CHAPTER 1. INTRODUCTION
ferent processes, in what order do they take place and how can we study them? Theprocesses studied here are “ultra-fast”, meaning that they occur within a picosec-ond or faster than molecular rotation, which necessitates specialized tools for themeasurements. Chapter 2 covers the basic processes and experimental approaches.Advanced light sources and method details are presented in chapter 3 and the spec-trometers in chapter 4. Chapter 5 presents the specific ultra-fast processes that havebeen studied and describes the results. A concise summary of the papers and mycontributions was given on page vii.
Attosecond science
The field of attosecond science, where dynamics in atoms and molecules can bestudied on its natural time scale, is just over a decade old. Actually, the necessarylaser technology was available earlier [19, 20] but to conclude that attosecond pulseswere produced [21] and use this light in applications has required many new methodsto be developed [22, 23]. Naturally, the early applications concerned a single electronfrom an atom [10] – only in recent years has attosecond science in molecules beenrealized [24].
Since an intense femtosecond laser is used to produce attosecond pules, studiesof attosecond dynamics directly within the intense laser pulse were for a long timethe dominant approach [25]. This strong-field regime is quite far from the traditionaldescription of stationary states of matter in atomic physics and spectroscopy, but cor-relation involving the ejected electrons and their re-scattering off the ion could be ex-amined [26, 27]. After my time as doctoral student started in 2009, free-electron lasersat high photon energies have become operational and allowed few-photon double ion-ization processes to be studied at various intensities [28, 29]. With the attosecondpulses, several pump–probe and interferometry methods were developed around thistime and a route to applications concerning electron correlation in atoms was foundby measuring delays of the electrons emitted in one-photon single ionization [30–32].
Combining attosecond pulses from 1 kHz laser systems with the coincident detec-tion of multiple particles remains challenging despite a decade of world-wide efforts.A key result in this thesis (Paper I) is the interferometry on a two-electron wavepacket to determine delays in one-photon direct double ionization. To my knowledge,this is the first application of coincidence methods for attosecond science in the ex-treme ultraviolet. The current development of laser systems with higher repetitionrate is driven much by the wish to access the dynamics of correlated particles. Acommentary on the state-of-the art and outlooks for attosecond science was recentlygiven in Ref. [25].
Chapter 2
Light–matter dynamics
2.1 Ultra-fast processes
Photoabsorption and photoionization
Excitation or ionization of matter due to the absorption of light are fundamentalprocesses described by quantum mechanics [33–35]. The absorption of a photon candirectly ionize the sample, which is known in solids as the photoelectric effect [1].The fact that the kinetic energy of the electron, ǫ = ~ω−EI depends on the photonenergy ~ω (angular frequency ω and the reduced Planck constant ~) rather thanthe flux or intensity1 of light was discovered by Lenard in 1902 and explained byEinstein in 1905 [2] (reviewed in [3]). In the original context of metallic surfaces thequantity EI is the work function while for gaseous samples it is the ionization energy.By spectrometry of the photon and the electron, EI can be deduced and provideinformation about the sample.
For the interpretation of photoelectron spectra, Koopman’s theorem [35], is agood starting point: If all other electrons are unaffected, EI equals the binding en-ergy of the removed electron. In reality, electron orbitals in an ionic state are slightlydifferent than in the neutral due to multi-electron effects such as correlation andscreening. Thus EI = Efinal−Einitial more precisely represents the change in internalenergy between the initial atomic and final ionic state. With Einitial = 0 as referencelevel throughout this work, EI is simply the energy of the ion. The interaction withlight is usually described by a single-particle dipole operator, acting on individualelectron coordinates, and correlated electron motion is treated within the initial andfinal states [33]. While the binding energy concept gives an understanding of themain lines of a photoelectron spectrum with ions in one-hole final states, the ion mayundergo an internal relaxation to states which have additional holes, by interactionamong its electrons. In shake-up an electron in the ion is raised to a normally un-occupied orbital [36], exciting the ion and reducing the observed kinetic energy ofthe photoelectron to so-called satellite lines in the spectrum. In shake-off anotherelectron is set free, resulting in double ionization [37, pp. 1543–1547]. Intuitively,
1 With high-intensity laser light, multi-photon absorption or even a classical wave treatment canbe relevant. A perturbative one- or two-photon treatment is sufficient for the studies reported here.
3

4 CHAPTER 2. LIGHT–MATTER DYNAMICS
A+
A
A+
A
Excited state
Direct ionization
e–e–
0
Inte
rnal en
erg
y
EI
Indirect ionization
Photo
n
ħω
Photo
n
Figure 2.1: Direct and indirect ionization. The absorption of a photon (up-wards arrow, γ) can either directly ionize the sample (A + γ → A+ + e−) or excitethe sample to an excited state (A + γ → A∗). The excited state eventually relaxesto a lower internal energy, and emits the excess energy an electron (fluorescence isnot studied here). The horizontal lines represent states of the atom/ion, referringto the internal energy axis. For the direct process one follows both the photon andelectron (e−) arrows directly to the ionic state, without a well-defined intermediatestate. For the indirect process already the photon arrow leads to a discrete atomicstate, which later autoionizes.
these kinds of energy transfer must occur very quickly, on the attosecond time scale,before the photoelectron has left the atom.
Figure 2.1 illustrates that there are both direct and indirect routes to ionization.Direct single ionization is the photoelectric effect, where the dipole operator directlycouples the initial state to a final state with one free electron. The upwards arrow inthe figure represents the photon energy absorbed, and the length of the downwardsarrow represents the kinetic energy of the photoelectron: ǫ = ~ω − EI. For indirectionization the photoabsorption (upwards arrow) instead leads to a highly excitedneutral state, above the ionization threshold. It may then decay by autoionization,i.e. a transition to the final state with one free electron and a reduced internal energyof the ion. The operator for autoionization is the Coulomb interaction among thebound electrons, proportional to
∑
i<j 1/ri,j where ri,j = |~rj − ~ri| is the differencebetween coordinates for electrons labelled i and j [33]. In the Auger effect a holein an inner orbital is filled by the autoionization transition. As shown in the figure,electrons of the same kinetic energy are produced by direct and indirect processes butthe indirect contribution will only be observed when the photon energy is resonantwith an available state. It may then dominate or interference with the direct path[38]. The excited state before the autoionization may be ionic rather than neutral, ifprepared by a previous ionization stage. In this case the result is indirect double ion-ization. Interaction between photoelectron and secondary electron in the continuumcan be neglected if the lifetime of the excited state is several femtoseconds and thephotoelectron energy not too low [39].
2.1. ULTRA-FAST PROCESSES 5
When absorption of one photon leads to double ionization, directly or indirectly,energy conservation implies
ǫ1 + ǫ2 = ~ω + Einitial − Efinal = ~ω − EI (2.1)
where ǫ1 and ǫ2 are the kinetic energies of the two electrons set free. Einitial = 0 is stillthe neutral ground state energy while EI = Efinal is generalized to the energy of thefinal doubly charged ion. Knowing the photon energy and measuring both electronenergies provides information about both the excited intermediate state (if indirect)and the doubly charged final state, thus the entire double ionization process of anatom [14]. In molecules, dissociation can lead to substantial kinetic energy of alsothe ionic fragments which would prevent the identification of EI with static states.To study molecular dynamics the energies of the ions must be measured, ideallyboth electron and ion momenta in 3D [40–42]. In the present work double ionizationhas been studied by measuring either the electrons or the ions, but Paper VI alsodemonstrates coincident electron–ion analysis with a newly constructed spectrometer.
Nuclear dynamics in molecules
In addition to the electronic state, a molecule has nuclei that contribute to thetotal energy and to the complexity of the system. An exact molecular wavefunction,Ψ(~R1, ~R2, . . . , ~r1, ~r2, . . . , t), has coordinates for each constituent nucleus (~Ri), electron(~rj) and the time (t). For any practical calculation, the wavefunction is factorizedinto Ψ = ΨnΨe with Ψn having the nuclear coordinates and Ψe the electronic – anapproach called the Born–Oppenheimer approximation [35]. The internal energy ofthe molecule is thereby separated into electronic energy (a configuration of molecularorbitals, for a particular nuclear geometry) and vibrational energy (the motion ofnuclei). This approximation is justified when the nuclei move much more slowlythan electrons: electrons on the attosecond time scale and nuclear vibration on thefemtosecond time scale, essentially because atomic masses are a few thousand timesas large as the electron mass. As will be discussed later, the nuclei sometimes movequite fast and it is interesting to study processes where electronic and nuclear motioncan not be separated.
If the total electronic energy is plotted as function of nuclear coordinates, a po-tential energy curve or landscape (hypersurface) appears. Figure 2.2 illustrates thiswith the bond length between O and CO in CO2. The slope of the curve representsthe net Coulomb force acting between the O and CO parts of the molecule. A bindingmolecular orbital has a minimum in the potential energy, and quantized vibrationalstates localized within the well (indicated by horizontal lines). The 5Σ− state of thedication (doubly charged ion) is repulsive and dissociates rapidly, while the predis-sociative 3Σ−
g has vibrational states with some lifetime before dissociation. Duringdissociation, the initial excess in potential energy is converted to kinetic energy ofthe fragments as the bond length expands. This is indicated by a dotted total-energyline from one of the vibrational levels in 3Σ−
g to braces for kinetic energy sharingon the right side. Excitation to different curves, or points on curves, can determinewhat deformation (isomerization, proton migration) or bond breakage the molecule

6 CHAPTER 2. LIGHT–MATTER DYNAMICS
CO2
Bond length between O and CO
Energ
y
O+
CO+
CO22+
O+ & CO+
O & CO
X 3 g�
5 �
Figure 2.2: Potential energy curves and their relation to dissociation. Afew potential energy curves for the CO2 molecule and its dication are sketched [43](not to scale) along the coordinate where one O–CO bond is extended and eventu-ally broken. The configuration of electronic orbitals, illustrated in the boxes, showthat the dication ground state is considered. Nuclear motion adds kinetic energyon top of the potential energy curve and quantized, bound vibrational states areshown as thin lines. The CO2+
23Σ−
g state has vibrational levels that are unstable.They may dissociate by internal conversion to a dissociative state or in principleby tunnelling through a barrier along the dotted line. Dissociation releases kineticenergy to the fragments, as indicated by braces on the right side.
is driven towards. In this thesis, processes that lead to ionic fragments are studiedby measuring their final momentum vectors. If multiple fragments are charged anddissociation along all coordinates occurs simultaneously, it is called concerted.
If bending or dissociation of the molecule only takes a few femtoseconds, theBorn–Oppenheimer approximation may not hold and coupling between vibrationaland electronic degrees of freedom becomes important 2. The light mass of a protoncompared to other atoms means that proton migration in hydrocarbons (50 fs [45,46]), and the bending or Coulomb explosion of water are candidates for this. Wealso study the case where an electronic excitation of carbon dioxide breaks the linearsymmetry (the Renner–Teller effect, section 5.2.1) and bends the molecule althoughthe Auger lifetime of the excited state is only 6 fs.
2 Theoretically, the inclusion of nuclear motion in the electron part of the Hamiltonian (and thusin Ψe) has recently been discussed as a way to represent the exact wavefunction [44].
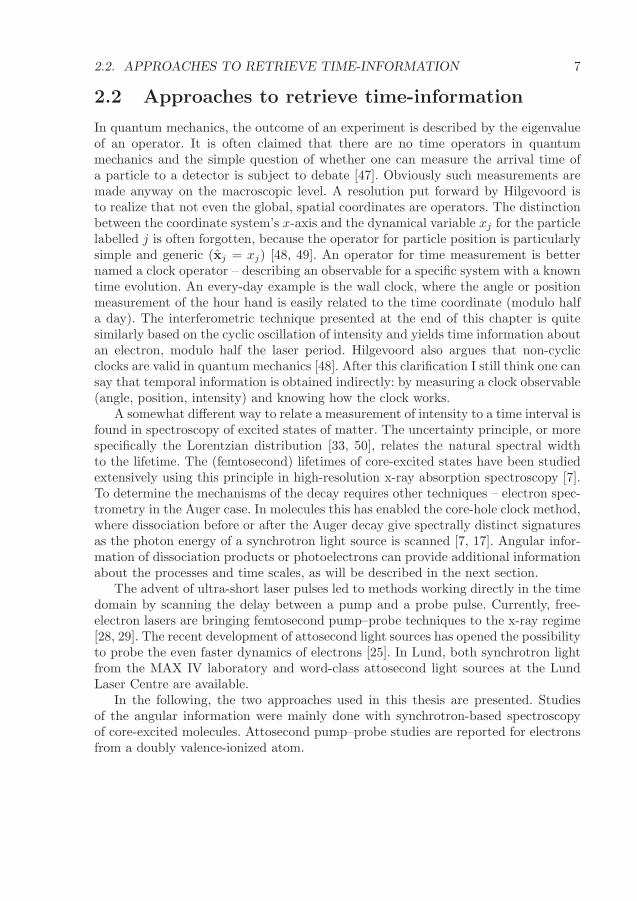
2.2. APPROACHES TO RETRIEVE TIME-INFORMATION 7
2.2 Approaches to retrieve time-information
In quantum mechanics, the outcome of an experiment is described by the eigenvalueof an operator. It is often claimed that there are no time operators in quantummechanics and the simple question of whether one can measure the arrival time ofa particle to a detector is subject to debate [47]. Obviously such measurements aremade anyway on the macroscopic level. A resolution put forward by Hilgevoord isto realize that not even the global, spatial coordinates are operators. The distinctionbetween the coordinate system’s x-axis and the dynamical variable xj for the particlelabelled j is often forgotten, because the operator for particle position is particularlysimple and generic (xj = xj) [48, 49]. An operator for time measurement is betternamed a clock operator – describing an observable for a specific system with a knowntime evolution. An every-day example is the wall clock, where the angle or positionmeasurement of the hour hand is easily related to the time coordinate (modulo halfa day). The interferometric technique presented at the end of this chapter is quitesimilarly based on the cyclic oscillation of intensity and yields time information aboutan electron, modulo half the laser period. Hilgevoord also argues that non-cyclicclocks are valid in quantum mechanics [48]. After this clarification I still think one cansay that temporal information is obtained indirectly: by measuring a clock observable(angle, position, intensity) and knowing how the clock works.
A somewhat different way to relate a measurement of intensity to a time interval isfound in spectroscopy of excited states of matter. The uncertainty principle, or morespecifically the Lorentzian distribution [33, 50], relates the natural spectral widthto the lifetime. The (femtosecond) lifetimes of core-excited states have been studiedextensively using this principle in high-resolution x-ray absorption spectroscopy [7].To determine the mechanisms of the decay requires other techniques – electron spec-trometry in the Auger case. In molecules this has enabled the core-hole clock method,where dissociation before or after the Auger decay give spectrally distinct signaturesas the photon energy of a synchrotron light source is scanned [7, 17]. Angular infor-mation of dissociation products or photoelectrons can provide additional informationabout the processes and time scales, as will be described in the next section.
The advent of ultra-short laser pulses led to methods working directly in the timedomain by scanning the delay between a pump and a probe pulse. Currently, free-electron lasers are bringing femtosecond pump–probe techniques to the x-ray regime[28, 29]. The recent development of attosecond light sources has opened the possibilityto probe the even faster dynamics of electrons [25]. In Lund, both synchrotron lightfrom the MAX IV laboratory and word-class attosecond light sources at the LundLaser Centre are available.
In the following, the two approaches used in this thesis are presented. Studiesof the angular information were mainly done with synchrotron-based spectroscopyof core-excited molecules. Attosecond pump–probe studies are reported for electronsfrom a doubly valence-ionized atom.

8 CHAPTER 2. LIGHT–MATTER DYNAMICS
2.3 Angular distribution
A formalism for describing the angular distribution of particles emitted in photoion-ization has been developed particularly by Zare and S. Yang [51, 52] in the dipoleapproximation. A recent review [53, sec. 2.5] that includes multi-photon processesalso points out the earlier and more general work of C. N. Yang [54]. For sphericallysymmetric samples, such as atoms, the photoelectron angular distribution is given bythe amplitude and phase of partial waves. A change in the phase of a wavefunctioncan also be interpreted as a time delay, and this connection will be established below– unifying the measurement approaches used within this thesis.
2.3.1 Molecular dissociation
A resonant transition in a molecule, i.e. between two states of well-defined symmetry,is most likely to occur if the transition dipole moment is aligned with the polariza-tion vector of the exciting radiation (~E). Within this thesis, absorption occurs by one
linearly polarized photon. Because it has the dipole operator ~E · ~r ∝ cos θ′, where~r holds the coordinates of an electron and θ′ is an angle from the polarization vec-tor (to the electron, or in a molecule to the transition dipole moment), one-photonionization cannot give an angular distribution more aligned than cos2 θ′ [33, 51, 53].This alignment is essentially a selectivity in the absorption, shown by the blue curvesin the polar plots of Fig. 2.3. What we observe in a measurement is the direction inwhich dissociation fragments (or photoelectrons) are emitted, shown by green filled
θθ
σ(θ)
(a) (b) (c)
β = 2
β = 1
Time
σ(θ)
I(θ)
β = 0.87
Figure 2.3: Angular distribution of molecular fragments. The orientationof a linear CO2 molecule (a–b) is fully characterized by the angle θ from the po-
larization ~E , while an angle γ (not shown) around the molecular axis also mattersfor the bent H2O molecule (c). The absorption cross section σ(θ, γ) mainly selectsmolecules of a particular orientation, indicated below each polar plot. Rapid dis-sociation gives the angular distribution I(θ) which is identical to σ(θ) in case ofon-axis dissociation for (a) Σ → Σ and (b) Σ → Π transitions but (c) rotated andsmeared for emission at an angle after a A1 → B2 transition.

2.3. ANGULAR DISTRIBUTION 9
curves in the figure for various angles, θ, from the polarization vector. Generally, theangular distribution of a fragment is parameterized by the one-photon anisotropyparameter β via the expression I(θ) ∝ 1 + (3 cos2 θ − 1)β/2.1 For an Auger elec-tron, the anisotropy parameter is sometimes factorized into β = A20α2 where A20
represents the alignment of the excited ion (distribution of angular momentum quan-tum numbers) and α2 represents the electron emission (interference between partialwaves) [33, sec. 3.5][56]. We can analogously discuss two factors that determine themolecular β-parameter [52]: Photoexcitaion introduces anisotropy and dissociationpreserves or erodes it. It is fully preserved in a rapid dissociation along the transitiondipole moment (the axial recoil approximation [51]) while emission at other bondangles or after rotation erodes the anisotropy towards β → 0.
In the case of a linear molecule, maximum alignment is achieved for a paralleltransition (Σ → Σ) where molecules having the axis along the polarization are mostlikely absorb, shown to yield β = 2 in Fig. 2.3(a). A perpendicular (Σ → Π) transi-tion in (b) aligns the molecular axis in the plane perpendicular to the polarizationand corresponds to β = −1. In molecules without linear symmetry, fragments can beemitted at angles neither parallel nor perpendicular to the transition dipole moment(or molecular axis) and give intermediate β-values. In (c) a perpendicular alignment(A1 →B2) of the water molecule’s symmetry axis is shown. If a proton is emitted inthe molecular plane along its bond, at 52◦ from the symmetry axis, it leads to thedisplayed (shaded green, β ≈ 0.87) distribution which is nearly parallel to the polari-zation again2. Since the water molecule is not linear, the absorption cross section’sdependence on rotation around the molecular axis has also been considered.
Experimentally, the angular distribution will fit the predicted β-value (e.g. Fig. 2.3)if the dissociation occurs promptly, known as the axial recoil approximation. Any ro-tation or change in the molecular geometry between absorption and fragment ejectionwill result in an erosion of the alignment. Thus the magnitude of the experimental|β| is an indicator of the dissociation time scale [52, 57]. By preparing a short-livedcore-excited state (Auger lifetime < 10 fs), with a hole localized to a specific atom,the final charges of the fragment can sometimes inform on which bonds were brokenearly or late [58]. If momentum vectors of multiple fragments are measured, their cor-relation (in energy and/or direction) gives more specific information, often visualizedin Newton diagrams [59, 60] and Dalitz plots (section 5.2.1).
2.3.2 Scattering phase
While the same general theory for angular distribution applies to ionization of atoms,it is here feasible to analytically relate β to transition matrix elements for the photo-electron [33, 61, 62]. For ionization from a p-subshell, the s (l = 0) and d (l = 2)partial waves of the photoelectron interfere and their relative magnitudes and phasesdetermine β as function of energy. The reasons for energy-dependence of the phaseand the time delay interpretation are found by examining the wavefunction of an
1 With multiple (parallel) photons, higher-order Legendre polynomials of cos θ are used [53, 55].2 Emission of the fragment at an angle χ from the transition dipole moment gives β = 3 cos2 χ−1
[52]. The proton bond in water is at χ = 90◦ − 104.45◦/2 for the perpendicular transition.

10 CHAPTER 2. LIGHT–MATTER DYNAMICS
outgoing photoelectron with azimuthal quantum number l and magnetic quantumnumber m.
The wavefunction for a photoelectron is theoretically derived using the reverse ofa formulation for electron scattering, with both incoming and outgoing waves beingpart of the solution [33, ch. 7]. To identify a time delay in the propagation away fromthe atom, only the outgoing wave is considered. Close to the atom, a basis set ofspherical waves is necessary (involving l and m) but asymptotically far away, wherethe kinetic energy is ǫ, the solution has the form of a planar wave. If the momen-tum vector is measured in an experiment, the plane wave with a specified directionserves as the final state onto which the full wavefunction is projected. Relations be-tween spherical and planar functions and normalization factors can be ignored toconcentrate on the phase factor in the final state [63, 64]
Ψ~k,l(~r, t) ∝ exp(
i[
~k · ~r − ǫt~
+Zion
|~k|a0ln(2~k · ~r) + η l(ǫ)−
lπ
2
])
, (2.2)
where a0 is the Bohr radius and ~k = ~p/~ is the wave vector, proportional to theelectron momentum ~p and giving the kinetic energy ǫ = k2~2/2me. In the total phase,~k · ~r − ǫt/~ gives the trivial phase for the oscillation of the outgoing wave and lπ/2results from a “centrifugal barrier” dependent on the orbital angular momentum. Theterm containing the charge, Zion, of the resulting ion
3 is due to an attractive Coulombpotential (hydrogen-like case) while all non-Coulombic effects due to screening andcorrelation (still in a central field approximation) are represented by the scattering
phase η l(ǫ). Thus η l is associated with more advanced models for the atomic potentialand through the interference of different partial waves (l,m) it affects the observableangular distribution.
In measurements with attosecond pulses of light, the atomic potential and thusthe scattering phase can be linked to the propagation time of the photoelectron duringits departure from the ion. Figure 2.4 illustrates that as a photoelectron leaves theatomic potential, it gains potential energy and loses kinetic energy. A potential thatrises earlier (solid curve) causes a delay with respect to a more slowly rising potential(dashed curve), because of the earlier speed reduction. This classical argument can beapplied to the wavefunction by invoking the semiclassical Wentzel–Kramers–Brillouin(WKB) approximation [64, 65] for one spatial dimension, x. The attractive atomicpotential, V (x) < 0, determines the local kinetic energy, p2local/(2me) = ǫ − V (x)where me is the electron mass. The WKB wavefunction is written
ΨWKBǫ (x, t) ∝ exp
(
i[
W (x)− ǫt]
/~)
, W (x) =
∫ x
0
√
2me[ǫ− V (x′)] dx′ , (2.3)
where W (x) is called Hamilton’s characteristic function. The absolute phase of thewavefunction is not meaningful and the purpose here is to find the phase difference,η = (W − WCoul)/~, between propagation in the atomic potential and a Coulombpotential. In a strict sense, the Coulomb potential is defined for three-dimensional
3 Only integer charges are used here. Short-range, non-Coulomb effects appear in η l(ǫ).
2.3. ANGULAR DISTRIBUTION 11
Local kineticenergy
Same final kinetic energy
Group delay
0
Ele
ctr
on e
nerg
yPhoton
EI
Atomic potential
Coulomb potential
Photoelectronpacket
Propagation
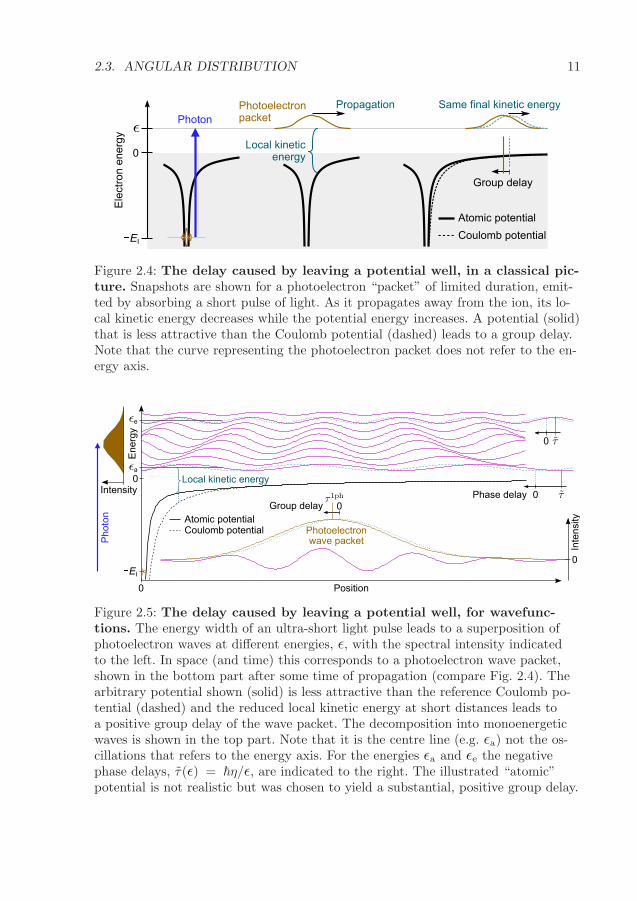
Figure 2.4: The delay caused by leaving a potential well, in a classical pic-ture. Snapshots are shown for a photoelectron “packet” of limited duration, emit-ted by absorbing a short pulse of light. As it propagates away from the ion, its lo-cal kinetic energy decreases while the potential energy increases. A potential (solid)that is less attractive than the Coulomb potential (dashed) leads to a group delay.Note that the curve representing the photoelectron packet does not refer to the en-ergy axis.
0Group delay
Photoelectronwave packet
0
Energ
y
Local kinetic energy
0 Position
Atomic potentialCoulomb potential
0
Inte
nsity
Intensity0Phase delay
0
e
a
Photo
n
EI
Figure 2.5: The delay caused by leaving a potential well, for wavefunc-tions. The energy width of an ultra-short light pulse leads to a superposition ofphotoelectron waves at different energies, ǫ, with the spectral intensity indicatedto the left. In space (and time) this corresponds to a photoelectron wave packet,shown in the bottom part after some time of propagation (compare Fig. 2.4). Thearbitrary potential shown (solid) is less attractive than the reference Coulomb po-tential (dashed) and the reduced local kinetic energy at short distances leads toa positive group delay of the wave packet. The decomposition into monoenergeticwaves is shown in the top part. Note that it is the centre line (e.g. ǫa) not the os-cillations that refers to the energy axis. For the energies ǫa and ǫe the negativephase delays, τ(ǫ) = ~η/ǫ, are indicated to the right. The illustrated “atomic”potential is not realistic but was chosen to yield a substantial, positive group delay.

12 CHAPTER 2. LIGHT–MATTER DYNAMICS
space but VCoul(x) = −Zione2/4πε0x can be used in the one-dimensional illustra-
tion, with e being the elementary charge and ε0 the electric constant. Absorptionof an ultra-short pulse of light leads to a superposition of photoelectron waves atdifferent energies, as illustrated in the left part of Fig. 2.5. In space and time thiscorresponds to a photoelectron wave packet. The bottom part of the figure shows thewave packet’s intensity envelope (dark orange) after some time of propagation awayfrom the nucleus. In close analogy to the group delay of an optical pulse propagatingthrough a dispersive medium [50] one can define a group delay for the photoelectronwave packet. The arbitrary potential shown (solid lines) is less attractive than thereference Coulomb potential (dashed lines) and one may expect the locally reducedkinetic energy to lead to a positive group delay with respect to the Coulomb refer-ence. The decomposition into monoenergetic waves is shown in the top part (magentacurves) and somewhat confusingly the phase delays, τ(ǫ) = ~η(ǫ)/ǫ, are all negative.The explanation lies in that the high energies are affected less than the low ener-gies by the potential, η(ǫ) → 0 when ǫ → ∞. The photoelectron group delay forone-photon ionization, defined as [63, 64]
τ1phI (ǫ) = ~∂η
∂ǫ, (2.4)
is thus still positive when our atomic potential is less attractive (more repulsive)than the Coulomb potential. The photoelectron group delay is also known as theWigner-like delay, because Wigner made a similar analysis [66] for a scattered elec-tron, then referenced against free space (Vref(x) = 0) instead of the Coulomb poten-tial4. Intuitively, electron interaction can be expected to cause repulsion and positivegroup delays. However, the reference Coulomb potential for an ion with the chargeZion = Z−B already includes the full screening of the +Z charged nucleus by the Belectrons that remain bound. Sufficiently close to the nucleus the real potential willbe more attractive and both negative and positive group delays τ1phI are possible,depending on the detailed interaction and from what subshell the electron is taken.
2.4 Pump–probe methods
An obvious way to study a fast process is to record snapshots at different times.By analogy with photography (see back cover), the result will be blurry if the objectmoves or changes appreciably while a snapshot is being recorded. A supersonic bulletcould be photographed using short (10−6 s) flashes of light already around 1889 [67]but nuclei in molecules may vibrate and rearrange appreciably in 10−14 s = 10 fsand an electron leaves an atom a few orders of magnitude faster yet. To study light–matter interaction and photochemistry it is then natural to look for the shortestpossible pulses of light. A pulse in the electromagnetic field cannot last less than oneperiod, which for visible light is 1.3 (violet) to 2.5 fs (red). This has been called the
4 Since a scattered electron first approaches and then departs, the original Eisenbud–Wigner–Smith delay is twice as large as an ionization delay [64].

2.4. PUMP–PROBE METHODS 13
femtosecond barrier [23, 68] and molecular [69, 70] but not electronic dynamics couldbe recorded in the 20th century.
2.4.1 Femtosecond time scale
In the general pump–probe experiment, a photoreaction is initiated by the pumppulse and after a variable delay the probe pulse makes a “measurement” by transfer-ring the evolving molecule to something that gives a measurable signal. For instance,Fig. 2.6(a) shows a generic AB molecule being excited by the probe to AB∗ where areaction starts to take place, here a simple dissociation of an antibonding state. Theprobing process is in this case photoionization (to AB+ which is also shown dissocia-tive) and the kinetic energies of electron and/or the ionic fragment could be analysed.More generally, a reaction passing through a bound but short-lived intermediate stateX which decays to Y, could be probed either by the remaining population in X orthe appearance of population in Y, if they yield distinct observables such as absorp-tion coefficient, kinetic energy or mass per charge. The experiment is performed ina stroboscopic fashion, recording only one snapshot per initiated reaction. Assumingthat all sample molecules start from identical state distributions, the measurementaccumulates statistics for multiple repetitions at one chosen delay before moving tothe next probe delay setting.
Pump–probe studies are usually performed with lasers where short pulses canbe produced and the delay accurately controlled. In section 5.2.1 soft x-ray photonsfrom a synchrotron are used to study molecular dynamics. These pulses are much
En
erg
y
AB*
A+ & B
AB
AB+
AB*
AB
Reaction coordinate (A–B bond length)
X-rayPump
Probe
& BA
AB+
e–
& BA*
e–
(a) (b)
Figure 2.6: Probing of a photoreaction by photoionization or autoioniza-tion. (a) A pump pulse initiates a reaction, here dissociation of a neutral molecule.A probe pulse photoionizes the sample after an experimentally controlled delay andinformation about the intermediate state is carried by for instance the kinetic en-ergies of photoelectron and ion. (b) With only one photon (x-ray), the resonantAuger effect can be used to “probe” a core-excited state after a few femtoseconds.

14 CHAPTER 2. LIGHT–MATTER DYNAMICS
longer than the molecular dynamics but we let a fast Auger decay process in themolecule provide a kind of probe by autoionization, illustrated in Fig. 2.6(b). Some-times, excited states with different Auger lifetimes can be used as a way to vary the“probe” delay, but the analogy to a pump–probe study should not be stretched toofar. An advantage with respect to conventional (bound-electron) lasers is that thesynchrotron’s monochromatic x-rays can be tuned over a wide range and selectivelyexcite or ionize inner electrons from different atoms in the molecule. The moleculecan be put far from equilibrium so that fast, unusual reactions occur and dissocia-tion fragments with a wide range of energies can be analysed. This is the topic ofsection 5.2.1.
2.4.2 Attosecond time scale
In the attosecond physics community a diverse fauna of pump–probe methods havebeen demonstrated [22–24]. In many, but not all [71], cases the extreme ultraviolet(XUV) attosecond pulse serves as the pump and an infrared pulse as the probe. Some-times an isolated attosecond pulse is used [30], in other cases a train of attosecondpulses (of the order of 10 fs long) [21, 31, 32, 72–75]. These techniques make the phasebetween different partial waves or energies accessible. Recently, group delays in sin-gle ionization have been measured [30–32] using the so-called streaking and RABBITmethods. RABBIT will be introduced here and further defined in section 3.3.
IR emission
IR absorption
−EI
0
Ele
ctr
on
en
erg
y
Photoionization Interferometry
and
e
a
Bound
H∙ħω
(H+
2)ħω
ħω
ħω
Figure 2.7: Electron interferometry upon single ionization.(left) Ionization by an extreme-ultraviolet photon leads to photoelectrons of the ki-netic energy ǫa or ǫe, depending on whether the absorbed photon energy was H~ωor (H + 2)~ω. These photon energies are harmonics of a fundamental frequency ωin the infrared (IR), with H and H + 2 being the harmonic orders (odd).(right) If infrared light is present, the electrons may absorb or be stimulated toemit the IR photon energy, ~ω. Fractions of the two different electron wavefunc-tions (dotted and dashed black) are then transferred to the “sideband” final kineticenergy (dash-dotted) where they interfere.

2.4. PUMP–PROBE METHODS 15
The RABBIT method relies on interference between two quantum paths to thesame final state for the free electron. Figure 2.5 showed that photoionization by anattosecond pulse gives a photoelectron wave packet with a superposition of electronsat different energies. We can consider the two contributions at kinetic energies ǫa andǫe separately in the left half of Fig. 2.7. For a suitable choice of energies (which willbe explained in section 3.3) the electron fraction at ǫa can absorb a probe photonand the fraction at ǫe be stimulated to emit a probe photon so that both reach thesame final energy. This final energy (dash-dotted), reached by a two-photon process,is known as a sideband.
The measured intensity of electrons in the sideband, S, will depend on the phasedifference, ∆, between the two interfering terms in the final wavefunction. ∆ containsthe one-photon scattering phase difference but also properties of the ionizing andprobing light. An analysis of the two-photon transition matrix elements (Ma andMe) leads to the expression [63, 64, 68]
S(τIR) = |Ma +Me|2 = S0 + Sosc cos(∆) = S0 + Sosc cos(
2ω(τIR − τexp))
(2.5)
which shows that the intensity oscillates when the delay τIR between the pump andprobe pulses is scanned. An analogy can be made to the Michelson interferometer [76]where the difference in path length between two arms controls the optical interference.The average intensity S0 and amplitude Sosc are usually less interesting than theobservable sideband delay τexp, which contains the photoelectron group delay τ1phI .How the other terms in τexp are subtracted will be explained in section 3.3.
Thus while a study of the angular distribution of photoelectrons concerns theintrinsic interference between different partial waves (η influencing β), the RABBITmethod uses a probe photon to induce interference between different energies (yield-ing the energy-derivative of η). Another two-path interferometry method with atto-second pulses has been demonstrated between direct single ionization and sequentialionization via excited intermediate states [77]. In section 5.1.1, RABBIT is appliedto direct double ionization to measure the group delay of a two-electron wave packetfor the first time.
One could think that to study photoelectron group delays we need an isolated
attosecond light pulse shorter than the time we want to measure, i.e. the time takesthe electron to leave the ion. With the interferometric methods, the number of atto-second pulses in a train and the duration of each pulse are actually not limitingthe precision as long as the light is spectrally coherent and stable enough betweenshots. Rather it is the experimental control of the interferometer delay between theattosecond and infrared pulses that needs the same precision as the desired time-measurement.

16 CHAPTER 2. LIGHT–MATTER DYNAMICS

Chapter 3
Light-source specific methods
The studies reported in this thesis use either a synchrotron light source or high har-monics of laser pulses, forming an attosecond pulse train. Charged fragments fromphotoionization are detected in both cases (chapter 4) but the properties of the lightlead to quite different experimental principles and analysis methods. Some character-istics of the light sources are listed in Table 3.1. Note that if one harmonic is selectedfrom the spectrum its duration (10–20 fs) corresponds to the number of pulses in thetrain. The individual attosecond pulses (0.1–0.4 fs) are not distinguished in the ex-periment. When confusion between laser pulse and attosecond pulse must be avoidedthe expression laser shot can be used (generalized to shot in the table). Synchro-tron light sources have a tunable monochromator which allows spectroscopic studieswhere the photon energy is scanned. The spectrally wider comb of high harmonics isoften utilized in the time domain, where the pump–probe delay is scanned.
Although the average photon flux is similar for these light sources their timestructure gives very different peak photon fluxes. High-power lasers concentrate theintensity of the light and thus the ionization events in few but intense pulses while a
Table 3.1: Properties of the light sources used. One energy in the comb ofhigh harmonics is compared to the monochromatized synchrotron radiation. Theestimates here apply to harmonics passed through an AlCr filter, which removeslower energies and reduces the flux by almost two orders of magnitude.
One high harmonic Synchrotron beamline[78] MAX-lab [79–81]
Photon energy (eV) 32–42 5–1000Energy resolution (eV) 0.3 0.005–0.1Duration (s) 10−14 10−10
Number of photons per shot 107 104
Peak photon flux (photons/s) 1021 1014
Repetition rate (s−1) 103 108
Avg. photon flux (photons/s) 1010 1012
Polarization linear linear, elliptic
17
18 CHAPTER 3. LIGHT-SOURCE SPECIFIC METHODS
synchrotron spreads the ionization events more evenly in time. For analysing multiplefragments of a molecule or atom in coincidence (section 4.1) at most one ionizationevent should occur at a time. This means that a lower gas pressure and longer acqui-sition time is necessary with lasers. On the other hand, laser set-ups offer an accuratetrigger for time-of-flight studies. The spectrometer design in Paper VI takes advan-tage of this by having two sides, allowing the detection of electrons as well as ions.One of the detectors can use the full rate of ionization events when coincident analysisis not required.
3.1 Synchrotron radiation
Synchrotron light sources use relativistic electrons in a storage ring to generate ra-diation spanning from radio frequencies, via visible light, to hard x-rays. Their highphoton flux [82, 83] has since the 1960s revolutionized applications such as x-ray scat-tering for structure biology [84, 85] and the widely tunable photon energies have en-abled x-ray absorption spectroscopy and site-selective excitations for atomic physicsand photochemistry [7, 8, 11, 33, 58, 86].
In the present work, the Swedish national laboratory for synchrotron radiation,MAX-lab1, has been used. It is located in Lund and has three storage rings, of whichMAX II with a circumference of 90 m is currently the largest [79, 87].
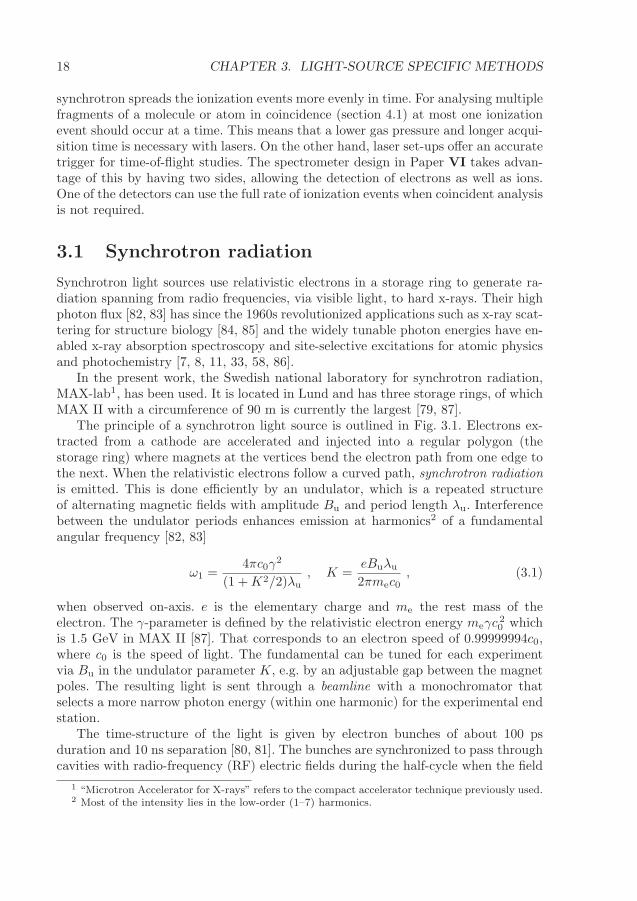
The principle of a synchrotron light source is outlined in Fig. 3.1. Electrons ex-tracted from a cathode are accelerated and injected into a regular polygon (thestorage ring) where magnets at the vertices bend the electron path from one edge tothe next. When the relativistic electrons follow a curved path, synchrotron radiation
is emitted. This is done efficiently by an undulator, which is a repeated structureof alternating magnetic fields with amplitude Bu and period length λu. Interferencebetween the undulator periods enhances emission at harmonics2 of a fundamentalangular frequency [82, 83]
ω1 =4πc0γ
2
(1 +K2/2)λu, K =
eBuλu
2πmec0, (3.1)
when observed on-axis. e is the elementary charge and me the rest mass of theelectron. The γ-parameter is defined by the relativistic electron energy meγc
20 which
is 1.5 GeV in MAX II [87]. That corresponds to an electron speed of 0.99999994c0,where c0 is the speed of light. The fundamental can be tuned for each experimentvia Bu in the undulator parameter K, e.g. by an adjustable gap between the magnetpoles. The resulting light is sent through a beamline with a monochromator thatselects a more narrow photon energy (within one harmonic) for the experimental endstation.
The time-structure of the light is given by electron bunches of about 100 psduration and 10 ns separation [80, 81]. The bunches are synchronized to pass throughcavities with radio-frequency (RF) electric fields during the half-cycle when the field
1 “Microtron Accelerator for X-rays” refers to the compact accelerator technique previously used.2 Most of the intensity lies in the low-order (1–7) harmonics.

3.1. SYNCHROTRON RADIATION 19
Experimentalend station
Beamline
Monochromator& focusing
Undulator
Injector
ReplenishingRF cavity
Linearaccelerator
Cathode
λu
Figure 3.1: Key components of a synchrotron light source. Electron bunches(brown dots) circulate the ring and emit light in an undulator.
is accelerating, as illustrated in the hollow boxes of Fig. 3.1. A series of RF-cavitiesprovides the acceleration before injection and a few RF-cavities in the ring replenishesthe energy radiated by electrons during each turn. Loss of electrons from the intendedtrajectory reduces the ring current over time and eventually requires a re-injection(every 12 hours in MAX II).
Studies within this thesis that involve the core-ionization of molecules were madeat the soft x-ray beamline I411 of MAX II. It provides horizontally polarised 50to 1500 eV photons, monochromatized by a grating at grazing incidence angle [88].For valence ionization, mainly of C60 and hydrocarbons, beamline I3 of the 700 MeVMAX III ring [80]3 has been used. It covers the range from 5 eV (ultraviolet) to 50 eV(XUV) with a monochromator at normal incidence angle. A feature of this beamlineis that the undulator can be configured to give light with horizontal, elliptical, orvertical polarization [79].
3 With a circumference of 36 m, MAX III served as a test of compact techniques for the ongoingMAX IV project [80, 89].
20 CHAPTER 3. LIGHT-SOURCE SPECIFIC METHODS
3.2 Generation of attosecond pulse trains
The highly non-linear interaction of intense laser light with a gas allows coherent lightto be generated in the extreme ultraviolet (XUV) range. The unusually efficient [19]conversion of many low-energy photons to one high-energy photon was understood afew decades ago [20, 21] and opened the field of attosecond science. Without muchdetail about the laser system this section will explain the basic steps in the generationand application of high harmonics. Wider reviews of attosecond physics are given inreferences [23] and [22].
All studies involving attosecond pulses or infrared light were performed in the“1 kHz” attosecond physics lab of the Lund Laser Centre [78, 90], prior to its up-grade in 2012. An infrared (0.80 µm) seed laser, with titanium-doped sapphire asmedium, delivers an ultra-short pulse with good properties except that its poweris not sufficient to generate high harmonics. By stretching this pulse, lowering theinstantaneous power further, amplifiers can act on it and increase its power manytimes. Finally the pulse is temporally compressed while maintaining its energy, whichleads to a very high peak power.1
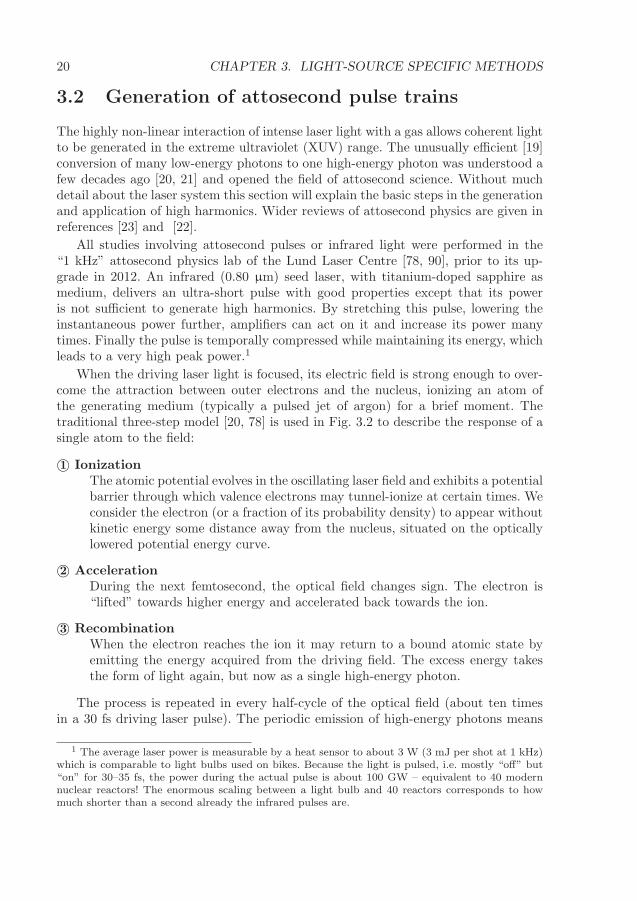
When the driving laser light is focused, its electric field is strong enough to over-come the attraction between outer electrons and the nucleus, ionizing an atom ofthe generating medium (typically a pulsed jet of argon) for a brief moment. Thetraditional three-step model [20, 78] is used in Fig. 3.2 to describe the response of asingle atom to the field:
©1 IonizationThe atomic potential evolves in the oscillating laser field and exhibits a potentialbarrier through which valence electrons may tunnel-ionize at certain times. Weconsider the electron (or a fraction of its probability density) to appear withoutkinetic energy some distance away from the nucleus, situated on the opticallylowered potential energy curve.
©2 AccelerationDuring the next femtosecond, the optical field changes sign. The electron is“lifted” towards higher energy and accelerated back towards the ion.
©3 RecombinationWhen the electron reaches the ion it may return to a bound atomic state byemitting the energy acquired from the driving field. The excess energy takesthe form of light again, but now as a single high-energy photon.
The process is repeated in every half-cycle of the optical field (about ten timesin a 30 fs driving laser pulse). The periodic emission of high-energy photons means
1 The average laser power is measurable by a heat sensor to about 3 W (3 mJ per shot at 1 kHz)which is comparable to light bulbs used on bikes. Because the light is pulsed, i.e. mostly “off” but“on” for 30–35 fs, the power during the actual pulse is about 100 GW – equivalent to 40 modernnuclear reactors! The enormous scaling between a light bulb and 40 reactors corresponds to howmuch shorter than a second already the infrared pulses are.

3.2. GENERATION OF ATTOSECOND PULSE TRAINS 21
XUV photon
Kinetic energy
Atomic
potential
well
Tunneling
Recom-
binationAccele
ratio
n
Driving IR field
1
23
Figure 3.2: Three-step model for high-order harmonic generation. The fieldfrom a driving laser deforms the atomic potential so that an electron may ©1 tun-nel out of the atom, ©2 be accelerated back and ©3 reach high kinetic energy. Re-combining with the atom emits the excess energy as one high-energy photon. In allboxes, solid lines refer to the marked instant while dashed lines give a sense of theevolution.
that the output XUV-field can be described by a Fourier series2 [50],
EXUV(t) =∑
H
EH cos(
Hωt− φ(H))
=∑
H
EH cos(
Hω[t− τ(H)])
, (3.2)
where ω is the angular frequency of the driving infrared. The XUV component atfrequency Hω is called the harmonic of order H. Components at even H do notappear when the positive and negative half-cycles of the infrared are identical, so theharmonic orders are odd integers. The time structure of the XUV field is determinedby the amplitudes EH and phases φ(H) = Hωτ(H). Relations between the phasesof different harmonics are expressed in the time domain as phase delay, group delay
and group delay dispersion (GDD):
Phase delay:φ
ωXUV=
φ
Hω= τ(H) , H odd (3.3)
Group delay:dφ
dωXUV=
1
ω
dφ
dH≈ τA(H) =
φ(H+1)− φ(H−1)
2ω, H even (3.4)
GDD:d2φ
dωXUV2 ≈ 1
ω
dτAdH
=τA(H+1)− τA(H−1)
2ω, H odd (3.5)
(These definitions are completely analogous to those for electron wavefunctions inFig. 2.5.) Their influence on the appearance of an attosecond pulse train is illus-trated in Fig. 3.3. As long as all harmonics share a constant group delay, the pulsesare as short as possible for the given amplitudes. Attosecond pulses are formed at
2 For a pulsed driving field this is an approximation. The Fourier transform would explain the0.2–0.3 eV width of the harmonics.

22 CHAPTER 3. LIGHT-SOURCE SPECIFIC METHODS
Inte
nsity
−1 0−0.5 0.5 1Time (IR half-cycles)
21
23
25
27
E-f
ield
Inte
nsity
21
23
25
27
E-f
ield
Inte
nsity
21
23
25
27
E-f
ield
(a)
(b)
(c)
A(H)
A(H)
H = 22H = 24H = 26
A(H)
Lineartrend
Figure 3.3: Illustration of the generation of attosecond pulses from har-monics 21 to 27. Each panel shows electrical fields for the harmonics (verticallyshifted), the total field as a thicker dark blue curve and in the bottom part the to-tal intensity. The fundamental infrared (not to scale) is overlaid as a thin red curveat an arbitrary offset. The cases (a)–(c) have different group delays, shown on half-cycle “clocks” to the right and by dashed curves between the harmonic waves. Theshortest attosecond pulses in the total field are obtained when the group delay iszero (a) or constant (b), because there are some instants when all harmonics havepeaks. Linear chirp (c) gives a varying group delay (GDD = 0.062 fs2 here) anddeteriorates the pulse duration.

3.2. GENERATION OF ATTOSECOND PULSE TRAINS 23
instants when all the wave crests meet, while they cancel at other times. Becauseof harmonic orders being odd, the discrete differential defines group delays τA(H)at the intermediate even H. The clocks on the right side of Fig. 3.3 shows groupdelays of zero in (a) and τA(H) = 0.25 half-cycles = 0.335 fs for all H in (c). Theconstant group delay shifts the attosecond pulse but does not affect its duration (i.e.the width of the intensity envelope in the bottom part of each panel3). Dispersionin the group delay between harmonics, as on the clock in (c), smears the pulses to alonger duration. Group delay dispersion is also called chirp (of the first order) andhigher orders of chirp can be defined by continuing the progression of eq. (3.3)–(3.5).
The spectrum of the generated XUV light is per eq. (3.2) a spectral comb, exem-plified in Fig. 3.4. The range of harmonic orders, i.e. the envelope of the spectrum,is affected by the single-atom response, the macroscopic response4 and filtering. Theenergy gain from the field in step ©2 in the single-atom response limits the generatedhigh-harmonic photon energy to [20]
~ωXUV ≤ Es + 3.17Up , Up =e2
2ε0c0me
IIRω2
, (3.6)
where Es = EI is the ionization energy [91, 92] of the generating gas. The pondero-motive energy, Up, is given by the intensity, IIR, and frequency of the driving field[78]. The elementary charge, e, electric constant, ε0, speed of light in vacuum, c0,and electron mass, me, are all constant5. For a given laser intensity, the high-energycut-off can be controlled by the choice of generating gas. A low-energy cut-off can beachieved by passing the high harmonics through a thin metallic filter. In the presentwork, the filter always contains aluminium to prevent the driving infrared light fromreaching the experimental target chamber (blocking all energies below 20 eV [75, 93]).For Paper I, a chromium layer is added to transmit only a narrow window around40 eV. Even in this window chromium has a low transmittance, about 1/500 of thatof aluminium [78, Fig. 2.9].
Although not required for interferometry, I would like to point out the conditionsfor producing XUV-pulses with durations measured in attoseconds. With an uppercut-off typically between 30 and 100 eV, the period time of the highest harmonic is 140to 40 as. Pulse durations approaching the period time can be achieved, as illustratedin Fig. 3.3, if the chirp is zero for several high harmonics. Therefore both the intrinsicchirp in the generation and dispersion [50] caused by propagation through the gasmust be controlled to produce an attosecond pulse train. For the rays selected by asmall aperture (“short trajectories”), the single-atom response gives a positive chirpwhich can be compensated by a negatively dispersing medium, typically a metal film,less than a millimetre thick. [75, 93] The thickness of and materials in the metallicfilter, as well as the generating gas density, can be controlled to tailor the chirp.In 2006, 130 as pulses were produced in Lund [90, 93] and in 2012 a 67 as pulse
3 With the present choice of phase delays the shape of the total field (carrier–envelope phase) ishowever changed, from having the central peak positive in (a) to negative in (b).
4 Phase matching between the propagation of driving infrared and resulting XUV is necessaryfor the contributions from different atoms to add constructively [78].
5 This equation applies to vacuum, the intensity in other media should be multiplied by µr/n.

24 CHAPTER 3. LIGHT-SOURCE SPECIFIC METHODS
400
0
100
200
300E
lectr
on c
ou
nt
H13 H15
H17
H19
H21
H23 H25
H27H11 H29
20 25 30 35 40 45Photon energy (eV)
Figure 3.4: High harmonic orders 11 to 29. From a photoelectron spectrum ofargon, the kinetic energy axis has been converted to photon energy. The harmonicswere generated in a different argon jet and filtered through a thin aluminium foil.
was produced in Orlando (a recent review by that group is given in Ref. [94]). Thelatter example was an isolated attosecond pulse, having a continuous spectrum. Thespectrum with discrete harmonics appears for trains of attosecond pulses6.
3.3 Electron interferometry: the RABBIT method
A well-established technique for photoelectron interferometry is known as RABBIT,for Reconstruction of Attosecond Beating By Interference of Two-photon transitions[21, 74, 75]. Its initial application was to prove the existence of attosecond pulsetrains by measuring the chirp (photon group delay derivative) of the high harmonics[21]. More recently it has been used to get information about electron delays insteadof photon delays [31, 32].
The principle of the method is to ionize a sample by high harmonics (an atto-second pulse train) in the presence of a probing infrared field. Figure 3.5 shows theexperimental set-up, where the laser beam is split into an intense fraction drivingthe high-harmonic generation and a weak fraction that becomes the probe after anadjustable delay, τIR.
1
The interferometric scheme was introduced already in section 2.4.2 and we cannow identify the two photoelectron energies as reached in ionization by the harmonicsof order H and H + 2. After absorbing or emitting one infrared photon the twoquantum paths interfere in the sideband of order H + 1 (dash-dotted in Fig. 2.7).The probability, S, to detect an electron in the sideband oscillates when scanning
6 The semiclassical three-step model allows a continuous range of energies to be gained andemitted. The periodicity can be seen as the cause of discrete harmonics in this model [95].
1 We define τIR to increase when the IR-pulse is sent later. Absolute zero is not known with atto-second precision and experiments that only need relative offsets are performed. For weak ionizationprocesses, such as double ionization, statistical noise requires the scan to be made slowly. Drift inthe delay-control can be calibrated away using a reference signal in the single ionization spectrum.

3.3. ELECTRON INTERFEROMETRY: THE RABBIT METHOD 25
Laser
Delay (fs)
Delay (as)
Generatinggas
Filter
IRHHG
Delay stage
Experimentgas
XUV
Figure 3.5: Sketch of the set-up for high-harmonic generation and inter-ferometric experiments. A beam of laser pulses is split into a high-power armwhere XUV high-harmonics are generated (HHG) and an arm with adjustable de-lay for the weak, IR probe. The coarse (fs) delay is controlled by translating a pairof mirrors and finer (as) delay by a single mirror mounted on a piezoelectric ac-tuator – both shown in the photograph to the right. Finally, the IR and XUV arebrought to overlap after a mirror with a central hole and focused on the experi-mental gas sample.
τIR, in accordance with [63, 64, 68]
S(τIR) = S0 + Sosc cos(
2ω(τIR − τexp))
where τexp = τA + τ2phI . (3.7)
The experimentally observable group delay, τexp, is the sum of the optical group de-
lay τA for the attosecond pulses and τ2phI for the electron wave packet after the two-photon transition (XUV-ionization and IR-probing). In a strict sense, the derivativesthat transform phase delay into group delay have been evaluated as discrete differ-entials between the two harmonics, centred at the sideband’s energy. Equation (3.7)assumes that the IR field is weak enough to exclude absorption/emission of twoIR-photons [64].
The relative signal, Srel = S〈S〉 − 1 ≈ Sosc
〈S〉 cos(
2ω(τIR − τexp))
will be used in
diagrams because it gives comparable units (percentage) regardless of underlyingsignal and emphasizes the fact that the absolute detection efficiency needs not becalibrated. The equality is exact if the scan equidistantly samples an integer numberof cycles, so that the average 〈S〉 equals the constant term S0 in (3.7) [96]. This maynot be the case after calibrating the time scale and combining different scans, so theparameters are fitted by a numerical least squares procedure.
An example interferogram, or “RABBIT trace”, can be seen in Fig. 3.6. Singleionization of argon is chosen because its spin–orbit splitting (0.18 eV [97]) is smallenough to be ignored for a simple interpretation of the spectrum: the infrared-inducedappearance of sidebands at even harmonic orders is sketched on the left side. The
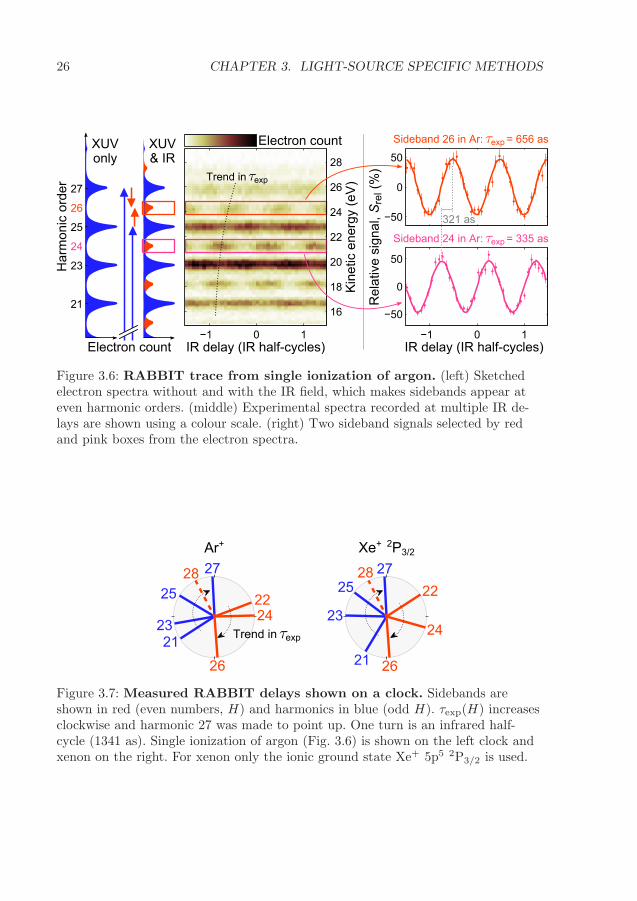
26 CHAPTER 3. LIGHT-SOURCE SPECIFIC METHODS
−1 0 1
16
18
20
22
24
26
28
−50
0
50
Electron count
Re
lative
sig
na
l, S
rel (
%)
Kin
etic e
ne
rgy (
eV
)IR delay (IR half-cycles) IR delay (IR half-cycles)
21
23
25
27
26
Ha
rmo
nic
ord
er
24
Electron count
XUV& IR
XUVonly
−1 0 1
−50
0
50
321 as
Trend in exp
expSideband 26 in Ar: = 656 as
expSideband 24 in Ar: = 335 as
Figure 3.6: RABBIT trace from single ionization of argon. (left) Sketchedelectron spectra without and with the IR field, which makes sidebands appear ateven harmonic orders. (middle) Experimental spectra recorded at multiple IR de-lays are shown using a colour scale. (right) Two sideband signals selected by redand pink boxes from the electron spectra.
2224
26
28
25
2123
27
Ar+ Xe+ 2P3/2
22
24
26
2825
27
21
23
Trend in exp
Figure 3.7: Measured RABBIT delays shown on a clock. Sidebands areshown in red (even numbers, H) and harmonics in blue (odd H). τexp(H) increasesclockwise and harmonic 27 was made to point up. One turn is an infrared half-cycle (1341 as). Single ionization of argon (Fig. 3.6) is shown on the left clock andxenon on the right. For xenon only the ionic ground state Xe+ 5p5 2P3/2 is used.

3.3. ELECTRON INTERFEROMETRY: THE RABBIT METHOD 27
rectangles marked in the two-dimensional central interferogram (colour histogram)show how spectral regions corresponding to specific sideband orders are selected.Their delay-dependent signals Srel(τIR) are shown in separate diagrams on the right-hand side, with clear oscillation of about 50 %. By fitting equation (3.7) to them,
the experimental group delay τexp = τA + τ2phI is determined for each sideband.To determine the chirp of the attosecond pulse train by RABBIT, which was the
original application [21], one can assume τexp ≈ τA, because the variation in τ2phI iscomparably small2 at most energies in Fig. 3.6. If the attosecond pulses had chirp onlyof the lowest order (constant dτA/dH), the dotted curve in the interferogram wouldbe a line. The curvature seen indicates higher-order chirp, possibly caused by thechromium band-pass filter. A good overview of all sidebands and harmonics is givenby Fig. 3.7 that shows τexp(H) as hands on a clock. With a revolution time of halfthe infrared period time the clock naturally conveys the periodicity of interferometricinformation. The trend of increasing τexp (positive chirp) is seen between sidebands.Examining the odd harmonics shows that they oscillate with the opposite phaseto neighbouring sidebands, because the total number of free electrons is conservedwhen the IR-interaction takes place in the continuum. The dashed sideband 28 isan exception, presumably due to the lack of harmonic 29. Figure 3.7 also shows thecorresponding clock for single ionization of xenon. Both measurements were madewith the aluminium+chromium filter but at different dates, meaning that τA maydiffer. For the newer RABBIT applications, when the aim is to compare electrondelays, a method for subtracting the τA term is necessary.
To determine electron group delays, we compare different ionization processesbrought on by the same pair of harmonics, as recently demonstrated for ionizationfrom different atomic subshells [30–32]. Because the common τA-terms cancel, the
group delay difference τ2phI2− τ2phI1
= τexp,2 − τexp,1 is directly measurable. Although
τ2phI comes from a two-photon transition, it has been established for single ioniza-tion that the delay contribution from the probing infrared, τcc, is relatively easy tocalculate. Subtracting it then yields the one-photon delay [63, 64, 68]:
τ1phI = τ2phI − τcc . (3.8)
τ1phI is the Wigner-like group delay experienced by the XUV-photoelectron wavepacket as it departs from the ion, defined in section 2.3.2 with respect to a Coulombpotential and illustrated in Fig. 2.5. The generalization that allows (3.8) to be usedalso for direct double ionization is presented in section 5.1.1 and the supplement ofPaper I.
The “continuum–continuum delay” τcc would classically correspond to the oscil-lating infrared field’s perturbation of the ionic potential. For kinetic energies wellabove the infrared photon energy the calculation of τcc is “universal” in the sensethat very little information about the atom or light is necessary, only the effectivecharge (+1), ω and the kinetic energy. The continuum–continuum delay is negativeand tends towards zero for high energies (−30 as < τcc < 0 for ǫ > 30 eV [64]). For
2 More strictly, atomic calculations [32] and the next paragraph can provide values for τ2phI
.

28 CHAPTER 3. LIGHT-SOURCE SPECIFIC METHODS
direct double ionization, two electrons are active and one may partially screen thedoubly charged ion core from the other. This can be modelled as an effective chargebetween 1 and 2 ([9], Paper I).
Photoelectron group delays have also be obtained by streaking by a strong in-frared field [30], which is similar to RABBIT in many ways except for what kind ofcalculation accounts for the effect of the infrared. In experiments together with theAttosecond Physics group in Lund, the RABBIT method with a weak infrared probewas used, which has the virtue that a perturbative quantum mechanical treatmentis possible.

Chapter 4
Spectrometry of charged
particles
Most of the atomic or molecular processes investigated in this thesis produce a doublycharged ion or two ions. Detecting two or more photo-reaction products in coincidence
is essential for the analysis in these cases, as will be described in the first part of thischapter.
Particles that are charged, i.e. electrons and ions, can be accelerated towards adetector. In all but one study, spectrometers that measure the time of flight betweenan ionization region and a detector were used. Depending on the spectrometer typethis time gives the kinetic energy and/or mass of the particle. Its three-dimensional(3D) momentum vector can be obtained if the detector also records the impact po-
sition. The remainder of this chapter describes spectrometry methods and relevantresolution aspects, for one spectrometer based on a magnetic field and a range ofspectrometer designs based on electric fields.
The differences in time-structure and photon energy between the laser-based highharmonics and a synchrotron light source (Table 3.1) have motivated the developmentof two separate electrostatic spectrometers. Because many synchrotron pulses arrivewithin a typical flight time (≤30 µs), electrons are used as start signal in a dedicatedion spectrometer. The well-separated laser pulses, on the other hand, allow a photon-trigger and a two-sided spectrometer for both electrons and ions.
4.1 Coincident detection of ionization products
Coincident detection of multiple fragments is a powerful technique for understandingphotoionization dynamics. The angular correlation between fragments of a moleculemay inform on the dissociation time scale (section 2.1). Quantities such as the to-tal kinetic energy released in double ionization (informing on the atomic/molecularstates) would be unavailable unless both fragments are detected. While coincidence isvery general and can be used for larger systems, e.g. triple and quadruple ionization[98, 99], it imposes some requirements:
29

30 CHAPTER 4. SPECTROMETRY OF CHARGED PARTICLES
Number of ionization events, n0 1 2 3 4
0
0.2
0.4
0.6
0.8
1p = 2p = 0.5p = 0.1p = 0.01
0 1 2 3 4 0 1 2 3 4 5 60 1 2 3 4
Pro
ba
bili
ty,
P(n
)
Figure 4.1: Poisson probability distributions for the number of ionizationevents, n, per shot. When on average p = 2 events occur per shot (rightmosthistogram), ionizing two atoms is as likely as ionizing one. Then false coincidenceswill dominate – illustrated by too many puzzle pieces. For a low p such as 0.01,ionizing more than one atom is very unlikely and if multiple fragments are detectedthey can be assumed to come from one original atom – a unique solution to thepuzzle. A downside is that most shots of light in this case give no ionization at all(n = 0, hatched).
• The light source and sample density should be such that at most one atom/moleculeis ionized at a time, otherwise unrelated fragments may be detected together asa false coincidence.
• The spectrometer must be able to detect the multiple fragments within oneionization event and store data from different events separately.
These aspects will be developed in the following.The possibility that one shot from the light source ionizes a particular number, n,
of molecules (or atoms) is given by the Poisson distribution [100] P (n) = pne−p/n!,illustrated in Fig. 4.1. The parameter p is the average number of ionization eventsper shot (expectation value 〈n〉) and should be kept well below unity to ensure thatP (n = 1) ≫ P (n > 1). With an average of p = 0.5 ionization events per shot, thedistribution shows a significant probability for ionizing two molecules. As a rule ofthumb, p ≤ 0.1 is necessary to ensure that most coincidences are true, i.e. fragmentscoming from the same original molecule. As can also be seen in the figure, a low p alsomeans that most shots of light give no ionization event at all. With a synchrotronlight source that provides 108 shots per second this is not a problem, but the high-power laser systems for attosecond studies are just becoming able to give more thana thousand shots per second. A coincident attosecond experiment thus needs to berun for a longer time to gather enough data. In many cases it is possible to relax thep-constraint and get coincidence-like information by analysing covariances [101–103].If an experiment has been performed with low p, a covariance analysis does howevernot bring any new information.
4.1. COINCIDENT DETECTION OF IONIZATION PRODUCTS 31
Concerning the ability of spectrometers to separate ionization events from dif-ferent shots of light, all our time of flight spectrometers are intrinsically suited forthis. The very measurement of flight time relies on there being a trigger to signal thestart time of a new event, and the recording of a few scalar numbers (flight time andposition for 3D momentum) can be performed at a high rate. In the 2D momentumimaging spectrometer, a CCD camera records the image of a phosphorescent screenwhich is more difficult or to do at kHz or MHz repetition rates with satisfactory res-olution and noise levels. The 2D imaging study reported in this work was integratingmany shots from the synchrotron into each image.
Among the time of flight spectrometers, which resolve different shots of light,resolving the multiple ionization fragments still imposes some limitations in the coin-cidence (as well as covariance) capability. We currently use time-to-digital converter(TDC) technology to measure the flight times. The TDC triggers on distinct pulses inthe voltage from a pre-amplifier and constant-fraction discriminator1. The RoentDekATR-19 discriminator [104] has a dead-time of 20–25 ns, within which a second parti-cle will not be detected (or cause an average time to be detected). For 3D momentumimaging of ions this is not a major problem, as only ions of the same mass/chargeand axial momentum would arrive at the same time. For electrons, however, timedifferences of this order are expected regardless of momenta and a loss of data wouldoccur. In the study of the electron-pair from double ionization we have thereforeused a magnetic bottle electron spectrometer, where electrons are dispersed over alarger time interval and the loss is minimized to electrons with identical energies. Arecent technical development is analogue-to-digital converters (ADC) operating withthe required precision and repetition rate [105]. Since they record the pulse shape, asuperposition of two electronic pulses becomes detectable.
Example: Electron pair spectrometry
In the study of double ionization we record both of the electrons originating from oneatom to get information about the two-electron wave packet. The magnetic bottleelectron spectrometer will be described in the next section, but the analysis of coinci-dence data can be described already. The detected double ionization probability waspDI = 0.005. Because low photon energies were filtered away, single ionization fromXe 5p or 5s gives notably higher electron energies than any double ionization and afalse coincidence with single ionization (pSI = 0.06) is unlikely within the analyseddouble ionization spectrum.
Figure 4.2 shows two-dimensional representations of the pair of electrons detectedupon double ionization of xenon by high harmonics. The electrons in the pair aredenoted fast and slow, with the kinetic energies ǫfast > ǫslow. The two-dimensionalspectrum in (a) is produced by using one electron energy as coordinate for eachaxis. Here its contribution to the intensity was included both at (ǫfast, ǫslow) and thepermuted (ǫslow, ǫfast), to show a mirror-symmetric map. The appearance of diagonalstripes in (a) shows that the electrons in a pair are correlated. Information about the
1 Which in turn receives signals from the micro-channel plate or delay-line detector in the spec-trometer.

32 CHAPTER 4. SPECTROMETRY OF CHARGED PARTICLES
Either electron in pair (eV)
Eith
er
ele
ctr
on
in
pa
ir (
eV
)
0 5 100
5
10
To
tal kin
etic e
ne
rgy (
eV
)
Slow electron (eV)0 5
10
0
5
(b) (c)(a)
Ele
ctr
on
pa
irs
10
0
20
30
40
Kin
etic e
ne
rgy (
eV
)
Electron pairs0
10
0
5
500 1000
Slow electron
Fast electron
Total energy
Figure 4.2: Representations of electron pair spectra. The electrons in thepair are denoted fast and slow, based on their kinetic energy. (a) Using one elec-tron energy as coordinate for each axis gives this two-dimensional spectrum.(b) Using the sum of both electron energies as the vertical axis, and the slow elec-tron’s energy as horizontal axis, a more compact version is obtained. (c) The axisof total energy of the correlated electrons clearly exhibits more structure than thespectrum of either electron on its own. The curve thickness shows ± one Poissonstandard deviation.
difference between photon energy and final-state energy is encoded along the diagonalof total kinetic energy, ǫfast + ǫslow. Taking this dimension as one axis and ǫslow asthe other axis gives the preferred representation (b). The total energy may also beused on its own (black curve in c) and it clearly exhibits more distinct peaks thanthe individual electron spectra. If one accounts for the fact that our light containsseveral harmonic orders, (a) is very similar to the measurement of Eland et al. withmonochromatic light [14].
False coincidences would appear in Fig. 4.2 (a) as horizontal and vertical stripes,not expressing any correlation2. Since the rate of false coincidences is negligible herewe only see diagonal stripes which express total-energy conservation. These stripesare horizontal in (b) where the total kinetic energy is used as one axis. The 25 nsdetection dead-time causes a white region around the region of identical energies intwo-dimensional spectrum, most clearly seen between the mirrored copies in (a).
2 Representations that treat electrons individually, such as the “all electrons”-spectrum in Fig. 4.5would not be affected by false coincidences.

4.2. MAGNETIC BOTTLE ELECTRON SPECTROMETER 33
4.2 Magnetic bottle electron spectrometer
The magnetic bottle electron spectrometer (MBES) offers coincident detection ofelectrons, which is essential for studying multiple ionization. Experiments with up tofour electrons in coincidence have recently been made at synchrotrons operating insingle-bunch mode [98, 99]. In the present work, an MBES has been used to study anelectron pair from double ionization of xenon by high harmonics. The well separatedlaser pulses are favourable for time-of-flight electron spectrometry.
Compared to the 3D momentum imaging spectrometers, the MBES does not pre-serve angular information. Its one-dimensional energy spectrum is on the other handbetter resolved and the angular acceptance is larger than for most other spectrome-ter types [106, 107]. The long time-of-flight in the MBES minimizes the problem ofdetector dead-time, particularly for slow electrons.
Principle of the MBES
In the magnetic bottle electron spectrometer (MBES) [108, 109] a magnetic field isapplied along the spectrometer axis. The Lorentz force on electrons with a non-axialvelocity will alter their direction but not their kinetic energy. Due to a gradient to-wards a weaker field further from the ionization region, electrons will eventually havean average velocity (in helical trajectories) towards the detector. The field gradientgives the magnetic field lines the so-called “bottle” shape. [108, 110]
After being redirected by the field gradient, electrons move towards the detectorthrough a drift tube of length DMBES. The flight time, t, gives the kinetic energyǫflight:
ǫflight =meD
2MBES
2t2, (4.1)
where me is the electron mass.The MBES of the Lund Laser Centre is shown in Fig. 4.3. An illustration is
overlaid to locate the 80 cm long drift tube and the micro-channel plate detector.The light, incident from the left in the figure, is vertically polarized. A photodiodein the laser system triggers the start of the time of flight measurement. Electronswithin 2π steradians of sold angle (a hemisphere) are collected by this spectrometerwhen using only the magnetic field.
To further increase the collection efficiency, particularly for low energies, an ad-ditional electric field can be applied across the interaction region. In Paper I weapply 2 V, which from the interaction point to the start of the flight tube givesUacc = 1 eV of extra kinetic energy. Approximating the acceleration as instantaneousat the source, the relation between initial kinetic energy ǫ and ǫflight obtained fromthe time of flight is ǫ = ǫflight − Uacc.
The above description idealized the flight time to be fully independent of theemission angle. In reality different trajectories will have slightly different flight timesand the magnetic field parameters are to some extent compromises between opti-mization for low and high electron energies. The resulting shape of spectral peakswill be analysed in the following.
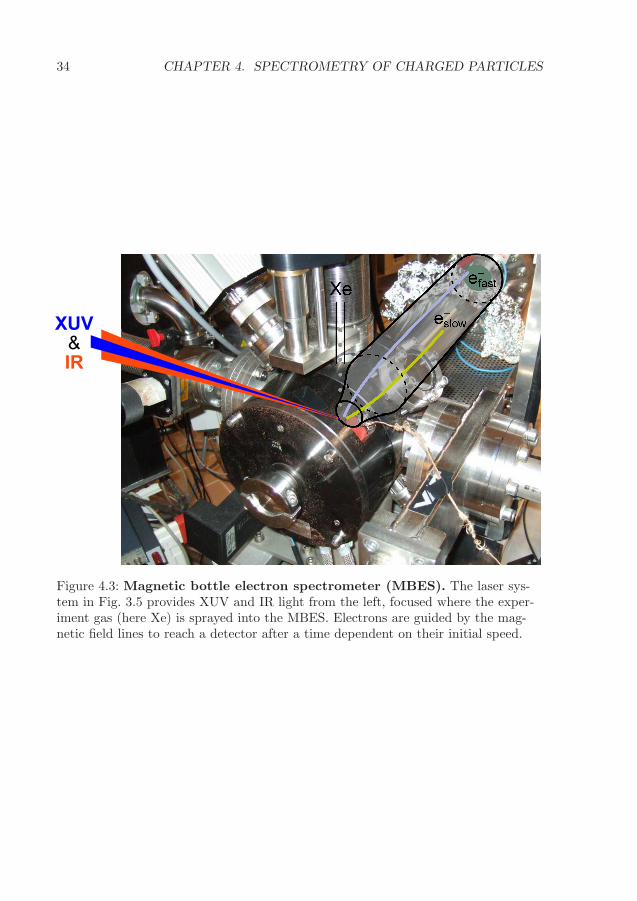
34 CHAPTER 4. SPECTROMETRY OF CHARGED PARTICLES
XUV
&IR
Xe
Figure 4.3: Magnetic bottle electron spectrometer (MBES). The laser sys-tem in Fig. 3.5 provides XUV and IR light from the left, focused where the exper-iment gas (here Xe) is sprayed into the MBES. Electrons are guided by the mag-netic field lines to reach a detector after a time dependent on their initial speed.

4.2. MAGNETIC BOTTLE ELECTRON SPECTROMETER 35
Peak profiles
Although the previous section explained the MBES design to make electrons of eachenergy arrive at a well-defined time, some angular and source position dependenceremains [109, 110]. The short laser pulses also produce a broad spectral width of thehigh harmonics, and short-lived atomic states could contribute further broadening.In total this makes each experimental peak have some width and shape. To find thenominal energy of a spectral peak, and resolve partially overlapping peaks, a modelincluding realistic peak shapes was developed and fitted to the spectra. In the originaldesign report [108] the spectrometer line shape was analysed. For non-zero emissionangles with respect to the central axis, the flight time is increased by a perturbationδts. The time-of-flight distribution for an ensemble of electrons thus obtains a tailtowards longer times. The length of the tail is proportional to the ideal flight time,t0, while its detailed shape depends on the angular distribution.
In the present work, the case of an isotropic angular distribution in Ref. [108]was considered. The distribution of δts was modelled as an exponential decay withprobability density e−δts/(at0) for positive δts and zero probability for negative. Theproportionality constant between t0 and the tail length depends on the MBES settingsand is expressed by an asymmetry parameter, a. The value a = 0.015 was satisfactoryfor the entire 0 to 32 eV energy range in Paper I. The peak-shape model developedin this work convolves the exponential with a Gaussian that represents all otherbroadening mechanisms, mainly the width of the harmonics.
An experimental spectrum is displayed in Fig. 4.4(a) as a histogram with 0.1 eV
ound
Ele
ctr
on
co
un
t (r
ela
tive
in
ten
sity)
Kinetic energy (eV)10 15 20 25 30
(a) (b)
0
Ele
ctr
o
Figure 4.4: Peak profiles in an MBES electron spectrum.(a) Single ionization of Xe by high harmonics. Modelled MBES peak profiles (filledareas) for 5p and 5s ionization have been fitted together with a background term(dash-dotted). (b) The model for harmonic 25 (H25) is isolated and explained inthe time-of-flight representation. It is the convolution between a Gaussian for thephoton width and an exponential tail for the spectrometer response.

36 CHAPTER 4. SPECTROMETRY OF CHARGED PARTICLES
energy bins. The convolution between exponential and Gaussian distributions needsto be performed in the time-of-flight domain and is illustrated by an example forharmonic 25 in the inset (b). The mapping from energy to time, t(ǫ) is definedby inserting ǫflight = ǫ + Uacc in eq. (4.1). For instance, the ideal (in absence ofasymmetry) peak energy ǫ0 corresponds to the time of flight t0 = t(ǫ0). The spectralpeak shape, P (ǫ), is then obtained via
P (ǫ) =∣
∣
dtdǫ
∣
∣P (t(ǫ)) , P (t) ∝∫ ∞
0
e−x/(at0)e−((t−x)−t0)2/(2σ 2
g ) dx , (4.2)
where the Gaussian standard deviation σg =∣
∣
dtdǫ
∣
∣ δǫ is expressed using a width δǫin the energy domain. Normalization coefficients have been omitted. A complicationarises because eq. (4.1) maps equidistant energy bins to non-equidistant time bins.Instead of evaluating the convolution numerically, a direct expression for P (t) interms of the complementary error function is used [111], shown as the filled peakshape in (b).
Optimization of parameters for fitting the single ionization spectrum was per-formed with the Trust-Region-reflective algorithm of Matlab’s lsqnonlin [112]. Thenumerical work included a few iterations of fitting peak shapes to the spectrumand improvement of the MBES-calibration by comparison of ideal peak energies tospectral references. When a satisfactory calibration and fit had been found, cover-ing both the single- and double ionization regimes, all parameters except the peakareas were locked and these areas fitted to spectra for individual XUV–IR delays inthe interferometric scan. In some dense regions of the spectrum (around 20 eV andfor some sidebands) intensity can be redistributed among closely overlapping peakswithout changing the total fit much. Such ambiguity, or extra degree of freedom, canbe reduced by preferring the statistical (2J + 1) ratio between areas for the 5p−1
2P3/2 and 2P3/2 levels. With peak areas denoted by S, a cost term proportional to
|S3/2 − 23 (S3/2 + S1/2)| for each harmonic, was introduced. The proportionality con-
stant was set very low to not influence the fitting in the certain regions but only offera hint in the ambiguous part.
Double ionization electron-pair spectra were fitted as described in section 5.1.1.
Detection efficiency
To estimate the probability for electrons to be detected in the MBES, a comparisonbetween coincident and non-coincident data can be made. Figure 4.5 contains spectrafor all electrons and separate curves for the electrons occurring within a pair. Theelectrons originating from a double ionization event have at most 10 eV kinetic energy.
In general, it is important to be aware of the possibility of aborted higher coin-
cidences when analysing data where multiple degrees of ionization co-exist; in somedouble ionization events only one of the electrons will be detected. One may notethat the “all electrons” and “slow electron in pair” curves share many features andwould be similar if the “all electrons” count was multiplied by 0.4. The analogousrelation between “all” and the “fast” electron is plausible between 4 and 8 eV. Thissuggests that the electron detection efficiency is about 40 % (0.42 = 16 % for a pair).

4.2. MAGNETIC BOTTLE ELECTRON SPECTROMETER 37
Slow electron in pair
Fast electron in pair
A�� ���ctrons
0
0.5
1
1.5
2
2.5
0 5 10 15 20 25 30Kinetic energy (eV)
Ele
ctr
o
n��n������n
ds)
Figure 4.5: Electron spectrum from xenon ionized by high harmonics. Thespectrum with all electrons (magenta) includes the single ionization data (Fig. 4.4)at high kinetic energies and double ionization (Fig. 4.2) at low energies. The sub-set of data where a pair of electrons came in coincidence gives spectra for the slow(cyan, hatched) and fast (orange) electron. The curve thickness shows ± one Pois-son standard deviation.
The overall efficiency depends on both the detector and the angular acceptance. Theangular acceptance is expected to be increased for very low-energy electrons becausean 1 eV electrostatic acceleration was applied. A detection probability of 65 % wasreported for the MBES of Eland et al. [14] with 4π angular acceptance. If the detec-tors behave similarly, this would indicate that our MBES configuration achieved anangular acceptance greater than 2π for low-energy electrons.

38 CHAPTER 4. SPECTROMETRY OF CHARGED PARTICLES

4.3. ELECTROSTATIC SPECTROMETERS 39
4.3 Electrostatic spectrometers
Spectrometers with static electric fields can make the angular information accessibleand allows momentum vectors to be imaged in 2D or 3D. For a given kinetic energy,an electrostatic spectrometer gives geometrical trajectories independent of mass, withmass only influencing the time of flight.
Figure 4.6 illustrates a one-field spectrometer, extracting particles from a sourcepoint towards a detector at a distance of Dext along the z-axis. The time of flight,t, contains information about the mass and, to a variable degree, the initial axialmomentum, pz. A very strong extracting field makes pz have a negligible influenceon the time, which is the aim for mass spectrometry. A moderate field allows pzto be obtained as a perturbation of the flight time for each mass. In general theratio, κ = ǫ/Uext, between the kinetic energy ǫ of interest and the extracting work,Uext = qEextDext where q is the particle charge and Eext the electric field, can beused to quantify the spectrometer mode. κ ≈ 0 is the strong extraction case and0 < κ < 1 allows axial momentum resolution. For κ & 1 only particles emitted insome directions will reach the detector.
Better control over the time of flight is possible in spectrometers that, like Fig. 4.7,contain multiple field regions [113, 114]. The extraction region corresponds to Fig. 4.6)and remains the most important for pz-resolution. The additional regions can be seenas “optical elements” with the purpose of enhancing other resolution aspects. The
Particle trajectories
Detector
or mesh
Strong
Moderate
Figure 4.6: Electrostatic one-field spectrometer. The time of flight, t, yieldsinformation about the particle mass per charge, m/q. Dashed and solid trajectoriesare drawn for particles emitted in different directions. For a moderate extractingfield, Eext, the axial momentum, pz, can be resolved as an offset in the flight time.
Extractionregion
Region 2 Region 3
z0 z
Figure 4.7: Electrostatic spectrometer with multiple field regions. Designswith different field regions, separated by metallic meshes, give increased controlover the dispersion in time of flight.

40 CHAPTER 4. SPECTROMETRY OF CHARGED PARTICLES
simplest optical element is the drift tube, a region without electric field. As describedin the following, it can improve the mass resolution. The use of an inhomogeneousfield as electrostatic lens to improve radial momentum resolution will be describedthereafter.
3D momentum imaging of ions and electrons will be shown to benefit from differ-ent spectrometer geometries and field-strengths. As a result, our two spectrometershave quite different designs. Paper V describes 3D focusing in an ion-spectrometerfor synchrotron use. For laser-based light, Paper VI presents a hybrid design whereboth electron and ion imaging is possible.
4.3.1 Mass spectrometry
The identification of ion masses is essential for understanding photo-reactions leadingto dissociation of molecules [115, 116]. In Fig. 4.6 the acceleration by an electric fieldwas illustrated, with a time of flight proportional to
√
m/q where m is the ion massand q its charge, usually +1 e or +2 e. The quantities limiting the ability to resolvedifferent masses are the size of the source volume (where ionization occurs) and themaximum kinetic energy of the ions. In the early work of Wiley and McLaren [113],low-energy ions starting from different positions were considered. They showed thatthe source size’s influence on the time of flight could be eliminated in spectrometerswith at least two regions.
The photoionization source volume is determined by the intersection between thebeams of light and gas1. Both beams are perpendicular to the central z-axis in ourspectrometers. It is the distribution of ionic source positions along the z-axis thatmatters for the time of flight, since the effective extraction distance Deff
ext = Dext− z0is longer for ions starting further away, at a point z0 < 0. The ions that start atnegative z0 also gain more energy from the extracting field (they start at a higherpotential energy). At the mesh separating the first and second region, these ionsthus arrive later but with a greater speed. If the second region is a drift tube of theright length, Db = 2Dext, they will catch up with the earlier ions precisely at thedetector. This condition for axial space focusing, presented by Wiley and McLarenin 1955 [113], makes the flight time independent of z0 (to the first order). Theirarticle also considers the case of two field regions followed by a drift tube, but theone-field solution seems to be more common for momentum imaging spectrometers[40, 41, 117–120].
If axial focusing is implemented, or the ions have considerable energy (κ =ǫ/Uext & 10−3), the kinetic energy, ǫ, will limit the mass resolution. This happensbecause an ion emitted in the negative z-direction will require a turn-around, po-tentially increasing its flight time enough to overlap with that of a heavier ion. Theturn-around time is determined in the extraction region (compare dashed trajecto-ries in Fig. 4.6) but the temporal separation between masses is influenced also by theother regions. The masses will be more separated in time if less acceleration is appliedin the other regions, so typically an extracting field is followed by a long field-free
1 If the light has a short depth of focus, its intensity variation may further narrow the volume.

4.3. ELECTROSTATIC SPECTROMETERS 41
drift tube. In this case (with axial focusing or a negligible source size), Paper VIshows that the maximum resolvable mass is proportional to (2 +Db/Dext)
√
Uext/ǫ,where Uext is extraction work and Db the length of the drift tube. A stronger extrac-tion and longer drift tube are thus to be beneficial for mass resolution of high-energyions. Our dedicated ion spectrometer has a tube that is Db = 75 cm long, while only15 cm was selected for the hybrid electron and ion spectrometer (motivated in thenext section). In a shorter tube, a decelerating field can be used to extend the flighttimes and resolve ions of high kinetic energy. Paper VI introduces the concept ofeffective drift length to make it clear how acceleration or deceleration in the otherregions influence the time of flight.
In the general two-field spectrometer, axial focusing is not restricted to a fixedlength ratio of Db/Dext = 2. With an accelerating work Ub across the second regionand the voltage ratio b = Ub/Uext as parameter2, axial focusing is achieved whenDb/Dext = 1 + b +
√1 + b (Paper VI). For b = 0 the drift-tube case with a length
ratio of 2 is recovered and a longer tube can be used if it has an accelerating field(b > 0). As previously noted, a decelerating field in the second region (b < 0) improvesseparation of high-energy ions. For optimal mass resolution, b should thus be adaptedto the source size and kinetic energy range. When studying fragments of molecules,energy is usually the limiting term. The hybrid spectrometer also has a short thirdregion, not to control resolution but to provide a high impact energy for detectionefficiency when weak fields are used in the first two regions.
4.3.2 Momentum imaging
The correlation between photo-reaction fragments’ kinetic energies and emission an-gles can be studied if all momentum vectors, ~p, are detected in coincidence [40, 60].For time-of-flight mass spectrometry, the main limitation was the spread due to ki-netic energy. 3D momentum imaging spectrometers analyse this spread to determinethe pz-component of the momentum, and have a position sensitive detector to deter-mine the transverse components, px and py. The hybrid spectrometer is depicted inFig. 4.8. Particularly the electrode array and a particle trajectory illustration in (b)may provide a useful context for the following description. Methods for improvingthe resolution will be explained first for the axial and then for the transverse (radial)momentum component.
The relationship between pz and the flight time is given by the lower equationin Fig. 4.63. The pz-resolution for ions is limited by the axial size of the source but,as was explained for mass spectrometry, axial focusing can reduce this limitation.Figure 4.9(a) illustrates how ions starting at different z0 arrive at different times(and thus different radii) to the first mesh but simultaneously to the detector. Forelectrons, however, the spread of flight times is so short that the time resolution of thedetector (0.1–0.5 ns FWHM [104]) often becomes a more important limitation. To
2 The expression 1 + b here corresponds to k0 in the notation of Wiley and McLaren [113].3 Particles with too negative pz (κ ≥ 1 here) will not be extracted before reaching the repelling
mesh. A p 2z -term in t(pz), which was not shown, makes the function non-bijective near this limit.
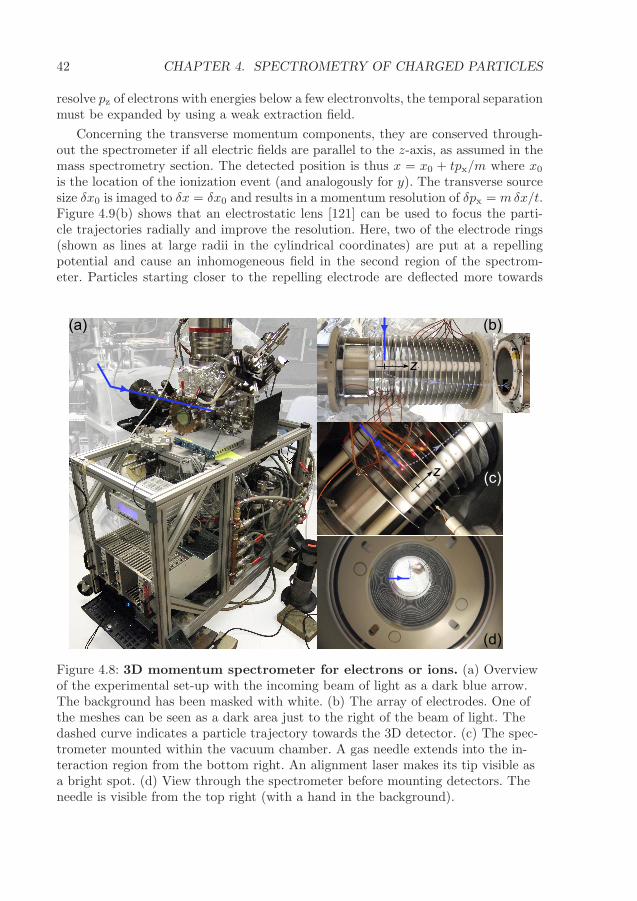
42 CHAPTER 4. SPECTROMETRY OF CHARGED PARTICLES
resolve pz of electrons with energies below a few electronvolts, the temporal separationmust be expanded by using a weak extraction field.
Concerning the transverse momentum components, they are conserved through-out the spectrometer if all electric fields are parallel to the z-axis, as assumed in themass spectrometry section. The detected position is thus x = x0 + tpx/m where x0
is the location of the ionization event (and analogously for y). The transverse sourcesize δx0 is imaged to δx = δx0 and results in a momentum resolution of δpx = mδx/t.Figure 4.9(b) shows that an electrostatic lens [121] can be used to focus the parti-cle trajectories radially and improve the resolution. Here, two of the electrode rings(shown as lines at large radii in the cylindrical coordinates) are put at a repellingpotential and cause an inhomogeneous field in the second region of the spectrom-eter. Particles starting closer to the repelling electrode are deflected more towards
(a) (b)
(c)
(d)
z
z
Figure 4.8: 3D momentum spectrometer for electrons or ions. (a) Overviewof the experimental set-up with the incoming beam of light as a dark blue arrow.The background has been masked with white. (b) The array of electrodes. One ofthe meshes can be seen as a dark area just to the right of the beam of light. Thedashed curve indicates a particle trajectory towards the 3D detector. (c) The spec-trometer mounted within the vacuum chamber. A gas needle extends into the in-teraction region from the bottom right. An alignment laser makes its tip visible asa bright spot. (d) View through the spectrometer before mounting detectors. Theneedle is visible from the top right (with a hand in the background).
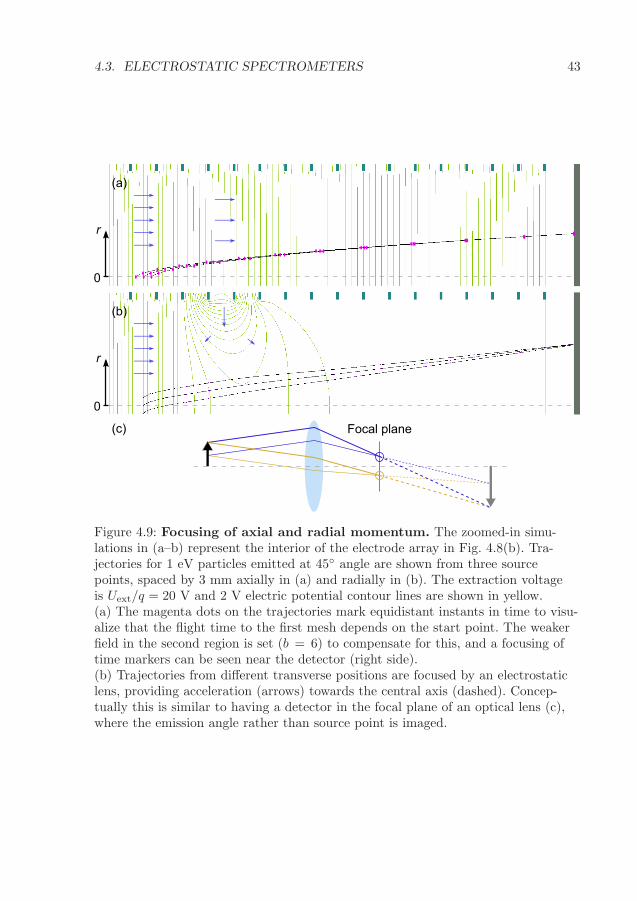
4.3. ELECTROSTATIC SPECTROMETERS 43
(a)
(b)
(c)
0
r
0
r
Focal plane
Figure 4.9: Focusing of axial and radial momentum. The zoomed-in simu-lations in (a–b) represent the interior of the electrode array in Fig. 4.8(b). Tra-jectories for 1 eV particles emitted at 45◦ angle are shown from three sourcepoints, spaced by 3 mm axially in (a) and radially in (b). The extraction voltageis Uext/q = 20 V and 2 V electric potential contour lines are shown in yellow.(a) The magenta dots on the trajectories mark equidistant instants in time to visu-alize that the flight time to the first mesh depends on the start point. The weakerfield in the second region is set (b = 6) to compensate for this, and a focusing oftime markers can be seen near the detector (right side).(b) Trajectories from different transverse positions are focused by an electrostaticlens, providing acceleration (arrows) towards the central axis (dashed). Concep-tually this is similar to having a detector in the focal plane of an optical lens (c),where the emission angle rather than source point is imaged.
44 CHAPTER 4. SPECTROMETRY OF CHARGED PARTICLES
the centre, so that the same final x (or radius r) is reached for a given ~p regard-less of x0.
4 One can quantify the radial focusing quality by a deblurring factor [117]δx/δx0 which should ideally be close to zero for all energies and emission directions.Figure 4.9(c) shows the close analogy between the focusing of particle trajectoriesand the focal plane of an optical lens. The deflection (bending) of trajectories isexcessive for particles that pass the lens at larger radii, resulting in a shorter focallength for outer trajectories than for those at small radii. In the analogy to opti-cal imaging, this means that the lens has spherical aberration and barrel distortion.The aberration prevents perfect focusing with a large aperture and the distortionmeans that the mapping between x and px is nonlinear. Better radial focusing canbe achieved by using a strong extraction field to collimate particle trajectories intoa narrow cone (paraxial rays) before the lens. The narrow cone will however also de-magnify the image, so that the spatial resolution of the detector eventually becomesmore of problem than the lens. A longer flight tube, or even a second lens, can beused to magnify the image again [118].
Total resolution
Combining the axial and radial resolution aspects one finds a conflict for electrons,due to the finite time-resolution of the detector: To resolve pz well the extraction fieldshould be weak but to improve radial focusing it should be stronger. 3D-imaging ofelectron momenta is therefore difficult when the transverse source size is large. Theweak extraction field, needed to expand the pz-information, also expands the flighttime and the radial image. To maintain 4π angular collection for the same maximumenergy despite the expanded radii, the detector needs bee moved closer (or madelarger). Paper VI reports how to achieve a balance between electron (short drift tube,weak extraction) and ion (long drift tube, strong extraction, axial focusing) aspects.More parameters are used for the homogeneous (axial focusing) and inhomogeneous(radial focusing) fields to make the spectrometer adaptable to various applicationsalthough the geometry is fixed.
Thermal spread in the initial velocity becomes resolution limiting for small mo-menta, regardless of spectrometer design. The simplest gas source is an effusive gasjet. It injects gas at room temperature through a needle almost reaching the beamof light as shown in Fig. 4.8(c–d) and Fig. 4.10(b). The gas temperature can be re-duced by using a molecular/atomic beam, where the gas is injected via an expansionnozzle [122] and is collimated through narrow skimmers. Although the beam reducesthermal spread, the average initial velocity ~vinitial gives a time-of-flight (i.e. mass)dependent offset in the xy-image, ~vinitialt. This needs to be accounted for wheneversmall fragment velocities are studied for multiple masses.
4 An influence of pz on r, via the time of flight, is problematic for 2D imaging but can beaccounted for in 3D imaging where pz is measured.

4.3. ELECTROSTATIC SPECTROMETERS 45
z
Figure 4.10: Ion spectrometer for 3D-momentum and mass. (a) Vacuumchamber and electronics attached to beamline I3, with incident XUV indicatedfrom the left. The background has been masked with white. (b) Zoom-in onthe interaction region, with gas needle and light from the left, electron detectorjust below and ion spectrometer extending upwards. (c) When an ion hits themicro-channel plate (MCP) at the top end of the spectrometer, it gives rise to anavalanche of electrons behind the MCP (d) where they induce a pulse on the delayline detector (DLD).

46 CHAPTER 4. SPECTROMETRY OF CHARGED PARTICLES
Detector types
If the time is not measured, but all particles have the same mass (or a time-gateddetector is used) the (x, y)-distribution still gives two momentum components [123,124]. If all ionizing photons are polarized along the same line in the xy-plane thisis sufficient to deduce the 3D distribution via cylindrical symmetry – the so-calledAbel inversion [125, 126]. For single ionization, when coincident detection is typicallynot of interest, there are advantages with using only two momentum dimensions:(i) Particularly for electrons, better 2D resolution [124] can be obtained when the pzand time-dimension is ignored and a strong extraction field used. (ii) A camera canaccumulate the 2D momentum image regardless of the number of ionization eventsper shot, allowing for faster experiments.
For 2D detection, often called velocity map imaging spectrometry (VMIS), weuse a phosphorescent screen and a regular CCD-camera to record the data. For3D momentum imaging we use a delay line detector (DLD) [60, 104] that gives x,y and t coordinates for individual particles5, suitable for investigating correlationsbetween different fragments of one dissociating molecule. They key parts of the 3D-spectrometer for ions are shown in Fig. 4.10. (a–b) give an overview and (c–d) explainthe detector. Ions travel up through the spectrometer and hit a micro-channel plate,MCP in (c), where it gives rise to an avalanche of electrons. Behind the MCP (d)this induces a pulse on the delay line detector, DLD. Dashed curves illustrate howthe pulse travels along the (pair of) wires coiled with a pitch in the x-direction (left–right). The electron cloud hits the DLD on the side facing away in the picture (greycurves) and leads to pulses propagating in each direction, looping via the visibleside (white curves). The time difference between pulses reaching the left and rightendpoints of the wire gives the x-coordinate of the hit. Inside the “x-coil” there is aperpendicular coil for readout of the y-coordinate.
5 There is also a fourth, redundant, dimension in the raw data which can be used as a consistency-check.

Chapter 5
Applications
Using the methods presented earlier, the specific studies of electronic and moleculardynamics will be described here.
5.1 Attosecond electron dynamics
This section presents two very different approaches to access electron dynamics onthe attosecond time scale: a pump–probe study of atomic double ionization and anangle-resolved study of single ionization of a large molecule. In the atomic case, thequantum mechanical two-electron correlation is analysed by electron interferometry.The spectral analysis is presented more extensively here than what could be includedin Paper I. In the molecular case, the correlated motion (plasmon) the valence elec-trons in C60 with respect to the “cage” of nuclei is discussed in terms of classicalphysics for a conducting sphere. In both cases, we obtain information about thederivative of the scattering phase – the group delay of the electron or electron pair –which is closely linked to the forces experienced by the electrons during ionization.
5.1.1 Time-resolved double ionization of xenon
Measurements on the two electrons emitted during double ionization are essential forinvestigating dynamics in multi-electronic systems [127]. Electronic processes occuron the attosecond time scale, which until recently has not been directly accessible inexperiments [128, 129]. Two studies of argon using strong laser fields succeeded inobtaining information about when, within a few-cycle laser pulse, the first and secondelectrons were set free. The Coulomb potential of the ion is negligible in such studiesand the free-electron propagation is determined solely by the laser field – using eitherits direction [130, 131] or magnitude [27] to map emission times onto the observableelectron momentum. The role of the interaction between electrons (bound as well asfree) can be highlighted by using a weak (perturbative) field, where only one or twophotons are absorbed to provide the energy.
Perhaps the most fundamental processes where electron correlation can be stud-ied is the direct double ionization by one photon. Because this cannot occur without
47

48 CHAPTER 5. APPLICATIONS
interaction between the electrons it provides a stringent test for advanced theories,particularly in helium where it is the only double-ionization process and the systemis limited to three bodies. Although the high double-ionization threshold of heliumhas so far discouraged attosecond time-resolved experiments, a fairly good under-standing has been achieved through studies of differential cross sections (i.e. angulardistributions) [16, 132]. Great theoretical challenges remain for all other atoms andmolecules [133] due to the additional electrons.
For the one-photon double ionization study reported here, xenon was chosen assample for its low double ionization threshold, above which attosecond pulse trainscould be readily generated. Two-electron coincidence spectra have been reported forxenon without time resolution [14] as well as on the multi-femtosecond time scale[15], in the latter case including angular information.
Xenon is a heavy noble gas atom with 54 electrons, making it a showcase formulti-electronic effects [14, 134]. The 5p−1 and 5s−1 ionization energies are 12.1 and23.4 eV while the 5p−2 double ionization threshold is 33.1 eV. In the 30–38 eV regionof interest, Xe+∗ Rydberg states [135] (left side of Fig. 5.1) can be described eitherin the LS or the jK coupling scheme [136–139]1. The importance of correlation ismanifested by the fact that no single configuration contributes more than 50 % to theconfiguration mixture [137, 140], regardless of coupling scheme, and the assignment isstill subject to research [141]. Due to strong spin–orbit interaction the fine-structurespans a much larger energy range than in lighter elements: 4.5 eV for the dicationground-state configuration (right side of Fig. 5.1).
Information about time delays in double ionization was obtained in our experi-ment via electron interferometry with a weak infrared probe (RABBIT). When ex-tending the interferometric measurement principle from single ionization to a two-electron wave packet, some fundamental questions need to be considered:
• Can we measure a time for direct one-photon double ionization?
• And how is one time-delay associated with a pair of electrons?
To answer the former, one- and two-photon double ionization processes in xenon willbe described and used to fully assign the two-electron spectrum. The time measure-ment is described thereafter and in Paper I.
One-photon double ionization of xenon
In contrast to helium, where the ground state is accurately known (reviewed in [33,sec. 1.1.2]) and double ionization removes all the electrons, additional electrons re-main in heavier atoms and molecules. This enables indirect double ionization pro-cesses [142], where the system first relaxes to a singly-charged excited intermediatestate. Eland and co-workers’ investigation of the complex one-photon double ioniza-tion of xenon by two-electron coincidence spectra [14] has been instrumental for theanalysis of our spectra.
1 To distinguish the (3PJc)-series implies the use of jK coupling, while to discuss singlet and
triplet cores implies LS coupling. The former is found in high-resolution literature for n ≤ 6 [137, 139]and the latter for higher n [36, 138]. A mixed notation (both 2Sc+1 and Jc
) is used in Fig. 5.1.

5.1. ATTOSECOND ELECTRON DYNAMICS 49
Energ
y a
bove X
e g
round
sta
te [
eV
]
32
34
36
38
30
11
9
8
10
778
7
9
7
7
6
n =
(1D2)nd
(3P0&1)nd
(3P2)nd
5s2 5p4(1S0) nd
3P2
3P1
1D2
1S0
3P0
Xe2+5s2 5p4
Xe+*
Figure 5.1: Rydberg series in Xe+, converging to Xe2+. Only the (black)series with singlet Xe2+ cores are needed to explain one-photon spectra [14, 138].Triplet series, 3PJc
(grey), are guessed by comparing literature and our data.
To explain direct double ionization, the two mechanisms schematically illustratedFig. 5.2 are often considered [9]. Knockout applies a classical mechanics perspectivewhere the first electron starts to leave the ion and collides with another electron to“knock” it out of the ion. Shake-off is a purely quantum mechanical consequenceof the electron orbitals being slightly different in the cation than in the neutralatom. Absorption of a high-energy photon suddenly removes one electron so that therelaxation of the remaining electronic wavefunction can be described as a projectiononto the new basis set of the ion. Since these basis sets are not orthogonal, overlapexists for many final states and there is a finite probability for the projection to“shake” an electron to a different orbital as well as to the continuum. A simplemotivation for neutral and ionic orbitals being different is that the screening of thenucleus is reduced when there are fewer electrons (particularly in inner shells). Atmoderate (XUV) photon energies, the sudden approximation is less accurate, but wewill see that correlation between (sub)shells plays a role in xenon.
The dominant double ionization process is indirect, meaning that the first stepis single photoionization with shake-up to excited states of Xe+∗. States lying abovethe double ionization threshold (see Fig. 5.1) then decay by autoionization to Xe2+.For states near the threshold, electron correlation is important and the relaxationis dominated by conjugate shake-up2 [143, 144]. Only excited states with the outer
2 A shake process involves a dipole transition for one electron and a monopole transition foranother electron. With respect to the normal shake, conjugate shake swaps the final angular mo-menta between photoelectron and excited electron. This can be explained by involving configuration-mixed states [36, 37], see Fig. 5.7. With γ representing the photon, an example of shake-up isγ + 5p6 → 5p4 np ǫd in the normal case and → 5p4 nd ǫp in the conjugate case.

50 CHAPTER 5. APPLICATIONS
2
hake-off
1
2
Knockout
Figure 5.2: Mechanisms for direct double ionization upon absorption ofone photon. Energy from the primary photoelectron (1) is transferred to the sec-ondary (2) via a collision (knockout) or when initial wavefunctions are projectedonto the ionic basis set (shake-off).
electron in d-subshells are necessary to understand the spectra [14, 36, 138, 140].Their energies are well described by one Rydberg series per fine-structure level ofthe Xe2+ 5p4 dication, detailed in Fig. 5.1. Each cation state has a dication core (ofenergy EI) and an nd-electron bound to it, strongly when n = 6 and asymptoticallyfree when n → ∞. With ERy ≈ 13.6 eV as the Rydberg unit of energy, the resultingXe+∗ energy can be approximated by
En ≈ EI −ERyZ
2eff
(n− µ)2(5.1)
where the quantum defect, µ, and the effective charge, Zeff , are introduced to accountfor the extended size of the core [34]. In a hydrogen atom the core is simply a protonand exact energies are given with Zeff = 1, µ = 0. The 54 protons and 52 electrons ofthe Xe2+ core result in an effective charge of 2 at large radii (large n) but the screeningis incomplete at smaller radii and correlation with other electrons may cause furtherdeviations. It is more common to use only either µ or Zeff as parameter, introducinga n-dependence in µ(n) if necessary, but the form with two constant parametershas been used for multi-electron systems [145–147]. Both parameters were fitted3 toreference data so that the entire series (any n) could be included in the model of ourexperimental spectra. In the Xe+∗ (1S0)nd
2D series, no energy for n = 6 seems tohave been reported. The fit to data from Ref. [14] can be extrapolated to 31.0 eVfor n = 6, but instead of breaking the trend between cores (dotted in Fig. 5.1) anunassigned experimental energy from Ref. [138] is used (broken line).
3 Zeff and µ were fitted to energies in the literature [14, 36, 137–140]. For (1S)nd with EI =37.59 eV: Zeff = 2.03, µ = 3.09. (1D)nd, EI = 35.25 eV: Zeff = 2.16, µ = 1.89. (3P)nd, EI =34.29 eV (unresolved Jc = 0 and 1): Zeff = 1.78, µ = 2.74. For the latter series, an alternative µ ≈ 2with Zeff fixed at the more expected value of 2 would for n ≥ 9 still give errors below 0.1 eV.

5.1. ATTOSECOND ELECTRON DYNAMICS 51
Xe2+
e–1
e–2
Xe
Xe+
Xe2+
Xe
e–1
e–2 1
2
t t
(a) (b)
Figure 5.3: Kinetic energies in the spectral model. (a) Indirect double ioniza-tion is simulated in two steps, with the discrete kinetic energies ǫ1 and ǫ2. (b) Fordirect double ionization, discrete structure is only present in the total energy, ǫt.
Spectral model with XUV photons
To analyse our electron-pair spectra, a spectroscopic model was developed. Its prin-ciple is here explained for one-photon (XUV) processes, before including two-photon(XUV & IR) contributions.
For indirect double ionization, the discrete intermediate state suggests a modelwith two steps: a photoelectron of energy ǫ1 and a secondary electron of energy ǫ2.This is illustrated in Fig. 5.3(a). The photoelectron and the secondary electron arein general not distinguishable: experimentally they will be labelled by their energies,ǫfast and ǫslow with ǫslow < ǫfast. For the present analysis, most of the spectrumcan be read by associating “slow” with “secondary” but both energy permutationsare considered in the simulation (compare Fig. 4.2(a)). The total kinetic energy,ǫt = ǫfast+ ǫslow = ǫ1+ ǫ2, is not dependent on electron labelling and will be used asone axis. For direct double ionization, the lack of discrete intermediate states leadsto an arbitrary energy sharing between the electrons, illustrated by a continuouslycoloured double-arrow in Fig. 5.3(b).
The two-electron spectrum is simulated by adding incoherent intensity contribu-tions from direct and indirect double ionization (DI):
I(ǫt, ǫslow) ∝∑
H
IH∑
f
(
Fdir(ǫt, ǫslow) +[
Find(ǫt, ǫfast) + Find(ǫt, ǫslow)]
)
, (5.2)
where IH is the intensity of harmonic H and f enumerates the five final states ofXe2+. The definitions of the terms Fdir for direct and Find for indirect will be givenbelow (implicit dependencies on the iteration variables have been hidden).
The contribution from direct double ionization,
Fdir(ǫt, ǫslow) =∂σdir,f
∂ǫslow× Pt(ǫt) , (5.3)
is the energy-differential cross section, ∂σdir,f/∂ǫslow for the final state f , multipliedby a function Pt(ǫt) expressing the spectral peak profile for the energy H~ω − Ef
(section 4.2). No dependence on ǫslow is included4. This means that each direct con-
4 A U-shaped spectrum (along either electron energy axis) with an intensity minimum at ǫt/2is known from helium [8, 9] but not pronounced near threshold in Xe [14].
52 CHAPTER 5. APPLICATIONS
tribution to the two-electron spectrum (Fig. 5.4(d)) is a homogeneous stripe at aparticular total kinetic energy. Integration along this stripe relates the differentialcross section to the total cross section, σdir,f :
σdir,f =
∫ ǫt/2
0
∂σdir,f
∂ǫslowdǫslow ⇔ ∂σdir,f
∂ǫslow=
2
ǫtσdir,f . (5.4)
Supported by Ref. [14] and our data, σdir,f is approximated as energy-independent.One may note that Wannier’s law, applicable closer to the threshold, would haveσdir,f ∝ ǫ α
t with α ≈ 1 [148].5
The indirect double ionization contribution is constructed by adding the contri-bution from each discrete intermediate state. The state is denoted using the principalquantum number, n, and a variable s to tell which of the Rydberg series {(1S)nd,(1D)nd and (3P)nd} it belongs to. The first step is shake-up to a Xe+∗ state of en-ergy Es,n, with the excitation cross-section σs,n. This state may decay by variouscompeting processes p of rate Γ p
s,n,f to final state f . With only an XUV photon,
the processes are autoionization (AI) and fluorescence6. Although the fluorescencerate is low, it is relevant for high n [149] and states below threshold (sequentiallyionized, see next section). The contribution to the two-electron spectrum is given bythe probability (quantum yield) for autoionization and peak shape functions:
Find(ǫt, ǫ2) =∑
s
100∑
n=6
σs,n ×ΓAIs,n,f
∑
p
∑
f Γps,n,f
× Pt(ǫt)P2(ǫ2) , (5.5)
where ΓAIs,n,f =
ΓAIs,f
(n− µs)3and σs,n ≈ σs
(n− µs)3.
The two-dimensional peak shape has the same total-energy factor, Pt, as for directDI but also the peak shape for the secondary electron, P2, located at the energydifference between intermediate and final states, Es,n−Ef . As shown below equation(5.5), autoionization rates within a series are given by one reduced autoionization rateΓAIs,f [149–151]. Note that its value will be much larger than the actual rates due to the
scaling by (n− µs)−3, where µs is the quantum defect of the series. Also the shake-
up cross section, σs,n, is modelled to follow such a scaling [144, 149]. The valuesof σs,n are shown in Fig. 5.4(a), after adjustments at some n ≤ 10 to fit our data(including two-photon data). Adjustments that redistribute cross section between theseries, e.g. the increase in (1D) and reduction in others at n = 10 could be related toconfiguration interaction.
The model parameters were essentially determined by first fitting the 1D2 stripe,which can only be reached by AI from the (1S)nd series and by direct DI, andthen proceeding with the other final states. Figure 5.4(b) compares the resultingsimulation with the experiment, selected from the electron pair-spectrum (c) for
5 Intensity in the two-dimensional spectrum is proportional to ∂σdir,f/∂ǫslow. To avoid divergencewhen ǫt → 0 in eq. (5.4), a Wannier-like constant intensity (α = 1) is used below 0.5 eV.
6 For fluorescence the only final state considered is the cation ground state at Eg.s. = 12.1 eV,with a classical rate estimate [34] proportional to (Es,n − Eg.s.)2.

5.1. ATTOSECOND ELECTRON DYNAMICS 53
10�2
10�3
10�4
Principal quantum number, n6 2010 14 188 12 16
Popula
tion (
arb
. unit)
(1S)(1D)
(3P)
Xe+* Jc(2S +1L )ndc
0
50
0
50
0
50
100
150
200
0 1 2 3 4
Slow electron energy (eV)E
lectr
on p
airs (
count)
Xe2+ 3P2
Xe2+ 3P0&1
Xe2+ 1D2
H27ba
8
9Xe+*(1D)nd
20 10
2
4
6
8
10
3
12
Tota
l kin
etic e
nerg
y (
eV
)
Slow electron energy (eV)
Experiment
0 1 2 3 4 5
Direct
0 1 2 3 4 5
Indirect
c d e
Xe2+
e–1
e–2
Xe
Xe+
Xe2+
Xe
e–1
e–2
XU
V
4 5
0
40
10
20
30
Ele
ctr
on p
airs
3P2
3P0&1
1D2
Xe2+
H27
H25
H23
Figure 5.4: Calibration of the double ionization model to experimentaldata. (a) Shake-up during single ionization populates Xe+∗ states with an in-tensity proportional to (n − µs)
−3, here adjusted at low n to fit our data. Statesto the left of the hatched lines are below the 33.1 eV double ionization thresh-old. (b) Comparison of one-photon experiment and simulation, within stripes ofthe two-electron spectrum corresponding to different final states for harmonic 27(41.6 eV photon energy). The experimental data (orange curves) comes from thetwo-electron coincidence spectrum in (c) and the simulation (blue curves) is thesum of (d) and (e). (e) is the result of autoionization of the states in (a).

54 CHAPTER 5. APPLICATIONS
Table 5.1: Comparison of intensities in the two-electron spectrum. Therelative intensities (branching ratios) obtained from the model are shown for har-monic 27 (41.6 eV photon energy) to be compared with the experimental analysisfrom Ref. [14] (40.8 eV) and the statistical weight. In the middle part of the table,indirect and direct double ionization (DI) are separated. In the bottom part, thetotal intensity is renormalized to ease the comparison.
Xe2+ final state3P2
3P03P1
1D21S0
Total kinetic energy (eV) 8.5 7.5 7.3 6.4 4.0Statistical weight 5 1 3 5 1Indirect DI 8.5 0.7 2.1 3.3 -Direct DI 2.8 0.6 1.7 6.0 0.12Ref. [14] direct DI 4.6 0.9 1.7 5 0.9Total / 1.76 6.5 0.7 2.2 5.3 0.07Ref. [14] total 6.5 1.1 2.3 5 0.8
harmonic 27 and different final states. The Xe2+ 1S0 final state at 4 eV total kineticenergy for harmonic 27 overlaps 3P0,1 for harmonic 25 and is not labelled in the figure.The full simulation is shown with the direct contribution in (d) and the indirect in (e).
The ratios between reduced cross sections (and thus intensities) for direct DIwere initially taken to follow the 2J +1 statistical weight of the final states [14]. Thefitting led to an increase of 1D2 and reduction of 1S0, resulting in the direct branchingratios in Table 5.1. This table also shows indirect intensities for harmonic 27, withthe exception that there can be no autoionization towards 1S0. All quantities arecompared with the results of Eland et al. for a similar photon energy [14]. The moststriking deviation is that our direct model intensity for 1S0 is lower than expected.Some of this may be due to the fact that its kinetic energy (4 eV) overlaps theharmonic 25 contribution to 3P0,1 but branching ratios for 3P0,1 are on the low sidealso within harmonic 25. Eland et al. observed that only the 1S0 intensity followeda Wannier-like trend with photon energy, in agreement with the low 1S0 intensityfound by threshold photoelectron coincidence spectroscopy [152].
The lifetimes of Xe+∗ states are expected to lie in the femtosecond to picosecondrange (varying with n). The width of peaks along the slow electron axis is thereforedominated by the spectrometer resolution (0.07 eV standard deviation for the Gaus-sian in section 4.2). For the dominant Xe+∗ states the fluorescence rate is negligiblecompared to autoionization. Thus neither natural linewidth nor the fluorescence rateoffers a clear absolute rate reference and as long as the ratios between rates to dif-ferent final states are preserved, an absolute rescaling (by one order of magnitude)does not affect the simulated spectrum much. As a consequence, the magnitude ofthe reduced rates presented in Table 5.2 should mainly be compared within rowsalthough a nominal unit of fs−1 is given. This table underlies the simulation thatleads to the indirect DI information in Table 5.1.
To compare intensities with the experiment in Fig. 5.4(b) and Paper I, a flat noisebackground is added, fitted to the average above 9 eV in Fig. 5.4(c).

5.1. ATTOSECOND ELECTRON DYNAMICS 55
Table 5.2: The reduced autoionization rates, ΓAIs,f , used in the model.
Actual rates are obtained by dividing the reduced rate by (n − µs)3. The rates are
given in a nominal unit of 1015 s−1 for the order of magnitude but should mainlybe compared within rows. Unreachable final states are marked with hyphens.
Rydberg series, s Xe2+ final state, f3P2
3P03P1
1D21S0
(1S)nd 12 2.4 7.2 24 -(1D)nd 40 16 48 - -(3P)nd 36 - - - -
Spectral model with two colours
For the measurement of photoelectron group delays by electron interferometry, an in-frared probe photon is introduced. This leads to nonsequential and sequential doubleionization processes which need to be identified in the two-electron spectrum beforetemporal information can be analysed.
By nonsequential DI we mean that both electrons are still emitted as a con-sequence of the XUV ionization (direct or indirect) and that the infrared only re-distributes their energies, causing interference at “total-energy sidebands”. In thedirect case, sidebands due to absorption/emission of an infrared photon are obtainedby including even orders, H, in equation (5.2). The same is done for indirect DI,meaning that nonsequential indirect DI in the model only considers infrared absorp-tion/emission by the primary photoelectron (leading to the kinetic energy ǫ1)7.
When indirect double ionization occurs sequentially, Xe is ionized by the XUVand then Xe+∗ by the IR. This means that the second electron is ejected after inter-action with an IR-photon and that ǫ2 is increased8 with respect to the autoionizationcase. Sequential IR absorption appears as an additional process that competes withautoionization and fluorescence in equation (5.5).
Figure 5.5 compares the experimental spectrum with XUV and IR in (a) with thesimulation. While the supplement of Paper I displayed the full simulation, Figure 5.5(c–g) shows the various processes separately and without the XUV-only background. Toease the comparison, such a sideband-only spectrum is emulated for the experimentaldata in (b) by taking the difference between XUV&IR and XUV-only spectra andapplying noise reduction.
The nonsequential processes in (c–d) give sidebands shifted ~ω = 1.5 eV up anddown in total energy with respect to Fig. 5.4(d–e). From each harmonic 13 % of theintensity is transferred to the sideband above and 13 % to that below (depletingthe XUV-only terms in the simulation). Furthermore, the reduced excitation crosssections in sidebands were adjusted by +20 % for (1S)nd and −20 % for (1D)nd.
7 Absorption by the secondary electron would be energetically identical to sequential DI. Be-cause the momentum-gauge dipole operator is proportional to the momentum (
√ǫi) [153], absorp-
tion/emission by the low-energy electron, which is usually the secondary, should be less likely.8 Also energy reduction due to stimulated emission from above-threshold states is included if it
gives positive kinetic energy [153], but all above-threshold sequential rates are too weak to be seen.

56 CHAPTER 5. APPLICATIONS
Seq. above, 1000×rate
XUV & IR
0 1 2 3 4 5
0 1 2 3 4 50
2
4
6
8
10
12
To
tal kin
etic e
ne
rgy (
eV
)
a
0 1 2 3 4 5
IR XUV
Slow electron energy (eV)0 1 2 3 4 5
Direct nonseq.
0 1 2 3 4 5
Indirect nonseq.
0 1 2 3 4 5
Seq. below
0 1 2 3 4 5
Ind. nonseq.+seq.
dc
f ge
Slow electron energy (eV)
Xe+
Xe2+
Xe
e–1
e–2
Xe2+
e–1
e–2
e–1
e–2
Xe
Xe
Xe+
Xe2+
e–1
e–2
Xe
Xe+
Xe2+
e–1 e–
2
Xe
Xe+
Xe2+
b
0
2
4
6
8
10
12
To
tal kin
etic e
ne
rgy (
eV
)
Ele
ctr
on p
airs
SB
24
SB
26
SB
28
1D2
3P2
1D2
3P2
1D2
3P2
1D2
3P2
200
0
80
0
80
0
80
0
80
0
+60
300
80
0
80
0
Figure 5.5: Effects of the infrared probe on the electron-pair spectrum.Experimental data with XUV and IR is shown in (a). In (b) its difference from thespectrum without IR (noise-reduced by a σ = 0.1 eV Gaussian). The remainingpanels show simulated IR-processes: (c) direct, (d) indirect nonsequential,(e–f) sequential from above/below the DI threshold, and (g) two IR photons, com-bining non-sequential and sequential absorption. The sequential rate is increasedby a factor 1000 in (e) compared to the actual simulation.
5.1. ATTOSECOND ELECTRON DYNAMICS 57
Sequential processes are shown in Fig. 5.5(e) if the Xe+∗ state is above the doubleionization threshold, otherwise in (f). The experiment in (a–b) does not contain theabove-threshold structure simulated in (e); the difference is most striking at 10 eVtotal energy. We therefore conclude that autoionization dominates over sequentialabsorption, presumably due to the low IR intensity used. To still make the above-threshold sequential process visible for this comparison of spectral structure, it isshown with 103 times the actual model rate in (e). Sequential rates independent ofn are used, but a similar structure and the same conclusion would be found with an(n− µs)
−3 factor.The low sequential rate that we found is still sufficient to compete with fluo-
rescence, so sequential DI via states below the threshold is seen in (f) and the ex-periment. In the two-electron spectrum, peaks due to sequential DI usually appearshifted in the 45◦ direction with respect to the autoionization peaks in Fig. 5.4(e),because both the total and slow electron energies increase by 1.5 eV when the slowelectron gains the IR photon energy (photoionization instead of autoionization in thesecond step).
Harmonic 29, resulting in up to 11.5 eV total kinetic energy, was hardly seen inthe XUV-only experiment, but peaks with another structure in that energy regionappeared when the IR was present9. By allowing sequential ionization of Xe+∗ alsowhen the primary electron has interacted nonsequentially, this structure was repro-duced in Fig. 5.5(g). Two IR photons are absorbed in this case and the sequentialrate is tripled. Since below-threshold states in Xe+∗ only contribute to the spectrumvia sequential ionization, it is not possible to know for certain how much of thischange lies in their XUV-excitation cross section and how much lies in the sequentialrate. The cross section was kept constant in the simulation.
The two-electron simulation can be summarized by two stages: XUV-only andnonsequential XIV±IR ionization first populates cation states and gives direct DI,then all indirect DI is obtained via competing decay rates. The simulation based onlyon energy sharing and three Rydberg series gives a very good understanding of themechanisms behind the experimental spectra. Based on this one finds a few sidebandregions for the 1D2 final state where direct nonsequential DI is stronger than indirectDI, e.g. at 4.6 eV total energy near the diagonal of equal energy sharing10. Identifyingdirect DI regions was a prerequisite for analysing photoemission times theoreticallyas described in the next section and Paper I.
Photoemission time delay for direct double ionization
The identification of nonsequential sidebands for direct double ionization allows theinterferometric technique explained in sections 2.4.2 and 3.3 to be applied. When thedelay of the IR-probe is scanned with respect to the XUV harmonics, intensities in
9 Measurements with IR on and off in parallel (using a shutter wheel) during one scan showthat this is not just due to a change in H29 intensity between measurements. The observed I29/I27intensity ratio of 4 % for double ionization but only 0.01 % for 5p single ionization seems related toH29 (at 45 eV) being in the photoionization Cooper minimum of Xe [62, 154].
10 The assignment of this region is also supported by the lack of back-to-back electron emissionobserved with femtosecond XUV-pulses [15, Fig. 16(b)].

58 CHAPTER 5. APPLICATIONS
the two-electron spectrum (Fig. 5.6(a)) oscillate. By referencing the oscillation phase(τexp in delay) to that for the same sideband order in single ionization, a map of thegroup delay of the two-electron wave packet is obtained, as shown in Fig. 5.6(b).
The assignment in Fig. 5.5 found that sequential processes (f–g) were confinedto at most 1.5 eV for the slow electron. To the right of the vertical dashed linein Fig. 5.6(b) only nonsequential processes occur, for direct as well as indirect DI.Although the greatest average intensity is found in spots of indirect DI the mostsignificant oscillations were found for direct DI.
0 1 2 3 4 5
b
12
32
12
32
12
32
Slow electron energy (eV)
Tota
l kin
etic e
nerg
y (
eV
)
5
12
10
1
2
3
4
11
0 1 2 3 4 5
a
Electron pairs
0 max
335 as335 as
0 as
Figure 5.6: Experimental maps of intensity and delay for the electronpair. (a) The two-electron spectrum with XUV and IR. (b) Two-photon group
delay with respect to single ionization for the same sideband order, τ2phDI − τ2phSI .Xe2+ final states are labelled on the right-hand side and horizontal lines separatethe regions for sideband (SB) 24, 26 and 28. To the right of the vertical line at1.5 eV only nonsequential DI is seen and direct nonsequential DI dominates forthe 1D2 final state. The interferometric measurement principle leads to a cycliccolour scale, indicated as a clock. Non-oscillating areas are masked in white. Thewhite box in (a) indicates the region analysed in the text. The single ionizationtime references, subtracted to cancel the chirp of the attosecond pulses, are relatedby τ2phSI,SB26 − τ2phSI,SB24 = 241 ± 21 as and τ2phSI,SB28 − τ2phSI,SB26 = 582 ± 58 as. Toassign contiguous oscillating areas to the same sideband, a step was introduced inthe border between SB26 and SB28 (near 7 eV). Without this step, an unexpectedcolour change of ±582 as would occur within the area crossing the border.

5.1. ATTOSECOND ELECTRON DYNAMICS 59
An analysis of delays in indirect nonsequential and sequential DI would need toconsider the polarizability of the cation. The evolution of neutral samples “dressed”by laser fields have recently been analysed from different perspectives (e.g. [155,156] and references therein) but it was outside the scope of the present work. Intwo-photon (XUV+XUV) single-ionization of helium, the pulse duration has beenshown to influence the angular distribution (related to delay via the scattering phase)when sequential and non-sequential contributions interfere [157]. Other complicationsconcern the lifetime of the cation. The lifetime before sequential ionization should beinfluenced by the IR intensity and make the result dependent on laser parameters.For indirect nonsequential DI, the considerable autoionization lifetime may lead toemission of the secondary electron after the end of the 30 fs IR pulse. In that case,the interferometric experiment probes the single ionization step rather than doubleionization. For these reasons, and to approach the formalism developed for the three-body problem in helium, the time analysis presented in Paper I was concentrated ondirect DI. In this case the continuum electron pair is created by one XUV-photon,and the measured group delay τ2phDI = τ1phDI + τcc gives access to the one-photon time
τ1phDI if the continuum–continuum delay τcc is calculated.To answer the question of how one time is associated with a pair of electrons I will
here explain a few parts of the theoretical supplement of Paper I. In our calculation ofthe direct DI delay, using multi-body perturbation theory, we currently approximatethe IR photon to interact equally likely with the primary and secondary electron(which are indistinguishable in the spectrum). The kinetic energy domain for the wavepacket is two-dimensional (ǫ1, ǫ2) but the two electrons are not independent – the sumof their kinetic energies is quantized by photon and dication energy. A group delay foreach electron can be defined by differentiation of the scattering phase along each axis(~∂η/∂ǫi), most easily pictured in the coordinate system of Fig. 4.2(a). Just like thediagonal direction of total energy was found to be more relevant than either individualenergy axis (compare Fig. 5.4(d)), we define the “pair time delay” by differentiationof the scattering phase along a direction where both energies change. Because weassumed equal amplitudes of matrix elements for interaction with either electron11
the direction of differentiation is the diagonal of equal energy sharing, equivalent tothe average of the individual electron times: τ1phDI = ~(∂η/∂ǫ1 + ∂η/∂ǫ2)/2.
For the Xe2+ 1D2 final state, near the diagonal of equal energy sharing, the mod-elling in Fig. 5.5(c–d) revealed that direct nonsequential DI dominates over indirect.In Fig. 5.6(a) this region is marked by a dashed white rectangle for sideband 2612
and (b) shows that it oscillates with a group delay of τ2phDI − τ2phSI = 55± 61 as withrespect to 5p−1 single ionization (SI). While this means that the sideband 26 forDI and SI are practically oscillating in phase, the underlying one-photon delay ismuch longer for double ionization. To find its value, one needs τcc calculated for two-electron wavefunctions with partial screening of the ion. My collaborators’ theoreticalwork behind this will not be described here but because the screening is different for
11 Non-equal amplitudes can in principle be handled by using a four-path matrix element, coher-ently including absorption/emission by either electron.
12 The two quantum paths brought to interfere in sideband 26 are harmonic 25 and 27 inFig. 5.4(d), i.e. one-photon wave packets of 3 and 6 eV total kinetic energy.

60 CHAPTER 5. APPLICATIONS
(a)
1 1
2
(b)
XUV
Figure 5.7: Conjugate shake-off. (a) Cartoon illustrating the Auger-like filling ofthe primary hole in the 5s subshell and Coulomb interaction (dashed line) to trans-fer energy to the secondary electron. (b) The corresponding Feynman-like diagram.For a pedagogical introduction to Feynman diagrams, see Ref. [158].
shake-off and knockout [9], two different delays will be presented. By combining τccfrom the supplement of Paper I with the calculated single ionization time reference[154] the measurement can be converted into absolute one-photon group delays of
τ1phDI ≈ 485 as within the shake-off model or 535 as for knockout. Direct calculationsof one-photon group delays from theory gave 510 as (shake-off) or 485 as (knock-out),which are consistent within one experimental standard deviation in both cases butcloser for shake-off. A wider comparison between experimental and theoretical delaymaps (Figure 4 of Paper I) in areas where direct DI is expected to dominate, alsohints towards the shake-off mechanism more than the knockout.
Both mechanisms of direct DI are thought to co-exist, so a weighted averageof the two delay calculations would be expected in the experiment. In helium it iswell known that knockout is limited to low photon energies while normal shake-off(approximating photoionization as sudden) dominates at high photon energies [9].The many electrons of xenon do however allow other mechanisms than in helium.As pointed out for shake-up earlier, conjugate shake remains strong at low energiesand is enabled by electron correlation (for instance in the initial state) [36, 37].Since the dominant nd Rydberg states in xenon were produced by conjugate shake-up, it is by extension to the continuum natural that we perform the calculation forconjugated shake-off with an ǫ2d secondary electron. In Fig. 5.7, the conjugate shake-off process is seen to start with photoionization of a 5s rather than 5p electron (or5s term in the mixed initial state). The hole (i.e. the electrons remaining in the ion)then interacts and rearranges to the final 5p−2 double hole and the secondary ǫ2dcontinuum electron.13 This rearrangement and Feynman diagram is identical to theAuger effect, but here occurs within the n = 5 shell and presumably faster. The timedelay we measure relates to propagation in the final state, not the Auger-like lifetime.
In conclusion, we have demonstrated that the combination of coincidence spec-troscopy and interferometry gives both the electron-pair intensity and a group delayrelated to its scattering phase. Together they give complementary information aboutthe transition matrix elements of one-photon direct double ionization.
13 The calculation for knockout starts with photoionization of 5p and assumes the final continuumstate is ǫ1d ǫ2f. See the supplement of Paper I.
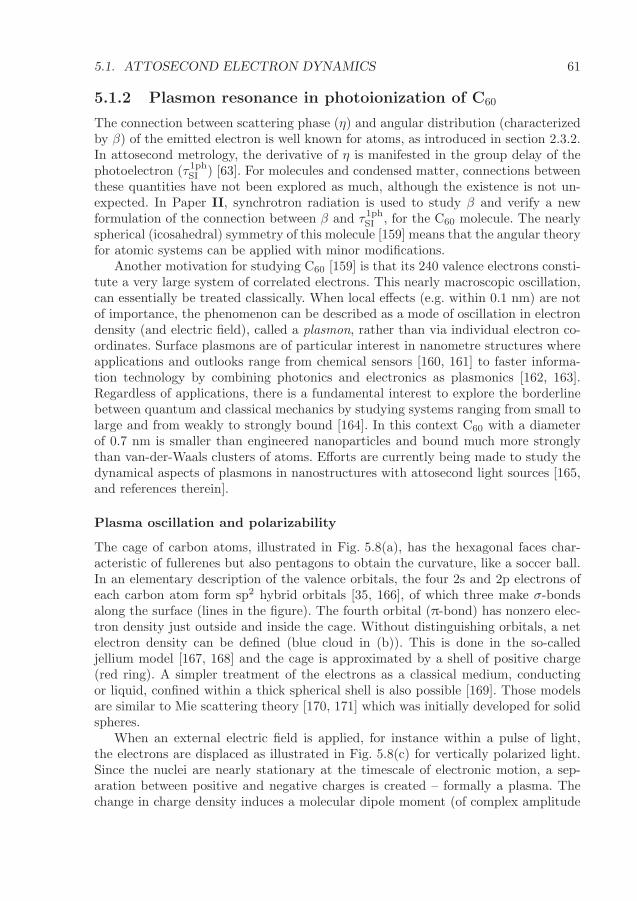
5.1. ATTOSECOND ELECTRON DYNAMICS 61
5.1.2 Plasmon resonance in photoionization of C60
The connection between scattering phase (η) and angular distribution (characterizedby β) of the emitted electron is well known for atoms, as introduced in section 2.3.2.In attosecond metrology, the derivative of η is manifested in the group delay of thephotoelectron (τ1phSI ) [63]. For molecules and condensed matter, connections betweenthese quantities have not been explored as much, although the existence is not un-expected. In Paper II, synchrotron radiation is used to study β and verify a newformulation of the connection between β and τ1phSI , for the C60 molecule. The nearlyspherical (icosahedral) symmetry of this molecule [159] means that the angular theoryfor atomic systems can be applied with minor modifications.
Another motivation for studying C60 [159] is that its 240 valence electrons consti-tute a very large system of correlated electrons. This nearly macroscopic oscillation,can essentially be treated classically. When local effects (e.g. within 0.1 nm) are notof importance, the phenomenon can be described as a mode of oscillation in electrondensity (and electric field), called a plasmon, rather than via individual electron co-ordinates. Surface plasmons are of particular interest in nanometre structures whereapplications and outlooks range from chemical sensors [160, 161] to faster informa-tion technology by combining photonics and electronics as plasmonics [162, 163].Regardless of applications, there is a fundamental interest to explore the borderlinebetween quantum and classical mechanics by studying systems ranging from small tolarge and from weakly to strongly bound [164]. In this context C60 with a diameterof 0.7 nm is smaller than engineered nanoparticles and bound much more stronglythan van-der-Waals clusters of atoms. Efforts are currently being made to study thedynamical aspects of plasmons in nanostructures with attosecond light sources [165,and references therein].
Plasma oscillation and polarizability
The cage of carbon atoms, illustrated in Fig. 5.8(a), has the hexagonal faces char-acteristic of fullerenes but also pentagons to obtain the curvature, like a soccer ball.In an elementary description of the valence orbitals, the four 2s and 2p electrons ofeach carbon atom form sp2 hybrid orbitals [35, 166], of which three make σ-bondsalong the surface (lines in the figure). The fourth orbital (π-bond) has nonzero elec-tron density just outside and inside the cage. Without distinguishing orbitals, a netelectron density can be defined (blue cloud in (b)). This is done in the so-calledjellium model [167, 168] and the cage is approximated by a shell of positive charge(red ring). A simpler treatment of the electrons as a classical medium, conductingor liquid, confined within a thick spherical shell is also possible [169]. Those modelsare similar to Mie scattering theory [170, 171] which was initially developed for solidspheres.
When an external electric field is applied, for instance within a pulse of light,the electrons are displaced as illustrated in Fig. 5.8(c) for vertically polarized light.Since the nuclei are nearly stationary at the timescale of electronic motion, a sep-aration between positive and negative charges is created – formally a plasma. Thechange in charge density induces a molecular dipole moment (of complex amplitude

62 CHAPTER 5. APPLICATIONS
e�
C+
(a) (b) (c)
Figure 5.8: C60 and the surface plasmon. (a) Geometry of C60 with carbonatoms marked on the front half. (b) Electron density (blue cloud) at equilibriumand ion density (red circle) in the spherical jellium model. (c) Electron density re-distributed during the oscillation of the plasmon (or driven by an external field).The induced dipole moment (Re[Pmole
−iωt] at time t) points down at this instant.
Pmol). Typically there are dampening forces within the molecule, and eventually thelight field changes sign, so the electron displacement and charge density will oscillatearound the equilibrium: a plasma oscillation or plasmon for short. The magnitudeand phase of the induced dipole are determined by the complex polarizability, α,defined by Pmol(ω) = α(ω)E(ω) where E(ω) is the complex amplitude of the externalfield at angular frequency ω [35]. The polarizability theory underlies for instance theclassical description of Raman scattering [172] but is still studied in new ways withattosecond pulses [155].
The same kind of relation, between external field and polarization density iswritten P(ω) = χ(ω)ε0E(ω) = (εr(ω) − 1)ε0E(ω) for macroscopic dielectric media,with the susceptibility χ or relative permittivity εr [50, 173]. ε0 is the electric con-stant. In dilute samples, e.g. evaporated into a vacuum chamber, the macroscopicand microscopic parameters are linked by χε0 ≈ αN , where N is the number densityof molecules14. Thus α, χ and εr are three ways to quantify the linear frequency-response of a sample to light. For dispersive media these quantities are frequencydependent and complex-valued. The refractive index of the medium is nr ≈
√Re εr
and the absorption coefficient a ≈ − ωc0nr
Im εr (in the case of weak absorption) wherec0 is the speed of light in vacuum [50, 173]. By absorption spectroscopy, the imaginarypart of εr(ω) (and α(ω)) are possible to determine but the real part is not accessi-ble from the spectrum15. In general, the magnitude of the frequency response tendstowards zero (1 for εr) when ω → ∞; not even electrons respond instantaneously.More interestingly, there can be resonances with particularly large magnitudes atfrequencies specific to the sample. Upon crossing a resonance, the real part of thefrequency response changes sign, i.e. the induced dipole goes from being in phasewith the driving field to being in anti-phase.
14 In a dense medium, E is altered locally by the dipoles of the surrounding molecules so that theClausius–Mossotti relation αN = 3ε0χ/(χ+ 3) = 3ε0
εr−1εr+2
should be used instead [35, 174].15 If the imaginary part is known for all ω, the Kramers–Kronig-relation gives the real part [50].
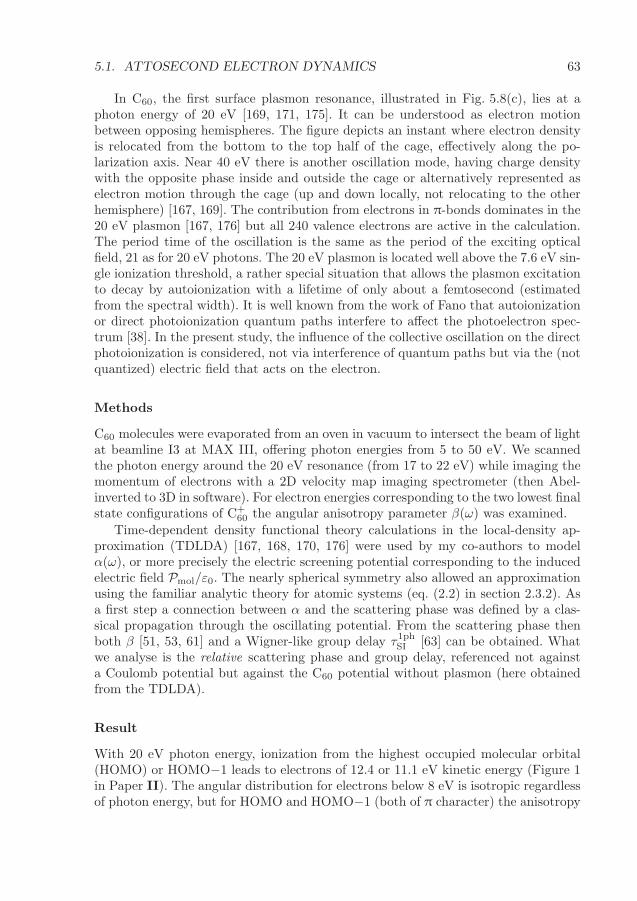
5.1. ATTOSECOND ELECTRON DYNAMICS 63
In C60, the first surface plasmon resonance, illustrated in Fig. 5.8(c), lies at aphoton energy of 20 eV [169, 171, 175]. It can be understood as electron motionbetween opposing hemispheres. The figure depicts an instant where electron densityis relocated from the bottom to the top half of the cage, effectively along the po-larization axis. Near 40 eV there is another oscillation mode, having charge densitywith the opposite phase inside and outside the cage or alternatively represented aselectron motion through the cage (up and down locally, not relocating to the otherhemisphere) [167, 169]. The contribution from electrons in π-bonds dominates in the20 eV plasmon [167, 176] but all 240 valence electrons are active in the calculation.The period time of the oscillation is the same as the period of the exciting opticalfield, 21 as for 20 eV photons. The 20 eV plasmon is located well above the 7.6 eV sin-gle ionization threshold, a rather special situation that allows the plasmon excitationto decay by autoionization with a lifetime of only about a femtosecond (estimatedfrom the spectral width). It is well known from the work of Fano that autoionizationor direct photoionization quantum paths interfere to affect the photoelectron spec-trum [38]. In the present study, the influence of the collective oscillation on the directphotoionization is considered, not via interference of quantum paths but via the (notquantized) electric field that acts on the electron.
Methods
C60 molecules were evaporated from an oven in vacuum to intersect the beam of lightat beamline I3 at MAX III, offering photon energies from 5 to 50 eV. We scannedthe photon energy around the 20 eV resonance (from 17 to 22 eV) while imaging themomentum of electrons with a 2D velocity map imaging spectrometer (then Abel-inverted to 3D in software). For electron energies corresponding to the two lowest finalstate configurations of C+
60 the angular anisotropy parameter β(ω) was examined.
Time-dependent density functional theory calculations in the local-density ap-proximation (TDLDA) [167, 168, 170, 176] were used by my co-authors to modelα(ω), or more precisely the electric screening potential corresponding to the inducedelectric field Pmol/ε0. The nearly spherical symmetry also allowed an approximationusing the familiar analytic theory for atomic systems (eq. (2.2) in section 2.3.2). Asa first step a connection between α and the scattering phase was defined by a clas-sical propagation through the oscillating potential. From the scattering phase thenboth β [51, 53, 61] and a Wigner-like group delay τ1phSI [63] can be obtained. Whatwe analyse is the relative scattering phase and group delay, referenced not againsta Coulomb potential but against the C60 potential without plasmon (here obtainedfrom the TDLDA).
Result
With 20 eV photon energy, ionization from the highest occupied molecular orbital(HOMO) or HOMO−1 leads to electrons of 12.4 or 11.1 eV kinetic energy (Figure 1in Paper II). The angular distribution for electrons below 8 eV is isotropic regardlessof photon energy, but for HOMO and HOMO−1 (both of π character) the anisotropy

64 CHAPTER 5. APPLICATIONS
β(ω) goes through a minimum at the resonance. The minimum of β ≈ 0.7 at 20 eVand the off-resonance anisotropies (1 ≤ β ≤ 1.6) can be reproduced by both theTDLDA and the analytical model. The relative scattering phase in the model isconverted to group delay and we find that the plasmon increases or reduces the groupdelay of the departing electron, depending on whether the frequency of the light isabove or below the resonance. Such a sign-change is expected because of the earliermentioned sign-change of the frequency response when crossing a resonance, thus theelectron is either released at an elevated or reduced potential energy compared to thecase without plasmon contribution to the field. The group delay varies about 100 asfor HOMO−1 and 70 as for HOMO.
The method demonstrated in Paper II should be applicable also to metallic ordielectric nanoparticles and large clusters, if the plasmon is autoionizing so thatphotoelectrons are produced at the resonant photon energy. It provides both thereal and imaginary parts of the polarizability from a (2D) measurement on a finitespectral interval and a model calculation, which may be simpler than obtaining awide-range spectrum for Kramers–Kronig analysis [174] or measuring the refractiveindex of a dilute sample. This method of assessing the plasmon’s contribution toelectron group delay with monochromatic light rather than broadband attosecondlight pulses can be advantageous for samples with dense spectra.

5.2. FEMTOSECOND DYNAMICS IN MOLECULES 65
5.2 Femtosecond dynamics in molecules
Chemical reaction involves the motion of nuclei. In the Born–Oppenheimer picture itis driven towards minimization of the energy of the electronic state. Industrial and bi-ological chemistry often takes place in liquid solvents that prevent direct access to thekinematics of the products, and can involve very complicated molecules. In this the-sis, photochemical reactions are studied for molecules consisting of a few atoms in thegas-phase where momentum vectors of the products can be measured for reactionsthat lead to ionization and dissociation. The rather direct and complete measure-ment, free from environmental disturbances, is a good model system for exploringbasic molecular dynamics. The accessible dynamics concerns connections betweenelectronic states, geometric changes and fragmentation. An improved understandingof these fundamentals can be useful also for the analysis of larger chemical systems.Dissociation channels where the molecule bends to form a new bond between someatoms before dissociation are particularly interesting since new species or radicals canbe formed. We concentrate on fast reactions, where the complex coupling betweennuclei and electrons may occur and affect the reaction path.
As introduced in section 2.4, the evolution of a photoreaction can be investi-gated via snapshots by a probe pulse sent at different instants or via autoionizationof a molecule which has been core-excited. Section 5.2.1 summarises results fromcore-excited molecules in Papers III–IV and section 5.2.2 presents a pump–probeexperiment.
When probing by (sequential) photoionization, the delay of the probe pulse isa parameter and thus any observable is directly related to temporal evolution ofthe molecule. The parameter is sometimes seen as a control knob for influencing thereaction path [177, 178], i.e. an interest in selecting final state (selective bond breaking[179] or charge localization [180]) rather than understanding the intermediate state.Femtosecond precision in the delay between pump and probe pulses has long beenavailable with lasers [23, 69, 70], but the low photon energy available puts constraintson what samples can be excited or ionized in a spectrally selective way, typically bymulti-photon absorption or using filtered high harmonics. Ionization by a strong laserfield or attosecond pulses are used in different applications to access the shortest timescales, hitherto concentrated to atoms or diatomic molecules to minimize the densityof states. The tunable and higher photon energy of free-electron lasers offers anattractive combination of spectral selectivity and femtosecond time resolution [29].
The method of probing by autoionization (typically resonant Auger) relies moreheavily on a complete characterization of the photofragment momenta to understandthe dynamics. Kinetic energies of electrons [17, 18] or ions [60, 115] can sometimes berelated to at what stage during a dissociation reaction an Auger decay occurred, andthus set the reaction on a qualitative time scale. Measuring both types of fragmentsis of course ideal [40–42] but a quite good understanding of the kinematics can bereached by analysing the 3D momentum vectors of two or three ions from a smallmolecule, detected in coincidence. While the time range probed is set by the Augerlifetime, the soft x-ray photon energy of a synchrotron can be tuned to different core-excited states (e.g. an 1s electron from C or O promoted to the lowest unoccupied

66 CHAPTER 5. APPLICATIONS
molecular orbital). This element and site selectivity can allow measurements withdifferent Auger lifetimes (control of the “probe” delay) and control of the branch-ing ratio between fragmentation paths with different localization of the charge [58].The core-excited states can explore non-Franck–Condon geometries by decaying tocation or dication states that are not reachable by vertical photoexcitation or directionization.
For dissociation that occurs much faster than rotation, the axial recoil approxima-tion allows the anisotropy parameter β of fragments to be analysed as introduced insection 2.3.1. The absorption cross section favours transition dipole moments alongthe polarization vector and introduces an alignment of excited molecules. Anisotropy(β 6= 0) in the distribution of fragments reveals that dissociation occurred fasterthan rotation of the molecule. The value of β may further tell whether fragmentswere mostly emitted along or perpendicularly to the transition dipole moment, withthe respective rotation-free limits of β = 2 and −1. Neglecting rotation, β may alsobe converted to bond angle for a bent molecule, at least in the C2v symmetry groupof water.
5.2.1 Core-excited tri-atomic molecules
Molecules with three atoms are the simplest systems where bending and more thanone mode of vibration can occur. Everyday molecules such as water (104◦ bondangle, point symmetry group C2v) and carbon dioxide (linear, D∞h) offer sufficientcomplexity to repeatedly be re-investigated in various ways. In the work presentedhere, the resonant absorption of a soft x-ray photon prepares a neutral molecule witha 1s hole and one electron in a normally unoccupied molecular orbital. In a diagramof potential energy curves, such as Fig. 5.9, the electronic transition is vertical (fasterthan nuclear motion) and typically leads to a core-excited molecule that is not atits equilibrium geometry. This sets the nuclei in motion, here expanding the A–BCbond in a generic ABC molecule. Depending on when an Auger decay occurs, differentfinal states or reaction paths may be reachable. The left part of the figure illustratesthat core-excited states within the Franck–Condon region have distinct peaks in theabsorption spectrum, allowing tuning of the photon energy to selectively populate aparticular state (only one is shown, ABC∗). Core-excited states are well above thedissociation and ionization energies of all constituent atoms, so fragmentation intothree atomic ions is possible but the most common reaction is often double ionizationwith either a diatomic fragment or a third neutral fragment.
The kinetic energy of the fragments can be related to the speed of the dissociation.The photo-excitation in Fig. 5.9 is followed by double autoionization. The kinetic en-ergies of the two emitted electrons are represented by the downwards arrows labellede−1 and e−2 . We study the dissociation of molecules into at least two charged fragmentsby measuring the 3D momenta of the ions, i.e. the emission angle and kinetic energy.For short-lived excited states, the kinetic energy release is given by at what pointthe dissociative final state (ABC2+, red curve) is reached. Ionization at a short dis-tance typically gives a strong repulsion, high kinetic energy and a rapid dissociationwithout much time for bending or other deformations. Later decay of the electronic

5.2. FEMTOSECOND DYNAMICS IN MOLECULES 67
Inte
rna
l e
ne
rgy
ABC*
A+ & BC+
ABC
Reaction coordinate (A–BC bond length)
X-ray
& BCA
& BCA*
Kin
etic e
ne
rgy
ABC+*
ABC2+e–
2
e–1
Ph
oto
n e
ne
rgy
Absorption
Ion count
Figure 5.9: Nuclear motion leading to dissociation in the dication. Thisextends Fig. 2.6(b) to a photoreaction with double autoionization from a neutralcore-excited state (ABC∗). It is here assumed that Auger decay leads to an excited,short-lived or bound, cation (ABC+∗) so that the main part of the kinetic energy isreleased in the final state (ABC2+) during dissociation.
state, at a larger bond length, leads to slower ions where the shape of the potentialenergy surface can play a role in steering the reaction through vibrating and bendingmodes. If a substantial amount of kinetic energy is released along more than one ofthe potential-energy curves, a precise assignment may require access to the electronenergies but the basic correlation between energy and speed of dissociation remains.Thus, within each dissociation channel (events producing the same set of fragments),the events that yield a high total kinetic energy of the fragments give more accurateinformation about bond angles in the (neutral) intermediate state while low-energyevents can bend and reach and more exotic fragmentation paths. The internal energyof the fragments (electronic or vibrational) has been neglected here. A large part ofPaper IV concerns the observed reduction or increase in angle between fragments atlow kinetic energies in different channels.
The data set of coincident ion momenta can be analysed in many ways beyond de-termining the total kinetic energy release. For the assignment of dissociation processeswe have analysed the energy correlation between three fragments using Dalitz plots. ADalitz plot shows barycentric coordinates of squared momentum, πi = |~pi|2/
∑
j |~pj |2where ~pi is the momentum vector of fragment i [181–183] The normalization to∑
i πi = 1 removes one degree of freedom, so for three fragments the barycentric co-ordinates span the two-dimensional interior of a triangle. Physically, momentum con-servation further constrains the coordinates to an inscribed circle with 0 ≤ πi ≤ 2/3as shown in Fig. 5.10(a). If dissociation occurs simultaneously (concerted) along bothbonds, there is no further constraint and (b) shows intensity over most of the cir-cle for a core-excited water molecule (O 1s−1 4a1). The neutral fragment (hydrogen)is not detectable but if all other fragments are detected it is given by momentum

68 CHAPTER 5. APPLICATIONS
H+
0
O+
H
O+ O+H+
C+ C+O+
O+ OH
25
5
15
Eve
nts
(co
un
t)(c) (d)(b)(a)
Figure 5.10: Dalitz plots and the signatures of different dissociation pro-cesses. (a) The barycentric squared momentum coordinate πi for fragment i pointstowards its corner of the triangle and is zero on the opposite side, here shown forH+. (b) Concerted dissociation of H2O along both bonds gives a broad, nearlycentred distribution for a bent molecule but (c) no momentum for the middle C+
fragment from a linear CO2 (OCO) molecule. (d) Sequential dissociation gives anarrow distribution perpendicular to the coordinate of the first fragment, here O+.When the bond within CO+ breaks at a later stage, momentum conservation in itsrest frame imposes a strong anti-correlation between the absolute momenta of theC+ and O.
conservation. A symmetric, concerted dissociation of a linear molecule is shown in(c) for triple-ionization of CO2. The intensity is concentrated in the point wherethe central carbon remains at rest (πC+ = 0) while the oxygen ions depart withequal speed in opposite directions. When CO2 bends in the core-excited state, asshown in Paper III, intensity spreads to the rest of the Dalitz plot – approachingthe case in (b). A third variant that has a distinct signature in the Dalitz plot issequential dissociation where one bond is broken before the other. Figure 5.10(d),for non-resonant ionization of CO2 at 60 eV photon energy, can be interpreted as(OCO)2+ → O++(CO)+ → O++C++O. Conservation of momentum between theC+ and O fragments of the second dissociation, occurring within the rest frame of(CO)+, gives a strong anti-correlation between πC+ and πO while correlation withthe initial πO+ is almost lost. The result is a nearly one-dimensional stripe in theDalitz plot at a constant πO+ .
Renner-Teller effect in CO2
Paper III explores the dynamics following resonant photoexcitation of an 1s electronin carbon dioxide to the lowest unoccupied molecular orbital (LUMO) 2πu. Sketchesof the CO2 orbitals as linear combinations of atomic orbitals are shown in Fig. 5.11.With the core hole in carbon the C 1s−12πu resonance occurs at a photon energy of291 eV and with an oxygen hole O 1s−12πu is located at 535 eV – as seen in the ionyield spectra in Fig. 5.12. To clarify that these are states in the neutral molecule,O 1s−1-excited Rydberg series converging to the C 1s−1 or O 1s−1 ionization energiesare also labelled [184, 185]. The ground state of dissociated O++CO+ lies at 33 eVand can be reached via vertical ionization to CO2+
2 around 38 eV [43]. From the core-

5.2. FEMTOSECOND DYNAMICS IN MOLECULES 69
OO C
1πg
2σu
3σg
1πu
2σg
1σg
1σu
4σg
3σu
4σu
2πu5σg
+ − +−
Unoccupied
−
ed)ce
Figure 5.11: Molecular orbitals in carbon dioxide. While the 1s-subshell is lo-calized in each atom, atomic valence orbitals mix constructively (solid contours) ordestructively (dashed nodes) and form bonding or antibonding molecular orbitals[186]. Energies and the sketched electric potential are not to scale.
excited states, autoionization (including at least one Auger decay) can give double aswell as triple ionization. Energetically, dissociation along any or both bonds is possi-ble and the purpose of the experiment is to find which dissociation channels actuallyoccur, which together with theory about the potential energy surfaces and autoion-ization lifetimes can elucidate the dynamics. The principle of using autoionizationrather than a probe pulse to analyse a photoreaction was introduced in section 2.4and in our case both kinetic energy and angular correlation between the fragmentsis observable.
The Renner–Teller effect arises when a state is degenerate with respect to bend-ing. Renner was perhaps the first to analyse the splitting of an energy level due tobending, i.e. a coupling between nuclear and electronic motion [188, 189]. Jahn &Teller discussed this kind of splitting more generally and proved that molecules witha degenerate ground state will deform and break the nominal symmetry [190]. The
290 292 294 296 530 532 534 536 538 540 542 544 546
Sig
na
l (a
rb.
u.)
Photon energy (eV)
� 2πu� 2πu
��4s��4p��3s
��3p��4p
��
Figure 5.12: Near-edge x-ray absorption fine structure in CO2. The shortAuger lifetimes (6 and 3.5 fs) and consequently unresolved vibrational structuregives wide peaks for the carbon (left) and oxygen (right) 1s−1
πu compared to Ryd-berg states.

70 CHAPTER 5. APPLICATIONS
B1
A1
B1
A1
Bond an130
En
erg
y (
eV
)
0
1
1
z
yx
Figure 5.13: The Renner–Teller effect. The transition dipole moment from 1s tothe 2πu orbital favours polarization, ~E , along the axis denoted z here. Bending ofthe molecule in the xy or yz plane increases (B1) or reduces (A1) the energy of theelectronic state (curves from Ref. [187]).
only exception is linear molecules, where degenerate states can be stable. CO2 is lin-ear in both its neutral and cationic ground state. In the neutral core-excited 1s−12πu
state, the linear geometry with a total symmetry of 1Πu is however unstable1. Tounderstand this, recall that mirroring a Πu state in one plane containing the molecu-lar axis changes the sign of the wavefunction while mirroring it in the perpendicularplane (also containing the axis) does not [35]. Due to the rotation symmetry of thelinear molecule there is no way to distinguish the two planes and the Πu state be-comes degenerate. The transition dipole moment for the core-excitation leads to apreferred alignment with the molecular axis perpendicular to the polarization of thelight (Σ → Π transition in Fig. 2.3(b)). With respect to the 2πu orbital, shown againin Fig. 5.13, this corresponds to vertical polarization. Denoting the polarization axisas z and the molecular axis as y, two distinct planes of bending can now be definedwhile maintaining the πu-orbitals along z. Bending of the molecule in the xy-planegives a state of the B1 symmetry label while bending in the yz-plane corresponds toA1. For B1, the linear geometry with a 180◦ bond angle gives the equilibrium whilefor A1 a 2 eV lower energy is reached at about 130◦ [187]. Thus the degenerate Πu issplit into states of higher and lower energy when bent, shown by the Walsh diagramat the right-hand side of Fig. 5.13. Visually this can be interpreted in the middlepart of the figure as non-zero electron density appearing in the C–O bonds in theA1 geometry while the antibonding character remains for B1. Looking at the patternof same-sign (e.g. dark) parts for other orbitals in Fig. 5.11 it is clear that no otherorbital than 2πu has the necessary symmetry.
In the Born–Oppenheimer approximation, electronic excitation occurs withoutchange in nuclear coordinates – “vertically” between the potential energy curves.From the curves in Fig. 5.13, the 180◦ bond angle of the ground state is incom-patible with excitation to the A1 equilibrium, and Franck–Condon overlap requiresa simultaneous bending vibrational excitation in A1 (vibrational quantum numberv ≈ 11 [191]). By detuning to the low-energy side of the resonance, population of B1 isprevented and in a classical picture one would think bending occurs simultaneously
1 Since a 1s-hole does not affect bonding much, core-excited CO∗
2 is often compared to the groundstate of NO2, which is bent.

5.2. FEMTOSECOND DYNAMICS IN MOLECULES 71
with the electronic transition, invalidating the Born–Oppenheimer approximation.Because of this, the Renner–Teller effect in CO2 is a well-studied model system forvibrational–electronic coupling [59, 185, 192]. Our study in Paper III is not thefirst with coincident detection of the fragment momenta, but the use of Dalitz plotsstrengthens the identification of dissociation processes. We compare plots for differ-ent kinetic energy ranges and for channels where two or three ions were detected.The latter also allows a calibration for the effect of aborted coincidences, where tripleionization occurs but the limited detection efficiency for coincident fragments of thesame mass leaves one O+ ion undetected yields a false contribution to the double-ionization analysis.
We find fragment angles extending down to 20◦ and a clear signal for the extremebending result where an O+
2 fragment is produced in coincidence with C+. Judgingby the angular anisotropy (β-parameter) the folding of the terminal oxygen atomsinto an oxygen molecule is much faster than rotation. The anisotropy is comparableto previous observations of proton migration in acetylene (ethyne, HCCH) formingC+
2 +H+2 [193]. With oxygen being much heavier than protons, a time scale similar to
OCS where only a small anisotropy was found for C+2 +OS+ [194] would seem likely.
Since the C++O+2 pair is absent in direct ionization we conclude that the bending
initiated by the Renner–Teller effect is the cause of the rapid oxygen migration. Theimportance of motion in the core-excited state is further supported by the fact thatthe branching ratio of C++O+
2 in relation to other channels is doubled for C 1s−12πu
which has twice the Auger lifetime of the O 1s−12πu (6 and 3.5 fs, respectively).
Correlation between potential energy and bond angle for H2O
For an Auger transition in water, excitation of the oxygen 1s electron is the onlyoption. As Fig. 5.14 shows, the electron can be promoted to molecular orbitals ofdifferent symmetry (e.g. 4a1 and 2b2 [35]) and any difference in the resulting dynamicsexamined [18]. The 1s−12b2 lies 2 eV higher in the Franck–Condon region and is notimmediately dissociative, having a potential energy well with a depth of at least 5 eV[195].
The neutral water molecule is bent in its ground state and the bond-rearrangementchannel O++H+
2 has been observed in the inner-valence region. In Paper IV we anal-yse the correlation between kinetic energy and bond angle in the three-body breakupH+O++H+ and find that smaller bond angles occur for lower energies. An assignmentusing literature energies for states in the dication H2O
2+ and the relevant fragmentfinal states suggests that three-body breakup and the complete bond rearrangementare competing (perhaps following the same initial reaction path) and that low inter-nal energy of H2O
2+ leads to bond rearrangement while dissociation occurs withoutcomplete bending for higher energies. Analogously to Fig. 5.9, the internal energy ofH2O
2+ corresponds to the kinetic energy released during dissociation.
The very lowest states of H2O2+ dissociate by breaking only one bond, leading
to H++OH+. The angle between these fragments closely matches the neutral 104◦
except on the low-kinetic energy side of the distribution when the initial excitationwas to 2b2, where the angle is increased. One may speculate that a wave packet in

72 CHAPTER 5. APPLICATIONS
0
1
2
3
Sig
na
l (a
rb. u.)
Photon energy (eV)538537536535534
��4a1
(a)
2b2 2b1
533
4a1 2b2
(b)
Figure 5.14: Core-excited water. (a) Near-edge x-ray absorption fine structure inH2O, calibrated to Ref. [18] in energy. (b) Sketches of the antibonding 4a1 and 2b2molecular orbitals.
this non-dissociative excited state explores a wider range of angles before the Augerdecay lets it dissociate. This may give access to linear (180◦) states in H2O
2+ thatlie below the bent ones but can not be reached by a vertical transition from theneutral. An assignment using linear states matches the observed low-energy cut-offof the kinetic energy release.

5.2. FEMTOSECOND DYNAMICS IN MOLECULES 73
5.2.2 Pump–probe study of the dissociation of acetylene
The motion of nuclei in chemical reactions often occurs over time intervals of fem-toseconds or picoseconds. Short-range nuclear motion around local energetic minimacan be rationalized using vibrational and bending modes but isomerization to otherequilibria also occurs, in organic molecules often as proton migration. Such isomer-ization processes are often associated with functionality in biological processes.
Ultra-fast proton migration has attracted much attention, currently progressingby studies of small cationic hydrocarbons in pump–probe schemes using low or highharmonics of laser pulses (XUV pump, IR probe) [45, 196] or using free-electron lasers(XUV pump, XUV probe) [46, 197]. Non-radiative energy conversion mechanismssuch as intramolecular vibrational relaxation (IVR) have been investigated on thefemtosecond time scale in neutral organic molecules [70] and recent free-electron laserstudies of acetylene provide experimental evidence for the IVR process as an efficientenergy-redistribution mechanism. Being among the smallest hydrocarbons, acetylene(ethyne, C2H2) is a widely studied model system for proton migration. From bentconfigurations the vinylidene isomer, with both protons bonded to a single carbon,is accessible, and it is the dominant channel for decay from the first excited state inthe acetylene cation.
In the ground state of both the neutral and cationic species acetylene is linearand the term symbols for the D∞h symmetry are used. In the following description ofelectronic states of the cation, the linear geometry is assumed unless otherwise stated.Upon photoionization by a comb of XUV high-harmonics ranging from 20 to 40 eV,cations are prepared in the ground state X 2Πu (vertical ionization energy 11.4 eV)and the first three excited electronic states: A 2Σ+
g (16.7 eV), B 2Σ+u (18.5 eV) and
C 2Σ+g (23.5 eV) [178, 198–200]. The differences in equilibrium geometries in these
states compared to the ground state leads to the excitation of many vibrationalmodes. This is seen clearly when the photoelectron spectrum obtained with 40 eVsynchrotron radiation [199] in Fig. 5.15(a) is compared to the adiabatic energy leveldiagram in (b).
Electronically excited states may undergo ultra-fast isomerization or dissociation,often violating the Born–Oppenheimer approximation.
• A long-standing debate on whether the A state decays by proton migration tovinylidene [206] or by conical intersections to the ground state [210] was recentlyresolved by a unified theoretical treatment. Time scales of 60 fs for isomerization(matching free-electron laser experiments [46, 197]) and about 250 fs for vibroniccoupling were found [211, 212]. Vibrationally excited A-states can pre-dissociate[35, 57] towards H+C2H
+, with the appearance energy 17.35 eV [203, 213].
• The B state has a shorter lifetime, about 14 fs, with the proposed decay mech-anisms being vibronic coupling to A or X in a bent geometry and spin-orbitcoupling to repulsive states [201, 213]. Onsets in partial ion yield spectra revealthat it dissociates both to the first limit and to H+ +C2H, at 18.9 eV [213, 214].
• The dynamics of the high-lying C state is much less understood but it is knownto be predissociative [200, 202]. For dissociation by breaking of the C–H bond it

74 CHAPTER 5. APPLICATIONS
H13
H17
C�H+
X 2u
A 2g+
B 2u+
C 2g+
H+
2H
C2H2
CH+
C2+
2 C + CH2+
C+
2
C2 + H2+
H15
C2H2+
(b) (c)
CCH2+
Vinylidene
(a)
Acetylene
2A1
2B1
2A2
Group 1
Group 2
Ion e
nerg
y (
eV
)
0
12
14
16
18
20
22
24
26
101102103104
Electronintensity (arb. u.)
Figure 5.15: Electronic states of the acetylene cation and fragment ap-pearance energies. (a) Photoelectron spectrum with 40 eV photon energy, pro-vided by S. Canton [199]. (b) Electronic states of the cation in the acetylene andvinylidene isomers. Adiabatic ionization energies are given relative the neutralacetylene ground state [201] (estimated for C 2Σ+
g [200, 202]). (c) Dissociation lim-its resulting from the breaking of one bond, with fragments in their ground states[202–207]. (Some excited states can be found in Refs. [202, 208, 209].) For the threelowest dissociation limits (Group 1) the C–C bond remains intact while it is brokenin the next three (Group 2). The topmost limit, producing H+
2 will not be anal-ysed. The energy axis is repeated on the right to aid the readout.

5.2. FEMTOSECOND DYNAMICS IN MOLECULES 75
seems to favour H+ +C2H over H+C2H+ [214]. Breaking the C–C bond leads
to CH+CH+, probably with CH+ in an excited state [202].
• The presence of one or more states in the 21 eV region, between B and C,has been discussed and the spectrum shown in Figure 5.15(a) clearly resolvesvibrational structure in this region although the intensity is low. The first ap-pearance energies for CH+CH+ (20.8 eV) and C+ +CH2 (21.2 eV) have beenreported in this range. The latter channel requires isomerization to vinylidene[202, 204, 213].
Two-hole one-particle states were found at energies above the C state but will notbe considered here.
Dynamics in the acetylene cation will be presented here, based on a preliminaryanalysis of mass spectra from XUV pump – IR probe experiments. The dissociationlimits in Fig. 5.15(c) have been grouped by energy into Group 1 (the three lowest)and Group 2 (breaking the C–C bond) we present the fragments produced at theselimits in the following and show that these exhibit dynamics on different time scales.
Experimental methods
The XUV pump pulse consists of high harmonics, generated in krypton at 9 ×10⁻⁴ mbar (1 mbar = 100 Pa).2 Harmonics below 20 eV are blocked by an alu-minium filter while higher orders are present up to about 40 eV. The photon energiesof harmonics 13 to 17 are marked as arrow-heads on the blue line in Fig. 5.15. Wechecked that no signal from correlated ionic pairs (double ionization fragments) isobserved but a small amount of C2H
2+2 is expected at the same time-of-flight as CH+
(mass/charge ratio of 13 u/e). The double ionization threshold is 32 eV but evenwith 38 eV photons single ionization has been reported dominant [46]. To measurethe evolution of the cationic states, an infrared pulse of 1.5 eV photon energy, 30–35 fsduration (FWHM) is used as probe for the time-resolved experiment. The intensityof the probe pulse is high enough that multi photon processes may take place butour analysis indicates that these are generally unlikely.
Mass spectra are recorded in an electrostatic spectrometer with a position sensi-tive detector (Fig. 4.8). The harmonic-generation beamline limited the spectrometerbackground pressure to 2× 10⁻⁸ mbar. Acetylene was injected at room temperaturevia an effusive jet to pressures of 2–8× 10⁻⁷ mbar in the different scans. Mass spec-tra resulting from ionization by the pump or probe pulse are shown in Fig. 5.16. Inthe mass spectrum for XUV-ionization (black curve), the signal from the acetylenemother ion is at least an order of magnitude greater than the residual gas, for instancewater. The most abundant fragments are those in Group 1 (yellow) with the lowestdissociation limits in Fig. 5.15(c): C2H
+, C2+ and H+. The Group 2-fragments (blue)CH+
2 , C+ and CH+ are also clearly seen. The peak from H+
2 is very weak, matchingthe fact that it is the highest two-fragment dissociation limit. There are a numberof peaks originating in acetone, (CH3)2CO, which is present to stabilize acetylenein the gas bottle. This accounts for several background gas fragments especially the
2 Measurements with harmonics from argon at 1.2× 10⁻² mbar were also made.

76 CHAPTER 5. APPLICATIONS
10��
Count ra
te (
s
��
)
1
101
102
0Mass / charge (u/e)
10 20 30
C+
CH+
(C2H22+)
H2O+
H+
H2+
C2H2+
CO+
N2+
O2+
CH3+
CH2+
C2H+
C2+
Figure 5.16: Mass spectra with the XUV or IR pulses. Ionization by theXUV pulse produces all of the expected acetylene fragments (black curve andtext). The cyan or yellow coloured areas refer to the grouping of dissociation chan-nels in Fig. 5.15. Ions labelled in grey text are from the background gas, includingthe CH+
3 fragment from acetone. The infrared probe pulse with a moderate inten-sity can multi-photon ionize acetylene (red filled peak) but not dissociate it.
CH+3 peak. This does not affect our analysis of acetylene since previous studies show
that fragmentation of acetone and acetylene after ionization at 23 eV produces nocommon fragments in the mass spectra [203]. Since the acetone mother ion is anorder of magnitude weaker than acetylene and neither acetone nor its CH+
3 -fragmentshow dependence on the probe delay, the acetone contribution is ignored.
The intensity of the probing IR laser pulse is set at the threshold where multi-photon ionization occurs, where the intensity is expected to be a few times 1012 W/cm2.To ionize acetylene, eight infrared photons must be absorbed. Fig. 5.16 shows a massspectrum in red where the only acetylene peak is from the mother ion indicating thatno dissociation is induced after IR multi-photon ionization.
The width of peaks in the mass spectrum is the combined effect of axial momen-tum and the extended source volume where the XUV beam intersects the effusivejet. It should however be noted that the logarithmic scale exaggerates the visiblewidth. The best momentum resolution is obtained for the H+ fragment, which willbe analysed in terms of kinetic energy later. The first stage of the analysis concernsthe intensities of the peaks, which will be analysed as functions of pump–probe delay.
Effects of the probe pulse
The intensity of the IR probe is too low to ionize the cation; only probe-induced tran-sitions to potential energy surfaces within the cation need to be considered. While theprobe intensity is sufficient to ionize neutral acetylene, multi-photon transition rateswith many photons would be vanishingly small when the initial sample is reduced

5.2. FEMTOSECOND DYNAMICS IN MOLECULES 77
ab
ility
state SignalFinal state
0 IR
Pulse duration
Figure 5.17: Model for the signal in a pump–probe experiment. It is as-sumed that the population in a particular state (green curve) appears rapidly attime τ0 and decays exponentially to the blue final state. The time offset, τ0, is zeroif the green state is prepared directly by the pump pulse, but positive if nuclearmotion is required to reach it. The probe pulse induces a transition from the de-caying state to a different state which constitutes the observed signal (dotted red).For a particular probe delay, τIR, the signal is proportional to the shaded area,which is the product (convolution) of pulse envelope and population.
to those molecules already ionized by the XUV. From the X state, which has thehighest initial population upon ionization [215], the four-photon transition requiredto reach A is forbidden by parity selection. Absorption of a fifth photon would leadto a vibrational level far from the Franck–Condon region and consequently also beunlikely. The first allowed transition is X→B (six-photon absorption). It is expectedto be much weaker than transitions from the A, B and C states, requiring only one ortwo photons. In conclusion, the X state population can be ignored and laser induceddynamics and dissociation can be restricted to cationic states above 16 eV and a fewprobe photons.
The signal of each ionic fragment in the mass spectrum is analysed as functionof the scanned delay between pump and probe pulse, τIR. Figure 5.17 shows thecharacteristic evolution that can be expected [45, 111]. If a short-lived transientstate is probed, its population (green curve) should decrease exponentially with theprobe delay:
E(τIR) =
{
h exp(−(τIR − τ0)k) if τIR > τ00 if τIR < τ0
, (5.6)
where h is the height of the step function (XUV-prepared population) at time offsetτ0 and k is the decay rate. The lifetime of the transient state is 1/k. The final stateof the decay (blue curve) could alternatively be probed [46]. The time offset, orisomerization time, τ0 is positive if an interval of nuclear motion is required afterionization to reach the decaying state [69]. For signals coming from non-transientstates, or having lifetimes much longer than the scan range, the fitted decay rate willbe k ≈ 0.
To fit the experimental signal, the combined (XUV and IR) pulse duration shouldbe accounted for. The signal (dashed red in Fig. 5.17) is obtained as the convolution

78 CHAPTER 5. APPLICATIONS
[111] between equation (5.6) (green curve) and a Gaussian of 32 fs full-width athalf max (FWHM). While molecular dynamics dressed by the infrared field could berequired to explain a signal localized at |τIR| < 32 fs, signals outside this range canbe explained with separate steps for the XUV and IR interaction and are thereforeof primary interest. A variation in the signal at negative or positive τIR delay meansthat the IR-pulse induces dynamics in the neutral or probes dynamics in the ionicmolecule, respectively.
The zero of the time scale for τIR is calibrated to give τ0 = 0 for a high-energyshoulder in the kinetic energy spectrum of H+ ions, presented later (Fig. 5.19). Thiswas typically within 10 fs from the XUV–IR overlap determined by electron interfer-ometry (RABBIT) on argon before the acetylene scan.
Dynamics for the three first dissociation limits
Figure 5.18 shows the delay-dependence for the acetylene cation and the fragmentsresulting from dissociation to the three lowest limits (Group 1 in Fig. 5.15). Theacetylene cation signal is reduced, as a negative step function, when the IR is sentlater than the XUV. The lower part of the figure shows positive steps in all fragmentyields. The cause of this must be that the XUV pump populates some states inC2H
+2 that do not normally dissociate but can be promoted to dissociative states by
the probe. 46 % of the reduction in C2H+2 yield is accounted for by dissociation to
C2H+, which has the lowest appearance energy. Including the positive step heights
for the other fragments shown, C+2 and H+, means that 99 % of the acetylene signal’s
negative step is accounted for – a near perfect agreement. The delay-dependence ofeach fragment was analysed with the model described above. All of them are found tohave decay life times (1/k) greater than a picosecond, meaning practically no decaywithin the scan range. The H+ fragment behaviour is slightly more complex: theanalysis shows that the dynamics of the proton depend on the kinetic energy. Thiswill be discussed in the next section. All steps occur at the same time (τ0 within2 fs), except C2H
+ which is delayed by 18± 7 fs.
The absence of decay within the scan range for fitted step functions means thatlong-lived states are populated by the XUV pump. As motivated in the previous sec-tion, probing of the X state is unlikely and only the excited states will be consideredhere. According to the calculation in Ref. [211], the population of the A 2Σ+
g state, aswell as the B 2Σ+
u state [201], in linear geometry are completely depleted after 250 fs.The population of A is transferred by proton-migration to vinylidene or by a conicalintersection to the X -state in bent geometries (1 2A′ and 1 2A′′). Efficient internalvibrational energy redistribution (IVR) to the C–C stretching mode cools down theisomerization coordinate(s) [211]. In the case of the B -state [201], the fraction of thepopulation transferred to A will undergo further relaxation while the fraction reach-ing the X -state should be stable. The total internal energy (electronic, vibrationaland rotational) should be preserved since molecules in the gas phase can not dissi-pate heat to the surroundings. The final states reached are thus “hot” and likely todissociate to the lowest dissociation limits, C2H
+ +H, C+2 +H2, and H+ +C2H, after
absorption of one or two probe photons, also after long probe delays. This explains

5.2. FEMTOSECOND DYNAMICS IN MOLECULES 79
0 100 200
l io
n y
ield
(arb
. uni
C2H
+
C2
+
H+
C2H
2
+
Figure 5.18: Pump–probe study of C2H+2 : the three lowest dissociation
limits. The change in partial ion yield is shown as function of the delay, τ IR, be-tween the XUV pump and the IR probe, for acetylene and the ionic fragments forthe dissociation limits in Group 1 (Fig. 5.15). To highlight the delay-dependence,signals are offset vertically by an arbitrary amount and ordered by mass. When theIR pulse is sent later than the XUV, the acetylene yield decreases by an amountthat is perfectly compensated by the increases in the shown fragments. The stepfunctions for all of these fragments were found to not decay within the scan range(fitted lifetime beyond a picosecond). Within the H+ fragment yield at the bottom,two fitted components are shown filtered by kinetic energy. The low-energy compo-nent (dotted) has no decay but a femtosecond lifetime is found for the high-energycomponent (dashed).

80 CHAPTER 5. APPLICATIONS
the observed step functions in the yield of these fragments.
The height of the step in the C+2 yield is only about a third of the other steps in
Fig. 5.18. A sequential dissociation via H+C2H+ into H+C+
2 +H, where an addi-tional bond is broken, would require almost 23 eV [214] and could not be accessed bythe absorption of a single IR photon. The C+
2 fragment is in general most likely to becreated together with H2 (appearance energy 18.4 eV [204, 214]) from the vinylidenegeometry or after substantial cis-bending. Assuming the hot states lie below 17 eV,a probe transition reaching the C+
2 +H2 limit requires at least two IR photons.
Finally, in the C2H+ and C2H
+2 yields one can observe modulations with a period
of ∼130 fs, appearing as deviations from the step-function curves. With increasedprobe intensity the modulations are seen also in other fragments, in-phase and out-phase with respect to the mother ion. An oscillating signal can be interpreted asquantum beat between two vibrational states [216] or more general nuclear wavepacket dynamics on a potential energy surface. A longer scan range would be nec-essary for a Fourier analysis or assessment of coherence time. With the scan rangelimited to +280 fs, a tentative interpretation can be given from other considerations:Due to the initial excitation of many vibrational modes, the presence of fast internalenergy redistribution and the complex topology of the potential-energy surfaces ofthe cationic states, it is more likely that the experiment probes nuclear dynamics.
One could speculate that it originates from the time for the proton to travel backand forth between the acetylene and vinylidene isomers. The period for this motionis expected to be 60± 10 fs [46, 212, 217] which seems in line with our observation.Other processes ought to be considered to explain the delayed onset for C2H
+ of18± 7 fs, such as the travelling time for the wave packet in the A-state [217] or theB -state [201] to reach the X -state through a conical intersection.
Ultra-fast deprotonation
The H+ signal exhibits, both slow (>1 ps) and fast dynamics. The origin of thisbehaviour will be investigated here. Figure 5.19(a) compares the kinetic energy dis-tribution of H+, when the probe is sent well before/after the XUV pulse (dotted) ornearly overlapping (solid lines). Data from the present scan (magenta) is also com-pared with the scan having a higher probe intensity (green). While the spectra areessentially identical below 2 eV, an increased fraction of high-energy protons is seenat the overlap. With increased IR intensity, the high-energy signal is increased. Weinterpret the fact that the change occurs for energies above 2 eV and is intensity-dependent as indicative of a two-photon transition to a dissociating state.
The high-energy component of the H+ yield exhibits a rather short transient-statelifetime, 212± 34 fs as shown in Fig. 5.19(b). (173± 26 fs in the scan with a strongerIR probe.) Assuming that the H+ +C2H have no internal energy, a kinetic energyrelease of 3 eV means that the dissociative state would lie at about 22 eV. Thisis reachable by a two-photon transition from the Franck–Condon region in B. Thereported lifetime of 14 fs for B [201] is however not consistent with our observation.
The appearance of a 3 eV-proton feature has been reported for ionization by elec-tron impact and found to originate from the C -state at 23.5 eV, via predissociation
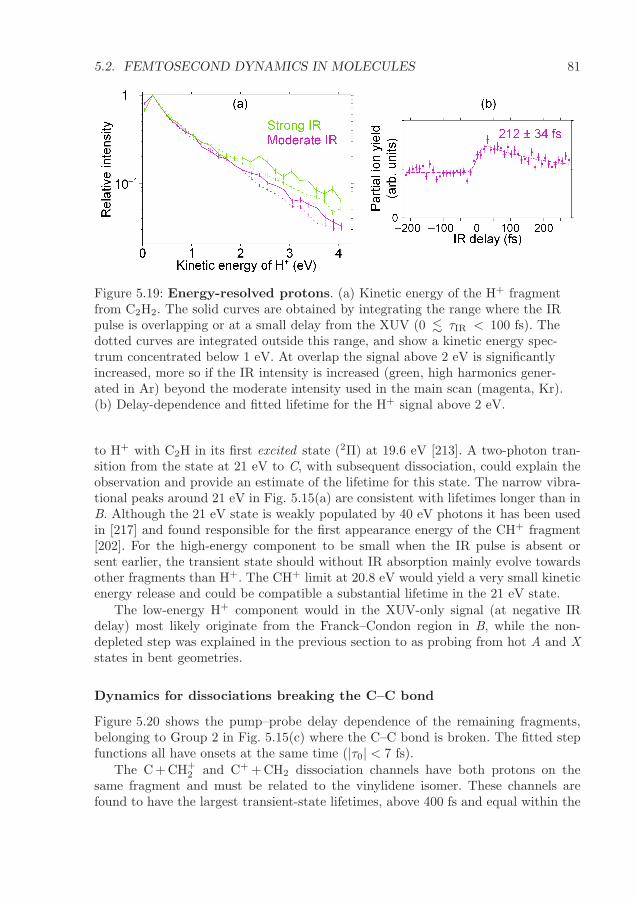
5.2. FEMTOSECOND DYNAMICS IN MOLECULES 81
Figure 5.19: Energy-resolved protons. (a) Kinetic energy of the H+ fragmentfrom C2H2. The solid curves are obtained by integrating the range where the IRpulse is overlapping or at a small delay from the XUV (0 . τIR < 100 fs). Thedotted curves are integrated outside this range, and show a kinetic energy spec-trum concentrated below 1 eV. At overlap the signal above 2 eV is significantlyincreased, more so if the IR intensity is increased (green, high harmonics gener-ated in Ar) beyond the moderate intensity used in the main scan (magenta, Kr).(b) Delay-dependence and fitted lifetime for the H+ signal above 2 eV.
to H+ with C2H in its first excited state (2Π) at 19.6 eV [213]. A two-photon tran-sition from the state at 21 eV to C, with subsequent dissociation, could explain theobservation and provide an estimate of the lifetime for this state. The narrow vibra-tional peaks around 21 eV in Fig. 5.15(a) are consistent with lifetimes longer than inB. Although the 21 eV state is weakly populated by 40 eV photons it has been usedin [217] and found responsible for the first appearance energy of the CH+ fragment[202]. For the high-energy component to be small when the IR pulse is absent orsent earlier, the transient state should without IR absorption mainly evolve towardsother fragments than H+. The CH+ limit at 20.8 eV would yield a very small kineticenergy release and could be compatible a substantial lifetime in the 21 eV state.
The low-energy H+ component would in the XUV-only signal (at negative IRdelay) most likely originate from the Franck–Condon region in B, while the non-depleted step was explained in the previous section to as probing from hot A and X
states in bent geometries.
Dynamics for dissociations breaking the C–C bond
Figure 5.20 shows the pump–probe delay dependence of the remaining fragments,belonging to Group 2 in Fig. 5.15(c) where the C–C bond is broken. The fitted stepfunctions all have onsets at the same time (|τ0| < 7 fs).
The C+CH+2 and C+ +CH2 dissociation channels have both protons on the
same fragment and must be related to the vinylidene isomer. These channels arefound to have the largest transient-state lifetimes, above 400 fs and equal within the
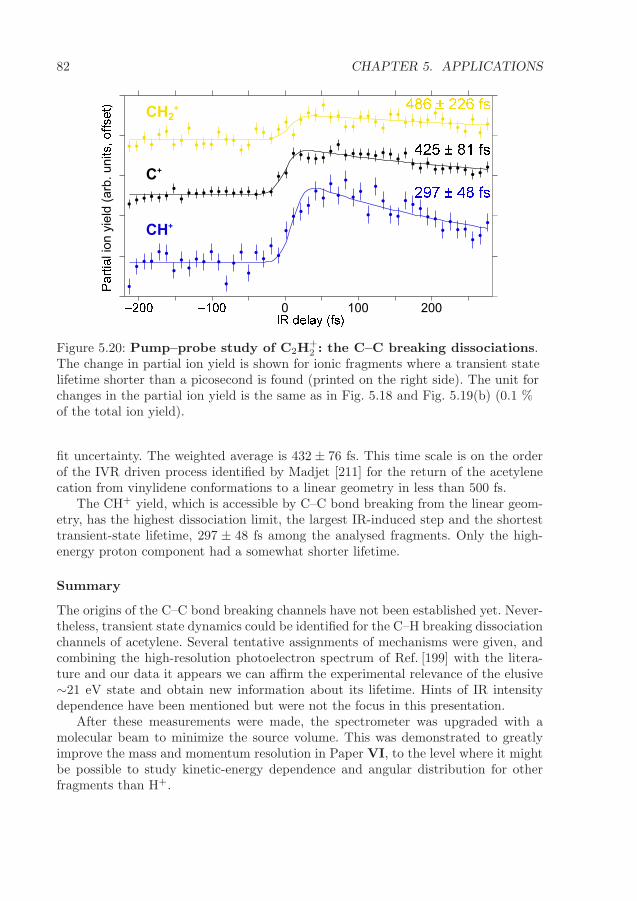
82 CHAPTER 5. APPLICATIONS
0 100 200
CH2+
CH+
C+
l io
n y
ield
(arb
. uni
Figure 5.20: Pump–probe study of C2H+2 : the C–C breaking dissociations.
The change in partial ion yield is shown for ionic fragments where a transient statelifetime shorter than a picosecond is found (printed on the right side). The unit forchanges in the partial ion yield is the same as in Fig. 5.18 and Fig. 5.19(b) (0.1 %of the total ion yield).
fit uncertainty. The weighted average is 432 ± 76 fs. This time scale is on the orderof the IVR driven process identified by Madjet [211] for the return of the acetylenecation from vinylidene conformations to a linear geometry in less than 500 fs.
The CH+ yield, which is accessible by C–C bond breaking from the linear geom-etry, has the highest dissociation limit, the largest IR-induced step and the shortesttransient-state lifetime, 297 ± 48 fs among the analysed fragments. Only the high-energy proton component had a somewhat shorter lifetime.
Summary
The origins of the C–C bond breaking channels have not been established yet. Never-theless, transient state dynamics could be identified for the C–H breaking dissociationchannels of acetylene. Several tentative assignments of mechanisms were given, andcombining the high-resolution photoelectron spectrum of Ref. [199] with the litera-ture and our data it appears we can affirm the experimental relevance of the elusive∼21 eV state and obtain new information about its lifetime. Hints of IR intensitydependence have been mentioned but were not the focus in this presentation.
After these measurements were made, the spectrometer was upgraded with amolecular beam to minimize the source volume. This was demonstrated to greatlyimprove the mass and momentum resolution in Paper VI, to the level where it mightbe possible to study kinetic-energy dependence and angular distribution for otherfragments than H+.

5.3. OUTLOOKS 83
5.3 Outlooks
The experiments presented in this thesis have been able to gain access to electronicand molecular dynamics, using different combinations of advanced light sources andcharged-particle spectrometry. It is interesting to note that the light sources havecomplementary characteristics: a spectral width of 10 eV for the attosecond pulsesand less than 0.1 eV for the synchrotron radiation.
So far, photoelectron group delays have been studied by attosecond pump–probemethods and by the angular distribution, for different systems. Since the current un-derstanding of direct double ionization rests on the study of the two-electron angulardistribution from helium (triply differential cross section) [16, 132] a combinationof attosecond methods and electron momentum imaging in 3D is a very excitingoutlook, combining both themes of this thesis. Although some 3D momentum exper-iments were made for electrons (in single ionization) during my doctoral studies the3D-results presented here have focused on ions.
• To detect multiple electron momentum vectors in coincidence is becoming pos-sible with the latest hardware, while the longer flight times of ions have allowedcoincident studies of them for decades.
• To doubly ionize helium requires a high photon energy, which is possible to reachby high harmonics but seldom with kilohertz repetition rate.
• The particle-counting nature of coincidence experiments means that repetitionrate is more of a concern than the average photon flux. The development of lasersystems that can generate attosecond pulses with multi-kilohertz, or even mega-hertz, repetition rate is progressing at the moment, with coincidence applicationsas a driving force.
Sequential two-photon double ionization was assessed in section 5.1.1 mainly toavoid it and focus on regions where direct double ionization was probed in the con-tinuum (nonsequential). The distinction between sequential and nonsequential ion-ization has been a long-standing topic with intense light sources, where both photonsmay be absorbed from the same pulse, from bound-electron lasers [27, 130, 218] tofree-electron lasers [219]. In the present work, one photon came from an attosecondpulse train (in the XUV range) and the other from a femtosecond pulse. It has beenpredicted that the distinction between sequential and nonsequential processes breaksdown if both photons come from attosecond pulses [220]. Very few XUV+XUV exper-iments have been made with attosecond pulses [71, 221] and studies of the correlatedelectrons in such cases remain to be made.
With broadband light sources, the possibly coherent evolution of states in a wideenergy range (a wave packet) is important to consider and explore. Coherence be-tween the two free electrons in autoionization of a cation (indirect double ioniza-tion) might be possible to examine by electron interferometry at femtosecond probe-delays, for instance in a molecule where nuclear motion “chirps” the energy levelsover time. Coherence in the wave packet describing nuclear motion can be seen asoscillation in pump–probe signals (section 5.2.2). Decoherence is a major limitationfor quantum computers and it appears that coherence properties are better utilized

84 CHAPTER 5. APPLICATIONS
for efficiency in some steps of biological photosynthesis than in artificial solar cells[222, 223]. Combined studies making the best of the complementary light sources andcomparing semiclassical and quantum mechanical models can hopefully advance theunderstanding of some coherence phenomena.
In conclusion, the coincident detection of multiple particles enables studies offundamental processes in systems of increasing complexity: polyatomic molecules andnanometre-sized clusters of atoms or molecules. Coincidence experiments recordingmomenta, or at least kinetic energy, for both electrons and ions will be important toaid the analysis of molecular dynamics by identifying both between which states theionizing transition(s) occur and how the nuclei move [40, 41, 196, 202]. Momentumvectors were mostly analysed for the positive ions in this work but the capability ofelectron 3D-momentum in coincidence with ion mass is demonstrated in Paper VI.While attosecond pulses are good for studying the ionization process, their bandwidthwould make a photoelectron spectrum from molecules with more than two atomsdifficult to interpret. The analysis of a very dense atomic spectrum was performed insection 5.1.1 but for the time scale of nuclear dynamics, the narrower spectrum fromone harmonic in the XVU range may be advantageous [224–226].

Acknowledgements
Thank you ...Mathieu Gisselbrecht for infinite amounts of support, confidence in me and, prob-
ably, wisdom. Though your actions were puzzling at times it turned out there wasusually a pedagogical intent. If you haven’t succeeded in teaching me everythingabout the scientific life, it is not for lack of trying.
Stacey Ristinmaa Sorensen for steady guidance and seemingly keeping track ofeverything that was ever published. It was always reassuring to learn that you werewatching the perimeters, through engagements in the scientific community and byfinding resources for the group.
Anne L’Huillier for building a great team and for not giving up. Your and MarcusDahlstrom’s teaching gave me the first glimpses of attosecond physics, a feeling ex-cellently conveyed in Marcus’ thesis prologue [68]. Without our discussions I wouldperhaps never have understood Feynman diagrams. Thanks also to Johan Mauritssonfor support during my master’s project and for promoting science to the public.
Diego Guenot, Cord Arnold and David Kroon for long nights and early morningsin the attolab, and for general helpfulness. Without you there would have been nopotato, zombie movie or science.
Joakim Laksman, Shabnam Oghbaie, Anna Sankari, Noelle Walsh, Bart Oosten-rijk and Christian Strahlman for all the beamtimes together with me. And perhapseven more for the beamtimes where I could not contribute, while writing the thesis.
Franck Lepine, Anatoli Kheifets and Eva Lindroth for contributing with expertiseat the forefronts of large molecules and heavy atoms, experimentally or theoretically.
MAX-lab/MAX IV staff, particularly Maxim Tchaplyguine for advice and equip-ment during beamtimes and Rami Sankari for a critical review of the thesis, evenspending time to find better references.
Patrik Wirgin, Anneli Nilsson-Ahlm, Achim Schnadt and Stacey for smooth run-ning of the Division of Synchrotron Radiation Research.
Natalia Martin, Elin Granas, Olesia Snezhkova and Olof Persson for being thebest office mates, and Natalia for being one step ahead with the thesis [227].
The numerous doctoral and master’s students from distant places, including Swe-den north of Skane, for ensuring there was always something to discuss over lunch.
Martin Hjort [228], Erik Marsell and Elin for developing word puns into a formof art – literally (by photography) as well as figuratively (verbally).
Finally, a big thanks to my parents and brothers – Anne, Tony, Robert and Anton– for a pleasant upbringing.
85

86

Bibliography
[1] H. Hertz. Ueber einen einfluss des ultravioletten lichtes auf die electrische entladung.Annalen der Physik 267, 983–1000 (1887).
[2] A. Einstein. Uber einen die Erzeugung und Verwandlung des Lichtes betreffendenheuristischen Gesichtspunkt. Annalen der Physik 17, 132–148 (1905). Translated by D. terHaar: On a Heuristic Point of View about the Creation and Conversion of Light. In The Old
Quantum Theory, 91–107 (Pergamon Press, 1967).
[3] H. P. Bonzel & C. Kleint. On the history of photoemission. Progress in Surface Science
49, 107–153 (1995).
[4] M. Drescher & F. Krausz. Attosecond physics: facing the wave–particle duality. J. Phys. B:
At., Mol. Opt. Phys. 38, S727 (2005).
[5] P. Auger. Sur l’effet photoelectrique compose. J. Phys. Radium 6, 205–208 (1925).
[6] L. O. Werme, T. Bergmark & K. Siegbahn. The high resolution L2,3MM and M4,5NN augerspectra from krypton and M4,5NN and N4,5OO Auger spectra from xenon. Physica Scripta
6, 141 (1972).
[7] C. Miron & P. Morin. High-resolution inner-shell photoionization, photoelectron andcoincidence spectroscopy. In M. Quack & F. Merkt (eds.) Handbook of High-resolution
Spectroscopy (John Wiley & Sons, Ltd, 2011).
[8] U. Becker. Photoelectron spectroscopy of atoms. J. Electron Spectrosc. Relat. Phenom.
75, 23 – 34 (1995).
[9] T. Schneider, P. L. Chocian & J.-M. Rost. Separation and identification of dominantmechanisms in double photoionization. Phys. Rev. Lett. 89, 073002 (2002).
[10] M. Drescher et al. Time-resolved atomic inner-shell spectroscopy. Nature 419, 803–807(2002).
[11] U. Hergenhahn. Interatomic and intermolecular coulombic decay: The early years.J. Electron Spectrosc. Relat. Phenom. 184, 78–90 (2011).
[12] J. Schnadt et al. Experimental evidence for sub-3-fs charge transfer from an aromaticadsorbate to a semiconductor. Nature 418, 620–623 (2002).
[13] A. Fohlisch et al. Direct observation of electron dynamics in the attosecond domain. Nature
436, 373–376 (2005).
[14] J. H. D. Eland et al. Complete two-electron spectra in double photoionization: The raregases Ar, Kr, and Xe. Phys. Rev. Lett. 90, 053003 (2003).
[15] O. Guyetand et al. Complete momentum analysis of multi-photon photo-double ionizationof xenon by XUV and infrared photons. J. Phys. B: At., Mol. Opt. Phys. 41, 065601 (2008).
[16] L. Avaldi & A. Huetz. Photodouble ionization and the dynamics of electron pairs in thecontinuum. J. Phys. B: At., Mol. Opt. Phys. 38, S861–S891 (2005).
[17] O. Bjorneholm et al. Femtosecond dissociation of core-excited hcl monitored by frequencydetuning. Phys. Rev. Lett. 79, 3150–3153 (1997).
87

88 BIBLIOGRAPHY
[18] I. Hjelte et al. Evidence for ultra-fast dissociation of molecular water from resonant Augerspectroscopy. Chemical Physics Letters 334, 151–158 (2001).
[19] M. Ferray et al. Multiple-harmonic conversion of 1064 nm radiation in rare gases. J. Phys.
B: At., Mol. Opt. Phys. 21, L31 (1988).
[20] P. B. Corkum. Plasma perspective on strong field multiphoton ionization. Phys. Rev. Lett.
71, 1994–1997 (1993).
[21] P. M. Paul et al. Observation of a train of attosecond pulses from high harmonic generation.Science 292, 1689–1692 (2001).
[22] L. Gallmann, C. Cirelli & U. Keller. Attosecond science: Recent highlights and futuretrends. Annual Review of Physical Chemistry 63, 447–469 (2012).
[23] F. Krausz & M. Ivanov. Attosecond physics. Rev. Mod. Phys. 81, 163–234 (2009).
[24] F. Lepine, G. Sansone & M. J. Vrakking. Molecular applications of attosecond laser pulses.Chemical Physics Letters 578, 1–14 (2013).
[25] S. R. Leone et al. What will it take to observe processes in ‘real time‘? Nature Photonics
8, 162–166 (2014).
[26] T. Weber et al. Correlated electron emission in multiphoton double ionization. Nature
405, 658–661 (2000).
[27] B. Bergues et al. Attosecond tracing of correlated electron-emission in non-sequential doubleionization. Nature Communications 3, 813 (2012).
[28] N. Berrah et al. Non-linear processes in the interaction of atoms and molecules with intenseEUV and x-ray fields from SASE free electron lasers (FELs). Journal of Modern Optics
57, 1015–1040 (2010).
[29] A. Rouzee et al. Towards imaging of ultrafast molecular dynamics using FELs. J. Phys. B:
At., Mol. Opt. Phys. 46, 164029 (2013).
[30] M. Schultze et al. Delay in photoemission. Science 328, 1658 (2010).
[31] K. Klunder et al. Probing single-photon ionization on the attosecond time scale. Phys. Rev.
Lett. 106, 143002 (2011).
[32] D. Guenot et al. Photoemission-time-delay measurements and calculations close to the3s-ionization-cross-section minimum in Ar. Phys. Rev. A 85, 053424 (2012).
[33] V. Schmidt. Electron Spectrometry of Atoms using Synchrotron Radiation
(Cambridge University Press, 1997).
[34] C. J. Foot. Atomic Physics (Oxford University Press, 2005).
[35] P. Atkins & J. de Paula. Atkins’ Physical Chemistry (Oxford University Press, 2010), ninthedn.
[36] A. Kikas et al. High-resolution study of the correlation satellites in photoelectron spectra ofthe rare gases. J. Electron Spectrosc. Relat. Phenom. 77, 241–266 (1996).
[37] V. Schmidt. Photoionization of atoms using synchrotron radiation. Rep. Prog. Phys.
55, 1483–1659 (1992).
[38] U. Fano. Effects of configuration interaction on intensities and phase shifts. Phys. Rev.
124, 1866–1878 (1961).
[39] P. Lablanquie et al. Post collision interaction probed by multi-electron coincidences:Application to the Ar 2s inner-shell photoionization. J. Electron Spectrosc. Relat. Phenom.
185, 198–203 (2012).
[40] J. Ullrich et al. Recoil-ion and electron momentum spectroscopy: reaction-microscopes.Reports on Progress in Physics 66, 1463 (2003).

BIBLIOGRAPHY 89
[41] M. Yamazaki et al. 3D mapping of photoemission from a single oriented H2O molecule.J. Phys. B: At., Mol. Opt. Phys. 42, 051001 (2009).
[42] S. K. Semenov et al. Auger decay of 1σg and 1σu hole states of the N2 molecule:Disentangling decay routes from coincidence measurements. Phys. Rev. A 81, 043426 (2010).
[43] M. Hochlaf, F. R. Bennett, G. Chambaud & P. Rosmus. Theoretical study of the electronicstates of CO2. J. Phys. B: At., Mol. Opt. Phys. 31, 2163 (1998).
[44] L. S. Cederbaum. The exact molecular wavefunction as a product of an electronic and anuclear wavefunction. J. Chem. Phys. 138, 224110 (2013).
[45] J. van Tilborg et al. Femtosecond isomerization dynamics in the ethylene cation measuredin an EUV-pump NIR-probe configuration. J. Phys. B: At., Mol. Opt. Phys. 42, 081002(2009).
[46] Y. H. Jiang et al. Ultrafast extreme ultraviolet induced isomerization of acetylene cations.Phys. Rev. Lett. 105, 263002 (2010).
[47] J. Muga & C. Leavens. Arrival time in quantum mechanics. Physics Report 338, 353–438(2000).
[48] J. Hilgevoord. Time in quantum mechanics. American Journal of Physics 70, 301–306(2002).
[49] J. Hilgevoord. Time in quantum mechanics: a story of confusion. Studies in History and
Philosophy of Modern Physics 36, 29–60 (2005).
[50] B. E. A. Saleh & M. C. Teich. Fundamentals of Photonics (John Wiley & Sons, Inc.,Hoboken, New Jersey, 2007), second edn.
[51] R. N. Zare. Photoejection dynamics. Mol. Photochem. 4, 1–37 (1972).http://www.stanford.edu/group/Zarelab/publinks/zarepub60.pdf.
[52] S.-c. Yang & R. Bersohn. Theory of the angular distribution of molecular photofragments.J. Chem. Phys. 61, 4400–4407 (1974).
[53] G. Wu, P. Hockett & A. Stolow. Time-resolved photoelectron spectroscopy: fromwavepackets to observables. Phys. Chem. Chem. Phys. 13, 18447–18467 (2011).
[54] C. N. Yang. On the angular distribution in nuclear reactions and coincidence measurements.Phys. Rev. 74, 764–772 (1948).
[55] L. H. Haber, B. Doughty & S. R. Leone. Continuum phase shifts and partial cross sectionsfor photoionization from excited states of atomic helium measured by high-order harmonicoptical pump-probe velocity map imaging. Phys. Rev. A 79, 031401 (2009).
[56] S. Fritzsche, A. N. Grum-Grzhimailo, E. V. Gryzlova & N. M. Kabachnik. Sequentialtwo-photon double ionization of the 4d shell in xenon. J. Phys. B: At., Mol. Opt. Phys.
44, 175602 (2011).
[57] G. Herzberg. Molecular Spectra and Molecular Structure: Vol. I – Spectra of diatomic
molecules (Krieger Publishing Company, Malabar, Florida, 1950 & 1989), 2nd edn.
[58] W. C. Stolte et al. 100% site-selective fragmentation in core-hole-photoexcited methanol byanion-yield spectroscopy. J. Phys. B: At., Mol. Opt. Phys. 35, L253 (2002).
[59] Z. D. Pesic, D. Rolles, R. C. Bilodeau, I. Dimitriu & N. Berrah. Three-body fragmentationof CO2+
2 upon K-shell photoionization. Phys. Rev. A 78, 051401 (2008).
[60] J. Laksman. Nuclear motion in molecular ions studied with synchrotron radiation and
multicoincidence momentum imaging spectrometry. Ph.D. thesis, Lund University (2012).
[61] J. Cooper & R. N. Zare. Erratum: Angular distribution of photoelectrons. J. Chem. Phys.
49, 4252–4252 (1968).

90 BIBLIOGRAPHY
[62] M. G. White et al. Angular distribution of Xe 5s → ǫp photoelectrons near the cooperminimum. Phys. Rev. Lett. 43, 1661–1664 (1979).
[63] J. Dahlstrom et al. Theory of attosecond delays in laser-assisted photoionization. Chemical
Physics 414, 53–64 (2013).
[64] J. M. Dahlstrom, A. L’Huillier & A. Maquet. Introduction to attosecond delays inphotoionization. J. Phys. B: At., Mol. Opt. Phys. 45, 183001 (2012).
[65] J. J. Sakurai. Modern Quantum Mechanics (Addison Wesley Longman, 1993), revisededition edn.
[66] E. P. Wigner. Lower limit for the energy derivative of the scattering phase shift. Phys. Rev.
98, 145–147 (1955).
[67] C. Hoffmann. Representing difference: Ernst Mach and Peter Salcher’sballistic-photographic experiments. Endeavour 33, 18–23 (2009).
[68] J. M. Dahlstrom. Light-matter interaction on the attosecond timescale. Ph.D. thesis, LundUniversity, LRAP-438 (2011).
[69] M. Dantus, M. J. Rosker & A. H. Zewail. Femtosecond real-time probing of reactions. II. thedissociation reaction of ICN. J. Chem. Phys. 89, 6128 (1988).
[70] A. H. Zewail. Femtochemistry: Atomic-scale dynamics of the chemical bond. J. Phys.
Chem. A 104, 5660–5694 (2000).
[71] P. Tzallas, E. Skantzakis, L. A. A. Nikolopoulos, G. D. Tsakiris & D. Charalambidis.Extreme-ultraviolet pump–probe studies of one-femtosecond-scale electron dynamics. Nature
Physics 7, 781–784 (2011).
[72] K. Varju et al. Angularly resolved electron wave packet interferences. J. Phys. B: At., Mol.
Opt. Phys. 39, 3983 (2006).
[73] T. Remetter et al. Attosecond electron wave packet interferometry. Nature Physics
2, 323–326 (2006).
[74] H. G. Muller. Reconstruction of attosecond harmonic beating by interference of two-photontransitions. Applied Physics B 74, s17–s21 (2002).
[75] R. Lopez-Martens et al. Amplitude and phase control of attosecond light pulses. Phys. Rev.
Lett. 94, 033001 (2005).
[76] A. A. Michelson & E. Morley. On the relative motion of the earth and the luminiferousether. American Journal of Science 34, 333–345 (1887).http://www.aip.org/history/gap/PDF/michelson.pdf.
[77] J. Mauritsson et al. Attosecond electron spectroscopy using a novel interferometricpump-probe technique. Phys. Rev. Lett. 105, 053001 (2010).
[78] K. Klunder. Electron Wave Packet Dynamics on the Attosecond Time Scale. Ph.D. thesis,Lund University, LRAP-457 (2012).
[79] MAX IV Laboratory. Max-lab web site. https://www.maxlab.lu.se/. Retrieved2014-Jan-03.
[80] M. Sjostrom, E. Wallen, M. Eriksson & L.-J. Lindgren. The MAX III storage ring. Nucl.
Instr. Meth. Phys. Res., Sect. A 601, 229–244 (2009).
[81] C. Strahlman et al. Angle-resolved time-of-flight spectroscopy applied to multi-bunchoperation at max-lab: a design study. Journal of Physics: Conference Series 425, 092011(2013).
[82] S. Werin. Accelerator technique (MAX-lab, Lund, 2006), 2.5th edn.
[83] D. Brandt (ed.). CERN Accelerator School: Course on Synchrotron Radiation and
Free-Electron Lasers (2003). DOI: 10.5170/CERN-2005-012.

BIBLIOGRAPHY 91
[84] Lightsources.org. History. http://www.lightsources.org/cms/?pid=1001274. Retrieved2013-Jan-11.
[85] D. I. Svergun & M. H. J. Koch. Small-angle scattering studies of biological macromoleculesin solution. Reports on Progress in Physics 66, 1735–1782 (2003).
[86] R. Wehlitz. Ch. 1: Simultaneous emission of multiple electrons from atoms and moleculesusing synchrotron radiation. In E. A. Paul Berman & C. Lin (eds.) Advances In Atomic,
Molecular, and Optical Physics, vol. 58, 1–76 (Academic Press, 2010).
[87] A. Andersson, M. Eriksson, L.-J. L. andP. Rojsel & S. Werin. The new 1.5 GeV storage ringfor synchrotron radiation: MAX II. Rev. Sci. Instrum. 66, 1850–1853 (1995).
[88] M. Bassler et al. Beam line I411 at MAX-II – performance and first results. Nucl. Instr.
Meth. Phys. Res., Sect. A 469, 382–393 (2001).
[89] E. S. Reich. Ultimate upgrade for US synchrotron. Nature News 501, 148–149 (2013).
[90] M. Swoboda. Attosecond Wave Packet Metrology. Ph.D. thesis, Lund University, LRAP-414(2010).
[91] P. Mulller. Glossary of terms used in physical organic chemistry: Iupac recommendations1994. Pure and Applied Chemistry 66, 1077–1184 (1994).
[92] S. G. Lias & J. E. Bartmess. Gas-phase ion thermochemistry.http://webbook.nist.gov/chemistry/ion/. Retrieved 2014-Jan-25.
[93] E. Gustafsson et al. Broadband attosecond pulse shaping. Opt. Lett. 32, 1353–1355 (2007).
[94] M. Chini, K. Zhao & Z. Chang. The generation, characterization and applications ofbroadband isolated attosecond pulses. Nature Photonics 8, 178–186 (2014).
[95] E. P. Mansson. Temporal gating of attosecond pulse trains. Master’s dissertation, LundUniversity, LRAP-403 (2009).
[96] C. Koen. Significance testing of periodogram ordinates. Astrophysical Journal 348, 700–702(1990).
[97] National Institute of Standards and Technology (NIST). Atomic spectra database, v. 5(2013). http://physics.nist.gov/asd.
[98] E. Andersson et al. Multielectron coincidence study of the double Auger decay of 3d-ionizedkrypton. Phys. Rev. A 82, 043418 (2010).
[99] Y. Hikosaka et al. Double photoionization into double core-hole states in Xe. Phys. Rev.
Lett. 98, 183002 (2007).
[100] K. P. Burnham & D. R. Anderson. Model selection and multimodel inference: a practical
information-theoretic approach (Springer, New York, 2002), 2nd edn.
[101] L. J. Frasinski, K. Codling & P. A. Hatherly. Covariance mapping: A correlation methodapplied to multiphoton multiple ionization. Science 246, 1029–1031 (1989).http://www.jstor.org/stable/1704942.
[102] R. Trainham & J. Tinsley. Covariance analysis of gamma ray spectra. Rev. Sci. Instrum.
84, 013502 (2013).
[103] O. Kornilov et al. Coulomb explosion of diatomic molecules in intense xuv fields mapped bypartial covariance. J. Phys. B: At., Mol. Opt. Phys. 46, 164028 (2013).
[104] RoentDek Handels GmbH. Manuals (2010). http://www.roentdek.de/manuals/.
[105] Cronologic GmbH & Co. KG. High speed digitizers.http://www.cronologic.de/products/digitizer/. Retrieved 2014-Jan-28.
[106] V. Ulrich et al. Photoelectron–auger electron coincidence spectroscopy of free molecules:New experiments. J. Electron Spectrosc. Relat. Phenom. 183, 70 – 79 (2011).

92 BIBLIOGRAPHY
[107] G. Ohrwall et al. A new energy and angle resolving electron spectrometer – first results.J. Electron Spectrosc. Relat. Phenom. 183, 125 – 131 (2011).
[108] P. Kruit & F. H. Read. Magnetic field paralleliser for 2π electron-spectrometer andelectron-image magnifier. J. Phys. E: Sci. Instrum. 16, 313–324 (1983).
[109] M. Mucke et al. Performance of a short “magnetic bottle” electron spectrometer. Rev. Sci.
Instrum. 83, 063106 (2012).
[110] K. Rademann, T. Rech, B. Kaiser, U. Even & F. Hensel. A new coincidence technique forvacuum ultraviolet photoelectron spectroscopy of neutral clusters in a molecular beam. Rev.
Sci. Instrum. 62, 1932–1941 (1991).
[111] J. Lacoursiere, M. Meyer, L. Nahon, P. Morin & M. Larzilliere. Time-resolved pump-probephotoelectron spectroscopy of helium using a mode-locked laser synchronized withsynchrotron radiation pulses. Nucl. Instr. Meth. Phys. Res., Sect. A 351, 545–553 (1994).
[112] The MathWorks, Inc. Matlab documentation – “least-squares fitting”, lsqnonlin,fitoptions and nlparci (2011).http://www.mathworks.com/help/optim/ug/lsqnonlin.html.
[113] W. C. Wiley & I. H. McLaren. Time-of-flight mass spectrometer with improved resolution.Rev. Sci. Instrum. 26, 1150–1157 (1955).
[114] D. P. Seccombe & T. J. Reddish. Theoretical study of space focusing in linear time-of-flightmass spectrometers. Rev. Sci. Instrum. 72, 1330–1338 (2001).
[115] A. Lindgren. Studies of Molecular and Cluster Fragmentation Using Synchrotron Radiation:
Measurements and Models. Ph.D. thesis, Lund University (2006).
[116] J. Laksman, D. Ceolin, E. P. Mansson, S. L. Sorensen & M. Gisselbrecht. Development andcharacterization of a multiple-coincidence ion-momentum imaging spectrometer. Rev. Sci.
Instrum. 84, 123113 (2013).
[117] M. Lebech, J. C. Houver & D. Dowek. Ion-electron velocity vector correlations indissociative photoionization of simple molecules using electrostatic lenses. Rev. Sci.
Instrum. 73, 1866–1874 (2002).
[118] G. A. Garcia, L. Nahon, C. J. Harding, E. A. Mikajlo & I. Powis. A refocusing modifiedvelocity map imaging electron/ion spectrometer adapted to synchrotron radiation studies.Rev. Sci. Instrum. 76, 053302 (2005).
[119] A. Vredenborg, W. G. Roeterdink & M. H. M. Janssen. A photoelectron-photoioncoincidence imaging apparatus for femtosecond time-resolved molecular dynamics withelectron time-of-flight resolution of σ = 18 ps and energy resolution δe/e = 3.5%. Rev. Sci.
Instrum. 79, 063108 (2008).
[120] R. Dorner et al. Cold target recoil ion momentum spectroscopy: a ‘momentum microscope’to view atomic collision dynamics. Physics Reports 330, 95–192 (2000).
[121] A. Adams & F. H. Read. Electrostatic cylinder lenses III: three element asymmetric voltagelenses. J. Phys. E: Sci. Instrum. 5, 156 (1972).
[122] R. Campargue. Progress in overexpanded supersonic jets and skimmed molecular beams infree-jet zones of silence. The Journal of Physical Chemistry 88, 4466–4474 (1984).
[123] A. T. J. B. Eppink & D. H. Parker. Velocity map imaging of ions and electrons usingelectrostatic lenses: Application in photoelectron and photofragment ion imaging ofmolecular oxygen. Rev. Sci. Instrum. 68, 3477–3484 (1997).
[124] G. A. Garcia, H. Soldi-Lose & L. Nahon. A versatile electron-ion coincidence spectrometerfor photoelectron momentum imaging and threshold spectroscopy on mass selected ionsusing synchrotron radiation. Rev. Sci. Instrum. 80, 023102 (2009).
[125] M. J. J. Vrakking. An iterative procedure for the inversion of two-dimensionalion/photoelectron imaging experiments. Rev. Sci. Instrum. 72, 4084–4089 (2001).

BIBLIOGRAPHY 93
[126] G. A. Garcia, L. Nahon & I. Powis. Two-dimensional charged particle image inversion usinga polar basis function expansion. Rev. Sci. Instrum. 75, 4989–4996 (2004).
[127] R. Dorner et al. Double ionization by one and many photons. Radiation Physics and
Chemistry 70, 191–206 (2004).
[128] C. F. de Morisson Faria & X. Liu. Electron-electron correlation in strong laser fields.J. Mod. Opt. 58, 1076–1131 (2011).
[129] G. Sansone, T. Pfeifer, K. Simeonidis & A. I. Kuleff. Electron correlation in real time.ChemPhysChem 13, 661–680 (2012).
[130] A. N. Pfeiffer, C. Cirelli, M. Smolarski, R. Doerner & U. Keller. Timing the release insequential double ionization. Nature Physics 7, 428 (2011).
[131] A. N. Pfeiffer, C. Cirelli, M. Smolarski & U. Keller. Recent attoclock measurements ofstrong field ionization. Chemical Physics 414, 84–91 (2013).
[132] J. S. Briggs & V. Schmidt. Differential cross sections for photo-double-ionization of thehelium atom. J. Phys. B: At., Mol. Opt. Phys. 33, R1 (2000).
[133] F. L. Yip, T. N. Rescigno, C. W. McCurdy & F. Martın. Fully differential single-photondouble ionization of neon and argon. Phys. Rev. Lett. 110, 173001 (2013).
[134] U. Becker & B. Langer. Correlation and coherence phenomena studied by photoelectronspectroscopy. Nucl. Instr. Meth. Phys. Res., Sect. A 601, 78–87 (2009).
[135] I. Martinson & L. Curtis. Janne Rydberg – his life and work. Nucl. Instr. Meth. Phys. Res.,
Sect. B 235, 17–22 (2005).
[136] R. D. Cowan. The theory of atomic structure and spectra (University of California Press,1981).
[137] J. E. Hansen & W. Persson. Revised analysis of singly ionized xenon, Xe II. Physica Scripta
36, 602 (1987).
[138] S. Alitalo et al. The valence photoelectron satellite spectra of Kr and Xe. J. Electron
Spectrosc. Relat. Phenom. 114-116, 141–146 (2001).
[139] H. Yoshii, T. Aoto, Y. Morioka & T. Hayaishi. Satellite structures of Kr and Xe studied byhigh-resolution threshold photoelectron spectroscopy. J. Phys. B: At., Mol. Opt. Phys.
40, 2765 (2007).
[140] W. Persson et al. Spectrum of doubly ionized xenon (Xe III). Physica Scripta 38, 347(1988).
[141] J. Soderstrom et al. Angle-resolved electron spectroscopy of the resonant Auger decay inxenon with meV energy resolution. New Journal of Physics 13, 073014 (2011).
[142] J. H. D. Eland. Dynamics of double photoionization in molecules and atoms. In S. A. Rice(ed.) Advances in Chemical Physics, vol. 141, 103–152 (John Wiley & Sons, Inc., 2009).
[143] J. Berkowitz, J. L. Dehmer, Y.-K. Kim & J. P. Desclaux. Valence shell excitationaccompanying photoionization in mercury. J. Chem. Phys. 61, 2556–2559 (1974).
[144] S. Svensson, B. Eriksson, N. Martensson, G. Wendin & U. Gelius. Electron shake-up andcorrelation satellites and continuum shake-off distributions in x-ray photoelectron spectra ofthe rare gas atoms. J. Electron Spectrosc. Relat. Phenom. 47, 327–384 (1988).
[145] F. H. Read. A modified rydberg formula. J. Phys. B: At., Mol. Phys. 10, 449 (1977).
[146] I. Martin et al. Quantum defect orbital study of electronic transitions in rydberg molecules:ammonium and fluoronium radicals. Chemical Physics 202, 307–320 (1996).
[147] N. Zheng & T. Wang. Radiative lifetimes and atomic transition probabilities for atomiccarbon and oxygen. The Astrophysical Journal Supplement Series 143, 231 (2002).

94 BIBLIOGRAPHY
[148] H. Kossmann, V. Schmidt & T. Andersen. Test of Wannier threshold laws:Double-photoionization cross section in helium. Phys. Rev. Lett. 60, 1266–1269 (1988).
[149] J.-E. Rubensson et al. Influence of the radiative decay on the cross section for doubleexcitations in helium. Phys. Rev. Lett. 83, 947–950 (1999).
[150] J. Berkowitz. Atomic and Molecular Photoabsorption: Absolute Total Cross Sections
(Academic Press, 2001). Pp. 95–96.
[151] J. Dubau & M. J. Seaton. Quantum defect theory. XIII. radiative transitions. J. Phys. B:
At., Mol. Opt. Phys. 17, 381 (1984).
[152] P. Bolognesi et al. A study of the doubly charged states of Xe and their satellites bythreshold photoelectron-threshold photoelectron coincidence (TPEsCO) spectroscopy. J.
Phys. B: At., Mol. Opt. Phys. 33, 4723–4734 (2000).
[153] O. Smirnova, V. S. Yakovlev & A. Scrinzi. Quantum coherence in the time-resolved augermeasurement. Phys. Rev. Lett. 91, 253001 (2003).
[154] A. S. Kheifets. Time delay in valence-shell photoionization of noble-gas atoms. Phys. Rev. A87, 063404 (2013).
[155] C. Neidel et al. Probing time-dependent molecular dipoles on the attosecond time scale.Phys. Rev. Lett. 111, 033001 (2013).
[156] C. Ott et al. Lorentz meets Fano in spectral line shapes: A universal phase and its lasercontrol. Science 340, 716–720 (2013).
[157] R. Ma et al. Photoelectron angular distributions for the two-photon ionization of helium byultrashort extreme ultraviolet free-electron laser pulses. J. Phys. B: At., Mol. Opt. Phys.
46, 164018 (2013).
[158] R. D. Mattuck. A guide to Feynman diagrams in the many-body problem
(McGraw-Hill, Inc., New York, 1976), second edn.
[159] H. W. Kroto, A. W. Allaf & S. P. Balm. C60: Buckminsterfullerene. Chemical Reviews
91, 1213–1235 (1991).
[160] S. W. Bishnoi et al. All-optical nanoscale pH meter. Nano Letters 6, 1687–1692 (2006).
[161] A. M. Schwartzberg & J. Z. Zhang. Novel optical properties and emerging applications ofmetal nanostructures. The Journal of Physical Chemistry C 112, 10323–10337 (2008).
[162] E. Ozbay. Plasmonics: Merging photonics and electronics at nanoscale dimensions. Science
311, 189–193 (2006).
[163] S. A. Maier et al. Plasmonics—a route to nanoscale optical devices. Advanced Materials
13, 1501–1505 (2001).
[164] B. v. Issendorff & O. Cheshnovsky. Metal to insulator transitions in clusters. Annu. Rev.
Phys. Chem. 56, 549–580 (2005).
[165] E. Marsell et al. Secondary electron imaging of nanostructures using extreme ultra-violetattosecond pulse trains and infra-red femtosecond pulses. Annalen der Physik 525, 162–170(2013).
[166] A. D. J. Haymet. Footballene: a theoretical prediction for the stable, truncated icosahedralmolecule C60. J. Am. Chem. Soc. 108, 319–321 (1986).
[167] M. E. Madjet, H. S. Chakraborty, J. M. Rost & S. T. Manson. Photoionization of C60: amodel study. J. Phys. B: At., Mol. Opt. Phys. 41, 105101 (2008).
[168] E. Maurat, P.-A. Hervieux & F. Lepine. Surface plasmon resonance in C60 revealed byphotoelectron imaging spectroscopy. J. Phys. B: At., Mol. Opt. Phys. 42, 165105 (2009).

BIBLIOGRAPHY 95
[169] A. V. Verkhovtsev, A. V. Korol & A. V. Solov’yov. Plasmon excitations in photo- andelectron impact ionization of fullerenes. Journal of Physics: Conference Series 438, 012011(2013).
[170] W. Ekardt. Size-dependent photoabsorption and photoemission of small metal particles.Phys. Rev. B 31, 6360–6370 (1985).
[171] G. F. Bertsch, A. Bulgac, D. Tomanek & Y. Wang. Collective plasmon excitations in C60
clusters. Phys. Rev. Lett. 67, 2690–2693 (1991).
[172] C. N. Banwell & E. M. McCash. Fundamentals of molecular spectroscopy (McGraw-Hill,1994), fourth edn.
[173] G. Kristensson. Elektromagnetisk vagutbredning [Electromagnetic wave propagation](Studentlitteratur, Lund, 1999).
[174] J. Andersen & E. Bonderup. Local field corrections for light absorption by fullerenes. Eur.
Phys. J. D 11, 435–448 (2000).
[175] I. V. Hertel et al. Giant plasmon excitation in free C60 and C70 molecules studied byphotoionization. Phys. Rev. Lett. 68, 784–787 (1992).
[176] S. W. J. Scully et al. Photoexcitation of a volume plasmon in c60 ions. Phys. Rev. Lett.
94, 065503 (2005).
[177] M. Shapiro & P. Brumer. Quantum control of bound and continuum state dynamics.Physics Reports 425, 195–264 (2006).
[178] E. Wells et al. Adaptive strong-field control of chemical dynamics guided bythree-dimensional momentum imaging. Nature Communications 4, 2895 (2013).
[179] V. V. Lozovoy et al. Control of molecular fragmentation using shaped femtosecond pulses.The Journal of Physical Chemistry A 112, 3789–3812 (2008).
[180] P. Ranitovic et al. Attosecond vacuum uv coherent control of molecular dynamics.Proceedings of the National Academy of Sciences 111, 912–917 (2014).
[181] R. H. Dalitz. Decay of τ mesons of known charge. Phys. Rev. 94, 1046–1051 (1954).
[182] K. Ueda & J. H. D. Eland. Molecular photodissociation studied by vuv and soft x-rayradiation. J. Phys. B: At., Mol. Opt. Phys. 38, S839 (2005).
[183] M. Schulz, D. Fischer, T. Ferger, R. Moshammer & J. Ullrich. Four-particle Dalitz plots tovisualize atomic break-up processes. J. Phys. B: At., Mol. Opt. Phys. 40, 3091 (2007).
[184] K. C. Prince, L. Avaldi, M. Coreno, R. Camilloni & M. de Simone. Vibrational structure ofcore to Rydberg state excitations of carbon dioxide and dinitrogen oxide. J. Phys. B: At.,
Mol. Opt. Phys. 32, 2551 (1999).
[185] G. Wight & C. Brion. K-shell energy loss spectra of 2.5 keV electrons in CO2 and N2O.J. Electron Spectrosc. Relat. Phenom. 3, 191–205 (1974).
[186] A. D. McLean. LCAO-MO-SCF ground state calculations on C2H2 and CO2. J. Chem.
Phys. 32, 1595–1597 (1960).
[187] K. Nobusada. A theoretical simulation of symmetry-resolved spectra for excitation to theC 1s−1 2πu Renner-Teller states in CO2. J. Phys. B: At., Mol. Opt. Phys. 35, 3055 (2002).
[188] R. Renner. Zur Theorie der Wechselwirkung zwischen Elektronen- und Kernbewegung beidreiatomigen, stabformigen Molekulen. Zeitschrift fur Physik 92, 172–193 (1934).
[189] J. Pople & H. Longuet-Higgins. Theory of the Renner effect in the NH2 radical. Molecular
Physics 1, 372–383 (1958).
[190] H. A. Jahn & E. Teller. Stability of polyatomic molecules in degenerate electronic states.I. Orbital degeneracy. Proc. R. Soc. London Ser. A 161, 220–235 (1937).

96 BIBLIOGRAPHY
[191] E. Kukk, J. D. Bozek & N. Berrah. Photoexcitation and Auger decay of the Renner-Tellersplit C 1s−1
π∗
u state in CO2. Phys. Rev. A 62, 032708 (2000).
[192] N. Saito et al. Deformation, nuclear motion and fragmentation of core-excited CO2 probedby multiple-ion coincidence momentum imaging. J. Electron Spectrosc. Relat. Phenom.
141, 183–193 (2004).
[193] J. Laksman, D. Ceolin, M. Gisselbrecht, S. E. Canton & S. L. Sorensen. Dynamics of protonmigration and dissociation in core-excited ethyne probed by multiple ion momentumimaging. J. Chem. Phys. 131, 244305 (2009).
[194] J. Laksman, D. Ceolin, M. Gisselbrecht & S. L. Sorensen. Nuclear motion in carbonyl sulfideinduced by resonant core electron excitation. J. Chem. Phys. 133, 144314 (2010).
[195] M. Eroms, M. Jungen & H.-D. Meyer. Vibronic coupling effects in resonant Auger spectra ofH2O. The Journal of Physical Chemistry A 116, 11140–11150 (2012).
[196] S. Zamith et al. The predissociation of highly excited states in acetylene by time-resolvedphotoelectron spectroscopy. J. Chem. Phys. 119, 3763–3773 (2003).
[197] Y. Jiang et al. Watching the acetylene vinylidene intramolecular reaction in real time.Preprint (2014). http://arxiv.org/abs/1402.4874.
[198] L. Avaldi et al. Photoionization of acetylene near the threshold. J. Electron Spectrosc.
Relat. Phenom. 71, 93–105 (1995).
[199] S. Canton. 40 eV photoelectron spectrum of C2H2. Private communication (2014).
[200] M. Carlsson Gothe et al. Vibrationally resolved study of the fourth photoelectron band ofacetylene at 23.5 eV. Chemical Physics Letters 174, 109–112 (1990).
[201] J. E. Reutt et al. Photoelectron spectroscopy and inferred femtosecond intramoleculardynamics of C2H
+2 and C2D
+2 . J. Chem. Phys. 84, 3022–3031 (1986).
[202] M. Davister & R. Locht. The dissociative ionization of C2H2 and C2D2. the [CH(CD)]+
dissociation channel. the H(D)C≡C(D)H binding energy. Chemical Physics 191, 333–346(1995).
[203] C. Servais & R. Locht. The appearance energy of C2H+ from C2H2 revisited. Aphotoion–photoelectron coincidence spectroscopic determination. Chemical Physics Letters
236, 96–102 (1995).
[204] R. Locht & M. Davister. The dissociative ionization of C2H2. The C+, C+2 and CH+
2
dissociation channels. The vinylidene ion as a transient? Chemical Physics 195, 443–456(1995).
[205] S. Boye-Peronne, D. Gauyacq & J. Lievin. Vinylidene-acetylene cation isomerizationinvestigated by large scale ab initio calculations. J. Chem. Phys. 124, 214305 (2006).
[206] G. Chambaud, R. V. den Boom & P. Rosmus. On the mechanism of the energyredistribution in the A 2Ag(2Σ
+g ) state of the HCCH+ ion. Chem. Phys. Lett. 247, 79–84
(1995).
[207] P. Rosmus, P. Botchwina & J. Maier. On the ionic states of vinylidene and acetylene.Chemical Physics Letters 84, 71–76 (1981).
[208] S.-K. Shih, S. D. Peyerimhoff & R. J. Buenker. Calculated potential surfaces for thedescription of the emission spectrum of the C2H radical. Journal of Molecular Spectroscopy
74, 124–135 (1979).
[209] W. Koch & G. Frenking. The low-lying electronic states of protonated C2, CCH+. J. Chem.
Phys. 93, 8021–8028 (1990).
[210] R. C. Gillen, B. Ostojic & W. Domcke. Theoretical investigation of A 2Σ+g –X 2Πu
vibronic-coupling and ultrafast internal-conversion dynamics in the acetylene cation.Chemical Physics 272, 1–14 (2001).
BIBLIOGRAPHY 97
[211] M. E.-A. Madjet, O. Vendrell & R. Santra. Ultrafast dynamics of photoionized acetylene.Phys. Rev. Lett. 107, 263002 (2011).
[212] M. E.-A. Madjet, Z. Li & O. Vendrell. Ultrafast hydrogen migration in acetylene cationdriven by non-adiabatic effects. J. Chem. Phys. 138, 094311 (2013).
[213] M. Davister & R. Locht. The dissociative electroionization of C2H2, C2D2 and C2HD:Investigation of the [C2H(D)]+ and [H(D)]+ dissociation channels.the (D)H–C2:H(D)binding energy. Chemical Physics 189, 805–824 (1994).
[214] R. Mackie et al. A photoionization mass spectrometric study of acetylene and ethylene inthe VUV spectral region. Int. J. Mass Spectrom. 223–224, 67–79 (2003).
[215] D. Holland, M. MacDonald, M. Hayes, L. Karlsson & B. Wannberg. A photoelectronspectroscopy study of the valence shell photoionization dynamics of acetylene. J. Electron
Spectrosc. Relat. Phenom. 104, 245–255 (1999).
[216] S. Banerjee & G. Gangopadhyay. Quantum beat in the pump–probe signal of a molecularsystem. J. Phys. B: At., Mol. Opt. Phys. 36, 2967 (2003).
[217] H. Ibrahim et al. Tabletop imaging of structural evolutions in chemical reactions. Preprint
(2014). http://arxiv.org/abs/1402.1419.
[218] B. Walker et al. Precision measurement of strong field double ionization of helium. Phys.
Rev. Lett. 73, 1227–1230 (1994).
[219] M. Kurka et al. Two-photon double ionization of Ne by free-electron laser radiation: akinematically complete experiment. J. Phys. B: At., Mol. Opt. Phys. 42, 141002 (2009).
[220] J. Feist et al. Electron correlation in two-photon double ionization of helium fromattosecond to XFEL pulses. J. Phys. B: At., Mol. Opt. Phys. 42, 134014 (2009).
[221] E. J. Takahashi, P. Lan, O. D. Mucke, Y. Nabekawa & K. Midorikawa. Attosecond nonlinearoptics using gigawatt-scale isolated attosecond pulses. Nature Communications 4, 2691(2013).
[222] J. M. Anna, G. D. Scholes & R. van Grondelle. A little coherence in photosynthetic lightharvesting. BioScience 64, 14–25 (2014).
[223] R. E. Blankenship et al. Comparing photosynthetic and photovoltaic efficiencies andrecognizing the potential for improvement. Science 332, 805–809 (2011).
[224] I. Thomann et al. Temporal characterization of attosecond wave forms in thesub-optical-cycle regime. Phys. Rev. A 78, 011806 (2008).
[225] W. Cao et al. Dynamic modification of the fragmentation of autoionizing states of O+2 .
Phys. Rev. A 84, 053406 (2011).
[226] X. Zhou et al. Probing and controlling non-Born–Oppenheimer dynamics in highly excitedmolecular ions. Nature Physics 8, 232–237 (2012).
[227] N. M. Martin. Surface Studies of Model Systems relevant for Pd and Ag Catalysts.Ph.D. thesis, Lund University (2014).
[228] M. Hjort. III–V Nanowire Surfaces. Ph.D. thesis, Lund University (2014).
