uncertainty propagation analysis for low power transients
TRANSCRIPT
Master of Science Thesis
__________________________________________________________________
Uncertainty Propagation Analysis for Low Power Transients at
the Oskarshamn 3 BWR
______________________________________________________________________________
Ante Hultgren
Division of Nuclear Reactor Technology
Royal Institute of Technology
Stockholm, Sweden, June 2014
TRITA-FYS 2014:37 ISSN 0280-316X ISRN KTH/FYS/--14:37—SE

II
III
ABSTRACT
In present transient safety calculations it is assumed that the limiting initial operational
conditions are along the upper boundary of the boiling water reactor operational map. These
analyses use conservative input values for chosen parameters based on single parameter
sensitivity studies. This excludes possible parameter combination effects and makes it difficult to
find threshold effects that may exist. This work has been dedicated toward investigating whether
the upper boundary of the boiling water reactor operational map (for the Oskarshamn 3 reactor)
is the most limiting for pressure increase transients. At the same time the conservative approach
was validated using a new best estimate methodology developed by Westinghouse.
The results of the study shows that the current conservative methodology does not capture
enough conservatism for a pressure increase transient at 6500 kg/s core flow and 100.5% power,
and that there is a threshold effect just below the upper boundary of the operational map not
previously known of that occurs when the safety systems are able to mitigate the initial power
increase. The upper boundary of the operational map still seems to be the most limiting, even
though the threshold exists. The results also show that the order statistics method with the second
estimator grade can be used for future safety calculations if the best estimate methodology is
employed. This saves computational time and also allows a larger amount of Boolean variable
combinations (that cannot be used as input for the calculations) to be tested.
Keywords: Boiling Water Reactors, Best Estimate Methodology, Reduced Power, BISON,
Pressure Increase Transient.

IV

V
ACKNOWLEDGEMENTS AND AUTHORS COMMENTS
I would like to thank the SET department at Westinghouse that presented me with the
opportunity to do my Master Thesis with them. It was a swell time and I learned so much being
at the company. Thanks to Erik and Jakob for help with cm2 (as well as other things). Thanks to
Johan, Carl, and Marielle for extra help with BISON, which saved so much time. Big thanks to
my supervisor Kjell, and also my “extra” supervisor Andrea who both helped guide me through
the project. Also a big thanks to Björn who answered all my, at times, completely intelligence
free questions about various things. Thanks to my sister Annie and Johan who read and
commented on the report without actually being involved in the project. If I forgot someone at
the department, I am grateful for all the help I got.
I finally want to thank Forsmarks Kraftgrupp AB for the giving me the possibility to read and
cite several reports that were invaluable to this work.

VI
VII
TABLE OF CONTENTS
1. INTRODUCTION .................................................................................................................. 1
1.1. Introduction to Boiling Water Reactor Technology ......................................................... 1
1.2. Background ...................................................................................................................... 2
1.3. Objective .......................................................................................................................... 4
1.4. Scope ................................................................................................................................ 4
2. BEST ESTIMATE METHODOLOGY .................................................................................. 5
2.1. Application Envelope ........................................................................................................ 5
2.2. Phenomenon Identification Ranking Table .................................................................... 11
2.3. Code Capability Assessment .......................................................................................... 12
2.3.1. POLCA7 ................................................................................................................. 13
2.3.2. BISON..................................................................................................................... 15
2.4. Data Uncertainty Assessment......................................................................................... 15
2.5. Single Failures and Non-credited Operational Systems ................................................. 18
3. POST PROCESSING ........................................................................................................... 21
3.1. Normal Statistics With Error .......................................................................................... 21
3.2. Order Statistics Method .................................................................................................. 22
3.3. Least Square Linear Fitting ............................................................................................ 24
4. RESULTS ............................................................................................................................. 27
4.1. General Transient ........................................................................................................... 27
4.2. CPR Results ................................................................................................................... 36
4.3. Order Statistics Method .................................................................................................. 40
4.4. Least Squared Fitting ..................................................................................................... 40
5. DISCUSSION ....................................................................................................................... 41
6. CONCLUSION ..................................................................................................................... 47
BIBLIOGRAPHY ......................................................................................................................... 49

VIII
IX
ABBREVIATIONS
Abbreviation Explanation
AD Anderson-Darling (normal statistics test)
AOO Anticipated operational occurrence
APRM Average Power Range Monitor
BASH Bourne Again SHell, a Linux scripting code
BE Best Estimate
BOC Beginning Of Cycle
BWR Boiling Water Reactor
CCA Code Capability Assessment
CPR Critical Power Ratio
ΔCPR difference between ICPR and minCPR
DUA Data Uncertainty Assessment
DRV Bypass Control Valve, regulating pressure in the reactor
EOFC End Of Fuel Cycle
EFPH Effective Full Power Hours (running the reactor 1 hour at full
power is 1 EFPH, running the reactor 1 hour at 50% power is 0.5
EFPH)
ER Power regulated (“effektreglering” in Swedish)
FPOC Full Power Operational Core
HPCV High pressure control valves
HPSV High pressure stop valves
ICPR Initial CPR of the transient
LPOC Low Power Operational Core
minCPR the lowest value of CPR during a transient
MOC Middle Of Cycle
MWt Megawatts thermal power
O3 The Oskarshamn 3 Reactor
OKG Oskarshamns Kraftgrupp

X
OLMCPR Operation Limit Minimum CPR
OSM Order Statistics Method
PI Pressure Increase
PIRT Phenomenon Identification Ranking Table
PSS Partial scram
PULS Power Uprate with Licensed Safety
SS “SnabbStopp”, Swedish for scram
SS5 Scram signal occurring at high pressure
SS12 Scram signal occurring at high neutron flux
SS13 Scram signal occurring at filtered high neutron flux vs core flow
SS14 Scram signal occurring at high core flow vs. neutron flux
TVO Teollisuuden Voima (A Finnish nuclear power technology
company)
Upper line The upper boundary line of the operational map, seen in red in
Figure 2.
VR Pump rpm regulation (“VarvtalsReglering” in Swedish)

1 INTRODUCTION
1. INTRODUCTION
This report has been written with the target group of nuclear engineers. A basic understanding of
thermal hydraulics, reactor technology and reactor safety is assumed; however an effort has been
made to explain crucial concepts and making this report understandable for the common
engineer.
1.1. Introduction to Boiling Water Reactor Technology
A Boiling Water Reactor (BWR) uses nuclear fission in order to heat up and boil water. The
steam can then be used to create electricity using a generator connected to a turbine. As a closed
loop is used, a condenser condenses the steam from the turbine and sends the water back to the
reactor core where it is boiled again. A very basic schematic of a BWR can be seen in Figure 1.
Figure 1: Schematic of a BWR. [1]
Nuclear fission is a great source of energy; however a nuclear reactor must be controlled
properly in order to avoid devastating accidents; which has happened throughout the nuclear
history; the most well-known and severe accidents being in Three Mile Island (1979), Chernobyl
(1986), and Fukushima (2011). Nuclear fission is caused by neutrons interacting with a U235
nucleus, splitting it into new atoms and neutrons while also producing heat. If the created
neutrons in the reactor core are enough to cause a chain reaction (in essence as many neutrons
are produced as neutrons lost), the reactor is said to be critical, which is the desired steady state
condition for long term reactor operation. As the amount of neutrons is directly proportional to
the power of the reactor, controlling the neutron population is of primary importance for reactor
safety.
2 INTRODUCTION
In a BWR the neutron population is mainly controlled using control rods and by altering the
moderator proportion (light water) in the core using the main recirculation pumps. Control rods
consist of neutron absorbing materials which reduce the amount of neutrons if inserted. By
injecting and withdrawing the control rods (injected from below in a BWR), the power level can
be controlled. When a quick reactor shutdown is desired, all control rods are quickly inserted
(with a timescale of seconds). This is called a scram.
Increasing the main recirculation pump speed will increase the moderator proportion in the core
which (in a under moderated reactor, which is the case for Swedish BWR’s) will allow better
moderation of the neutrons and decrease the neutron speed. This will enable an increased amount
of neutrons to cause fission, hence increasing the power. BWR reactors have a negative void
feedback; hence reducing the pump speed and thereby increasing the amount of void (steam) in
the core will reduce the amount of neutrons that will cause fission, and thereby reduce the power.
This acts as a self-regulating system, as increasing the power will create more void which will
reduce the power. This feedback will however be problematic for pressure increase transients
(which will be analyzed in this paper, more explained later) as increasing the pressure will
decrease the void due to an increasing saturation temperature, henceforth increasing the power.
More about reactor technology can be found in [1].
1.2. Background
In the present safety calculation methodology, best estimate (BE) codes coupled with
conservative input data are used, which may lead to overly conservative results but may also not
capture all unfavorably possible combinations of input parameters. The present methodology
mainly calculates along the upper boundary of the operational map (not always, but exclusively
for the transient that was chosen for this work) as it is argued that this will yield limiting results,
shown as the red line in Figure 2. This will be referred to as the “upper line” in the remaining
parts of the report.
3 INTRODUCTION
Figure 2: Operational map for the Oskarshamn 3 reactor. The red line is where the
majority of the current safety analyses are performed. Black lines are scram initiation
lines, both for partial scram and full scram. [2]
Analyzing initial operational conditions (or operational points) inside the operational map is of
interest in two aspects. Firstly there are no legal limitations on running inside the operational
map, even though limited analyses have been performed for transients initiating from these
operational points [3]. Secondly there is a possibility that future operation of Swedish plants may
not be primarily along the upper line. The main reason reactors almost exclusively run at the
maximum allowed power (used as base load power) is due to investment costs being extremely
high (in the order of billions of Euros) and the fuel costs being relatively low, making this type
of operation the most economically feasible. For future applications in Sweden, with political
decisions turning toward the renewable energy sources, hydropower may not be enough to
regulate the energy grid with an increasing amount of wind and solar power being built. This will
require the nuclear plants to regulate the grid to the extent possible. This has been performed in
the 1980s and 1990s in Sweden (running at lower power during weekends and nights) and may
again be used in the near future. It should be noted that this is currently done in countries such as
France where the nuclear proportion of energy production is higher than in Sweden. More on this
can be read in an investigation ordered by the Swedish government which is cited for this
paragraph. [4]
SS12
SS14
SS13
PSS
Upper line

4 INTRODUCTION
If the system response would be physical and purely continuous the highest initial power would
most likely be the limiting initial operating point. However; the system behavior is highly
dependent on scram conditions (which will have a Boolean effect on the system), illustrated as
the black lines in Figure 2. For example, when the neutron flux rises above certain set points the
safety systems responds by inserting control rods and lowering the main circulation pump speed,
as well as various other measures depending on what scram conditions that are triggered. When
the initial power is lower, the power increase can persist longer before a scram is initiated, which
may possibly give unfavorable transient behavior even though the initial conditions seem more
favorable.
Analyzing cases when the operational point is not along the upper line presents new challenges.
Knowing what a conservative value for a parameter at different operational points is not trivial,
and may vary. One example is the delay of the opening of the bypass control valves, where at
9259 kg/s core flow a long opening time will be conservative while at 12000 kg/s core flow a
short opening time is conservative. This is due to discontinuities for when a scram is initiated
during the transient and how the system responds at different time periods in the transient. This
parameter demonstrates the challenge of determining conservative values at different operational
conditions. Due to the large number of cases that was to be analyzed in this work, it was decided
that a conservative study would be too time consuming due to the large amount of sensitivity
studies required. The analysis was instead performed using a novel BE methodology developed
by Westinghouse. The methodology uses random input variables, calculating a span of results
which can then be analyzed with statistics and linear algebra. This will be one of the first trial
runs for this methodology at full plant scale analysis. A previous test has been performed in [5];
however it is unclear how all steps were performed in that report. [6]
1.3. Objective
The first objective of this paper is to investigate if the upper line of the operational map (red line
in Figure 2) is the most limiting for transient safety analysis. Since a new methodology is used,
the objective will also be to test and investigate the strengths and weaknesses of the methodology
and to see what needs to be done to optimize the methodology implementation. Using BE
methodology the present conservative methodology will be evaluated to determine whether it
captures all the conservatism needed, or if it is too conservative.
1.4. Scope
The scope of this project was to keep within the limitations of the code used, as well as the
timescale of the project. To keep the focus on the main objectives, several steps that could have
been made, e.g. adding a single failure to the calculations (more is written throughout the report),
were excluded in order to not remove quality from the important parts of the work. The details of
the limitations in this work are discussed throughout the report.

5 BEST ESTIMATE METHODOLOGY
2. BEST ESTIMATE METHODOLOGY
For this project a newly developed Westinghouse BE methodology was used. This is a six step
process consisting of defining an application envelope, performing a phenomenon and
identification ranking table (PIRT), performing a code capability assessment (CCA), finding
parameter uncertainties from a data uncertainty assessment (DUA), combining the input
parameters with single failures and non-credited operational systems for the calculation model,
and finally analyzing the results.
2.1. Application Envelope
In the application envelope it is decided what type of reactor to analyze, what event that is to be
simulated, and what requirements and acceptance criteria that are stated from the regulator.
For this analysis the reactor chosen was Oskarshamn 3 (O3); mainly due to the Westinghouse O3
reactor model at the present time being well updated and validated. The Oskarshamn 3 reactor is
a Generation 5 BWR built by ASEA Atom started in 1985. At present it has a nominal full
thermal power of 3900 MWt which corresponds to 129.1% power due to recent power up rates in
the Power Uprate with Licensed Safety (PULS) project (100% being 3020 MWt). Investigations
of low power transients have also previously been written where the three Forsmark reactors
have been analyzed; see [7] and [8]. Investigating these reactors again seemed unnecessary.
These analyses have used the conservative methodology, and have not investigated areas far
from the upper line in the operational map, making this work unique. [9]
Transients at low power can occur at several initial plant conditions, shown in Figure 3. Reactor
startup and shutdown (states 1 and 4 in Figure 3) have both been analyzed in previous studies at
Grand Gulf, Forsmark, and Teollisuuden Voima (TVO). The TVO report was cited in [10] but
could not be attained. In order to do this type of analysis specific plant history data must be
possessed, which was not obtainable [10] [11]. For the same reason planned long-time low
power (state 6) operation was excluded, requiring control rod pattern histories which were not
obtainable (if they exist at present, which is doubtable) [8]. Shutdown conditions (state 5)
include a detached reactor head, which the codes at Westinghouse are not able to simulate. This
was outside the frame of this work, which excluded this initial plant condition as well. State 5
has also been analyzed in [10] and [11].
Plant states where the reactor power is reduced from full power (states 2 and 3) are possible to
analyze following methodology papers presented by Forsmark, [12] [13]. The core conditions are
calculated as for full power using the POLCA7 code (explained more in section 2.3.1). As the
Xenon equilibrium value was calculated for the new operational point in this work the transients
analyzed in this work can be said to be for the plant state 3 in Figure 3, hence from 1 day to
about 3 weeks after power reduction from full power. In [12] it is stated that for transients at

6 BEST ESTIMATE METHODOLOGY
reduced power an extra conservatism in the result must be added; in this case 0.02 must be added
to the operation limit minimum critical power ratio (OLMCPR). The meaning of OLMCPR will
be further explained at the end of this section. [12] [13]
Figure 3: Different types of plant states at reduced power. Graph showing power vs.
operational time.
From the selected type of plant state the initial operational points for the work was chosen. These
can be seen in Table 1 and Figure 5. Here BOC stands for Beginning Of Cycle, MOC for Middle
Of Cycle, and EOFC for End Of Fuel Cycle. These different cycle times depend on how long the
reactor has been operated since the refueling of the core. This is measured in effective full power
hours (EFPH), which is a measurement stating how many hours equivalent to full power the
reactor has been operated. For example a reactor run at 50% power for 8 hours will be equivalent
to 4 EFPH, and running at 100% for 2 hours is equivalent to 2 EFPH. The methodology from
[12] [13] is valid up to 500 EFPH after power reduction. Approximate differences between the
axial power profiles of MOC and EOFC can be seen in Figure 4. It can be seen that the axial
power profile has a more unfavorable shape in EOFC as it will take a longer time before the
control rods (being inserted from below) have a considerable shutdown effect on the core power.
1
2 3
4
5
Pow
er
Operation time
6
1. Reactor startup
2. Power reduction from full
power
3. Long time after power
reduction (from 1 day up to
3 weeks)
4. Power reduction for
shutdown
5. Shutdown condition
(without head)
6. Planned long-time
operation at low power
7 BEST ESTIMATE METHODOLOGY
Figure 4: Graph showing roughly how the axial power profile varies in the beginning of the
fuel cycle compared to the end of fuel cycle.
Figure 5: Chosen initial operational conditions to be analyzed.
8 BEST ESTIMATE METHODOLOGY
Table 1: Initial operational points for the simulations.
Nm Cycle type Condition name
(EFPH_Power_Flow)
Power [%] Flow [kg/s]
1 BOC 0_1005_6500 100.5 6500
2 BOC 0_800_6500 80 6500
3 BOC 0_650_6500 65 6500
4 BOC 0_1076_7875 107.6 7875
5 BOC 0_800_7875 80 7875
6 BOC 0_650_7875 65 7875
7 BOC 0_1148_9250 114.8 9250
8 BOC 0_1000_9250 100 9250
9 BOC 0_800_9250 80 9250
10 BOC 0_650_9250 65 9250
11 BOC 0_1219_10625 121.9 10625
12 BOC 0_1000_10625 100 10625
13 BOC 0_800_10625 80 10625
14 BOC 0_650_10625 65 10625
15 MOC 5500_1291_12000 129.1 12000
16 MOC 5500_1150_12000 115 12000
17 MOC 5500_1000_12000 100 12000
18 MOC 5500_800_12000 80 12000
19 MOC 5500_650_12000 65 12000
20 MOC 5500_1291_13100 129.1 13100
21 MOC 5500_1150_13100 115 13100
22 MOC 5500_1000_13100 100 13100
23 MOC 5500_800_13100 80 13100
24 MOC 5500_650_13100 65 13100
25 EOFC 10000_1291_14500 129.1 14500
26 EOFC 10000_1150_14500 115 14500
27 EOFC 10000_1000_14500 100 14500
28 EOFC 10000_800_14500 80 14500
29 EOFC 10000_650_14500 65 14500
The transient event chosen to analyze was a pressure increase (PI) transient: turbine trip with a
malfunction in one bypass control valve (a valve that when opened relocates steam going to the
turbine directly into the condenser). This has previously been found to be the most limiting H2
transient (see Table 2 for the Swedish H transient ranking table) for both full power operation
analyses performed at Westinghouse and for cycle specific analysis (an analysis made
specifically for some part during the entire fuel cycle in the reactor; typically done for the weeks
at the initial and final times of the operating time) performed at Oskarshamns Kraftgrupp (OKG)
for the O3 safety analysis report (SAR). [14] [15]
9 BEST ESTIMATE METHODOLOGY
Table 2: Classification of events. [15] [16]
Rank of
initial event
Frequency Acceptance criteria
H1 Planned operation All operational parameters should
have systems that monitor possible
deviations
Automatic systems shall be able to
resolve a deviation from normal
operation
H2 F ≥ 10-2
Expected to occur during the
reactor lifetime
May not lead to a more serious
condition
No melting in any part of the fuel,
maximum 0.1% of the fuel may be in
dryout
H3 10-2
> F ≥ 10-4
Expected to occur at one out of
many plants during the reactor
lifetime
May not lead to any more serious
condition
Maximum 1% of the fuel may be
damaged, but may not exceed 1204°C
Max temperature of cladding in other
parts of the fuel may not exceed
700°C, 650°C in more than 10 s, and
600°C in more than 100s
H4 10-4
> F ≥ 10-6
Events not expected to occur
for any out of several plants
during a reactor lifetime
Not of importance to this work
H5 Very unlikely Not of importance to this work
The acceptance criterion relevant for this analysis, stated by SSM for H2 accidents, is that no
melting of the fuel or cladding is allowed. This translated into thermal hydraulic terms give the
acceptance criteria that minCPR may not decrease below 1.101 (not unity due to uncertainties in
the system) [17]. This value is core specific, and differs for different reactors (the core used only
includes the ). CPR is the critical power ratio, defined as
(2.1.1)
where Qdryout is the power needed for dryout to occur, and Qactual is the power present in the fuel
channel (a specifically chosen channel in the reactor to use for calculation). Dryout occurs at a
10 BEST ESTIMATE METHODOLOGY
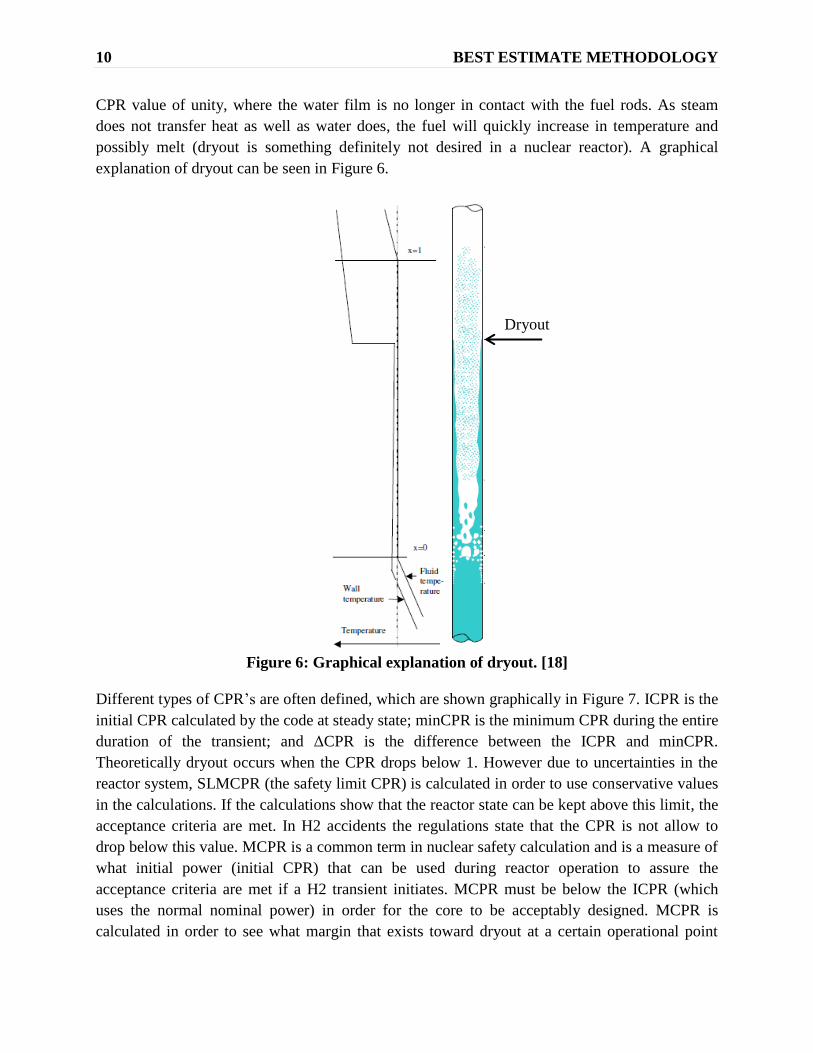
CPR value of unity, where the water film is no longer in contact with the fuel rods. As steam
does not transfer heat as well as water does, the fuel will quickly increase in temperature and
possibly melt (dryout is something definitely not desired in a nuclear reactor). A graphical
explanation of dryout can be seen in Figure 6.
Figure 6: Graphical explanation of dryout. [18]
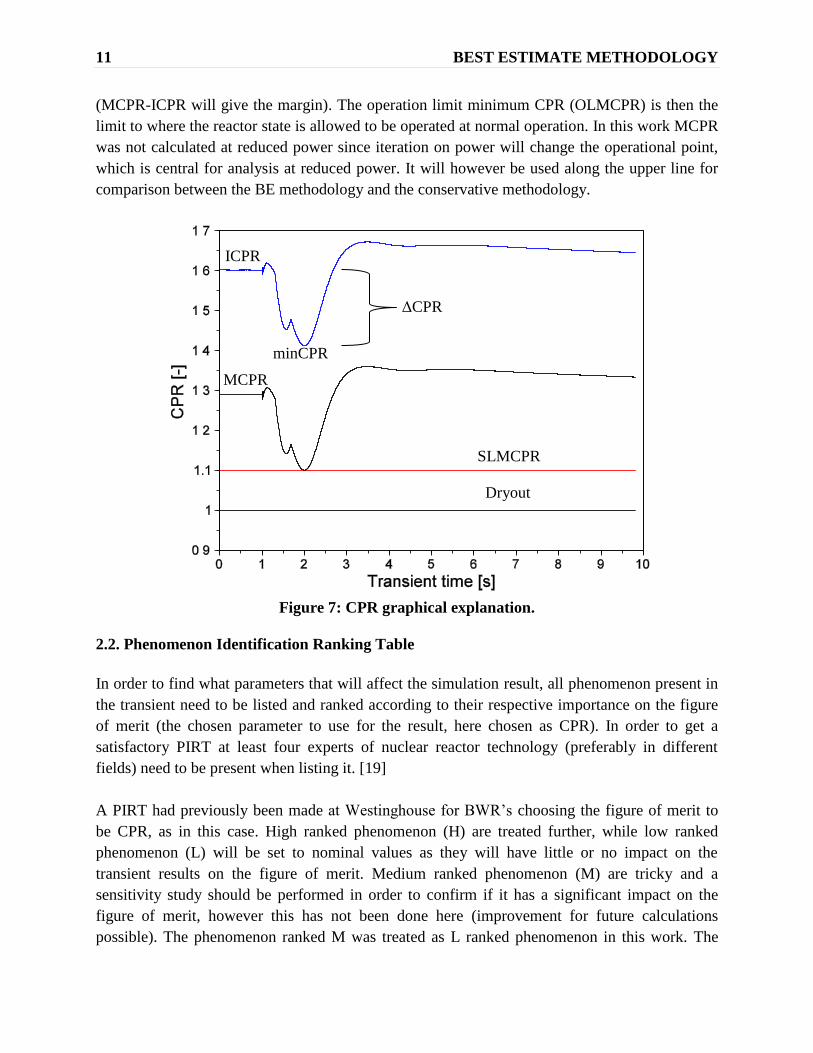
Different types of CPR’s are often defined, which are shown graphically in Figure 7. ICPR is the
initial CPR calculated by the code at steady state; minCPR is the minimum CPR during the entire
duration of the transient; and ΔCPR is the difference between the ICPR and minCPR.
Theoretically dryout occurs when the CPR drops below 1. However due to uncertainties in the
reactor system, SLMCPR (the safety limit CPR) is calculated in order to use conservative values
in the calculations. If the calculations show that the reactor state can be kept above this limit, the
acceptance criteria are met. In H2 accidents the regulations state that the CPR is not allow to
drop below this value. MCPR is a common term in nuclear safety calculation and is a measure of
what initial power (initial CPR) that can be used during reactor operation to assure the
acceptance criteria are met if a H2 transient initiates. MCPR must be below the ICPR (which
uses the normal nominal power) in order for the core to be acceptably designed. MCPR is
calculated in order to see what margin that exists toward dryout at a certain operational point
Dryout
11 BEST ESTIMATE METHODOLOGY
(MCPR-ICPR will give the margin). The operation limit minimum CPR (OLMCPR) is then the
limit to where the reactor state is allowed to be operated at normal operation. In this work MCPR
was not calculated at reduced power since iteration on power will change the operational point,
which is central for analysis at reduced power. It will however be used along the upper line for
comparison between the BE methodology and the conservative methodology.
Figure 7: CPR graphical explanation.
2.2. Phenomenon Identification Ranking Table
In order to find what parameters that will affect the simulation result, all phenomenon present in
the transient need to be listed and ranked according to their respective importance on the figure
of merit (the chosen parameter to use for the result, here chosen as CPR). In order to get a
satisfactory PIRT at least four experts of nuclear reactor technology (preferably in different
fields) need to be present when listing it. [19]
A PIRT had previously been made at Westinghouse for BWR’s choosing the figure of merit to
be CPR, as in this case. High ranked phenomenon (H) are treated further, while low ranked
phenomenon (L) will be set to nominal values as they will have little or no impact on the
transient results on the figure of merit. Medium ranked phenomenon (M) are tricky and a
sensitivity study should be performed in order to confirm if it has a significant impact on the
figure of merit, however this has not been done here (improvement for future calculations
possible). The phenomenon ranked M was treated as L ranked phenomenon in this work. The
ΔCPR
ICPR
MCPR
SLMCPR
Dryout
minCPR
12 BEST ESTIMATE METHODOLOGY
PIRT is proprietary information, an example of how a parameter is ranked is shown in Table 3
[19]
Table 3: Example of a parameter in the PIRT Table for a BWR. [19]
ID Category Phenomenon/Plant
Component
PI Rationale
A1 A. Initial
conditions
Cladding oxidation H/M/L May affect heat transfer between fuel
and coolant.
2.3. Code Capability Assessment
When the dominant phenomenon has been selected, a code capability assessment is done in order
to see how well the chosen code simulates the dominant phenomenon selected from the PIRT.
For each phenomenon, data is used for analysis of the phenomenon and ranked according to
sufficiency (how much data there is) and relevancy (if the data is from separate effect tests,
integral effect tests, from other codes, or from analytical cases). Relevancy is ranked according
to what type of data that exists; where the most common are [19]:
Separate effect tests: Separate effect tests are when an experiment is designed
specifically for a certain phenomenon, for example a test can be made finding an
insertion time of control rods vs. pressure in the reactor, keeping all other parameters
constant. This type of test is the preferred test for the CCA, and ranks H (high) in the
relevancy category.
Integral effect tests: integral effect tests are used when phenomenon cannot be isolated.
For example in post-dryout tests several correlations are intertwined (rewet, heat
temperature coefficient, dryout location). Ranks M (medium) in the relevancy category.
Code comparison: If no experiments are available, code comparison can be used. Often
computational fluid dynamics (CFD) codes are used in order to tune correlations used in
fast transient codes such as BISON (or for example TRACE and APROS). An example
of this can be found in [20], where the mixture multiplier of water is calculated for the
transient code POLCA-T using the Computational Fluid dynamics code OPENFOAM.
Depending on how well the simplified model is able to perform compared to the more
advanced model a conclusion can be drawn on how well the simplified code is able to
model the desired phenomenon. Rank will be depending on previous knowledge of the
code used as a reference.
Analytic comparison: Analytical cases can also be used, where the code results are
compared to calculations performed by hand. This can naturally only be used in a limited
amount of steady state cases, but is cheap and efficient when possible. Rank will be
chosen on a case to case basis, but usually not over M (medium).
13 BEST ESTIMATE METHODOLOGY
Sufficiency is ranked according to the amount of data, where more than 20 measurement points
qualifies as high, between 10 and 20 is medium, and below 10 is low. These numbers are taken
directly from [19]. In the CCA low ranked phenomenon will use conservative values in the
calculations, while for high or medium ranked phenomenon a distribution will be used. For this
analysis the transient code BISON (using collapsed cores from POLCA7) was selected for the
CCA. Since validation data for the code is scarce and difficult to acquire, the major part of the
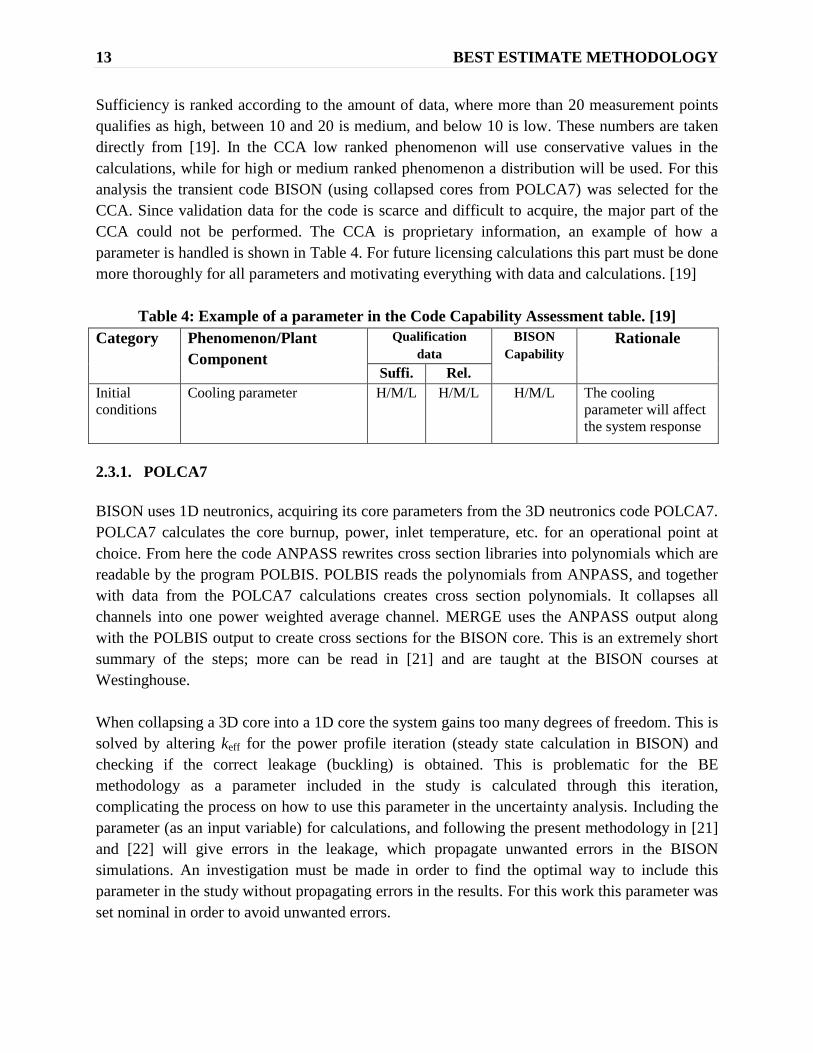
CCA could not be performed. The CCA is proprietary information, an example of how a
parameter is handled is shown in Table 4. For future licensing calculations this part must be done
more thoroughly for all parameters and motivating everything with data and calculations. [19]
Table 4: Example of a parameter in the Code Capability Assessment table. [19]
Category Phenomenon/Plant
Component
Qualification
data
BISON
Capability
Rationale
Suffi. Rel.
Initial
conditions
Cooling parameter H/M/L H/M/L H/M/L The cooling
parameter will affect
the system response
2.3.1. POLCA7
BISON uses 1D neutronics, acquiring its core parameters from the 3D neutronics code POLCA7.
POLCA7 calculates the core burnup, power, inlet temperature, etc. for an operational point at
choice. From here the code ANPASS rewrites cross section libraries into polynomials which are
readable by the program POLBIS. POLBIS reads the polynomials from ANPASS, and together
with data from the POLCA7 calculations creates cross section polynomials. It collapses all
channels into one power weighted average channel. MERGE uses the ANPASS output along
with the POLBIS output to create cross sections for the BISON core. This is an extremely short
summary of the steps; more can be read in [21] and are taught at the BISON courses at
Westinghouse.
When collapsing a 3D core into a 1D core the system gains too many degrees of freedom. This is
solved by altering keff for the power profile iteration (steady state calculation in BISON) and
checking if the correct leakage (buckling) is obtained. This is problematic for the BE
methodology as a parameter included in the study is calculated through this iteration,
complicating the process on how to use this parameter in the uncertainty analysis. Including the
parameter (as an input variable) for calculations, and following the present methodology in [21]
and [22] will give errors in the leakage, which propagate unwanted errors in the BISON
simulations. An investigation must be made in order to find the optimal way to include this
parameter in the study without propagating errors in the results. For this work this parameter was
set nominal in order to avoid unwanted errors.
14 BEST ESTIMATE METHODOLOGY
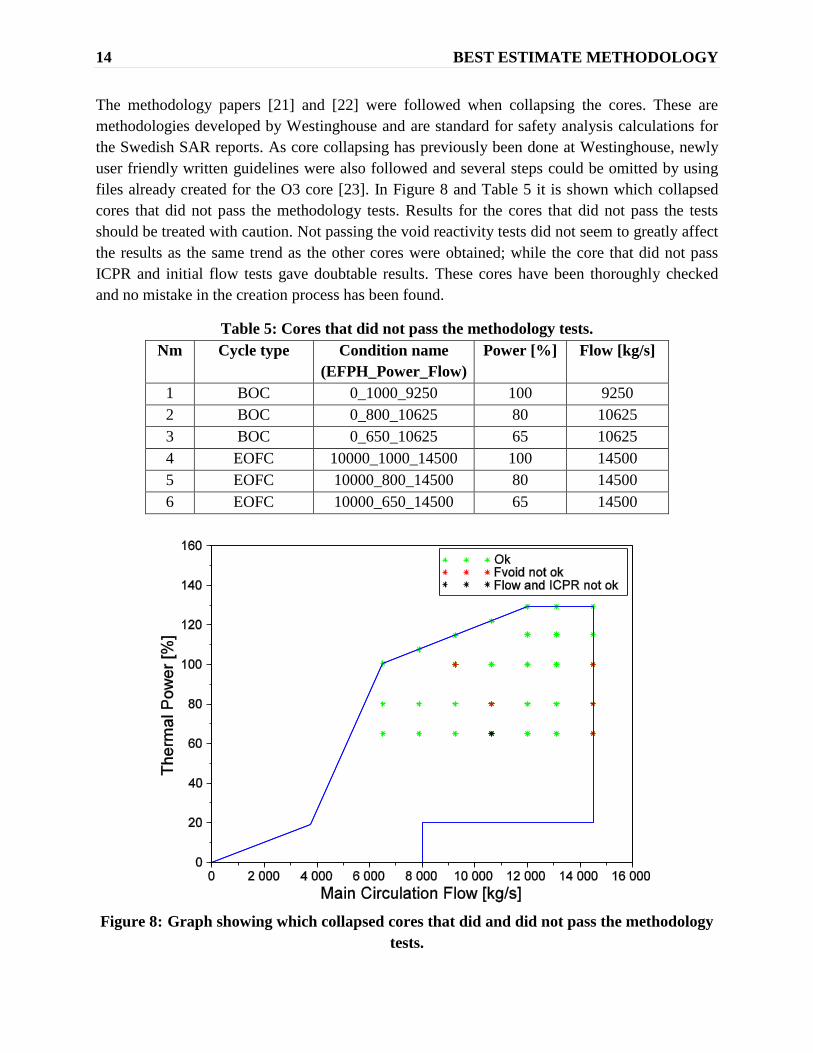
The methodology papers [21] and [22] were followed when collapsing the cores. These are
methodologies developed by Westinghouse and are standard for safety analysis calculations for
the Swedish SAR reports. As core collapsing has previously been done at Westinghouse, newly
user friendly written guidelines were also followed and several steps could be omitted by using
files already created for the O3 core [23]. In Figure 8 and Table 5 it is shown which collapsed
cores that did not pass the methodology tests. Results for the cores that did not pass the tests
should be treated with caution. Not passing the void reactivity tests did not seem to greatly affect
the results as the same trend as the other cores were obtained; while the core that did not pass
ICPR and initial flow tests gave doubtable results. These cores have been thoroughly checked
and no mistake in the creation process has been found.
Table 5: Cores that did not pass the methodology tests.
Nm Cycle type Condition name
(EFPH_Power_Flow)
Power [%] Flow [kg/s]
1 BOC 0_1000_9250 100 9250
2 BOC 0_800_10625 80 10625
3 BOC 0_650_10625 65 10625
4 EOFC 10000_1000_14500 100 14500
5 EOFC 10000_800_14500 80 14500
6 EOFC 10000_650_14500 65 14500
Figure 8: Graph showing which collapsed cores that did and did not pass the methodology
tests.
15 BEST ESTIMATE METHODOLOGY
2.3.2. BISON
BISON is a BE code developed by Westinghouse and is used for safety analysis in several
countries including Sweden. BISON is especially suited for fast transients (with a timescale of
seconds) and is used for a variety of safety calculations for the SAR reports. It uses 4 balance
equations (2 for mass, 1 for momentum, and 1 for energy) with a 1D neutron kinetics model. The
1D core uses a collapsed 3D core from e.g. a POLCA7 simulation (giving values for cross
sections, diffusion coefficients, axial power curve etc.). Since a 1D neutron kinetics model is
used, no local transients should be simulated where local effects are expected. This excluded
some transients which could have been interesting to analyze at reduced power, e.g. a control rod
drop. Other known deficiencies are BISON’s difficulty to model quick pressure drops as well as
core uncovery (e.g. during a loss of coolant accident (LOCA)). [6]
For fast transients with dryout the BISON sub-code SLAVE was used for calculating CPR for
the core channels where the lowest minCPR and largest ΔCPR are expected. SLAVE uses
boundary conditions from the average channel calculation in BISON and applies these to a
chosen channel. The channels primarily used for safety calculations at Westinghouse are the
channels with the maximum peaking power, the maximum total power, and the lowest ICPR. A
single channel often met two of these criteria, usually maximum total power and lowest ICPR.
[15]
2.4. Data Uncertainty Assessment
When the capability of the code has been assessed, the uncertainty of the parameters used in the
code for simulating the phenomenon is evaluated in a DUA. When data from tests were
available, the parameter was tested for normality. The normal distribution function follows
( )
√ ( )
(2.4.1)
where No is the normal distribution function for results x, μ is the mean value, and σ is the
standard deviation. There are several normality tests; however the one used was the Anderson-
Darling (AD) test. All equations for the AD test used here are taken from [24]. The AD test
consists of taking data points x1,… xi,…, xn, and calculating
∑ [ ( ) ( )
]
(2.4.2)
(
) (2.4.3)
16 BEST ESTIMATE METHODOLOGY
where Pi is the normal cumulative distribution for values xi in the dataset, n is the amount of
values in the dataset, A2 is the AD statistic, and A
2* is the adjusted AD statistic. From A
2* the p-
value is calculated from
( ) ( ) for (2.4.4)
( ) ( ) for (2.4.5)
( ) ( ) for (2.4.6)
( ) ( ) for (2.4.7)
When the p-value is above 0.05 and A2*
is below 0.752, a normal distribution can be assumed for
the dataset with a mean value and standard deviation calculated using the standard equations
∑ (2.4.8)
√
∑ ( ) (2.4.9)
If the sample is rejected, a uniform distribution can be assumed with minimum and maximum
values of μ ± 2·σ. The uniform distribution will propagate the largest possible standard deviation
for the figure of merit (which can be seen as a conservative choice for the distribution). For
parameters where no measurement data was possessed, previous values used for conservative
analyses in the SAR reports were used as maximum and minimum values with uniform
distributions. [19]
The AD test is naturally not a definite answer if the dataset follows a normal distribution or not.
For datasets where the AD test rejected the normal distribution, a second manual check was
made in order to confirm that the data did not follow a normal distribution. If the dataset could
be seen to follow a normal distribution, even though the AD test rejected it, the choice to use a
normal distribution was done.
All parameters with corresponding distribution were added to the DUA table. Several deviations
from the methodology had to be made in order to remove unwanted errors (from e.g. the core
collapse) and make the analysis possible. An example of how a parameter in a DUA is shown in
Table 6.

17 BEST ESTIMATE METHODOLOGY
Table 6: Example of a parameter in the DUA table. [19]
Category Phenomenon/
Plant
Component
Code input/
Modelling
Parameter
Data Uncertainty
Min Nom Mean Std. Dev. Dist. Max
Initial
conditions
Heat transfer
from fuel to
coolant
Heat transfer
parameter in
BISON
[-]
- - 5 0.25 Normal -
A weakness in the DUA was that for multiple parameters the data obtained was weighted toward
a conservative value, which gave a bias in the final result. For several measured parameters the
tolerances were not uniform. The data was therefore in some cases altered in order to make a
uniform distribution where this could be considered the most reasonable and sometimes kept bias
where this was considered the most reasonable.
When a parameter has a distribution that is not normal or uniform, other distributions may be
necessary to use. This will put larger demands on the sampling code, making Bourne Again Shell
(BASH, the Linux programming language chosen to create the input files) a non-choice for input
data processing. Coupling a BASH script with a more mathematically based programming
language could be done to fix this.
When sampling the input parameters for the simulations, BASH’s standard random number
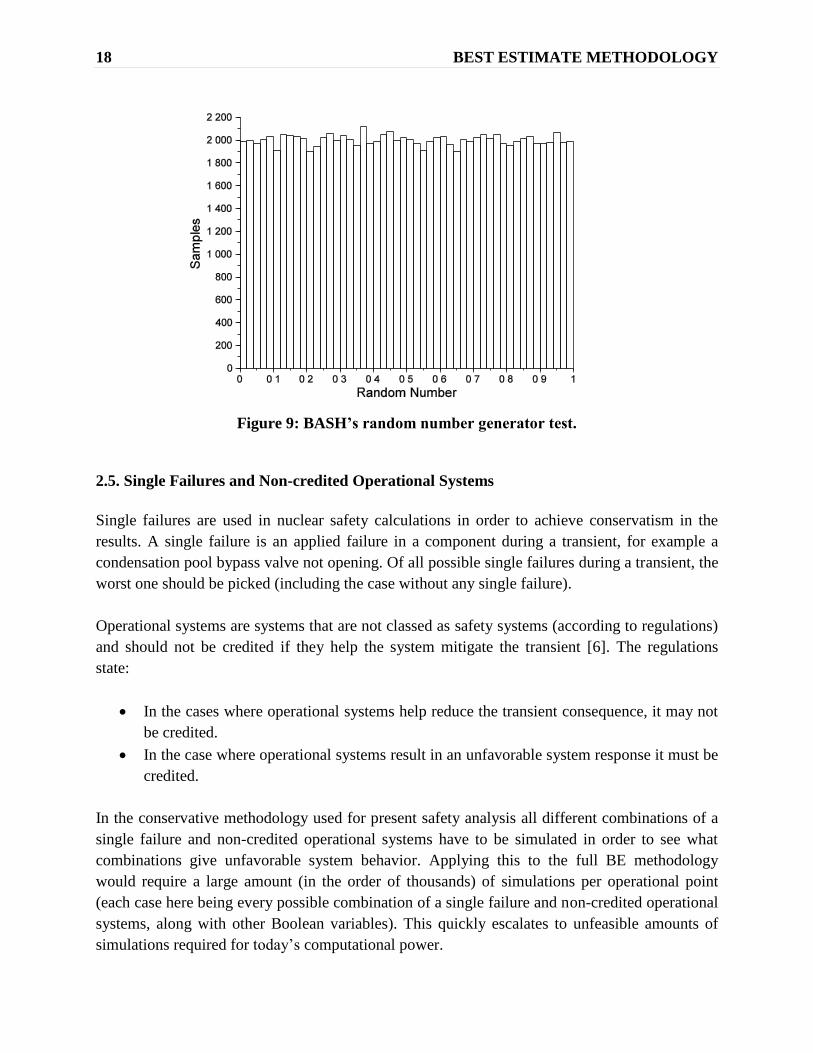
generator was used. A histogram showing sampled numbers by the generator is shown in Figure
9, where it can be seen that the random number generator gives the desired uniform distribution.
It was discovered too late in the work that no seed could be recovered for the random number
generator used. This is a major problem, making it impossible to reproduce the exact results.
This should be fixed for future projects.
18 BEST ESTIMATE METHODOLOGY
Figure 9: BASH’s random number generator test.
2.5. Single Failures and Non-credited Operational Systems
Single failures are used in nuclear safety calculations in order to achieve conservatism in the
results. A single failure is an applied failure in a component during a transient, for example a
condensation pool bypass valve not opening. Of all possible single failures during a transient, the
worst one should be picked (including the case without any single failure).
Operational systems are systems that are not classed as safety systems (according to regulations)
and should not be credited if they help the system mitigate the transient [6]. The regulations
state:
In the cases where operational systems help reduce the transient consequence, it may not
be credited.
In the case where operational systems result in an unfavorable system response it must be
credited.
In the conservative methodology used for present safety analysis all different combinations of a
single failure and non-credited operational systems have to be simulated in order to see what
combinations give unfavorable system behavior. Applying this to the full BE methodology
would require a large amount (in the order of thousands) of simulations per operational point
(each case here being every possible combination of a single failure and non-credited operational
systems, along with other Boolean variables). This quickly escalates to unfeasible amounts of
simulations required for today’s computational power.
19 BEST ESTIMATE METHODOLOGY
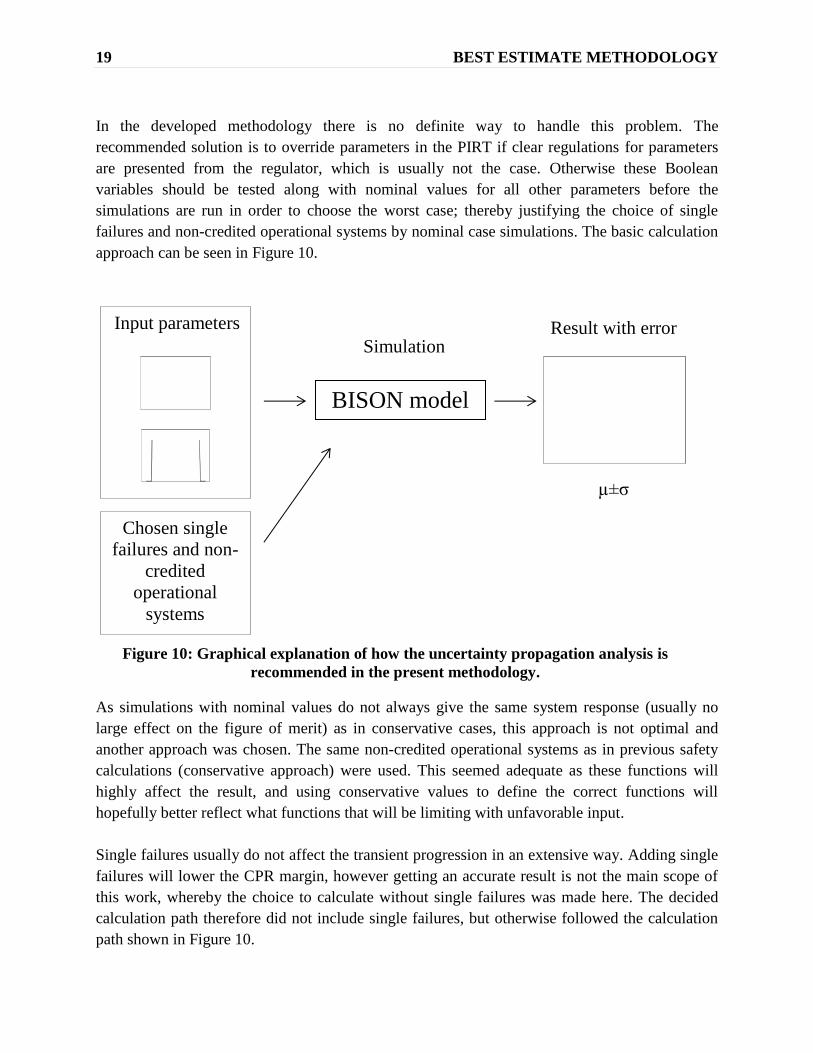
In the developed methodology there is no definite way to handle this problem. The
recommended solution is to override parameters in the PIRT if clear regulations for parameters
are presented from the regulator, which is usually not the case. Otherwise these Boolean
variables should be tested along with nominal values for all other parameters before the
simulations are run in order to choose the worst case; thereby justifying the choice of single
failures and non-credited operational systems by nominal case simulations. The basic calculation
approach can be seen in Figure 10.
As simulations with nominal values do not always give the same system response (usually no
large effect on the figure of merit) as in conservative cases, this approach is not optimal and
another approach was chosen. The same non-credited operational systems as in previous safety
calculations (conservative approach) were used. This seemed adequate as these functions will
highly affect the result, and using conservative values to define the correct functions will
hopefully better reflect what functions that will be limiting with unfavorable input.
Single failures usually do not affect the transient progression in an extensive way. Adding single
failures will lower the CPR margin, however getting an accurate result is not the main scope of
this work, whereby the choice to calculate without single failures was made here. The decided
calculation path therefore did not include single failures, but otherwise followed the calculation
path shown in Figure 10.
Figure 10: Graphical explanation of how the uncertainty propagation analysis is
recommended in the present methodology.
Result with error
Chosen single
failures and non-
credited
operational
systems
Input parameters
BISON model
Simulation
µ±σ

20 BEST ESTIMATE METHODOLOGY
The chosen non-credited operational systems for these simulations were [15]:
No partial scram
No pump run back through the power regulating system
Pump runback on feedwater through the water level system at scram.
21 POST PROCESSING
3. POST PROCESSING
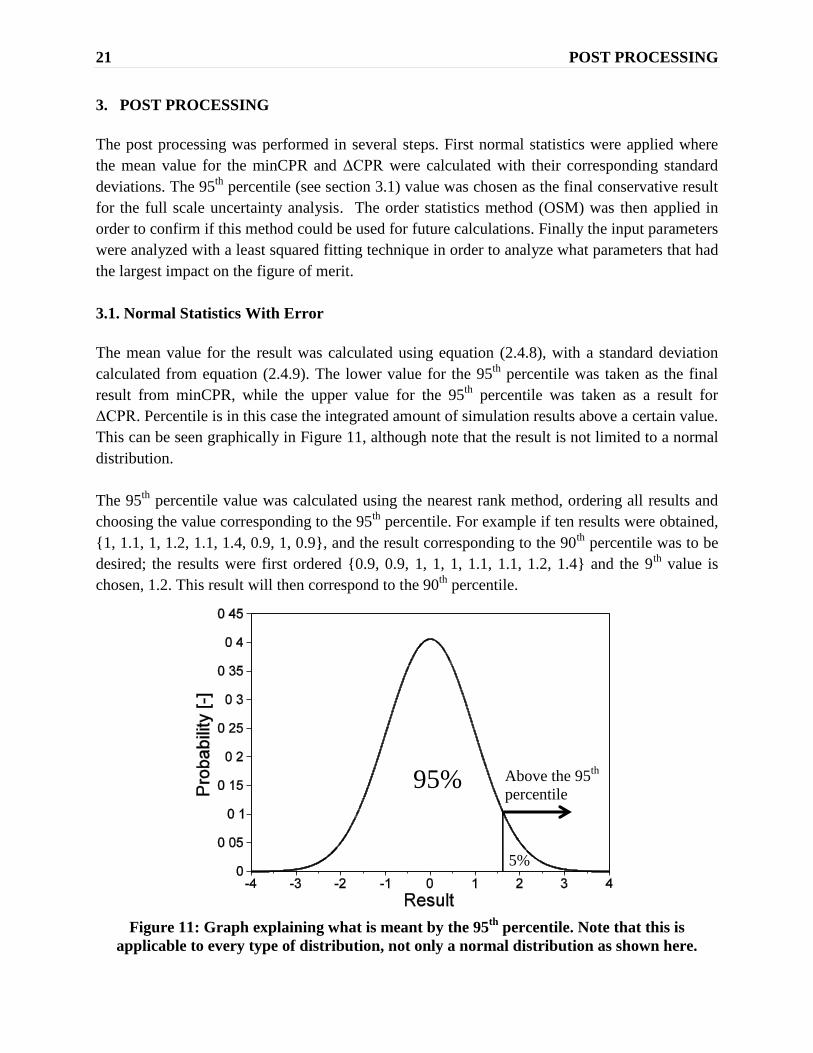
The post processing was performed in several steps. First normal statistics were applied where
the mean value for the minCPR and ΔCPR were calculated with their corresponding standard
deviations. The 95th
percentile (see section 3.1) value was chosen as the final conservative result
for the full scale uncertainty analysis. The order statistics method (OSM) was then applied in
order to confirm if this method could be used for future calculations. Finally the input parameters
were analyzed with a least squared fitting technique in order to analyze what parameters that had
the largest impact on the figure of merit.
3.1. Normal Statistics With Error
The mean value for the result was calculated using equation (2.4.8), with a standard deviation
calculated from equation (2.4.9). The lower value for the 95th
percentile was taken as the final
result from minCPR, while the upper value for the 95th
percentile was taken as a result for
ΔCPR. Percentile is in this case the integrated amount of simulation results above a certain value.
This can be seen graphically in Figure 11, although note that the result is not limited to a normal
distribution.
The 95th
percentile value was calculated using the nearest rank method, ordering all results and
choosing the value corresponding to the 95th
percentile. For example if ten results were obtained,
{1, 1.1, 1, 1.2, 1.1, 1.4, 0.9, 1, 0.9}, and the result corresponding to the 90th
percentile was to be
desired; the results were first ordered {0.9, 0.9, 1, 1, 1, 1.1, 1.1, 1.2, 1.4} and the 9th
value is
chosen, 1.2. This result will then correspond to the 90th
percentile.
Figure 11: Graph explaining what is meant by the 95
th percentile. Note that this is
applicable to every type of distribution, not only a normal distribution as shown here.
95%
5%
Above the 95th
percentile

22 POST PROCESSING
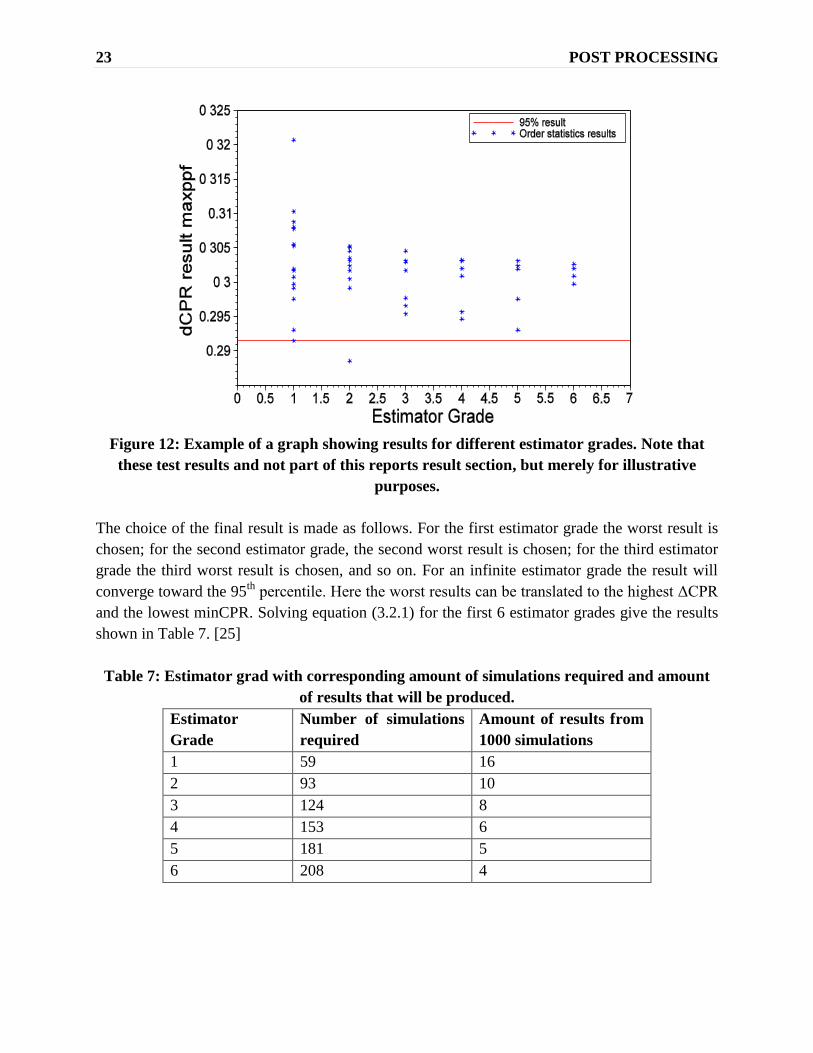
3.2. Order Statistics Method
The OSM is a feasible approach if merely a conservative result is required and a low amount of
computational power is available. The loss using this method is that no accurate mean and
standard deviation can be obtained due to the low amount of samples simulated, and often the
result can be too conservative, putting restrictions on the allowable operational conditions. [25]
The basic idea of this approach is to calculate how many simulations that are required in order to
get a wanted amount of results above the 95th
percentile with a confidence of 95% (for this
methodology a confidence of 95% is used [19]). A simple way too look at this is that for 1
simulation there is a 5% confidence that the result is above the 95th
percentile (since 5% of the
results will end up above this level), for 2 simulations there is a 9.75% confidence that one of the
results is above the 95th
percentile, and so on. Finally after 59 simulations there will be a 95%
confidence that at least one result is above the 95th
percentile. The most unfavorable result can
then be used. The general formula to calculate the required amount of simulations looks as
follows:
∑ ( ) ( )
(3.2.1)
where γ is the confidence interval (in this case 0.95), β is the probability (also chosen to 0.95), s
is the estimator grade wanted, and N is the amount of simulations. The estimator grade is a value
corresponding to the how well the estimation is. Note that a higher estimator grade will not
increase the confidence level, merely lower the span of the results. Even for higher estimator
grades 5% of the results (as 95% confidence is used in this case) will be on the “wrong” side of
the desired percentile line. As can be seen in Figure 12, for the 2nd
estimator grade one of the
results went below the 95th
percentile line, but the span of the results will be lower than for the
first estimator grade, which did not get any result below the percentile line (one result is exactly
at the calculated 95th
percentile line). [25]
23 POST PROCESSING
Figure 12: Example of a graph showing results for different estimator grades. Note that
these test results and not part of this reports result section, but merely for illustrative
purposes.
The choice of the final result is made as follows. For the first estimator grade the worst result is
chosen; for the second estimator grade, the second worst result is chosen; for the third estimator
grade the third worst result is chosen, and so on. For an infinite estimator grade the result will
converge toward the 95th
percentile. Here the worst results can be translated to the highest ΔCPR
and the lowest minCPR. Solving equation (3.2.1) for the first 6 estimator grades give the results
shown in Table 7. [25]
Table 7: Estimator grad with corresponding amount of simulations required and amount
of results that will be produced.
Estimator
Grade
Number of simulations
required
Amount of results from
1000 simulations
1 59 16
2 93 10
3 124 8
4 153 6
5 181 5
6 208 4
24 POST PROCESSING
3.3. Least Square Linear Fitting
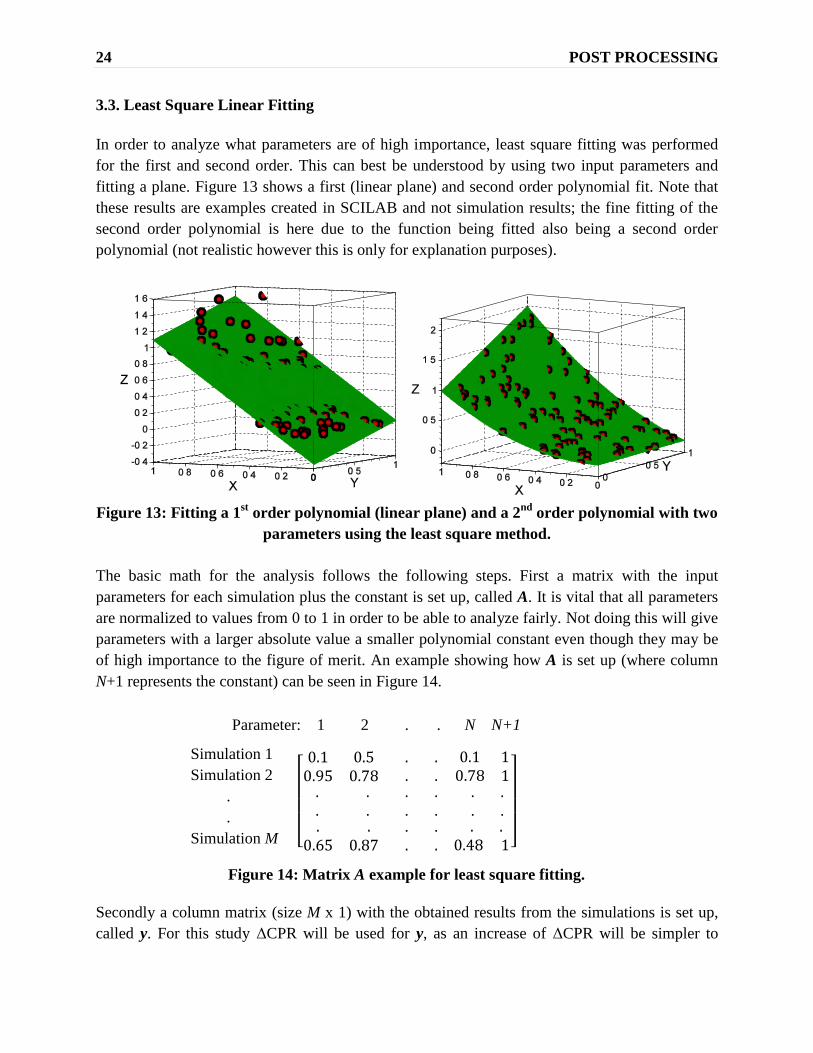
In order to analyze what parameters are of high importance, least square fitting was performed
for the first and second order. This can best be understood by using two input parameters and
fitting a plane. Figure 13 shows a first (linear plane) and second order polynomial fit. Note that
these results are examples created in SCILAB and not simulation results; the fine fitting of the
second order polynomial is here due to the function being fitted also being a second order
polynomial (not realistic however this is only for explanation purposes).
Figure 13: Fitting a 1
st order polynomial (linear plane) and a 2
nd order polynomial with two
parameters using the least square method.
The basic math for the analysis follows the following steps. First a matrix with the input
parameters for each simulation plus the constant is set up, called A. It is vital that all parameters
are normalized to values from 0 to 1 in order to be able to analyze fairly. Not doing this will give
parameters with a larger absolute value a smaller polynomial constant even though they may be
of high importance to the figure of merit. An example showing how A is set up (where column
N+1 represents the constant) can be seen in Figure 14.
[
]
Secondly a column matrix (size M x 1) with the obtained results from the simulations is set up,
called y. For this study ΔCPR will be used for y, as an increase of ΔCPR will be simpler to
Parameter: 1 2 . . N N+1
Simulation 1
Simulation 2
.
.
Simulation M
Figure 14: Matrix A example for least square fitting.

25 POST PROCESSING
analyze as no double negatives will occur. From here the following matrix calculations are
made:
(3.3.1)
( ) (3.3.2)
where b is a matrix with polynomial multipliers. The higher the multiplier calculated in b is, the
higher importance the parameter has on the result. For the second order all parameter squares and
all parameter combinations must be included. With 41 parameters present in this work at least
903 simulations were required. For this reason 1000 simulations were performed for each
operational point, obtaining enough data to get a second order polynomial fit as well as have a
buffer in case several simulations crashed. Increasing to the second order fitting will lower the
error from the polynomial fit, calculated by
(3.3.3)
where Δ is the error. By using a second order polynomial fitting, the error was minimized
approximately one order of magnitude. This also gives the possibility of finding if combinations
of parameters have large effects on the figure of merit.

26 POST PROCESSING
27 RESULTS
4. RESULTS
First the general transient history is presented, giving an understanding of how the rector
responds to the transient. The CPR results are then shown, followed by results of how well the
OSM performed, and finally the importance of the different parameters from the least squared
fitting procedure.
4.1. General Transient
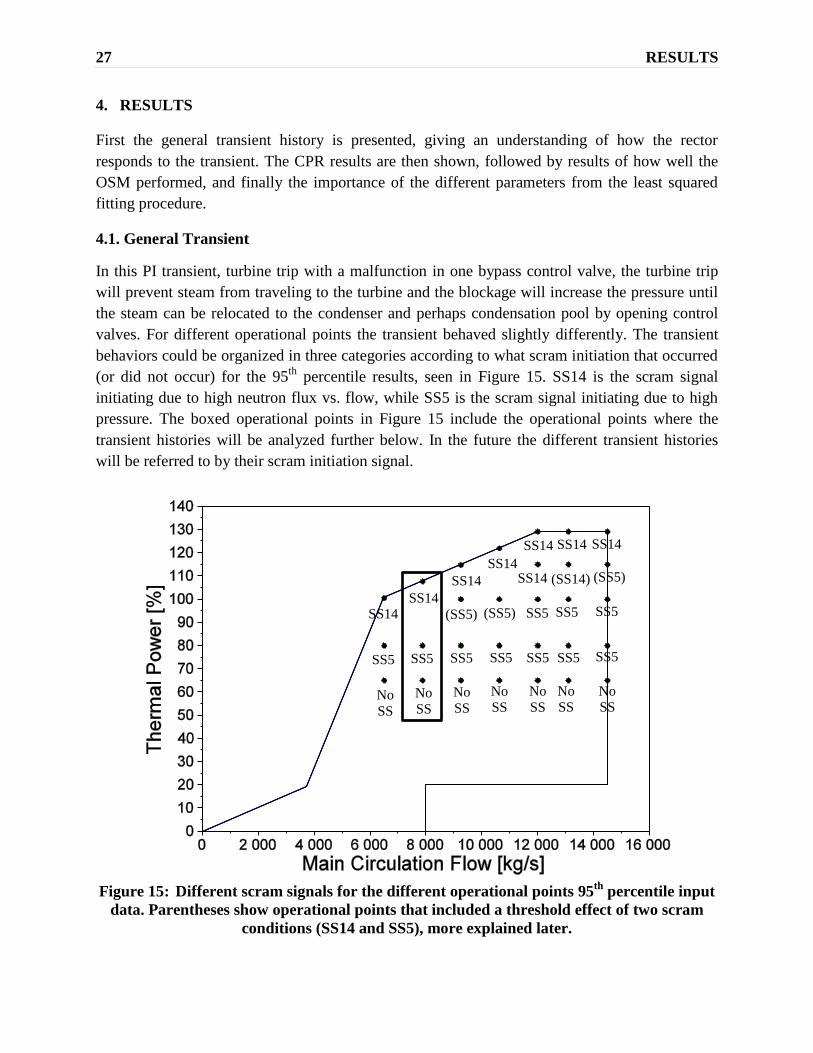
In this PI transient, turbine trip with a malfunction in one bypass control valve, the turbine trip
will prevent steam from traveling to the turbine and the blockage will increase the pressure until
the steam can be relocated to the condenser and perhaps condensation pool by opening control
valves. For different operational points the transient behaved slightly differently. The transient
behaviors could be organized in three categories according to what scram initiation that occurred
(or did not occur) for the 95th
percentile results, seen in Figure 15. SS14 is the scram signal
initiating due to high neutron flux vs. flow, while SS5 is the scram signal initiating due to high
pressure. The boxed operational points in Figure 15 include the operational points where the
transient histories will be analyzed further below. In the future the different transient histories
will be referred to by their scram initiation signal.
Figure 15: Different scram signals for the different operational points 95
th percentile input
data. Parentheses show operational points that included a threshold effect of two scram
conditions (SS14 and SS5), more explained later.
SS14
SS5
No
SS
SS14
SS5
No
SS
SS14
(SS5)
SS5
No
SS
SS14
(SS5)
SS5
No
SS
SS14
SS14
SS5
SS5
No
SS
SS14
(SS14)
SS5
SS5
No
SS
SS14
(SS5)
SS5
SS5
No
SS
28 RESULTS
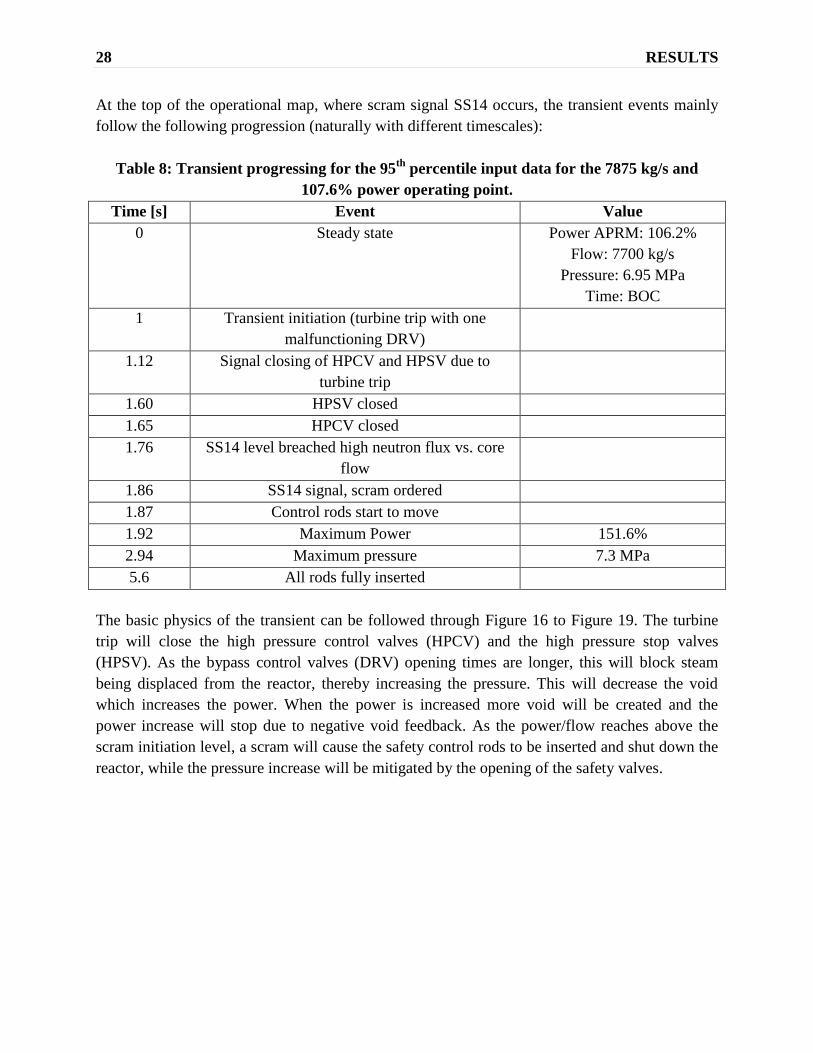
At the top of the operational map, where scram signal SS14 occurs, the transient events mainly
follow the following progression (naturally with different timescales):
Table 8: Transient progressing for the 95th
percentile input data for the 7875 kg/s and
107.6% power operating point.
Time [s] Event Value
0 Steady state Power APRM: 106.2%
Flow: 7700 kg/s
Pressure: 6.95 MPa
Time: BOC
1 Transient initiation (turbine trip with one
malfunctioning DRV)
1.12 Signal closing of HPCV and HPSV due to
turbine trip
1.60 HPSV closed
1.65 HPCV closed
1.76 SS14 level breached high neutron flux vs. core
flow
1.86 SS14 signal, scram ordered
1.87 Control rods start to move
1.92 Maximum Power 151.6%
2.94 Maximum pressure 7.3 MPa
5.6 All rods fully inserted
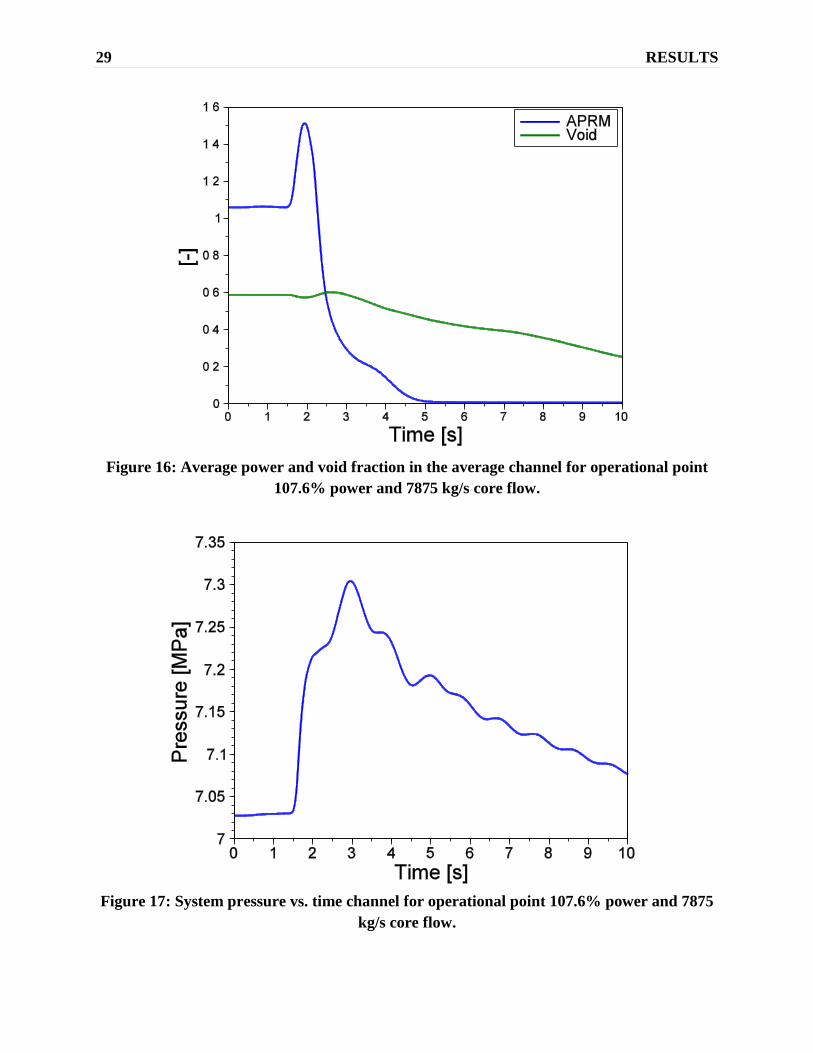
The basic physics of the transient can be followed through Figure 16 to Figure 19. The turbine
trip will close the high pressure control valves (HPCV) and the high pressure stop valves
(HPSV). As the bypass control valves (DRV) opening times are longer, this will block steam
being displaced from the reactor, thereby increasing the pressure. This will decrease the void
which increases the power. When the power is increased more void will be created and the
power increase will stop due to negative void feedback. As the power/flow reaches above the
scram initiation level, a scram will cause the safety control rods to be inserted and shut down the
reactor, while the pressure increase will be mitigated by the opening of the safety valves.
29 RESULTS
Figure 16: Average power and void fraction in the average channel for operational point
107.6% power and 7875 kg/s core flow.
Figure 17: System pressure vs. time channel for operational point 107.6% power and 7875
kg/s core flow.
30 RESULTS
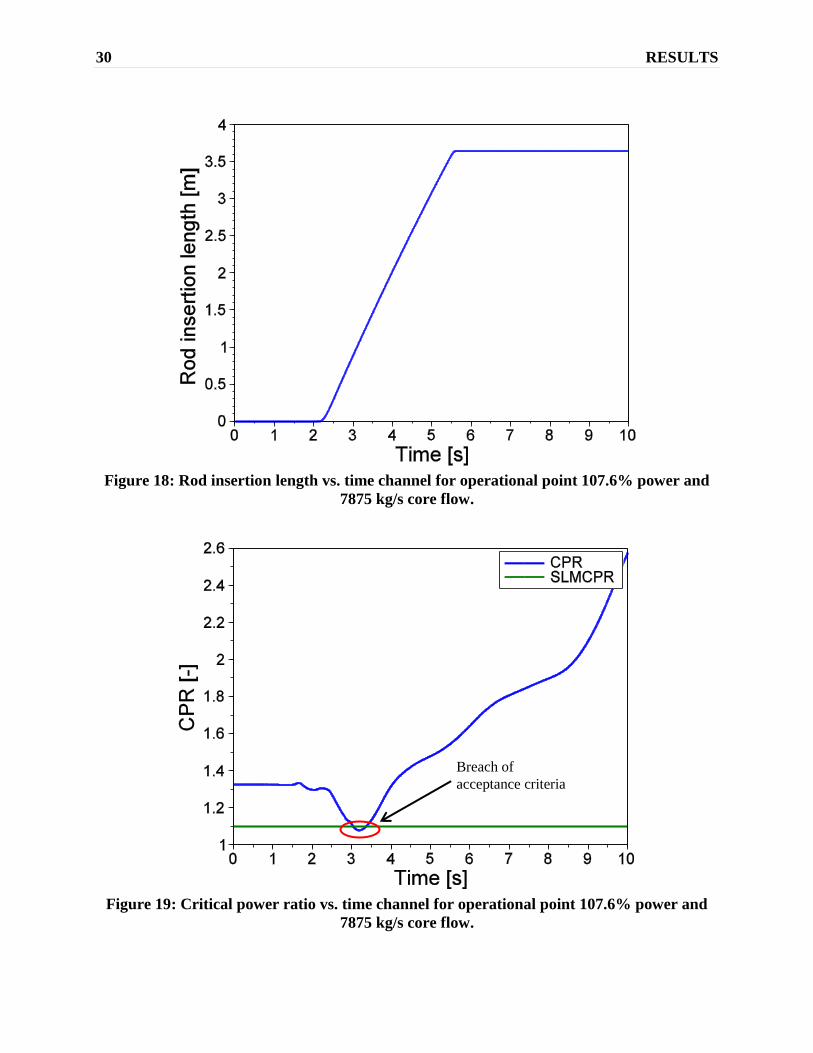
Figure 18: Rod insertion length vs. time channel for operational point 107.6% power and
7875 kg/s core flow.
Figure 19: Critical power ratio vs. time channel for operational point 107.6% power and
7875 kg/s core flow.
Breach of
acceptance criteria
31 RESULTS
In the middle of the operational map the scram is initiated at high pressure (SS5). The initial
operating point is too far from the scram lines at high neutron flux and flow. This will cause the
automatic operational systems to hold of the scram in the initial stage of the transient, delaying
the shutdown of the reactor. The pressure increase cannot be lowered by the normal automatic
systems, which eventually causes a scram of the reactor at high pressure. The transient
progression is seen in Table 9.
Table 9: Transient progressing for the 95th
percentile input data for the 7875 kg/s and 80%
power operating point.
Time [s] Event Value
0 Steady state Power APRM: 81.5%
Flow: 7685 kg/s
Pressure: 7 MPa
Time: BOC
1 Transient initiation (turbine trip with one
malfunctioning DRV)
1.60 HPSV closed
1.62 HPCV closed
1.9 Maximum power 106.3 %
6.421 SS5 level breached, high pressure Pressure 7.4 MPa
6.423 SS5 signal, scram ordered
6.43 Control rods start to move
6.77 Maximum pressure 7.42 MPa
10.3 All rods fully inserted
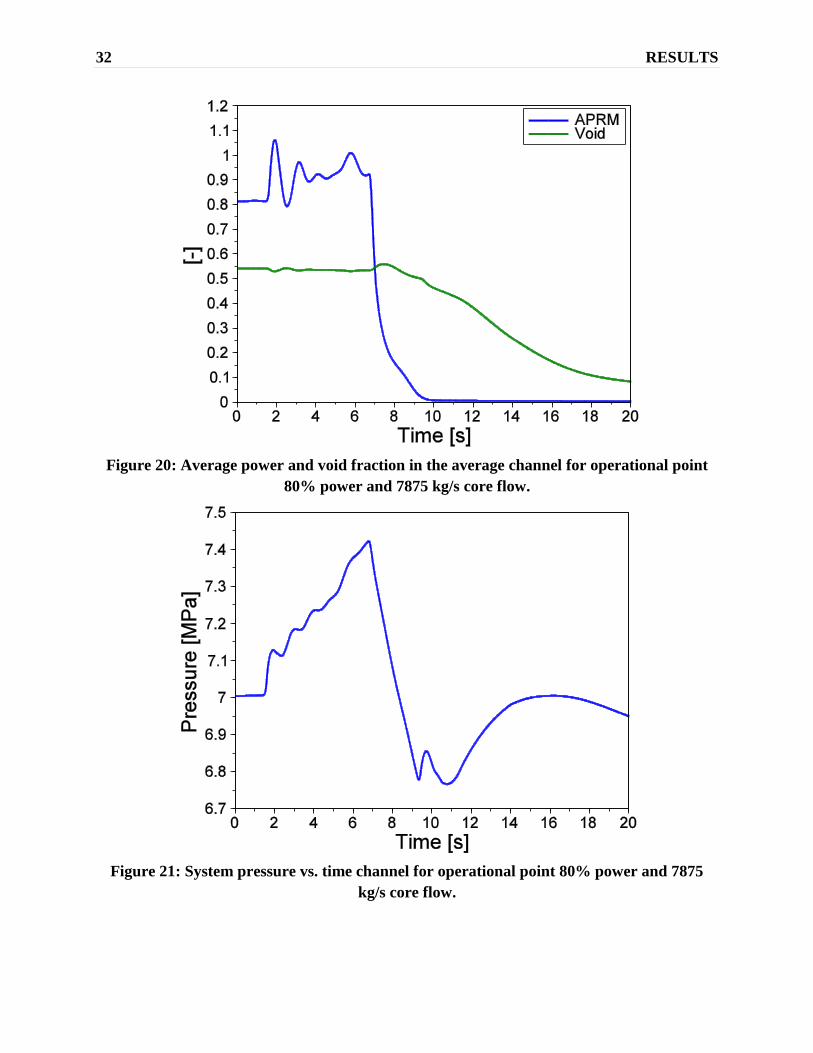
Comparing this case to the previous example it is seen looking at Figure 20 through Figure 23
that the normal operating systems almost handle the transient, except for the pressure increase.
The system response is lower, and it is seen in Figure 23 that CPR is slowly decreased until the
scram signal is activated, whereby the CPR has a quick decline and then is set to safe values.
This transient has a larger ΔCPR; however the ICPR is increased more than ΔCPR making this
operational point safer. It will be seen in section 4.2 that there is a threshold effect between these
two transient histories.
32 RESULTS
Figure 20: Average power and void fraction in the average channel for operational point
80% power and 7875 kg/s core flow.
Figure 21: System pressure vs. time channel for operational point 80% power and 7875
kg/s core flow.
33 RESULTS
Figure 22: Rod insertion length vs. time channel for operational point 80% power and 7875
kg/s core flow.
Figure 23: Critical power ratio vs. time channel for operational point 80% power and 7875
kg/s core flow.
34 RESULTS
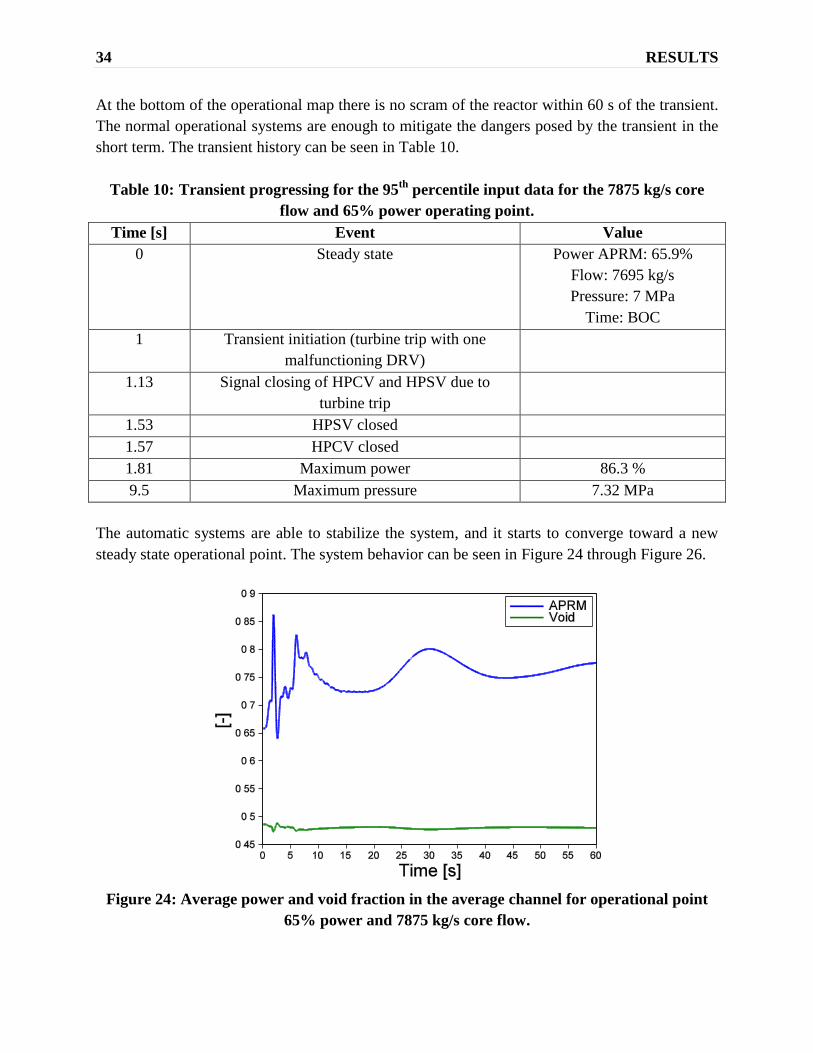
At the bottom of the operational map there is no scram of the reactor within 60 s of the transient.
The normal operational systems are enough to mitigate the dangers posed by the transient in the
short term. The transient history can be seen in Table 10.
Table 10: Transient progressing for the 95th
percentile input data for the 7875 kg/s core
flow and 65% power operating point.
Time [s] Event Value
0 Steady state Power APRM: 65.9%
Flow: 7695 kg/s
Pressure: 7 MPa
Time: BOC
1 Transient initiation (turbine trip with one
malfunctioning DRV)
1.13 Signal closing of HPCV and HPSV due to
turbine trip
1.53 HPSV closed
1.57 HPCV closed
1.81 Maximum power 86.3 %
9.5 Maximum pressure 7.32 MPa
The automatic systems are able to stabilize the system, and it starts to converge toward a new
steady state operational point. The system behavior can be seen in Figure 24 through Figure 26.
Figure 24: Average power and void fraction in the average channel for operational point
65% power and 7875 kg/s core flow.
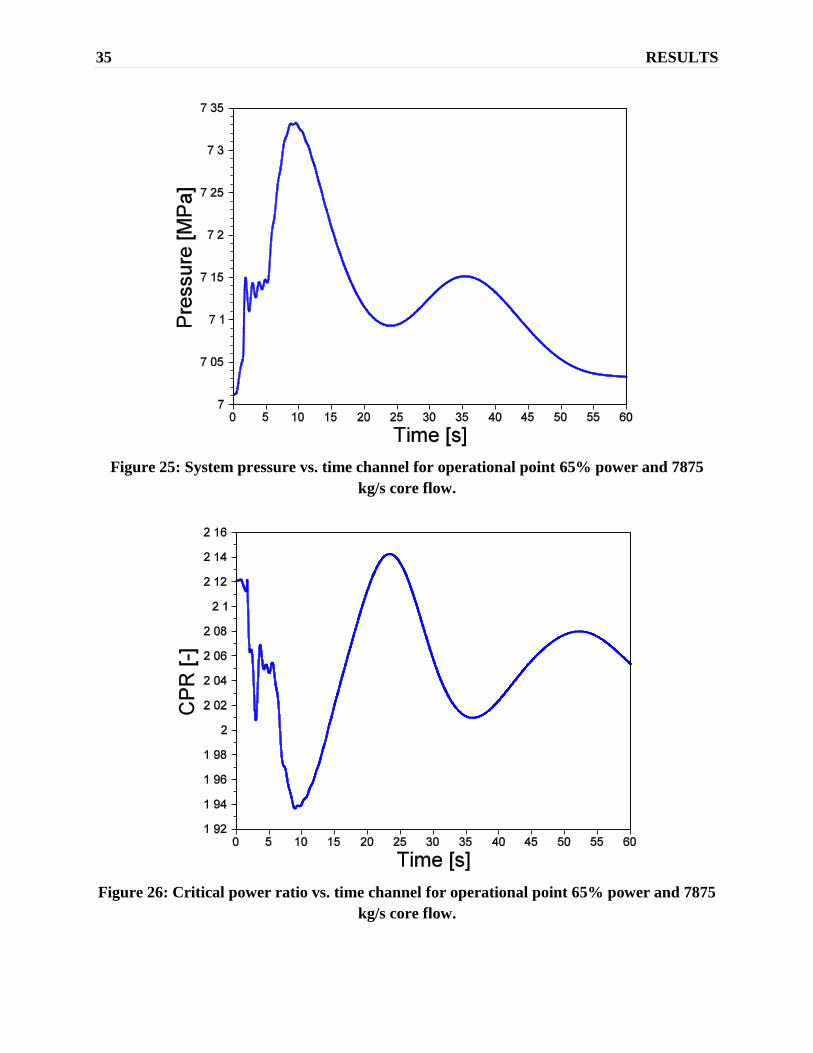
35 RESULTS
Figure 25: System pressure vs. time channel for operational point 65% power and 7875
kg/s core flow.
Figure 26: Critical power ratio vs. time channel for operational point 65% power and 7875
kg/s core flow.

36 RESULTS
4.2. CPR Results
The results for the two different CPR’s, minCPR and ΔCPR, can be seen in Figure 27 and Table
11. The maximum peaking power channel result at 65% power and 10625 kg/s core flow
deviates from the general trend severely. This may be due to an extreme power profile at this
point, or due to an erroneous core collapse. The results for the max power peaking factor channel
at this operational point get a different initial CPR compared to the maximum power and
minimum ICPR channels, however the ΔCPR seems reasonable.
Figure 27: Results for minCPR shown in graphical form.
1.01
1.31
1.75
1.08
1.45
1.94
1.14
1.60
2.09
1.18
1.39
1.74
1.54
1.24
1.41
1.52
1.88
2.30
1.31
1.46
1.58
1.93
2.35
1.34
1.43
1.59
1.91
2.30
Area of interest
Highly doubtable result
1.28

37 RESULTS
Table 11: Table of the minCPR and ΔCPR results. The light grey coloring shows the worst
channel for each operational point.
Condition name
(EFPH_Power_Flow)
minCPR
max
power
minCPR
min
ICPR
minCPR
max
ppf*
ΔCPR
max
power
ΔCPR
min
ICPR
ΔCPR
max
ppf*
0_1005_6500 1.013 1.025 1.041 0.240 0.221 0.212
0_800_6500 1.308 1.308 1.406 0.264 0.258 0.300
0_650_6500 1.748 1.748 1.900 0.162 0.162 0.172
0_1076_7875 1.080 1.084 1.101 0.243 0.231 0.227
0_800_7875 1.450 1.450 1.560 0.313 0.313 0.350
0_650_7875 1.937 1.937 2.095 0.205 0.205 0.220
0_1148_9250 1.142 1.149 1.235 0.216 0.204 0.240
0_1000_9250 1.276 1.284 1.379 0.274 0.263 0.302
0_800_9250 1.597 1.597 1.719 0.319 0.319 0.352
0_650_9250 2.091 2.088 2.265 0.246 0.248 0.265
0_1219_10625 1.184 1.198 1.284 0.190 0.175 0.210
0_1000_10625 1.391 1.405 1.505 0.272 0.256 0.297
0_800_10625 1.737 1.748 1.873 0.312 0.297 0.340
0_650_10625 2.205 2.198 1.535 0.284 0.286 0.197
5500_1291_12000 1.244 1.244 1.289 0.124 0.124 0.166
5500_1150_12000 1.405 1.405 1.457 0.129 0.129 0.169
5500_1000_12000 1.521 1.521 1.566 0.234 0.234 0.290
5500_800_12000 1.880 1.880 1.929 0.293 0.293 0.355
5500_650_12000 2.295 2.295 2.412 0.338 0.338 0.353
5500_1291_13100 1.312 1.312 1.340 0.125 0.125 0.170
5500_1150_13100 1.460 1.460 1.519 0.130 0.130 0.164
5500_1000_13100 1.579 1.579 1.627 0.235 0.235 0.292
5500_800_13100 1.929 1.929 1.997 0.309 0.309 0.359
5500_650_13100 2.345 2.345 2.467 0.356 0.356 0.374
10000_1291_14500 1.341 1.341 1.351 0.118 0.118 0.119
10000_1150_14500 1.434 1.434 1.434 0.199 0.199 0.199
10000_1000_14500 1.585 1.585 1.585 0.253 0.253 0.253
10000_800_14500 1.905 1.905 1.905 0.323 0.323 0.323
10000_650_14500 2.298 2.298 2.298 0.349 0.349 0.349
*ppf is the power peaking factor
38 RESULTS
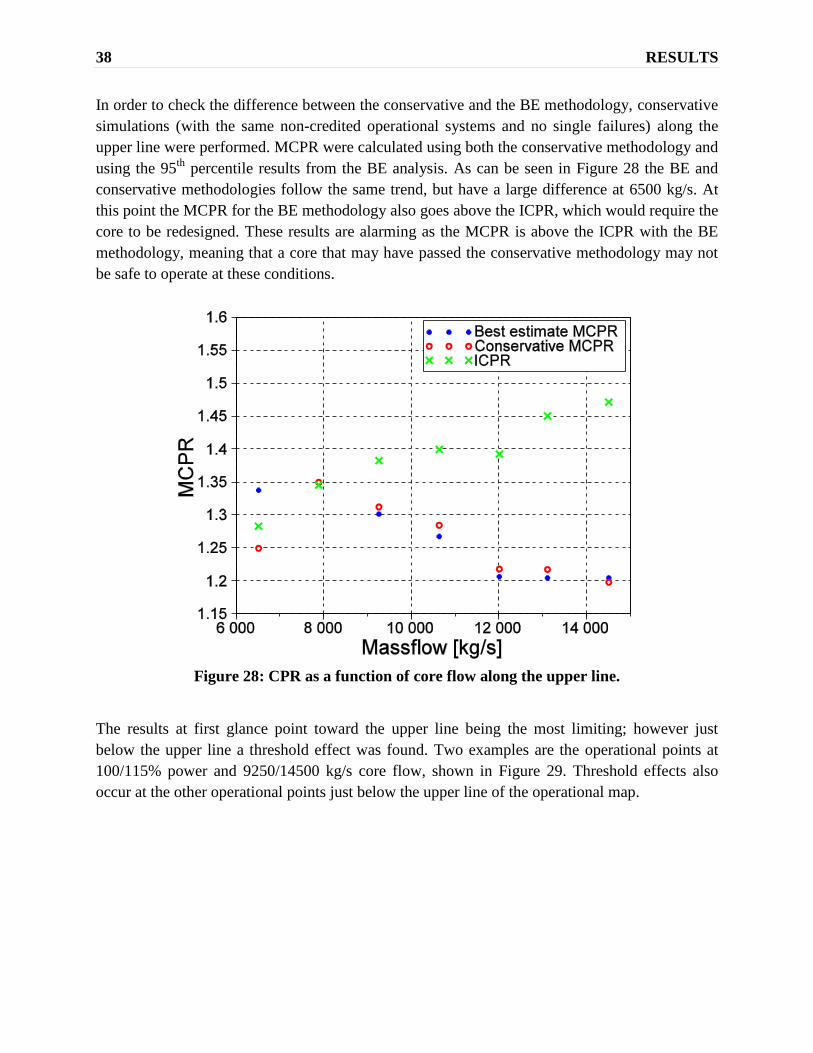
In order to check the difference between the conservative and the BE methodology, conservative
simulations (with the same non-credited operational systems and no single failures) along the
upper line were performed. MCPR were calculated using both the conservative methodology and
using the 95th
percentile results from the BE analysis. As can be seen in Figure 28 the BE and
conservative methodologies follow the same trend, but have a large difference at 6500 kg/s. At
this point the MCPR for the BE methodology also goes above the ICPR, which would require the
core to be redesigned. These results are alarming as the MCPR is above the ICPR with the BE
methodology, meaning that a core that may have passed the conservative methodology may not
be safe to operate at these conditions.
Figure 28: CPR as a function of core flow along the upper line.
The results at first glance point toward the upper line being the most limiting; however just
below the upper line a threshold effect was found. Two examples are the operational points at
100/115% power and 9250/14500 kg/s core flow, shown in Figure 29. Threshold effects also
occur at the other operational points just below the upper line of the operational map.
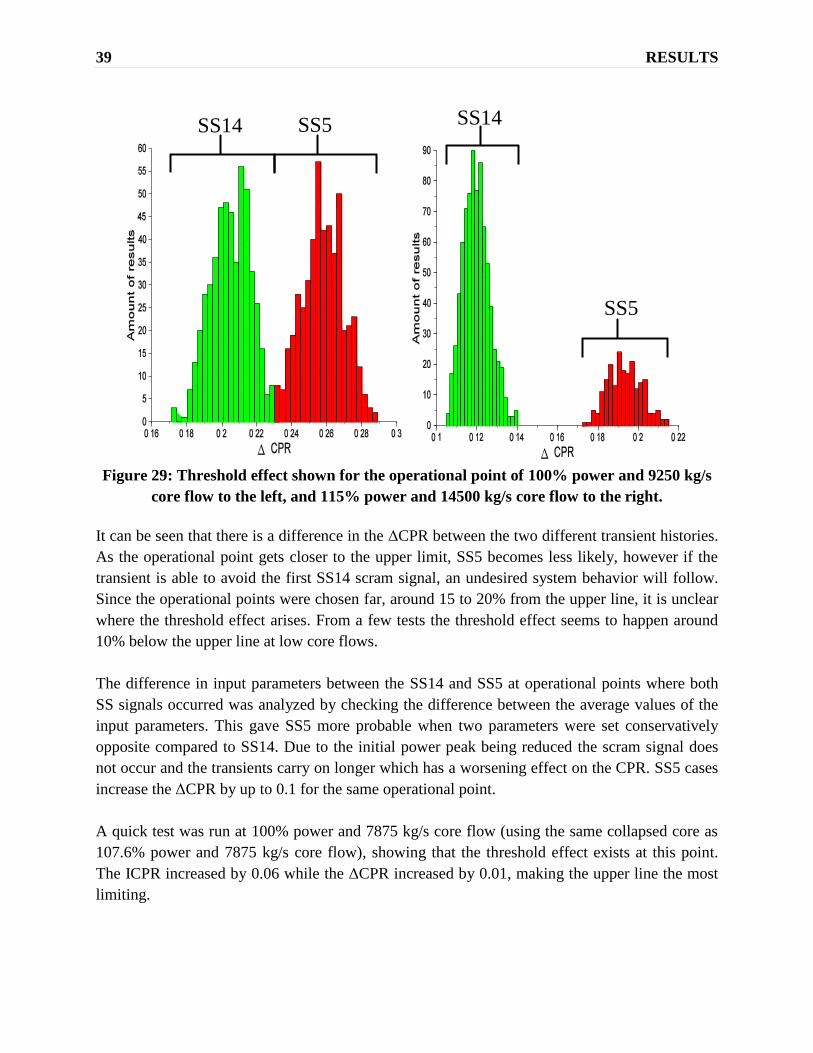
39 RESULTS
Figure 29: Threshold effect shown for the operational point of 100% power and 9250 kg/s
core flow to the left, and 115% power and 14500 kg/s core flow to the right.
It can be seen that there is a difference in the ΔCPR between the two different transient histories.
As the operational point gets closer to the upper limit, SS5 becomes less likely, however if the
transient is able to avoid the first SS14 scram signal, an undesired system behavior will follow.
Since the operational points were chosen far, around 15 to 20% from the upper line, it is unclear
where the threshold effect arises. From a few tests the threshold effect seems to happen around
10% below the upper line at low core flows.
The difference in input parameters between the SS14 and SS5 at operational points where both
SS signals occurred was analyzed by checking the difference between the average values of the
input parameters. This gave SS5 more probable when two parameters were set conservatively
opposite compared to SS14. Due to the initial power peak being reduced the scram signal does
not occur and the transients carry on longer which has a worsening effect on the CPR. SS5 cases
increase the ΔCPR by up to 0.1 for the same operational point.
A quick test was run at 100% power and 7875 kg/s core flow (using the same collapsed core as
107.6% power and 7875 kg/s core flow), showing that the threshold effect exists at this point.
The ICPR increased by 0.06 while the ΔCPR increased by 0.01, making the upper line the most
limiting.
SS5 SS14
SS5
SS14
40 RESULTS
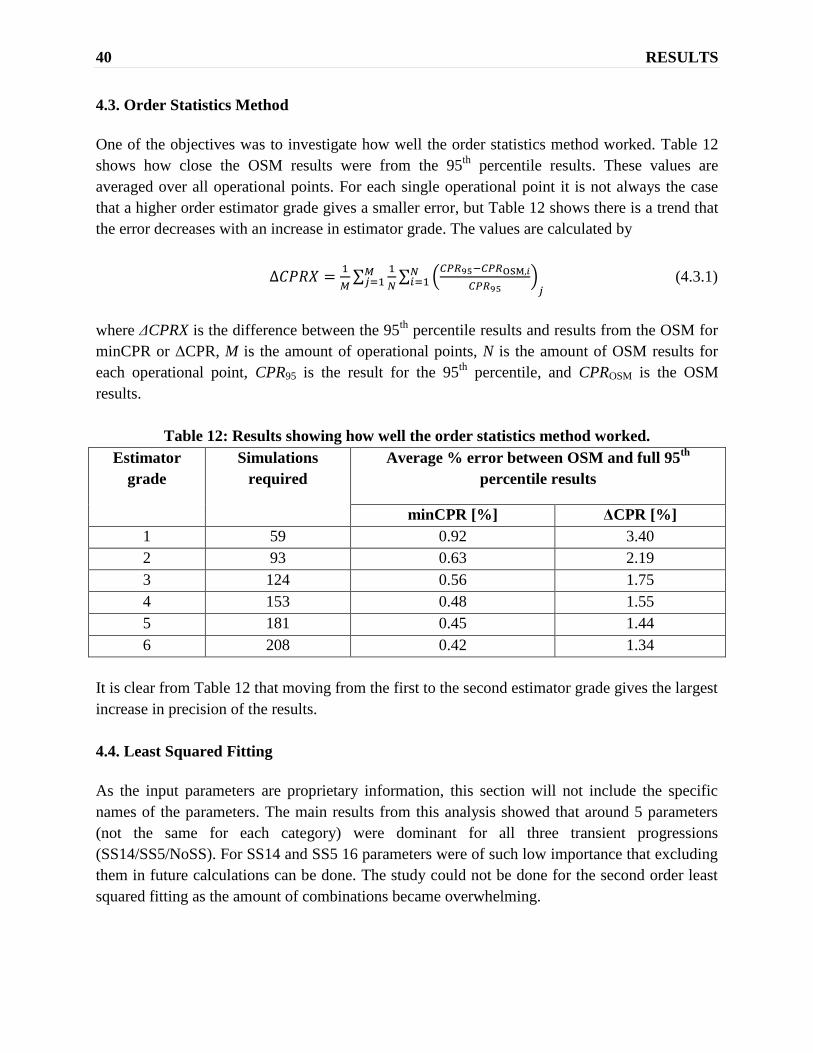
4.3. Order Statistics Method
One of the objectives was to investigate how well the order statistics method worked. Table 12
shows how close the OSM results were from the 95th
percentile results. These values are
averaged over all operational points. For each single operational point it is not always the case
that a higher order estimator grade gives a smaller error, but Table 12 shows there is a trend that
the error decreases with an increase in estimator grade. The values are calculated by
∑
∑ (
)
(4.3.1)
where ΔCPRX is the difference between the 95th
percentile results and results from the OSM for
minCPR or ΔCPR, M is the amount of operational points, N is the amount of OSM results for
each operational point, CPR95 is the result for the 95th
percentile, and CPROSM is the OSM
results.
Table 12: Results showing how well the order statistics method worked.
Estimator
grade
Simulations
required
Average % error between OSM and full 95th
percentile results
minCPR [%] ΔCPR [%]
1 59 0.92 3.40
2 93 0.63 2.19
3 124 0.56 1.75
4 153 0.48 1.55
5 181 0.45 1.44
6 208 0.42 1.34
It is clear from Table 12 that moving from the first to the second estimator grade gives the largest
increase in precision of the results.
4.4. Least Squared Fitting
As the input parameters are proprietary information, this section will not include the specific
names of the parameters. The main results from this analysis showed that around 5 parameters
(not the same for each category) were dominant for all three transient progressions
(SS14/SS5/NoSS). For SS14 and SS5 16 parameters were of such low importance that excluding
them in future calculations can be done. The study could not be done for the second order least
squared fitting as the amount of combinations became overwhelming.
41 DISCUSSION
5. DISCUSSION
Due to the over-dimensioned system and locked parameters (in the source code, e.g. correlations)
in BISON certain parameters could not be used as input data, even though the methodology
states that they should be included (as they affect CPR). In order to use BISON with this
methodology flexible code features must be implemented. Multipliers for each of the correlations
would simplify the building of the scripts used to create the input files for the simulations,
removing the need to alter the source code. In the case where parameters are dependent on each
other due to the over dimensioned system (from the core collapse), an investigation is needed in
order to create an approach which will not give errors when using required input parameters.
The results show that the smallest minCPR is almost exclusively for the channel with the
maximum total power, while the largest ΔCPR is almost exclusively in the channel with the
largest power peaking factor. This was the expected results and follows earlier results from SAR
calculations using the conservative approach. A trend can be seen in Figure 27, increasing the
core flow will increase minCPR and reduce ΔCPR; and more importantly decreasing the power
more than 15% will decrease the danger opposed by the transient. At the upper line with the
minimum core flow (100.5% power and 6500 kg/s core flow), where the lowest minCPR results
were obtained, the conservative analysis approach does not capture enough conservatism
comparing to the BE analysis, which may indicate an optimization problem. This operational
point was investigated but no clear conclusion can be drawn as to the reason for the large
deviation between the conservative and BE results. It can be questioned if the current
methodology is appropriate for the regions of the operational map where these types of results
are obtained.
The threshold effect found can be further analyzed. At 7875 kg/s core flow (comparing 107.6%
and 100% power) the threshold did not give a large enough ΔCPR compared to the increase in
ICPR when decreasing the power. This shows that upper line is here likely to be the most
limiting for a turbine trip with a malfunction in one bypass control valve. The threshold does
however show that areas beneath the upper line should be checked for each type of transient in
order to conclude that the upper line is the most limiting. Different transients may have a larger
threshold effect, and no guaranties can be made for other transients based on data from this
analysis.
What percentile level that should be used in the analysis need to be well motivated. A problem
can take place if, for example, a threshold effect occurs where 4% of the results are likely to give
large ΔCPR. In that case the current BE methodology would simply neglect these results, which
may or may not be the proper thing to do. This is the case at the operational point of 115% power
and 13100 kg/s core flow, where 1 % of the results gave SS5 with higher ΔCPR compared to the
other 99% of the results. Note that the “conservative skewness” and conservative values for low
42 DISCUSSION
ranked phenomenon in the CCA for the input parameters may give erroneous probabilities for
each transient history. This heightens the need for a conservative choice for the percentile level.
With nuclear safety culture in mind, a more conservative percentile level should be picked,
perhaps 99%. The problem for choosing the percentile level is shown pedagogically in Figure 30.
The required percentile for the calculations should be discussed with a regulator (NRC) in order
to come to an agreement when a threshold effect is too unlikely to be taken into account in a
deterministic calculation, as well as how to use parameters that does not pass the CCA. Should
these parameters be set nominal or conservative, and how should it be determined what a
conservative value is?
Figure 30: Example of results where 4% of the results are above the threshold.
The results seen in Figure 28 show that this simplified pilot core design for the O3 reactor does
not live up to the acceptance criteria, as MCPR is above ICPR (minCPR+ΔCPR). For the best
estimate calculations, at 100.5% power and 6500 kg/s the MCPR is considerably higher (0.06)
than the ICPR. It should however be noted that a simplified core has been used here, which is
common for pilot studies performed at Westinghouse (simulations using more exact core data are
usually done with less calculations based on calculations using simplified cores), and that these
results should mainly be seen as pre-calculations before a full analysis for the SAR reports. If a
real core design were to attain these results, the core would have to be redesigned.
High importance parameters have been found (proprietary) using the least squared fitting
technique, and if weight should be put on gaining experimental data to obtain distributions for
4% of the
results
96% of the
results
95th
percentile
43 DISCUSSION
parameters, these parameters are of the highest priority (at least for this type of PI transient).
Coupling BASH scripts with a mathematically based programming language would present the
opportunity to use any distribution that can be obtained from measured data. This would remove
the need for distribution tests (such as the AD test). As a best estimate result is the desired
product for this methodology, setting conservative values or uniform distributions for parameters
with unknown distributions will not give best estimate results. The results will hopefully be
skewed toward a conservative value. Calling this methodology best estimate may be misleading,
and it must be clear that the results are conservatively skewed (hopefully).
Since the least squared fitting procedure was used the main important parameters could be found.
Parameters to consider in future conservative calculations were found and can be implemented.
The least square fitting procedure theoretically seems to be a good method for understanding the
system, but this is only the case when a small amount of parameters are analyzed. In this case
where 41 parameters were analyzed, using this method became difficult. The combinations of
parameters can be confusing and give high importance to parameter combinations that seem
illogical. These seemingly erroneous results may be due to statistics, and demonstrates that this
method is only applicable for a limited amount of input parameters. If a sensitivity study is
desired for a specific parameter, an approach could be to only include parameters which are
known to be linked (or hypothetically has a combining effect) in order to remove statistical
influences from parameters that are known not to have combining effects. For most input data
the results were also hard to interpret as they included both negative and positive values, as can
be seen in Figure 31. This made it hard to conclude if the input parameter was conservatively
low or high, and was the main reason only the first order polynomial fit was used. The second
order fitting can be used if fewer amounts of input parameters are included, where hopefully the
results are easier to interpret.
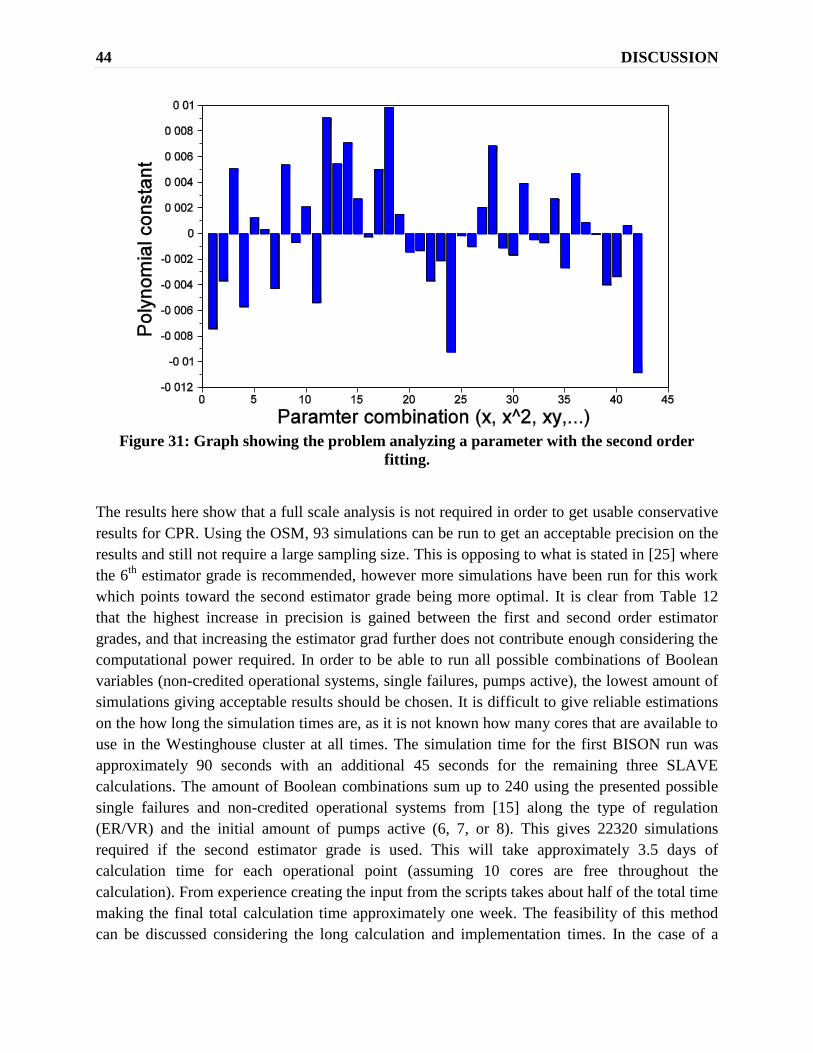
44 DISCUSSION
Figure 31: Graph showing the problem analyzing a parameter with the second order
fitting.
The results here show that a full scale analysis is not required in order to get usable conservative
results for CPR. Using the OSM, 93 simulations can be run to get an acceptable precision on the
results and still not require a large sampling size. This is opposing to what is stated in [25] where
the 6th
estimator grade is recommended, however more simulations have been run for this work
which points toward the second estimator grade being more optimal. It is clear from Table 12
that the highest increase in precision is gained between the first and second order estimator
grades, and that increasing the estimator grad further does not contribute enough considering the
computational power required. In order to be able to run all possible combinations of Boolean
variables (non-credited operational systems, single failures, pumps active), the lowest amount of
simulations giving acceptable results should be chosen. It is difficult to give reliable estimations
on the how long the simulation times are, as it is not known how many cores that are available to
use in the Westinghouse cluster at all times. The simulation time for the first BISON run was
approximately 90 seconds with an additional 45 seconds for the remaining three SLAVE
calculations. The amount of Boolean combinations sum up to 240 using the presented possible
single failures and non-credited operational systems from [15] along the type of regulation
(ER/VR) and the initial amount of pumps active (6, 7, or 8). This gives 22320 simulations
required if the second estimator grade is used. This will take approximately 3.5 days of
calculation time for each operational point (assuming 10 cores are free throughout the
calculation). From experience creating the input from the scripts takes about half of the total time
making the final total calculation time approximately one week. The feasibility of this method
can be discussed considering the long calculation and implementation times. In the case of a

45 DISCUSSION
large number of Boolean variables, the amount can first be reduced by using nominal values (not
remove all but the least limiting) and after this try all different combinations remaining with the
second order estimate grade.
Considering the large amount of simulations tested, BISON performed extremely well. Crashed
simulations were mainly due to illogical problems with the scripts (perhaps due to
communication problems with the Linux cluster). Few cases presented instabilities, the reason
for this could not be found.

46 DISCUSSION
47 CONCLUSION
6. CONCLUSION
This work can conclude several things regarding low power transients as well as the new BE
methodology. The main conclusions regarding this PI transient at reduced power can be
summarized as follows:
Low powers and high core flows generally reduce the impact of the PI transient on the
CPR.
A threshold effect exists below the upper line; however results point toward the ICPR
increasing more than the ΔCPR. So far the upper line seems to be the limiting initial
operational conditions for this transient.
The conservative methodology under predicts the transient impact at the upper line at
6500 kg/s core flow when comparing to the BE methodology.
These conclusions greatly reduce the area of interest in the operational map for future research
regarding PI transients, and shows that the threshold effect is of high interest for investigation.
The BE methodology mainly gave similar results as in previous conservative approaches (except
for some special cases), and shows that this methodology can be considered for future
application. The OSM can be used, where using the second estimator grade is recommended. By
using the second estimator grade the amount of simulations required are reduced enabling to run
an increased amount of Boolean variable combinations (single failures, non-credited operational
systems, pumps etc.).
This work has also found that today’s conservative methodology may need to include more
parameters in the safety analyses.

48 CONCLUSION
49 BIBLIOGRAPHY
BIBLIOGRAPHY
[1] H. Anglart, "Applied Reactor Technology," 2011.
[2] J. Lindberg, "Oskarshamn 3, Anläggningsdata för transientanalys med BISON,"
Westinghouse Electric Sweden AB, Västerås, 2013.
[3] KSU, "Härddrift O3," Kärnkraftsäkerhet och Utbildning AB, Nyköping, 2006.
[4] J. Persson et.al, "Lastföljning i Kärnkraftverk, Elforsk rapport 12:08," Elforsk, Stockholm,
2011.
[5] D. Palko, "Fast Transient and ATWS Methodology Topical Report (LTR-3) Demonstration
Analysis, SET 10-212," Westinghouse Electric Sweden AB, Västerås, 2010.
[6] C. Hagdorn, "Oskarshamn 3 Referensrapport till SAR Metodiktbeskrivning för
transientanalys map bränslekapslingens integritet Tryckökningshändelser, SES 05-079,"
Westinghouse Electric Sweden AB, Västerås, 2007.
[7] A. Gunsell, "Transientanalyser vid översyn av nytt driftområde för Forsmark 1 och 2,"
Forsmark Kraftgrupp AB, Östhammar, 2003.
[8] J. Isaksson, "Transientanalys för Forsmark block 2 och 3, Studie av hur val av driftpunkt
och pumpreglering påverkar torrkokningsgränsvärdet," Uppsala Universitet, Uppsala, 2010.
[9] Statens Kärnkraftinspektion, "Störningshanboken BWR," Statens Kärnkraftinspektion,
Stockholm, 2003.
[10] S. Björe, "Forsmark 3 - Säkerhet under avställningar, Förstudie för ned-/uppgång samt kall
avställd reaktor, Sammanfattning," Forsmark Kraftgrupp AB, Östhammar, 1995.
[11] D. Whitehead et al., "Evaluation of Potential Severe Accidents During Low Power and
Shutdown Operations at Grand Gulf, Unit 1," Sandia National Laboratories, Albuquerque,
1995.
[12] H. Bergersen, "F1, F2, F3 - Långvarig deleffektdrift, Påverkan på
torrkokningsgränsvärden," Forsmark Kraftgrupp AB, Östhammar, 2009.
[13] A. Aspman, "Forsmark 1,2, och 3, Metodik för cykelspecifik bestämning av
torrkokningsgränsvärden med BISON vid deleffektdrift," Forsmark Kraftgrupp AB,
Östhammar, 2011.
[14] H. Eisenberg, "Oskarshamn 3 - Säkerhetsrapport - Kapitel 6 - Avsnitt 6.15 - Cykelspecifika
analyser och driftbegränsningar," EON, Oskarshamn, 2012.
[15] C. Hagdorn, "Oskarshamn 3, Referensrapport till SAR, Transientanalys map
bränslekapslingens integritet, Tryckökningshändelser, SES 05-080," Westinghouse Electric
Sweden AB, Västerås, 2008.

50 BIBLIOGRAPHY
[16] K. Göller, "Oskarshamn 3 - Säkerhetsrapport - Kapitel 2 - Avsnitt 2.5 -
Konstuktionsstyrande händelseförlopp och acceptanskriterier," OKG, Oskarshamn, 2013.
[17] F. Waldemarsson, "Oskarshamn 3, Beräkningar av SLMCPR-gränser med McSLAP, BTA
13-0038," Westinghouse Electric Sweden AB, Västerås, 2013.
[18] H. Anglart, Thermal-Hydraulics in Nuclear Systems, 2010.
[19] D. Palko, "Fast Transient and ATWS Methodology, WCAP-17203-P," Westinghouse,
Pittsburg, 2010.
[20] K. M. Arvhult, "Validation of buoyant-mixing implementation in POLCA-T," Unpublished.
[21] L. Khirnaia, "Cross-section generation and core collapsing for transient analysis with
BISON - Buidlines, SET 09-108," Westinghouse Electric Sweden AB, Västerås, 2013.
[22] H. Svensson, "BISON - Revised axial power shape and reactivity fitting procedure, SET 09-
100," Westinghouse Electric Sweden AB, Västerås, 2011.
[23] J. Bergenstråle, "CalcNotes - berakningsanteckningar, Oskarshamn 3 - Projekt PULS /I
BISON-hardindata for analyser i SAR med I SVEA-96 Optima3, SET 13-038,"
Westinghouse Electric Sweden AB, Västerås, 2013.
[24] R. B. D'Augostino & M.A.Stephens, Goodness of Fit Techniques, New York: Marcel
Dekker, 1986.
[25] D. Palko, "Study of Direct Monte Carlo Method and Non-parametric statistics Method for
uncertainty analyses, SET 09-120," Westinghouse Electric Sweden AB, Västerås, 2009.