unconventional shale characterization …midra.uni-miskolc.hu/document/27766/23406.pdfunconventional...
TRANSCRIPT

Geosciences and Engineering, Vol. 5, No. 8 (2016), pp.32–50.
UNCONVENTIONAL SHALE CHARACTERIZATION USING
IMPROVED WELL LOGGING METHODS
ISTVÁN BIBOR1 –NORBERT PÉTER SZABÓ1, 2
1Department of Geophysics, University of Miskolc,
H-3515 Miskolc-Egyetemváros, Hungary 2MTA-ME, Geoengineering Research Group, Miskolc, Hungary
Abstract: This paper provides an overview of the well-logging methods currently used in
the evaluation of shale gas formations. The combination of natural gamma-ray spectrosco-
py, density, neutron, sonic and resistivity logging allows in-situ identification of unconven-
tional reservoirs and the calculation of their total organic matter content. We improve the
regression relation between the total organic content and parameter d estimated by the
Zhao’s method. The level of maturity as a key parameter should be a priori known, and is
treated as an arbitrarily chosen constant during the procedure. We suggest estimating the
optimal value of the maturity constant by reducing the misfit between the observed well
logs and theoretical logs calculated by the Passey’s model in an automated procedure. We
compare the results of the improved well-log-analysis methods with core measurements.
We recommend the use of multivariate statistical and inversion methods to explore the
lithologic and petrophysical characteristics from independent sources, which may help in
resolving the ambiguity frequently encountered with the interpretation of unconventional
formations.
Keywords: well logging, unconventional reservoir, shale gas, total organic content, level of
maturity.
1. INTRODUCTION
The world’s petroleum consumption has been growing steadily since the 1950s.
The continuous rise in living standards and demand entailed increased oil and gas
production, which helped the oil industry to take a leading role in the energy sector.
However, the Earth's hydrocarbon reserves are declining globally. To reach more
resources, significant technological progress is going on today, which allows the
exploitation of complex reservoirs previously thought unattainable. Conventional
hydrocarbon formations such as sediments with high porosity and permeability can
be easily and cheaply produced, but they are relatively small in number and contain
just a small percentage of the Earth’s stored hydrocarbons. The production of ex-
tra-low permeability reservoirs is more expensive and technically challenging;
however, the price of hydrocarbons and the continuous rise of new technologies
have enabled their efficient operation. Unconventional reservoirs are of great im-

Unconventional Shale Characterization Using Improved Well Logging Methods 33
portance, because they comprise a significant portion of the Earth's hydrocarbon
reserves. The first exploited unconventional reservoir types were heavy oils and oil
sands. However, extensive production can be primarily connected to shale gas for-
mations found in the USA. After the successful production of the Barnett Shale,
several North American shale reservoirs have been utilized, e.g. the Wolfcamp,
Ford-Eagle, Haynesvillem, Fayetteville, Marcellus, Bakken, Woodford, Montney
and Niobrara formations [1].
Unconventional reservoirs constitute a complex geological and petrophysical
system. They have a number of subtypes, e.g. shale gas, shale oil, heavy oil, gas
hydrates, coal-bed methane and tight gas sand [2]. Two large groups of unconven-
tional reservoirs can be distinguished based on their relation to the source rock. The
first group includes those formations where the reservoir is different from the
source rock, and the original conventional reservoir is transformed into a non-
conventional one. The second group practically consists of source rock reservoirs.
During their generation, the sediment with high organic matter content is buried
and comes under heat. With time and sufficient pressure and temperature condi-
tions, the organic material changes to kerogen, then to hydrocarbon. During the
evolution of hydrocarbon, the pore space is filled up and its pressure increases. The
pressure increase may reach a critical value when the rock cracks and loses its hy-
drocarbon content, thereby feeding the migration routes. If the pore pressure does
not exceed the critical level, the resulting hydrocarbons remain in the source rock,
creating unconventional reservoirs [1]. These types of reservoirs are typically made
up of fine-grained rocks, amongst which pore size of micro- and nanometer order is
reached [3].
In this study, we focus on the exploration of shale reservoirs. The composition
of shale gas formations may vary between wide ranges. They contain mainly quartz
and clay minerals and carbonates. The relative amounts of these constituents vary
widely, but normally good quality shale reservoirs generally have high silica con-
tent. The permeability of reservoirs is low (< 0.1 mD) and the gas and oil are found
in small pore spaces, bound to the remaining organic matter or on the surface of
clay minerals. Their production requires increasing porosity, which is implemented
by using horizontal drilling technologies and high volume hydraulic fracturing [1].
Significant shale gas reserves are found in China, Argentina, the United States,
Canada and Australia. Among them, China has the largest amount of stocks, name-
ly 1,115 trillion cubic feet. In Europe, the biggest shale gas potential has been con-
firmed in Poland, where the resource amounts to 148 trillion cubic feet [4]. In this
paper, we present the theory and application of the well-logging methods currently
used to detect shale reservoirs of high organic content. We study the possible fur-
ther development of these methods using an improved regression analysis and pa-
rameter optimization, and give preliminary results for two case studies.
34 István Bibor–Norbert Péter Szabó
2. PETROPHYSICAL MODELING OF SHALE RESERVOIRS
Unconventional reservoirs are complex structures; thus, the determination of their
petrophysical properties represents one of the major challenges for well log ana-
lysts. Traditional well-logging methods used in the exploration of conventional
reservoirs often do not work, and the relation between the measured quantities and
petrophysical parameters is not always consistent or known. However, in order to
produce hydrocarbons economically, the knowledge of these parameters is of
prime importance. To reduce the ambiguity of the interpretation, multidisciplinary
approaches are normally followed, in which the results of well log analysis are
validated using laboratory data and other information originating from geological,
petrophysical, geophysical and geotechnical sources.
The petrophysical properties of shale reservoirs to be determined are the Total
Organic Content (TOC), porosity Φ, pore-size distribution, pore geometry, hydro-
carbon and water saturation, fractional volumes of matrix-forming minerals, clay
volume, permeability, elastic parameters, and stress conditions. Shale formations
are normally easily identified; however, it is a more complicated issue to determine
whether they contain hydrocarbons. Among the above listed parameters, the best
indicator is TOC, which specifies the amount of organic matter in the formation, by
weight. PASSEY et al. [5] distinguished three possible rock types, i.e. organic mat-
ter-free rock, organic matter rich immature rock, or mature source rock. The first
type consists of the rock matrix and water occupying the pore space (Figure 1a). In
the general case, the rock matrix is made up of several minerals, the relative
amounts of which have to be determined. The organic matter in immature rocks is
located dispersedly between the rock particles (Figure 1b). With increase in com-
paction, in many cases, the particles of organic matter are arranged in horizontal
lamellae. During the process of maturation, the organic material, formed into kero-
gen, becomes sufficiently ductile to be pressed into the pore space. As the matura-
tion progresses, some of the organic material is converted into liquid or gaseous
hydrocarbon which migrates into the pores, displacing the originally stored water
(Figure 1c).
ZHAO et al. [6] suggested a slightly different petrophysical model for organic
matter-free rocks by taking into account the clay content of the formation (Figure
1d). For organic matter-rich rocks, the previous model is supplemented by a fourth
phase representing the kerogen (Figure 1e). The two models are basically the same,
describing the organic content as part of the rock matrix. Thus, the fundamental
task in organic matter-rich formations is the estimation of total organic content, the
matrix volume and hydrocarbon-saturated porosity.
It must be mentioned that there are more sophisticated rock models, in which
the matrix is subclassified into non-clay minerals, silt and clay, and the water vol-
ume is further divided into mobile, capillary and clay-bound water, and into free
hydrocarbons and absorbed gas. An improved interpretation workflow is presented
by HOLMES et al. [7], which is applied successfully to the biggest shale gas reser-
voirs in the USA.

Unconventional Shale Characterization Using Improved Well Logging Methods 35
Figure 1.
Petrophysical models used for the interpretation of unconventional reservoirs:
rock models (a)–(c) (PASSEY et al. [5]) and (d)–(e) (ZHAO et al. [6])
3. WELL LOGGING IN SHALE RESERVOIRS
The in-situ identification of unconventional reservoirs is based on the use of well
logging methods. BEERS [8] first studied natural radioactivity and its possible links
with organic content. This is because in sedimentary rocks containing organic mat-
ter the concentration of uranium increases [9], [10], [11]. High natural gamma-ray
intensity (GR) values are mostly associated to the uranium content, while the clay
content does not necessarily increase [1]. Uranium-rich sediments are formed in
marine conditions, where the uranium is bound to planktonic matter and other ma-
rine deposits. The uranium concentration is governed by four factors, i.e. uranium
content at the age of deposition, type of the deposited organic matter, chemical
conditions at the water-sediment boundary and the velocity of sedimentation [10].
In lacustrine sediments, due to the lack of uranium ions, the increased uranium
concentration is not typical.
Since the resistivity of both organic matter and hydrocarbons is high, we meas-
ure high apparent resistivities in unconventional shales [9]. In the analysis of resis-
tivity logs, the composition of the rock matrix must be taken into account, e.g. py-

36 István Bibor–Norbert Péter Szabó
rite is also a common building block in organic-rich layers, the amount of which
must be considered. A linear relation was observed between the amount of organic
material and pyrite concentration [12]. The clay volume in shale reservoirs may reach
30–40 v/v. If the salinity of pore fluid is low and the matrix does not contain conduc-
tive minerals, the clay conductivity should be added to the rock conductivity.
The three most commonly used porosity measurements are acoustic, compen-
sated density, and compensated neutron logs. All three methods respond to the
presence of organic matter because of its physical properties. Depending on its
composition, the organic material has an average density of 1 g/cm3, sonic transit-
time of 180 μs/ft, and hydrogen index of 0.67 [13]. The organic matter in mature
reservoirs is indicated by high porosities. The presence of organic matter, due to its
low P-wave velocity, gives high acoustic-interval times [14], which is also affected
by the mineral composition, porosity, and type of pore-filling fluid. The bulk densi-
ty of shale gas formations is normally low, which is due to the low density of the
organic matter. The neutron-porosity response is mostly influenced by the hydro-
gen content of organic matter, pore water, and hydrocarbons and the clay volume.
Other advanced logging technologies can also be used for lithology identification
(e.g. spectral GR and photoelectric absorption index logs), improved estimation of
porosity and permeability (e.g. nuclear magnetic resonance log), and mechanical
characterization (e.g. full waveform sonic log).
4. EVALUATION OF SHALE GAS RESERVOIRS
Several well-logging methods can be used for the determination of the organic
material content. SCHMOKER [15] suggested the use of the density log with the
condition that the heavy minerals like pyrite must be taken into account for the
interpretation. The correlation between the natural gamma-ray intensity and organ-
ic content also allows the suitable determination of TOC [16]. Spectral gamma-ray
logging is used to estimate the uranium, thorium, and potassium content of the
formation. Since there is a strong correlation between the TOC and uranium con-
tent, the well logs of uranium versus thorium and uranium versus potassium ratios
are also applicable [17]. The difference between the potassium/thorium and urani-
um logs shows an empirical correlation to the organic matter content [14]. Another
alternative is the use of the carbon-oxygen-ratio log, which gives the total carbon
content of the formation [18]. This log should be corrected to the amount of calci-
um, which provides a possibility to distinguish inorganic and organic carbon
sources. The combination of different log types provides a more reliable estimation
of organic matter content. Most of these techniques are based on the simultaneous
processing of porosity and resistivity logs [16], [19], [20]. The following subsec-
tions present the interpretation methods used in this paper and give an overview of
those that can be used in future studies.

Unconventional Shale Characterization Using Improved Well Logging Methods 37
4.1 The logR method
The Passey method and its industrial software implementation form one of the
most widespread well logging methods for the estimation of TOC. It is based on
the combination of sonic and resistivity measurements, both sensitive to the pres-
ence of organic matter. Sonic data responds to its low density and acoustic trav-
eltime, while resistivity values are increased because of its high resistivity [5]. We
plot the two well logs on the same track in a reverse scale. The two curves are ap-
propriately scaled so that one segment of 100 μs/ft on the linear scale of the acous-
tic log is equal to two decades on the logarithmic scale of the resistivity log. For
describing the difference between the acoustic traveltime t and resistivity R
curves, the following variable was introduced:
base
base
ttR
RR
50
1loglog 10 , (1)
where Rb and tb denote the resistivity reading and acoustic traveltime observed at
the baseline, respectively. In fine-grained organic-matter-free (water saturated)
shaly formations, both curves run along the baseline, while they are separated from
each other in organic matter-rich shale reservoirs [5]. The separation between the
two curves is directly proportional to the TOC. The method assumes a nearly linear
connection between quantities logR and TOC. This connection holds only when
the constant value of Level of Organic Maturity (LOM) is known; LOM is normal-
ly measured in the laboratory. An estimate can be given to the value of TOC by
using
LOM10logTOC baR , (2)
where the default values of regression constants are a = 2.297 and b= 0.1688 [5].
The TOC is estimated in weight percent, which must be corrected for the original
organic carbon content of the shale (it is 0.8%). If the sonic log is not available,
the following empirical formulae can be used analogously to Equation (1)
baseNN
base
N ΦΦR
RR ,10 4loglog
, (3)
basebb
b
DR
RR ,10 5.2loglog
, (4)
where ΔlogRN and ΔlogRD are the logarithmic deviation of the density and neutron
log from the resistivity log, respectively, ΦN is the neutron porosity, ΦN,base is the

38 István Bibor–Norbert Péter Szabó
baseline value of neutron porosity, ρb is the bulk density and ρb,base is the bulk den-
sity observed at the baseline. The crossover between the properly scaled well logs
in Equations. (3)–(4) is proportional to the quantity of organic matter [2].
Several authors have proposed modification of the logR method. SONDER-
GELD et al. [11] observed that the traditional method tends to overestimate the val-
ue of TOC in over-matured reservoirs. They introduced an empirical correction
factor, which was used to multiply the right side of Equation (2). WANG et al. [21]
pointed out that the mineral composition of shale reservoirs may vary between
wide limits, which may result in erroneous conclusions in the evaluation of reser-
voirs with complex lithology. PASSEY et al. [5] modified Equation (2) by incorpo-
rating the acoustic traveltime of the rock matrix and cementation factor. Instead of
using LOM in the Passey model, in some cases, the maximum temperature of hy-
drocarbon generation (Tmax) is recommended. Further improvements can be made
by incorporating natural gamma-ray intensity readings, too [21]. RENCHUN et al.
[17] changed the original equation of the Passey model to comprise simultaneously
the differences of resistivity, density, and acoustic logs.
4.2 The d method
The method introduced by ZHAO et al. [6] is based on the joint use of the compen-
sated neutron, density, and natural gamma-ray logs. In the frame of the method, a
clay indicator is calculated from the porosity logs, which are then compared to the
natural gamma-ray intensity log. Once the clay volume is known, the residual sig-
nal provides information on the organic matter content. The method is feasible in
reservoirs that show increased radioactivity but low potassium content. Since the
neutron log is influenced by the clay-bound porosity and the density is not, the
difference between them gives information on the clay volume. The clay indicator
is calculated as
aD,aN,cl ΦΦI , (5)
where ΦN,a (v/v) and ΦD,a (v/v) are the apparent neutron and density porosity, re-
spectively. The GR and Icl logs are plotted on the same track. In a formation with
low organic content, the two logs overlap, while in organic-rich intervals they are
separated from each other. The degree of separation is measured by the following
derived parameter
min,max,
min,
minmax
min
clcl
clcl
II
II
GRGR
GRGRd
, (6)
where GRmin and GRmax are the extreme values of the gamma-ray log, Imin and Imax
are those of the clay indicator. According to ZHAO et al. [6], the parameter d de-

Unconventional Shale Characterization Using Improved Well Logging Methods 39
fined in Equation (6) is linearly proportional to TOC, where the regression coeffi-
cients must be estimated for the given measurement area.
4.3 Advanced methods for shale gas evaluation
Substantial expansion has occurred in the use of Nuclear Magnetic Resonance
(NMR) logging for the exploration of conventional hydrocarbon formations. The
application of NMR, which is used to measure the effective porosity, has begun in
the case of unconventional reservoirs as well. HOOK et al. [22] suggested the com-
bined use of NMR and compensated density logs. The organic matter is displayed
as part of the total porosity on the density log, while the NMR porosity does not
indicate organic matter. The TOC can thus be inferred from the difference between
the two porosity logs. The simultaneous use of NMR and sonic logs was suggested
by JACOBI et al. [23]. WOLANSKI et al. [24] added spectral gamma-ray logs for the
evaluation of TOC, which was estimated as the difference between the NMR-
derived and geochemical log-derived porosities.
Artificial intelligence methods have an increasingly important role in the deter-
mination of organic matters. Neural network approaches have been efficiently used
for the calculation of TOC in several cases [25], [26], [27], [28]. The use of neural
networks assumes a complex nonlinear relation between the well logs and TOC.
The effectiveness of the problem solution depends largely on the teaching process,
which establishes the connection between the well logs as input and TOC as de-
sired output in the study area. The output is then estimated by optimizing the model
parameters of the network, i.e. weight coefficients that define the contribution of
input signals at each neuron organized in a multilayered network structure.
Multivariate statistical methods are also a powerful tool in the interpretation of
well logs. WAWRZYNIAK-GUZ et al. [29] applied a factor analysis technique for the
characterization of Paleozoic shale gas formations. The study confirmed the great
heterogeneity of the investigated formations and revealed different correlations
between the petrophysical properties derived from well logs and extracted factors
responsible for most of the variance of the observed data. SZABÓ and DOBRÓKA
[30] published an improved factor analysis method for the robust estimation of
reservoir shaliness in shaly sand and carbonate reservoirs. The same methodology
was successfully used in fractured dolomite aquifers to calculate the hydraulic con-
ductivity as a related quantity to shale volume along the borehole [31]. Normally
high GR values and low resistivity indicate low porosity shales. In the study in
question, high permeability is related to argillaceous shales with high porosity.
This is because of the oriented texture of the rock upon which the clay formations
are considered permeable. However, this does not follow from neither the GR nor
the ΦN log. The resistivity tools with different penetration in the fractured for-
mation indicate the permeable rock. The joint interpretation of nuclear and resistiv-
ity logs effectively reveals the reservoir zones by means of factor analysis. The
improvement of the resistivity forward problem is also of high importance to better

40 István Bibor–Norbert Péter Szabó
model the response of the resistivity tools and to solve the related inverse problem
more accurately [32], [33], [34].
Cluster analysis may also help in the identification and classification of shale
reservoirs. SZABÓ et al. [35] developed a hierarchical cluster analysis assisted
global inversion technique to estimate the layer thicknesses and zone parameters in
conventional hydrocarbon reservoirs. The rock matrix of unconventional reservoirs
is generally made up of several minerals, the relative amounts of which should be
estimated as accurately as possible. The models illustrated in Figure 1 include sev-
eral other parameters to be determined, too. Local (depth-by-depth) inversion tech-
niques traditionally used in well-log analysis can give an estimate for fewer petro-
physical parameters than data measured in the point. In case of complex reservoirs,
there are many more petrophysical and zone parameters than data, which leads to
an ambiguous (underdetermined) inverse problem. To increase the data-to-
unknowns ratio and stability, we suggest the use of the interval inversion method,
which inverts a data set of a longer depth interval jointly. By using a series expan-
sion-based discretization approach, the inverse problem is solved for a far lower
number of inversion unknowns than data to reduce the estimation error of the mod-
el parameters. An application to multimineral hydrocarbon formations was pub-
lished by DOBRÓKA et al. [36].
5. CASE STUDIES
5.1 Estimation of total organic content
We improve the d method and test it on the same well-logging data set originally
used by ZHAO et al. [6], which was collected in the Sichuan Basin, South-West
China. The investigated formation is mainly made up of calcareous shale with a
thickness varying between 20–120 m. We analyze the natural gamma-ray intensity
(GR), compensated density (DEN) and neutron-porosity (CEN) logs for estimating
the TOC, which is approximately 1–3% according to core measurements. After
calculating the apparent density- and neutron-porosities, we calculate the values of
d along the well. For this, we use the following zone parameters: GRmin = 108,
GRmax = 550, Icl,min = –0.22, Icl,max = 0.8. We study the relation between the TOC
measured on core samples and parameter d estimated by Equation (6). By plot-
ting the TOC and Δd values, Figure 2 shows that the relation is much more nonlin-
ear than linear, as originally suggested by [6]. For a more accurate interpretation,
especially in the domain of large d values, we suggest the use of the regression
model
d e1TOC , (7)
where , , , are site-specific regression coefficients which should be deter-
mined at the well site. The optimal values of regression coefficients are estimated

Unconventional Shale Characterization Using Improved Well Logging Methods 41
by the minimization of the misfit between the observed TOC values and those cal-
culated by Equation (7). We use the Marquardt algorithm for solving the least
squares inverse problem [37]. For the Sichuan Basin, we obtain the following re-
gression coefficients: = 4.29, = 0.85, = 55, = 3.
Figure 2.
Nonlinear regression relation between total organic matter content and parameter
d estimated by Equation (6) in the Sichuan Basin
The result of well log analysis is illustrated in Figure 3. The separation between the
GR and Icl curves is directly proportional to the amount of organic matter in the
shales. A potential shale gas zone is indicated by the well logs between 710 and
805 m. The highest values of TOC are around 790–800 m, where it increases up to
5%. The reservoir is also confirmed by high GR, low DEN and CN values.
5.2 Determination of maturity level
We test the ΔlogR method using acoustic (AC), natural gamma-ray intensity (GR)
and deep resistivity (RES) logs measured in the Barnett shale, Texas, USA [7]. The
Barnett Shale is a siliceous shale, calcareous and dolomitic sedimentary formation,
which is rich in silicates (30–50%) but poor in clay minerals (<30%). Its average
depth is 8,500 feet, and the thickness varies between 50 and 400 feet. The estimat-
ed gas content of the formation is significant, it is approximately 5.78∙109 m3 [38].
The method allows the estimation of TOC by using Equation (2), which re-
quires preliminary knowledge of the level of maturity. We use TOC data deter-
mined in the laboratory for calculating the optimal value of LOM. We introduce

42 István Bibor–Norbert Péter Szabó
the data distance as the root mean square error between the measured TOC values
and the calculated ones
(%)1001
2/1
1
2
N
i
calc
i
meas
i TOCTOCN
RMS . (8)
where N is the number of core data. The RMS versus LOM relation for Barnett
shale is given in Figure 5.
Figure 3.
Total organic matter content estimation by the improved d method
in the Sichuan Basin
Unconventional Shale Characterization Using Improved Well Logging Methods 43
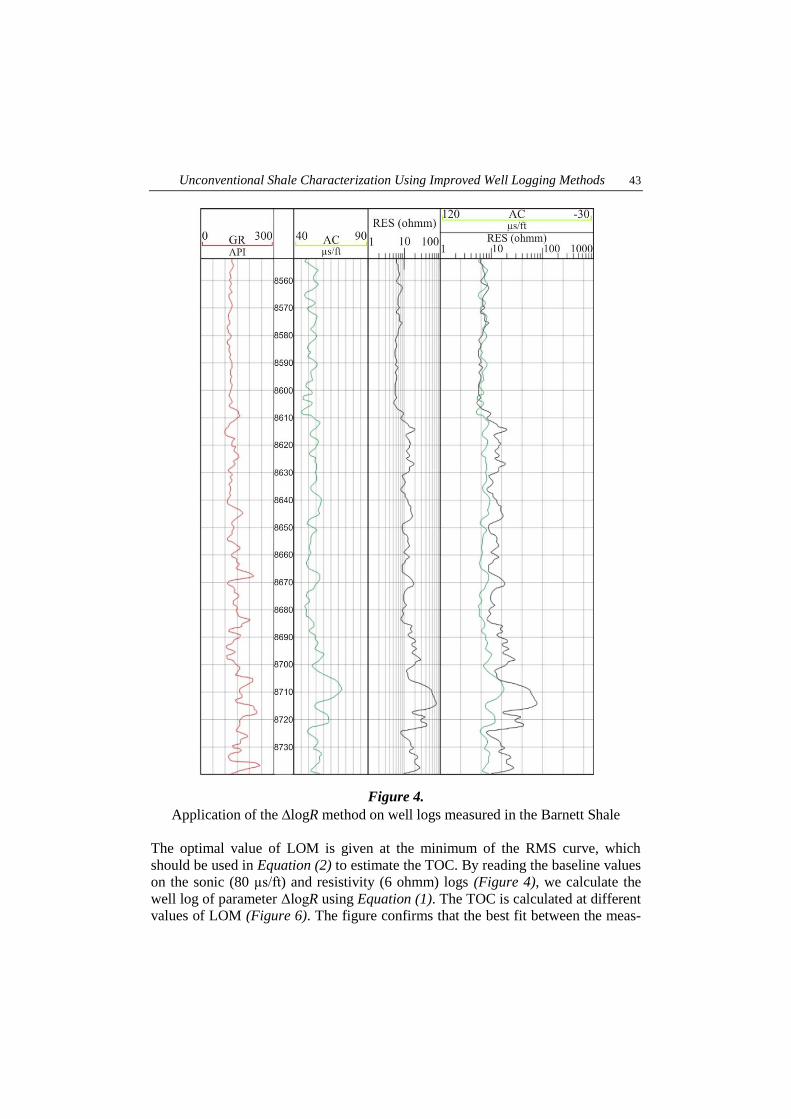
Figure 4.
Application of the logR method on well logs measured in the Barnett Shale
The optimal value of LOM is given at the minimum of the RMS curve, which
should be used in Equation (2) to estimate the TOC. By reading the baseline values
on the sonic (80 µs/ft) and resistivity (6 ohmm) logs (Figure 4), we calculate the
well log of parameter ΔlogR using Equation (1). The TOC is calculated at different
values of LOM (Figure 6). The figure confirms that the best fit between the meas-

44 István Bibor–Norbert Péter Szabó
ured and calculated TOC is given by LOM = 8.4. The result agrees well with data
in the literature, e.g. CRAIN [39] suggests a LOM 8.5 for shale gas reservoirs.
Figure 5.
Determination of maturation level by the minimization of data prediction error
Figure 6.
Observed and calculated
organic matter content at
different
maturity levels
in the Barnett Shale

Unconventional Shale Characterization Using Improved Well Logging Methods 45
6. CONCLUSIONS
In this paper, an overview is given on the evaluation of shale gas reservoirs using
well-logging methods. We suggest two improved methods for a more accurate
estimation of total organic matter content. A nonlinear regression model is assumed
between the organic matter content and parameter d suggested previously by
ZHAO et al. [6]. The level of maturity should be optimized for a better estimation of
organic content. We suggest reducing the misfit between the TOC values calibrated
by lab measurement and predicted TOC by the Passey model. We recommend the
use of multivariate statistical and inversion methods to explore the lithologic and
petrophysical characteristics from independent sources, which may help in resolv-
ing the ambiguity frequently encountered with the interpretation of unconventional
formations. A robust form of cluster and factor analysis may help in the identifica-
tion and reserve calculations. Factor analysis explores the connections between the
well-logging data set and the petrophysical properties of shale gas formations. By
the interval inversion of well logs, it becomes possible to an estimate for the petro-
physical parameters of unconventional reservoirs. The added advantage of the in-
version approach is that it can give an estimate also for the layer thicknesses and
zone parameters, including their estimation errors.
ACKNOWLEDGEMENTS
This research was supported by the GINOP-2.3.2-15-2016-00010 “Development of
enhanced engineering methods with the aim at utilization of subterranean energy
resources” project in the framework of the Széchenyi 2020 Plan, funded by the
European Union, cofinanced by the European Structural and Investment Funds.
Special thanks for providing the data set go to Mr. Peiqiang Zhao (Sichuan Basin)
and Mr. Michael Holmes (Barnett Shale).
LIST OF SYMBOLS
Symbol Description Unit
a Regression constant
AC Acoustic traveltime data s/ft
b Regression constant
CEN Neutron-porosity data v/v
DEN Compensated density data g/cm3
GR Natural gamma-ray intensity data API
GRmin Minimal values of the gamma-ray log API
GRmax Maximal values of the gamma-ray log API
Icl Clay indicator v/v
Icl,min Minimal values of the clay indicator v/v
Icl,max Maximal values of the clay indicator v/v

46 István Bibor–Norbert Péter Szabó
Symbol Description Unit
LOM Level of Organic Maturity
NMR Nuclear Magnetic Resonance log
R Resistivity curves ohmm
Rb Resistivity reading at the baseline ohmm
RES Deep resistivity data ohmm
Tmax Maximum temperature of hydrocarbon
generation C
TOC Total Organic Content %
TOCmeas Measured value of the Total Organic
Content %
TOCcalc Calculated value of the Total Organic
Content %
Site-specific regression coefficient –
Site-specific regression coefficient –
Site-specific regression coefficient
t Acoustic interval-time data s/ft
tb Acoustic traveltime reading at the baseline s/ft
ΔlogRN Logarithmic deviation between the neutron
and resistivity logs
ΔlogRD Logarithmic deviation between the density
and resistivity logs
site-specific regression coefficient
ρb Bulk density data g/cm3
ρb,base Bulk density at the baseline g/cm3
Φ Porosity v/v
ΦN Neutron porosity data v/v
ΦN,base Baseline value of neutron porosity log v/v
ΦN,a Apparent neutron-porosity data v/v
ΦD,a Apparent density-porosity data v/v
REFERENCES
[1] MA, Y.: Unconventional Resources from Exploration to Production. In: MA,
Y.–HOLDITCH S. (ed.): Unconventional Oil and Gas Resources Handbook.
Elsevier, Waltham, 2016, 3–52.
[2] BJØRLYKKE, K.: Unconventional Hydrocarbons: Oil Shales, Heavy Oil, Tar
Sands, Shale Oil, Shale Gas and Gas Hydrates. In: BJØRLYKKE, K. (ed.): Pe-
troleum Geoscience – From Sedimentary Environments to Rock Physics.
Springer-Verlag, Berlin, 2015, 581–590.

Unconventional Shale Characterization Using Improved Well Logging Methods 47
[3] MEHDI, L.–REZA, R.: Petrophysical Evaluation of Gas Shale Reservoirs. In:
REZA, R. (ed.): Fundamentals of Gas Shale Reservoirs. Wiley, New Jersey,
2015, 117–138.
[4] STARK, M.–ZHAO, S.–PEREIRA, P.–HEYES, N.–DENG, D.–BLANCO, F.–
CHUDZIAK, J.–DAVID, M.–NOUWAILATI, K.–KORNELIUS, S.: International
Development of Unconventional Resources: If, where and how fast? Accen-
ture PLC, Dublin, 2014.
[5] PASSEY, Q. R.–CREANEY, S.–KULLA, B. J.–MORETTI, F. J.–STROUD, J. D.:
A Practical Model for Organic Richness from Porosity and Resistivity Logs.
AAPG Bulletin, 1990, 74(12), 1777–1794.
[6] ZHAO, P.–MAO, Z.–HUANG, Z.–ZHANG, C.: A new method for estimating
total organic carbon content from well logs. AAPG Bulletin, 2016, 100(8),
1311–1327.
[7] HOLMES, M.–HOLMES, A.–HOLMES, D.: A Petrophysical Model for Shale
Reservoirs to Distinguish Macro Porosity, Free Shale Porosity, and TOC.
AAPG ACE, 2012.
[8] BEERS, R. F.: Radioactivity and Organic Content of Some Paleozoic Shales.
AAPG Bulettin, 1945, 29(1), 1–22.
[9] AUTRIC, A.–DUMESNIL, P.: Resistivity, Radioactivity And Sonic Transit
Time Logs To Evaluate The Organic Content Of Low Permeability Rocks.
The Log Analyst, 1985, 26(03), 36–45.
[10] SCHMOKER, J.: Determination of Organic-Matter Content of Appalachian
Devonian Shales from Gamma-Ray Logs. AAPG Bulletin, 1980, 65(7),
1285–1298.
[11] SONDERGELD, C. H.–NEWSHAM, K. E.–COMISKY, J. T.–RICE, M. C.–RAI,
C. S.: Petrophysical Considerations in Evaluating and Producing Shale Gas
Resources. SPE Unconventional Gas Conference, Pittsburgh, Pennsylvania,
USA, 2010, 23–25 February.
[12] WITKOWSKY, J.–GALFORD, J.–QUIREIN, J.–TRUAX, J.: Predicting Pyrite and
Total Organic Carbon from Well Logs for Enhancing Shale Reservoir Inter-
pretation. SPE Eastern Regional Meeting, Lexington, Kentucky, USA, 2012,
3–5 October.
[13] MENDELZON, J. D., TOKSÖZ, M. N.: Source Rock Characterisation Using
Multivarivariate of Log Data. SPWLA 26th Annual Logging Symposium,
Dallas, Texas, USA, 1985, 17–20 June.
[14] FERTL, W. H.–CHILINGAR, G. V.: Total organic carbon content determined
from well logs. SPE Formation Evaluation, 1988, 3(02), 407–419.

48 István Bibor–Norbert Péter Szabó
[15] SCHMOKER, J.: Determination of Organic Content of Appalachian Devonian
Shales from Formation-Density Logs. AAPG Bulletin, 1979, 63(9), 1504–
1509.
[16] MEYER, B.L.–NEDERLOF, M.H.: Identification of source rocks on wireline
logs by density/ resistivity and sonic transit time/resistivity cross plots.
AAPG Bulletin, 1984, 68(2), 121–129.
[17] RENCHUN, H.–YAN, W.–SIJIE, C.–SHUAI, L.–LI, C.: Selection of logging-
based TOC calculation methods for shale reservoirs: A case study of the
Jiaoshiba shale gas field in the Sichuan Basin. Natural Gas Industry, 2015,
2(2–3), 155–161.
[18] HERRON, S. L.–TENDRE, L.: Wireline Source-Rock Evaluation in the Paris
Basin. In: HUC, A. Y. (ed.): Deposition of Organic Facies. AAPG Studies in
Geology 30, 1990, 57–71.
[19] DELLENBACH, J.–ESPITALIE, J.–LEBRETON, F.: Source rock logging: Trans-
actions of the 8th European SPWLA Symposium. 1983.
[20] CARPENTIER, B.–HUC, A.Y.–BESSEREAU, G.: Wireline Logging and Source
Rocks – Estimation of Organic Carbon Content by the CARBOLBG@
Method. The Log Analyst, 1991, 32(03), 279–297.
[21] WANG, P.–CHEN, Z.–PANG, X.–HU, K.–SUN, M.–CHEN, X.: Revised models
for determining TOC in shale play: Example from Devonian Duvernay
Shale, Western Canada Sedimentary Basin. Marine and Petroleum Geology,
2015, 70, 304–319.
[22] HOOK, P.–FAIRHURST, D.–RYLANDER, E.–BADRY, R.–BACHMAN, N.–
CRARY, S.–CHATAWANICH, K.–TAYLOR, T.: Improved precision magnetic
resonance acquisition; application to shale evaluation. SPE Annual Technical
Conference and Exhibition 30, Denver, Colorado, USA, 2011.
[23] JACOBI, D. J.–BREIG, J. J.–LECOMPTE, B.–KOPAL, M.–HURSAN, G.–
MENDEZ, F.–BLIVEN, S.–LONGO, J.: Effective geochemical and geomechan-
ical characterization of shale gas reservoirs from the well bore environment:
Caney and the Woodford Shale. SPE Annual Technical Conference and Ex-
hibition, New Orleans, Louisiana, USA, 2009, 4–7 October.
[24] WOLANSKI, K.–OCHALIK, S.–BARANKIEWICZ, P.–KOZLOWSKI, M.–VICAN,
K.–BULLER, D.–BALLIET, R.: A Baltic Basin Shale Reservoir Integrated
Evaluation Using a Wireline Geochemical, NMR, and Acoustic Dipole
Workflow. SPWLA 56th Annual Logging Symposium, 2015, 18–22 July.
[25] HUANG, Z.–WILLIAMSON, A. M.: Artificial neural network modelling as an
aid to source rock characterization. Marine and Petroleum Geology, 1995,
13(2), 277–290.

Unconventional Shale Characterization Using Improved Well Logging Methods 49
[26] KHOSHNOODKIA, M.–MOHSENI, H.–RAHMANI, O.–MOHAMMADI, A.: TOC
determination of Gadvan Formation in South Pars Gas field, using artificial
intelligent systems and geochemical data. Journal of Petroleum Science and
Engineering, 2011, 78(1), 119–130.
[27] OUADFEUL, S.–ALIOUANE, L.: Total Organic Carbon Prediction in Shale
Gas Reservoirs from Well Logs Data Using the Multilayer Perceptron Neu-
ral Network with Levenberg Marquardt Training Algorithm: Application to
Barnett Shale. Arabian Journal for Science and Engineering, 2015, 40(11),
3345–3349.
[28] SHI, X.–WANG, J.–LIU, G.–YANG, L.–GE, X.–JIANG, S.: Application of ex-
treme learning machine and neural networks in total organic carbon content
prediction in organic shale with wire line logs. Journal of Natural Gas Science
and Engineering, 2016, 33, 687–702.
[29] WAWRZYNIAK-GUZ, K.–JARZYNA, J. A.–ZYCH, M.–BAŁA, M.–KRAKOWSKA,
P. I.–PUSKARCZYK, E.: Analysis of the heterogeneity of the Polish shale gas
formations by factor analysis on the basis of well logs. 78th EAGE Conference
and Exhibition, Extended Abstracts, 2016, paper Tu SBT3 07, 15.
[30] SZABÓ, N. P.–DOBRÓKA, M.: Robust estimation of reservoir shaliness by
iteratively reweighted factor analysis. Geophysics, 2017, 82(2), D69–D83.
[31] SZABÓ, N. P.: Hydraulic conductivity explored by factor analysis of bore-
hole geophysical data. Hydrogeology Journal, 2015, 23, 869−882.
[32] GALSA, A.–HEREIN, M.–DRAHOS, D.–HEREIN, A.: Effect of the eccentricity
of normal resistivity borehole tools on the current field and resistivity meas-
urement. Journal of Applied Geophysics, 2016, 134, 281–290.
[33] FALCO, P.–NEGRO, F.–SZALAI, S.–MILNES, E.: Fracture characterisation using
geoelectric null-arrays. Journal of Applied Geophysics, 2013, 93, 33–42.
[34] SZALAI, S.–SZARKA, L.–PRÁCSER, E.–MÜLLER, I.–TURBERG, P.: Geoelec-
tric mapping of near-surface karstic fractures by using null-arrays. Geophys-
ics, 2002, 67, 1769–1778.
[35] SZABÓ, N. P.–DOBRÓKA, M.–KAVANDA, R.: Cluster analysis assisted float-
encoded genetic algorithm for a more automated characterization of hydro-
carbon reservoirs. Intelligent Control and Automation, 2013, 4, 362–370.
[36] DOBRÓKA, M.–SZABÓ, N. P.–TÓTH, J.–VASS, P.: Interval inversion approach
for an improved interpretation of well logs. Geophysics, 2016, 81, D163–
D175.
[37] MARQUARDT, D. W.: Solution of non-linear chemical engineering models.
Chemical Engineering Progress, 1959, 55, 65–70.

50 István Bibor–Norbert Péter Szabó
[38] MONTGOMERY, L. S.–JARVIE, M. D.–BOWKER, A. K.–POLLASTRO, M. R.:
Mississippian Barnett Shale, Fort Worth basin, north-central Texas: Gas-
shale play with multi–trillion cubic foot potential. AAPG Bulletin, 2005,
89(2), 155–175.
[39] CRAIN, E., R.: Crain’s Petrophysical Handbook.
https://spec2000.net/index.htm, 2016. 09. 12.