understanding growth in small businesses - welcome to …€¦ · · 2015-02-27bis research paper...
TRANSCRIPT

1
BIS RESEARCH PAPER NUMBER 216
Understanding Growth in Small Businesses
MARCH 2015


Authors: Gordon Allinson, Paul Braidford, Maxine Houston and Ian Stone Durham Business School/St Chad’s College
The views and interpretations expressed are the authors’ and do not necessarily reflect those of the Department for Business, Innovation and Skills.
Acknowledgments
The authors would like to thank our research partners at BMG research, particularly Steve Lomax and Shadna Hussain for the completion of the telephone survey and their help in arranging interviews. We would also like to thank the 50 assisted businesses who participated in the qualitative interviews. Finally, our thanks also go out to Ian Drummond and Michelle Harrison of the BIS Enterprise Directorate for their assistance and guidance with this project.


Contents Contents .......................................................................................................................................... 3
Executive Summary ........................................................................................................................ 1
Introduction ................................................................................................................................... 1
Objectives ..................................................................................................................................... 1
Method .......................................................................................................................................... 1
Research Findings ........................................................................................................................ 2
Patterns of growth ..................................................................................................................... 2
Growth Ambition ........................................................................................................................ 2
Obstacles to growth .................................................................................................................. 3
Capacity, Market and Vision constraints to growth ................................................................... 3
Mindsets .................................................................................................................................... 6
Myths......................................................................................................................................... 6
Policy Considerations .................................................................................................................... 7
Introduction ..................................................................................................................................... 8
1.1 Background .......................................................................................................................... 8
Obstacles and business solutions ............................................................................................. 8
Mindsets .................................................................................................................................... 8
1.2 Aims and objectives ............................................................................................................. 9
1.3 Methodology and achieved sample ................................................................................... 10
Quantitative survey ................................................................................................................. 10
Interviews and focus group discussions .................................................................................. 10
1.4 Structure of the report ........................................................................................................ 11

2 Growth patterns .................................................................................................................... 12
Section summary .................................................................................................................... 12
Employment change 2012-2014 ............................................................................................. 13
Employment change 2009-2014 ............................................................................................. 14
2.1 Employment and sales growth (2012-14) .......................................................................... 15
2.2 Substantive growth ambitions ............................................................................................ 16
2.3 Characteristics of owner/manager and growth .................................................................. 17
3 Obstacles to growth .............................................................................................................. 20
Section summary .................................................................................................................... 20
3.1 Top-level obstacles to business growth ............................................................................. 21
3.2 Reasons for not wanting to grow the business in the next three years .............................. 23
3.3 Specific challenges related to Cashflow ............................................................................ 25
3.4 Specific challenges related to Regulations ........................................................................ 27
3.5 Finance .............................................................................................................................. 28
3.6 Exporting ............................................................................................................................ 31
3.7 Innovation .......................................................................................................................... 33
3.8 Management and training .................................................................................................. 36
3.9 Sales .................................................................................................................................. 38
3.10 Market Constraints ......................................................................................................... 39
3.11 Vision constraints ........................................................................................................... 40
3.12 Capacity constraints ....................................................................................................... 43
3.13 Segmenting small businesses into constraint type ......................................................... 45
3.14 Aggregated barriers ........................................................................................................ 45
3.15 Pattern of constraints ...................................................................................................... 47

3.16 Relationship between constraints and growth ................................................................ 50
Historic growth (2012-14) ........................................................................................................ 50
Anticipated growth ................................................................................................................... 51
Wider application..................................................................................................................... 52
4 Qualitative discussions with business owners .................................................................. 54
4.1 Introduction ........................................................................................................................ 54
4.2 General attitude toward growth .......................................................................................... 54
4.3 Planning ............................................................................................................................. 57
4.4 Exporting ............................................................................................................................ 61
4.5 Innovation .......................................................................................................................... 62
4.6 Working capital and Investment Finance ........................................................................... 65
4.7 Management ...................................................................................................................... 68
4.7.1 High performance work practices ................................................................................ 68
4.7.2 Consultation ................................................................................................................ 69
4.7.3 Recruitment and people management ........................................................................ 71
4.7.4 Delegation and management structure ....................................................................... 72
4.8 Regulation .......................................................................................................................... 73
4.9 Advice and support ............................................................................................................ 74
5 Conclusions ........................................................................................................................... 77
Research Findings ...................................................................................................................... 77
Patterns of growth ................................................................................................................... 77
Growth Ambition ...................................................................................................................... 78
Obstacles to growth ................................................................................................................ 78
Capacity, Market and Vision constraints to growth ................................................................. 79

Mindsets .................................................................................................................................. 81
Myths....................................................................................................................................... 81
Policy Considerations .................................................................................................................. 82

Executive Summary Introduction
This research report adds to the evidence base on the factors that affect the performance and growth of small businesses (those with 10-49 employees). This study is based on earlier research carried out for BIS on the growth of microbusinesses (0-9 employees)1 and replicates much of the approach used in that study. This report identifies and evaluates the obstacles affecting growth in small businesses. The research sought to capture business owners’ own perceptions of which obstacles constrain their businesses. Within this, it also considers the effects of owners’ mindsets and attitudes towards growth.
Objectives
In order to achieve its aims this project sought to:
• Identify the obstacles to growth that affect small businesses
• Assess why and how these obstacles are problematic for growth; both as single obstacles and in concert.
• Assess how these differ between micro, small and medium sized businesses.
• Assess whether and how the reported obstacles are shaped by recent business histories and the ‘mindsets’ and dispositions of business owners.
• Assess the extent to which reported obstacles are based on misperceptions or misinformation.
• Consider the policy relevance of these findings.
Ultimately the project seeks to identify a rationale for policy development in this area and assess any policy options that might be used to encourage and enable small businesses to achieve higher levels of growth.
Method
This research involved a 25 minute telephone survey conducted during October and November 2014, involving 601 small businesses; 279 with 10-19 employees and 322 with 20-49 employees. The survey collected information on business and owner demographics, growth performance and ambitions, internal capacities and capabilities as
1 Allinson G, Braidford P, Houston M and Stone I (2013) Understanding Growth in Micro businesses Understanding growth in microbusinesses - full report
1

well as views on obstacles to growth and any steps taken to overcome these constraints. The data collected was developed into an index of 31 obstacles associated with both a range of material factors and the mindsets of the business owners. These data were analysed to define three distinct sets of constraint – Vision, Capacity and Market.
Finally, 50 business owners took part in the qualitative phase of the research: 19 owners participated in two focus groups, and a further 31 undertook a semi-structured telephone interview, lasting around 40 minutes. These interviews explored misperceptions or myths associated with growing a business.
One key strand of the analysis sought to contrast the dispositions and behaviours of business owners that had and had not grown.
Research Findings
Patterns of growth • In the years 2012-14 our sample of small businesses showed some small net growth
on average (just over one job per business); 31 per cent of businesses had both sales and employment growth over this period and 46 per cent had increased employment. One in six businesses (17 per cent) had experienced contraction over this period.
• Over the longer time horizon of 2009-14, small businesses were a little more dynamic, creating a net gain of 1½ additional jobs per business. Fifteen per cent of the stock of 2014 small business began in 2009 as microbusinesses. 56 per cent of small businesses had increased employment over this period.
Growth Ambition • Three quarters (75 per cent) of businesses report an ambition to grow their
businesses over the next three years.
• Only 15 per cent of businesses indicated they had a substantive growth ambition.2 This group were clearly more likely to have achieved growth in practice in the previous two years, with 21 per cent of growing businesses showing growth ambition, double the rate of non-growing businesses (10 per cent).
• Growth ambition was higher among younger business owners.
2 Substantive growth ambition was defined by businesses seeking to grow their sales by more than 20 per cent over the next three years, growing income significantly after the next three years and a strong personal desire of the owner to grow.
2

Obstacles to growth • Businesses with 10 to 19 employees reported more conventional obstacles3 to
business growth than those with 20 to 49 employees. The average number of obstacles mentioned (from a possible total of 11) was 5.3 for 5-9 businesses, 4.4 for 10-19 businesses and 3.8 for 20-49 businesses.
• This study goes beyond the standard set of obstacles normally included in business surveys to ask questions designed to identify a wider set of obstacles.4 Within this, the intent was to capture business owners’ own perceptions of what factors constrain their business. A total of 31 obstacles were reported in this way. These include issues associated with the uptake of business improvement processes, business capabilities, perceived demand and lack of ambition.
• Growth performance of businesses was strongest where they had made some form of business improvement compared with those not making improvements (financial investment, exporting, innovation, collaboration, introducing a management team).
• Introducing new processes was rated as being easier by those that had implemented them, compared to those that had not done so. Owners tended to overstate the difficulty of implementation. Compared to businesses that had achieved growth, non-growing micro and small businesses tend to overstate both the challenges involved and the capacities needed to deal with these. Businesses also overstated perceptions about the point at which it was necessary to appoint an external manager differed substantially, between those that had (14 employees) and those that had not (26 employees).
Capacity, Market and Vision constraints to growth • The individual 31 obstacles considered in this research were categorised as
belonging to one of three sets of related perceived and actual constraints. These related to capacity of the business to enable growth, the external environment including the market and the vision of the owner and their attitudes towards growth. Combining the obstacles in this way provides a better predictor of achieved growth than narrower measures.
• Slightly more than a third of small businesses (38 per cent) were constrained in terms of their capacity, relatively more were constrained in terms of their vision (53 per cent) and market (51 per cent).
• The three categories and their interactions are described in the Venn diagrams below showing results separately for businesses with 10-19 and 20-49 employees. The
3 The survey and our analysis replicate standard categories from the BIS Small Business Survey (SBS). Full findings from the SBS 2012 are available here 4 Unlike SBS categories of obstacles these are not explicitly identified by the business as being obstacles. Instead the researchers infer that particular responses put the business in adverse circumstances (e.g. Have not taken any steps to increase sales in the last five years, low capability of developing a business plan etc) and classify these responses as obstacles.

figures show that larger businesses tended to be less capacity constrained and less market constrained, as well as more likely to be unconstrained in any dimension. These patterns are potentially very informative. They define which businesses are multiply constrained and therefore very unlikely to achieve growth, and which only face one type of constraint and thus are more likely to be capable of readily achieving growth.
• These analyses highlight limits to the effectiveness of initiatives that focus on specific factors. For example, initiatives that seek to improve business capacities alone are only likely to impact on the six per cent of small businesses that are only constrained in this area. For the remaining 94 per cent of businesses, these measures might be necessary but they are not sufficient in themselves to improve performance and create growth. Indeed, given the very small proportions of small businesses constrained in just one category, these findings suggest that effective interventions need to be either specifically targeted or holistic and multi-dimensional. This is particularly the case for the 10-19 businesses.
Venn diagram of constraints (All small businesses)
Market constrained
Capacity constrained
Vision constrained
Unconstrained = 18%
15%
14%
9%
6%13%
8%
16%
4

Venn diagram of constraints – businesses with 10-19 employees
Venn diagram of constraints – businesses with 20-49 employees
Market constrained
Capacity constrained
Vision constrained
Unconstrained = 16%
17%
16%
9%
7%13%
15% 8%
Market constrained
Capacity constrained
Vision constrained
Unconstrained = 21%
13%
8%
5%
9%
19%
11%
15%

Mindsets The data provided by businesses that had and had not grown, suggests that the ambitions and perceptions of the obstacles and challenges involved are often shaped by the mindsets or ‘innate dispositions’ of businesses owners. Simply put, owners disposed to growth have greater ambition and tend to report fewer obstacles than those that are more negatively disposed to growth. These mindsets are embodied in the quantitative evidence associated with overestimating the difficulty of implementing business improvements or overestimating the size at which a business should introduce professional management. The qualitative evidence was able to go further and directly challenge owners views, finding clusters of evidence that grouped together a lack of faith that business improvements yielded demonstrable benefits, with difficulties in implementation. In discussion with business owners it was common to find that they saw no way forward, or no viable alternative on particular issues and this ‘can’t do’ mindset insidiously caused immobility in taking decisive action.
One of the most important aspects of this study of small businesses that distinguishes it from research on micro businesses is the additional complication of a layer of management in the business. Releasing the full potential of management (and for that matter the whole workforce) to make a valued contribution to the business is a key area where many owners fail to make best use of existing resources.
Myths A set of twelve myths were distilled from the evidence gathered. The potential growth of a wide cross-section of micro businesses was being held back by these myths. The myths are unpinned by a reluctance to plan, strategise or develop the business and a focus on working in rather than on the business. The twelve commonly observed myths were:
Myth 1: You can’t grow during a recession.
Myth 2: Strategic planning is only useful when the business has a definite objective in mind.
Myth 3: Investment in R&D is too risky, expensive and difficult for a small business
Myth 4: There’s no way we can improve our cashflow situation
Myth 5: Factoring is only useful if you’re in trouble
Myth 6: If my bank turns me down, there’s no alternative
Myth 7: Our employees don’t want formal, pay-related incentives, and they’re no use in helping us grow.
Myth 8: We don’t need to engage the staff in a structured, involving way
Myth 9: I can’t get recruits to fit my needs
Myth 10: My business doesn’t need to restructure its management as it grows 6

Myth 11: It is not worth devoting the time to networking
Myth 12: There’s no business support out there for me
Policy Considerations
These findings appear to be policy relevant in a number of respects.
The findings elucidate a wider set of obstacles to growth than are investigated in most business surveys.
Within this, the analysis, demonstrated in the Venn diagrams, which shows how these obstacles work in concert to constrain growth has clear relevance to thinking about the targeting of policy. Indeed this analysis provides a de facto segmentation model that could be used either in its own right or as a supplement to other such models.
The findings relating to the ‘mindsets’ of business owners are also potentially important. If the behaviours of businesses owners are shaped by their innate dispositions and these dispositions ultimately affect business performance, this has clear implications for policy. For example, some businesses owners are, at a deep level, disposed to resist change and growth, the problem here is not an information failure; providing these business owners with information and advice will not in itself change the way they run their businesses.
Introduction 1.1 Background
Previous research undertaken for BIS in 2013 investigated the factors affecting growth in micro businesses5. This research study is intended as a companion to the 2013 report, but focusing on small businesses (10-49 employees) and the particular issues they face in growing their businesses. Many of the survey questions are repeated verbatim, permitting direct comparison, but some new questions are added, particularly with regard to enhanced detail in the areas of finance; exporting; innovation and management.
The report considers how obstacles inhibit growth for some businesses, while others overcome these same obstacles; and how and to what extent these obstacles are different from those faced by micro and medium/large businesses. In addition, the research aims to identify the extent to which these obstacles are based on misperceptions held by business owners.
Obstacles and business solutions The current evidence base for business growth collects a substantial amount of data on company behaviour. A number of BIS reports provide evidence on obstacles for SMEs, their prevalence and the ways in which these influence attitudes, ambition, business performance and growth (e.g. Small Business Survey, English Business Survey, Business Perceptions Survey). This evidence shows that reported obstacles to business growth and their effects vary by size band. Some of these factors relate to the external environment (e.g. competition, regulation), while others are internal to the firm (e.g. workforce skills, management skills). While companies are undoubtedly affected by their environment there are many actions they can take to create the strongest business possible to meet the challenges they face. The most recently published BIS Small Business Survey (2012)6 identified – through regression analysis - the nine most significant factors most strongly associated with growth (in decreasing order of significance): exporting; having a formal business plan; seeking external finance; process innovation; strength in implementing the business plan; providing formal training; strength in accessing external finance; strength in entering new markets; and use of a business mentor. The capabilities and willingness of businesses to undertake any of these activities therefore affect growth and this report enquiries about what activity has been taken, as well as reasons for non-adoption.
Mindsets This research is intended to inform policy development in BIS in a more nuanced way than simply devising or evaluating a list of barriers or enablers. Instead, it aims to acquire a
5 Allinson G, Braidford P, Houston M and Stone I (2013) Understanding Growth in Micro businesses - Full report is available here 6 Full findings from the Small Business Survey 2012 are available here
8

more subtle understanding of how small businesses think and behave, which incorporates the motivations and mindsets of the owners of small businesses. All small businesses have already grown their employment levels to a certain extent, having reached at least ten employees, but they may have reached a size threshold which they do not want to cross. This research tries to unpack this preference for growth by not only examining the mindsets of business owners, their conceptions of the ‘optimal’ size for their business, and specific barriers to growth (either ‘real’ or in terms of their ambition, vision etc.), but also their conceptualisation of the process of growth itself.
1.2 Aims and objectives
The fundamental purpose of this research is focused on practical policy development for BIS, namely the extent to which there is a latent demand for growth among small businesses, and whether there is a role for BIS in realising businesses’ ambitions to grow. The ultimate aim of this research project is to determine how policy may alleviate obstacles to growth, thereby encouraging a higher proportion of small businesses to achieve productivity gains, and increase their turnover and/or employment. At the same time, it aims to identify those businesses with the highest unrealised potential to grow - i.e. those which may benefit most from intervention – and suggestions for how to help realise this potential, in terms of removing barriers and providing enablers. The research examines whether a segmentation of small businesses is possible (including the extent to which the model devised for micro businesses holds true for small businesses, or how it might be adapted), and whether different policies are appropriate for different audiences (in terms of the type of intervention and how they might be reached). The overall objectives of the survey are as follows:
• To identify the specific obstacles to growth that affect small businesses, and how these differ from micro and medium/large businesses.
• To assess why and how these obstacles are problematic for growth and whether the factors change by growth orientation and recent growth history.
• To assess the extent to which these obstacles are based on misperceptions or misinformation.
• To segment the business population according to constraints and potential to grow.

1.3 Methodology and achieved sample
Quantitative survey The population of small businesses given by IDBR7 2013 indicates that there are 83,025 such enterprises across England (62,990 with 10-19 employees, 20,035 with 20-49). From this population we interviewed 601 owner/managers of small businesses, that is businesses with between 10 and 49 UK employees (excluding owners/partners). Businesses were surveyed by Computer Assisted Telephone Interviewing (CATI) in a 25 minute interview, with fieldwork undertaken in October-November 2014. The sample was drawn from Dun & Bradstreet’s business database. The only deliberate quota to the sampling was to achieve relative parity in the numbers of 10-19 and 20-49 employee businesses interviewed, with analysis reweighted to the population given above. The questionnaire uses standard Small Business Survey questions, slightly reframed to concentrate on growth rather than normal trading, in order to benchmark the results against the wider business population. In addition, using these questions would allow direct comparisons to be made between the surveys, in order to highlight where small businesses differ from (or are similar to) micro businesses in terms of the type, strength and prevalence of obstacles and barriers. This would inform the qualitative research, in terms of which factors to concentrate on. The questionnaire is shown in Appendix 1. The preliminary analysis identifies the prevalence and strength of barriers to growth among small businesses. This allows an initial identification of barriers to growth. Businesses are considered in terms of their size, growth history over the previous two years and growth ambition for the coming three years. The segmentation identified by the 2013 research (vision, market and capacity constrained) remains relevant to small businesses as well as micros and the specific questions used in this segmentation are shown in Appendix 4.
Interviews and focus group discussions The purpose of the qualitative element of the research is to develop a richer understanding of the quantitative data and provide more nuanced linkages between different areas of interest. One of the weaknesses of quantitative research is the passive script, which is highly structured with little scope for deviation. By contrast, the interview environment is semi-structured, with a guiding skeleton of questions, but much greater latitude to interrogate at any point for more detail in a particular area. In this way we would hope to get a more detailed understanding of the reasons why views are held by individuals. The qualitative process would also give us a further opportunity to interpret results using behavioural psychology. The qualitative element consisted of both interviews and focus groups, totalling 50 respondents, in 2 focus groups and 31 interviews. Both methods have their merits, with interviews isolating and focusing on one business and permitting individual probing of circumstances, while focus groups permit testing the general validity of opinions amongst the group. Focus groups open up different avenues of thought and a variety of
7 Inter-departmental business register, which is compiled from those businesses that pay VAT and/or PAYE. The IDBR figure for small businesses (10-49 employees) is the same as that used in BIS’s Business Population estimates (BPE).
10

experience, but conversely may stifle openness, particularly in areas such as the more candid admissions of failure or weakness that are inevitable in the business lifecycle and an important part of this research. Questions were in similar areas to the quantitative stage, although some tailoring to individuals was possible from their quantitative responses.
1.4 Structure of the report
Section 2 provides an indication of the growth patterns of small businesses. Tables and figures throughout the report use the same disaggregation as SBS, dividing small businesses into 10-19 and 20-49 businesses. This section examines their historic growth and future growth ambitions. Section 3 discusses the obstacles associated with growth for small businesses using evidence from the telephone survey. The section then focuses on some obstacles in detail (cashflow, regulations and finance) before considering the effects of business improvement (exporting, innovation, collaboration, management) on business performance. This section concludes with the development of categories of constraints on growth (market, vision and capacity) and their prevalence in small businesses and effects these have on growth. Section 4 discusses the results of the qualitative interviews, explaining the series of barriers that affect business growth, as well as developing a series of myths affecting growth that some small businesses are susceptible to believing. Section 5 develops a series of conclusions and policy recommendations.
2 Growth patterns This section concentrates on the pattern of growth of amongst the small businesses participating in the telephone survey. Questions were asked about employment size at three time intervals: five years ago (2009); two years ago (2012) and now (2014). These census points provide the basis to study expansion and contraction for any two observations.
It is important to note that the method used in this study does inevitably understate the growth of small businesses, since it excludes businesses which have grown into businesses with 50 or more employees, while including businesses which previously employed 50 or more staff that reduced their employment by the time of survey in November 2012.
In this section we also report on two variables which we use throughout the report. We derive a variable for historic substantive growth covering the period 2012-14, then we construct a second variable representing substantive growth ambitions for the next three years (2015-17).
Section summary • In the years 2012-14 our sample of small businesses showed some small net
growth on average (just over one job per business); 31 per cent of businesses had both sales and employment growth over this period and 46 per cent had increased employment. One in six businesses (17 per cent) had experienced contraction over this period.
• Over the longer time horizon of 2009-14, small businesses were a little more dynamic, creating a net gain of 1½ additional jobs per business. Fifteen per cent of the stock of 2014 small business began in 2009 as microbusinesses. 56 per cent of small businesses had increased employment over this period.
• Three quarters (75 per cent) of businesses report an ambition to grow their businesses over the next three years.
• Only 15 per cent of businesses indicated they had a substantive growth ambition.8 This group were clearly more likely to have achieved growth in practice in the previous two years, with 21 per cent of growing businesses showing growth ambition, double the rate of non-growing businesses (10 per cent).
• Growth ambition was higher among younger business owners.
8 Substantive growth ambition was defined by businesses seeking to grow their sales by more than 20 per cent over the next three years, growing income significantly after the next three years and a strong personal desire of the owner to grow.
12

Employment change 2012-2014 Because the sample is drawn from businesses currently with 10-49 employees, it inevitably represents some larger businesses which have downsized, as well as businesses that have experienced recent growth. Table 2.1 shows the number of businesses in each employment sizeband in 2012 and 2014, therefore showing the extent of change among the sample, while Table 2.2 Table 2.2 shows the change in employment for those sizebands. The shaded diagonal in Table 2.1 shows that the majority of businesses actually stayed a similar size.
Table 2.1 shows the overall picture was rather static between 2012 and 2014, in terms of sizebands, with more than two-thirds (69 per cent) of businesses remaining in the 10-19 sizeband, and 86% remaining in the 20-49 sizeband. There was a smaller proportion of businesses growing into the 20-49 (4 per cent), and a small proportion (12 per cent) contracting from the 20-49 sizeband. Only 15% of the 2014 small businesses were microbusinesses two years ago, while only 1% had downsized from 50+ employee businesses.
Table 2.1 Comparison of sizebands in 2012-14 (Number of businesses)
Size in 2012 Size in 2014
0-9 N=64
10-19 N=216
20-49 N=262
50+ N=10
10-19 employees 85 250 29 - 20-49 employees 3 23 158 6
Note: All businesses with two years employment history, weighted results
The more detailed picture showing employee numbers in Table 2.2 shows quite considerable job creation among those businesses with 0-9 employees in 2012, adding 393 jobs by 2014, equivalent to 4.5 jobs per business or a 61 per cent increase in employment. Much more modest growth was observed in the 10-19 sizeband, with an average growth of 1.3 jobs or 10 per cent. The 20-49 businesses and 50+ businesses experienced some job losses over this period, but much of this simply reflects the chosen method.
Table 2.2 Comparison of sizebands in 2010-12 (Change in employees)
Size in 2012 Size in 2014
0-9 N=64
10-19 N=216
20-49 N=262
50+ N=10
10-19 employees 337 131 -228 - 20-49 employees 56 213 292 -158 Net change 393 344 64 -158 Av. jobs change +.4.5 +1.3 +0.3 -26.3 % change 2012-14 61% 10% 1% -40%
Note: All businesses with two years employment history, weighted results

Table 2.3 shows the proportion of businesses contracting and expanding over 2012-14 according to ageband. It shows a trend for younger businesses to be more likely to be expanding and less likely to be contracting and the reverse situation for older businesses.
Table 2.3 Proportion of businesses changing employment by age (2012-1
less than 4 years N=22
5 - 10 years N=97
11 - 20 years N=151
More than 20
years N=378
% contraction 10 10 20 17 % expansion 65 55 46 40 % same 25 34 33 42
4) (%)
Note: All businesses with two years employment history, weighted results
Employment change 2009-2014 The longer-term horizon, covering the period 2009-14 shows a much more dynamic situation, with many more businesses changing the size of their workforce and a higher number of job gains. Table 2.4 shows the number of businesses and the changes between sizebands over the years 2009-14, while Table 2.5 shows the change in employee numbers for those sizebands.
Table 2.4 Comparison of sizebands in 2009-14 (Number of businesses)
Size in 2009 Size in 2014
0-9 N=92
10-19 N=184
20-49 N=209
50+ N=7
10-19 employees 119 183 33 1 20-49 employees 5 34 122 4
Note: All businesses with five years employment history, weighted results
Again, it is evident that the most common occurrence is for there to be no change at all in employment sizeband. Even over a five year time horizon 61 per cent of businesses were in the same sizeband, and 21% had precisely the same number of employees. Table 2.5 shows that job creation over the longer term was similar among the 0-9 businesses, but rather higher among the 20-49 businesses.
14

Table 2.5 Comparison of sizebands in 2009-14 (Change in employees)
Size in 2009 Size in 2014
0-9 N=92
10-19 N=184
20-49 N=209
50+ N=7
10-19 employees 364 35 -203 20-49 employees 18 221 519 -32 Net change 382 256 316 -32 Av. jobs change +3.1 +1.2 +2.0 -6.4 % change 2009-14 81% 8% 7% -16%
Note: All businesses with five years employment history, weighted results
2.1 Employment and sales growth (2012-14)
In this section we have focused on the measure of growth given by employment, because this provided the most robust data for the purpose of analysis across each census point. Going forward for the remainder of the report we consistently use a definition of substantive growth incorporating both sales and employment.
Table 2.6 shows that two-thirds of businesses are able to express some form of growth, either sales or employment. This estimate of growth was viewed as overestimating the true proportion of businesses that are growing. Several studies recognise the proportion of truly growing businesses is rather lower. To better convey this more dynamic form of growth we adopt the simple definition of both sales and employment growth and describe this as historic growth. Adopting this more conservative definition indicates that slightly fewer than one third of businesses (31 per cent) exhibited substantive historic growth between 2012-14. Rather more businesses in the 20-49 category had experienced this growth and this is corroborated in later analysis in the following section on obstacles, suggesting higher levels of activity and more growth.
Table 2.6 Businesses experiencing either sales or employment growth (2012-14) (n=548)
% Experiencing either sales or employment
growth
% Experiencing both sales and employment
growth 10-19 employees 64 28 20-49 employees 68 37 Total 65 31
Note: All small businesses with both employment and sales history for two years, weighted results

2.2 Substantive growth ambitions
As well as considering historic growth, it is possible to consider the extent of growth ambitions of the sample and the seriousness of their intention to grow in the future. In considering future growth we encounter similar problems to historic growth, in that many businesses report such ambition in a crude form, but further interrogation reveals fewer have a genuine growth ambition. Using an established method, incorporating four different variables it is possible to arrive at a definition of substantive growth ambition.9
Table 2.7 shows the number of businesses with a substantive ambition to grow, as well as the proportions for each sizeband. Overall, historic growth and growth ambition do show some relationship with one another and so it is unsurprising that the trend from Table 2.6 is repeated in Table 2.7. Again, it is a larger proportion of the 20-49 businesses expecting growth compared to the 10-19 sizeband, and despite being larger the 20-49 businesses also report a higher anticipated percentage sales growth over the next three years.
Table 2.7 Businesses with substantive growth ambition and anticipated sales growth in the next three years
% expressing growth ambition
N=572
Anticipated sales growth (%)
N=329 10-19 employees 13 27 20-49 employees 18 31 Total 15 29
Note: All businesses with two years employment and sales history, weighted results
The relationship between historic growth 2012-14 and growth ambition and anticipated sales growth is considered in Table 2.8. Confidence was much higher among those businesses that had experienced both sales and employment growth in the previous two years. Among those businesses with historic sales and employment growth one fifth also expressed a substantive growth ambition for the future, compared with just one in ten for either sales or employment or no growth.
9 The definition used for substantive growth ambition is a composite index derived from four key questions in the telephone survey. A full explanation is given in Appendix 5.
16

Table 2.8 Businesses with substantive growth ambition
% expressing growth ambition N=529
Sales and employment Growth 21 Either sales or employment 11 No growth 10 Total 15
Note: All businesses with two years employment and sales history, weighted results
Table 2.9 shows a very distinct pattern for growth according to the age of the business, with decreasing levels of growth and ambition among older businesses. The more recently established businesses were much more likely to have experienced growth. The proportion of businesses growing was 50 per cent for those businesses less than five years old, compared with 23 per cent for those that were more than twenty years old.
Table 2.9 Historic growth (2012-14) and growth ambition by age of business (%) (N varies)
Less than
5 years 5-10
years 11-20 years
More than 20 years
Historic growth 50 45 36 23 Growth ambition 23 20 17 10
Note: All businesses with two years employment and sales history, weighted results
2.3 Characteristics of owner/manager and growth
As well as the business characteristics we are also interested in some of the ownership characteristics too. Each of the tables shown below considers the proportions of businesses that had experienced growth over the past two years and the proportions that had substantive growth ambitions for the future.
Table 2.10 shows the patterns of growth by gender, showing a slightly higher proportion of female owners enjoying growth over the previous two years, but rather less ambition.
Table 2.10 Historic growth (2012-14) and growth ambition by gender (%) (N varies)
Male Female Historic growth 29 35 Growth ambition 17 12
Note: All businesses with two years employment and sales history, weighted results

Table 2.11 shows growth according to the age of the owner. Achieved growth is lowest among younger owners and older owners, with a peak in the mid years (45-49). The patterns for growth ambition were much clearer, with proportions of owners exhibiting ambition falling in each successive age cohort. This second set of results bears a great deal of similarity to those in Table 2.9 and it may simply be that younger owners in charge of younger businesses are more keen to grow, while older owners are rather less keen for future growth.
Table 2.11 Historic growth (2012-14) and growth ambition by age of owner / manager (%) (N varies)
Less than
35
Between 35 and
44
Between 45 and
49
Between 50 and
54
Between 55 and
64 Over
64 Historic growth 30 30 43 28 30 25 Growth ambition 24 23 16 15 6 5
Note: All businesses with two years employment and sales history, weighted results
Table 2.12 shows the patterns for growth according to the highest qualifications held by interviewees. There was a trend of a higher proportion of businesses growing associated with higher levels of education, except those with no formal qualifications. The proportion of owners with NVQ5 equivalent that had grown was 17 percentage points higher than those with NVQ2.
Table 2.12 Historic growth (2012-14) and growth ambition by qualifications (%) (N varies)
NVQ Level 5 or
equivalent
NVQ Level 4 or
equivalent
NVQ Level 3 or
equivalent
NVQ Level 2 or
equivalent No formal
qualifications Historic growth 41 30 34 24 30 Growth ambition 18 15 14 16 4
Note: All businesses with two years employment and sales history, weighted results
Table 2.13 shows the relationship between growth and management experience. The results were especially inconclusive with regard to historic growth, with little difference in the proportion of growing businesses for different lengths of management experience. There was more difference in terms of growth ambition, but the patterns were indistinct, with the lowest proportion exhibiting growth ambition having a middle level of management experience and higher ambition among new managers, although the highest results were among those managers with the longest experience.
18

Table 2.13 Historic growth (2012-14) and growth ambition by prior management experience (%) (N varies)
Less than 3 years
3 - 5 years
6 - 10 years
11 - 15 years
16 or more years
Historic growth 36 27 34 37 39 Growth ambition 16 13 10 19 16
Note: All businesses with two years employment and sales history, weighted results
3 Obstacles to growth This section of the report examines obstacles small businesses face in the specific context of growth and introduces further exploratory questions around the reported obstacles. This section also reports on steps taken to overcome obstacles and owner/managers views on how growth would affect their business. The final subsections (3.10-3.12) gather together obstacles facing businesses into three groupings (vision, market and capacity), each operating in distinct ways.
This section also examines how particular business improvements (management development, innovation, exporting etc) affect business growth, contrasting the performance of adopters and non-adopters. Having demonstrated the benefits, the ease with which these practices can be adopted is also considered, with a view to offering encouragement to non-adopters about the ease of adoption.
Furthermore, this section repeats some of the analysis conducted in the companion study for micro businesses, but drills down into greater detail in the areas of: finance; exporting; innovation and management & training. Useful comparisons with micro businesses (5-9 employees) are made to show how the small businesses surveyed here are rather different10.
The section concludes with a series of Venn diagrams showing a segmentation model based on the three categories of constraints: vision; market and capacity.
Section summary • Smaller businesses reported more obstacles associated with business growth in
terms of SBS style categories (Table 3.1) and a bespoke index of 31 indicators (Figure 3.4 and Figure 3.5).
• Where businesses disclosed an obstacle there was a strong inverse relationship between their competence in the matter and there being an obstacle (Figure 3.1).
• Growth performance of businesses was strongest where they had made some form of business improvement compared with those not making improvements (financial investment (Table 3.7), exporting (Table 3.8), innovation (Table 3.11 and Table 3.12), collaboration (Table 3.13), introducing a management team (Table 3.18).
• Encouragement for 5-9 businesses to grow into small businesses was found in evidence supplied by the 10-49 businesses that indicated that growing a business was not too costly (Table 3.23) and higher levels of capacity to deal with the issues associated with growth (Table 3.26).
10 Data for the 5-9 businesses is only shown where questions are exactly the same and where there is no comparison those questions were not asked in the micro businesses report. The one caveat is that some of the differences may emerge from the difference in timing, with 5-9s surveyed in 2012, compared with 2014.
20

• Larger businesses tended to be less capacity constrained and less market constrained, as well as more unconstrained altogether.
• Small businesses appeared to be rather less constrained in terms of their capacity, but relatively more constrained in terms of their vision and market (Table 3.27).
• Comparing 5-9 businesses with small businesses shows they were slightly less vision constrained than small businesses, but tended to be held back by their capacity and market constraints (Table 3.27).
• Vision was an important explanatory factor in anticipated growth among 10-49 businesses, with only 2 per cent of such businesses growing, compared to 31 per cent of businesses exhibiting either capacity or market constraints (Table 3.32).
3.1 Top-level obstacles to business growth
Table 3.1 shows the top-level obstacles to business growth based on the categories asked in SBS. These relate to any obstacles faced by the business. The table compared small businesses with 10-19 employees and those with 20-49 employees. For every answer, except for pensions, there are a higher proportion of responses from the 10-19 businesses and on average they report 4.4 obstacles, compared with only 3.8 obstacles for the 20-49 businesses. The 20-49 employee businesses were also twice as likely to report there being no obstacles.
Re-producing the evidence from the 5-9 businesses alongside these results shows something of a trend, most evident in the bottom row, with the average number of obstacles falling for each successive sizeband. The patterns are still distinct for individual rows when including the 5-9 businesses (except for recruitment and skills), albeit that some of the responses are very much higher. The economy was rated as an obstacle by as many as 85 per cent of the 5-9 businesses compared with only 58 per cent of small businesses. Cashflow and obtaining finance were also very much higher for the 5-9 businesses (22 and 21 percentage points higher than small businesses), although some of this might be due to these factors being more susceptible to the prevailing economy in 2012, compared with 2014. Other factors which are less susceptible to the economy (e.g. regulations and premises) show a more modest difference (six and four percentage points respectively) but still show a pattern of decreasing prevalence for increasing sizebands.

Table 3.1 Obstacles to business growth (%)11
5-9
employees N=277
10-19 employees
N=277
20-49 employees
N=322
All Small businesses
N=599 The economy 86 59 57 58 Regulations 59 53 47 51 Competition in the market 59 51 48 50 Taxation 66 54 40 49 Recruiting staff 38 47 34 44 Shortage of skills generally 36 40 37 39 Cash flow 55 33 29 32 Pensions 30 23 27 26 Obtaining finance 48 27 21 25 Managerial skills 25 24 23 24 Premises 29 25 23 24 No obstacles mentioned 2 4 8 5 Av. Number of obstacles 5.3 4.4 3.8 4.2 Q.D1. Multiple answers allowed. Base = all respondents regardless of intention to grow the business.
Table 3.2 shows the main obstacle to growth. Because only one answer is permitted the total responses for 10-19 employing businesses are the same as for those businesses with 20-49 employees and consequently the pattern is slightly more uniform. The 10-19 category does tend to report a higher incidence of obstacles across more categories, partly because of a higher proportion of responses attached to the economy for 20-49 businesses and again more businesses reporting no obstacle. Some of these responses are somewhat surprising, such as the greater issue of recruiting employees for 10-19 businesses, compared to the larger 20-49 businesses one might expect to recruit more often.
Including 5-9 businesses in the analysis repeats some of the patterns from Table 3.1, with the economic cycle appearing to influence matters (the economy and obtaining finance). Notwithstanding those answers influenced by the economic cycle there are some responses which help understand the different emphases of businesses as they make the transition to becoming small businesses. Recruiting staff and to a lesser extent a shortage of skills generally stands out as a more pressing concern for businesses with 10-49 employees, as would be expected given their greater obligations in recruiting and sustaining a larger workforce. Similarly, competition in the market is more important to 10-49 businesses, perhaps reflecting the fact that larger businesses are affected more by their competition.
11 SBS 2012 categories are used in this table, but there were also many other additional responses, all attracting a small minority (less than 1%) of replies that are not shown in the table.
22

Table 3.2 Main obstacles to business growth (%)12
5-9
employees N=277
10-19 employees
N=277
20-49 employees
N=321
All Small businesses
N=598 The economy 29 17 21 19 Competition in the market 5 15 13 14 Recruiting staff 3 13 8 12 Regulations 12 11 10 11 Cash flow 3 7 7 8 Obtaining finance 12 6 7 7 Taxation 14 8 8 7 Shortage of skills generally 3 6 8 7 Premises 2 4 5 4 Managerial skills 2 2 1 2 Other 7 6 2 5 No main obstacle identified
8 4 8 5
Q.D2. Single response only. Base = all respondents regardless of intention to grow the business.
3.2 Reasons for not wanting to grow the business in the next three years
While Table 3.2 concentrates on the obstacles that may limit growth there may also be more personal and circumstantial reasons which inhibit the owner/manager’s intentions to grow. Table 3.3 shows the responses among owners who did not want to grow their business. Only one quarter (24 per cent) of businesses expressed the view that they did not want to grow their business. This lack of ambition was lower than the proportions recorded in our study of micro businesses (38 per cent of 1-4s and 29 per cent of 5-9s).
The most commonly mentioned reason mentioned for not wanting to grow (42 per cent) was the statement that they were happy with the current size of their business. Only 18 per cent cited market difficulties and their belief that there was insufficient business available.
None of the remaining answers applied to more than seven per cent of the sample but there were some differences by size. The most notable difference was an inability to secure higher levels of finance for 20-49 businesses, reported by 10 per cent of the non-growing 20-49 businesses, compared to just three percent of the non growing 10-19 businesses.
12 SBS categories are used in this table, but there were also many other additional responses, all attracting a small minority of replies that are not shown in the table

Therefore a lack of growth ambition was not always the result of an obstacle per se. Comparing impromptu responses for not wanting to grow with the prompted obstacles set out in Table 3.1 and Table 3.2, very few categories overlap. There was some repetition of the themes of regulation (4 per cent) and finance (5 per cent) and arguably not enough business at this size (18 per cent) corresponds with ‘the economy’. Issues relating to cashflow and taxation were not mentioned at all as deterrents amongst those not contemplating growth. Otherwise a mix of personal reasons (stress, retirement) were relevant.
Differences between 5-9 businesses and 10-49 businesses are very evident, with many more responses of not enough business available and rather fewer of happy at this size.
Table 3.3 Reasons owners did not want to grow their business in the next three years (%) (n=153)
5-9 employees
N=78
10-19 employees
20-49 employees
All Small businesses
N=80 N=73 N=153 Happy at this size 18 41 45 42 Not enough business available 35 19 14 18 Intend to retire in next 3 years - 9 4 7 Can’t get (more) financing 6 3 10 5 Extra regulations / red tape - 3 4 4 Too stressful 6 2 4 3 Don’t want to take out (more) financing 12 1 1 2 Intend to sell/close the business - 2 2 2 Don’t need more staff for type of work done - 1 2 1 Difficult to find the right staff 6 1 2 1 % Not wanting to grow 29 26 22 25 Base: respondents who did not want to grow
Therefore evidence from Table 3.3 indicates that many of the reasons reflected in the standard SBS list of obstacles do not unduly deter small businesses from wanting to grow. Reasons to do with personal circumstances and the outlook of the business may well be considered to be as, if not more, important as the external business environment. The following subsections unpack the specifics of why and how these issues (cashflow, regulation, etc.) affect the prospect of growth amongst small businesses, and goes on to consider how these fit beside obstacles related to internal capacity and vision.
24

3.3 Specific challenges related to Cashflow
Thirty-two per cent of the sample indicated that cashflow was an issue that would limit the growth of their business (Table 3.1). Those businesses reporting cashflow to be an obstacle were asked what actions they had taken in the last two years (Table 3.4) The findings show little difference in reported prevalence between the 10-19 businesses and 20-49 businesses. In the companion study on micro businesses these results showed a clear trend of larger businesses taking more actions, whereas among small businesses, many of the solutions to cashflow are more likely to have been adopted in the smaller 10-19 businesses than the 20-49 businesses.
Table 3.4 Steps taken to improve cashflow (%)13 (N varies)
5-9 employees
N=149
10-19 employees
N=93
20-49 employees
N=94
All Small businesses
N=187 Changed suppliers to decrease costs 68 63 63 63 Improved your payment terms with suppliers 39 48 47 48 Achieved quicker payment times 48 48 44 47 Reduced bad debts 55 48 44 47 Got credit from suppliers 52 49 34 44 Increased overdraft 26 18 25 21 Used government provisions to change payment schemes of taxes 13 17 10 15 Sold invoices / factoring 10 19 14 17 None of the above - 5 8 6
Base = businesses reporting cashflow to be an obstacle to business growth. Multiple answers permitted
Changing suppliers was the most widespread solution to improving cashflow/decrease costs, with nearly two-thirds (63%) doing so. Improving payment terms with suppliers was the second most popular action, taken by just under half of small businesses. As with the microbusiness study the highest proportions of responses concerned measures associated with creditors, rather than debtors. In terms of improving income, 47 per cent achieved quicker payment from customers, and 47 per cent had managed to reduce the level of bad debts.
Notably, relatively few respondents had either used government provisions to improve payment terms of taxes (15 per cent overall, but slightly more among the 10-19
13 This question was only asked of those citing cashflow as a problem

businesses and indeed some of the threshold provisions may debar the 20-49 businesses14).
Self-reported competences in dealing with cashflow
The survey also asked about the business capabilities concerning the management of cashflow (Figure 3.1). There would appear to be a very clear relationship between the level of self-reported competence and cashflow being reported as an obstacle to growth.
Figure 3.1 Proportions of businesses reporting cashflow as an obstacle and self-reported competence dealing with cashflow N=593
Note: All small businesses, weighted results
Table 3.5 sets out the top five steps taken to improve cashflow against self-reported competence in dealing with cashflow. Microbusinesses showed some patterns of higher reported competence corresponding with higher levels of activity, but the table below seems to show the opposite for small businesses. Seeking an explanation for this is difficult, but nevertheless it is encouraging that those small businesses admitting they struggle in this area are nonetheless being proactive in dealing with cashflow.
14 For VAT there are two provisions for businesses with sales below £1.35m – Cash Accounting and Annual Accounting
80%
71%
77%
34%
22%
0%
10%
20%
30%
40%
50%
60%
70%
80%
90%
Very Poor Poor Average Strong Very Strong
Axis
TPro
port
ion
of b
usin
esse
s rep
ortin
g cas
hflo
w as
an o
bsta
cle
to b
usin
ess g
row
th
Self reported competence dealing with cashflow
26

Table 3.5 Steps taken to improve cashflow and self-reported competence in dealing with cashflow (%) (N=187)
Very Poor Poor Average Strong
Very Strong
Changed suppliers to decrease costs 75 60 52 76 53 Achieved quicker payment times 0 40 51 46 45 Got credit from suppliers 75 80 50 32 44 Reduced bad debts 50 60 54 41 43 Improved your payment terms with suppliers 75 80 50 32 44
Base= All respondents answering both self-reported competence in dealing with cashflow and the steps taken to improve cashflow. Each cell shows the percentage of businesses taking that step for each rating of competence.
3.4 Specific challenges related to Regulations
Table 3.6 shows the specific challenges to growth associated with regulation, with 5-9 businesses added for comparison. Again, the findings for small businesses are different to micro businesses. While it might be supposed that regulations become increasingly burdensome as employee headcount increases, a lower proportion of 20-49 businesses reported each factor being a challenge, compared with the 10-19 businesses.
Comparing the proportions between micro businesses and small businesses shows that for most factors smaller businesses reported lower prevalence, with greater confidence in dealing with regulations and less fear that more growth is equated with more regulation. Confidence in dealing with regulation was higher among 10-19 businesses: there were important differences in terms of fewer being unsure which regulations applied (33 per cent vs. 50 per cent) and not knowing how to implement specific regulations (38 per cent vs. 44 per cent)15. Fear that growth might mean more regulations was lower (53 per cent vs. 72 per cent) and regulatory costs are disproportionately greater with growth was less prevalent (46 per cent vs. 56 per cent. These last two results may suggest that small businesses have got over the ‘hump’ that is a regulatory burden and that future growth does not necessarily mean any more regulation. However, the final result shows that small businesses were clear in viewing the administration of regulations as being more burdensome (72 per cent vs. 50 per cent).
15 Overall competence was high and Figure 3.1 is not repeated for regulations because so few reported low levels of competence (a total of eight self-reporting as poor or very poor.

Table 3.6 Specific challenges related to regulation during growth (%)
5-9
employees N=88
10-19 employees
N=150
20-49 employees
N=149
All Small businesses
N=299 Administering regulations too burdensome 50 74 69 72 Fear that growth might mean more regulations 72 56 43 53 Regulatory costs are disproportionately greater with growth 56 48 42 46 Unsure which regulations applied 50 36 27 33 Not knowing how to implement specific regulations 44 43 26 38 None 17 3 8 7
Base = 299 Includes businesses for which regulation was and was not reported as an obstacle to growth in Table 3.1.
3.5 Finance
Overall, 56 per cent of businesses had made or attempted to make an investment in the previous five years. The 10-19 businesses were rather less likely to seek investment, with only 52 per cent doing so, compared with 64 per cent of the 20-49 businesses. The median investment for both sizes of businesses was within the wide category of between £100-249,000, although the distribution is different, with more smaller investments and fewer large investments among the 10-19 businesses, compared with the 20-49 businesses (Figure 3.2).
28

Figure 3.2 Amounts invested in growth in the last five years by sizeband (N=260)
Fewer than half of these businesses making an investment had applied for external finance. For investments below £25,000 only 38 per cent had applied for finance, but this only increased to 52 per cent for investments over £500,000.
Preparation was important for nearly all of these businesses, only one in ten had undertaken no form of preparation. Two-thirds (68 per cent) of finance applying businesses had prepared a business plan, just over half (54 per cent) had taken advice, and 40 per cent had looked at alternative sources of finance.
Three quarters of businesses (75 per cent) not using external finance simply did not need it, and a further 11 per cent had explored the possibilities but decided against it. However, there was a minority that expressed a view of unmet demand. A small minority (11 per cent) could not raise the finance they sought and 2 per cent reported the cost of finance as too high.
Table 3.7 shows the performance of businesses in terms of their growth and whether they had made an investment in the last five years. For both 10-19 and 20-49 businesses one in five businesses had grown despite not making any investment. However, making an investment was associated with rather higher levels of growth, with one third (33 per cent) of 10-19 investing business growing, and 45 per cent of 20-49 investing businesses growing. This growth was even more evident in terms of job gains among the 20-49 businesses, where investing businesses had on average created a further 3 jobs on average in the past two years, compared with stagnant businesses not investing.
15%10%
12%
4%
15%
12%
31%
28%
14%
17%
12%
29%
0%
10%
20%
30%
40%
50%
60%
70%
80%
90%
100%
10-19 people? 20-49 people?
Cum
ulat
ive
dis
trib
utio
n of
loan
s
>£500,000
£250-499,999
£100-249,999
£50-99,999
£25-49,999
<£25,000

Table 3.7 Proportions of businesses growing (%) and job gains by size and investment16
Investing N=297
Not investing N=244
10-19 % Growing 33% 23% Av. jobs change 0.8 0.6
20-49 % Growing 45% 21% Av. jobs change 3.2 0.1
Figure 3.3 shows the perceptions of businesses regarding the relative ease of applying for finance. The figure compares those businesses with previous experience of having sought finance, with those businesses that had not sought finance. The two groups were remarkably similar, with similar proportions in each category. If anything, those not previously seeking finance regarded the process as slightly easier than those that had recently sought finance. In policy terms the important observation is that those not seeking finance are not necessarily more deterred than those that had sought finance17, nor are their expectations unrealistic.
16 No comparable question asked of micro businesses 17 The survey did not ask whether those seeking finance were successful, which would have permitted further useful comparison
30

Figure 3.3 Proportions of businesses reporting the ease of applying for finance by experience of seeking finance (N=296)
3.6 Exporting
Overall just over one quarter (26 per cent) of the surveyed businesses reported earning some of their sales through exporting. Nearly half of these exporters (49 per cent) had exports equivalent to less than ten per cent of their sales. For the purposes of this study we focus on those with more than 10 per cent of sales from exports as being exporters and on this basis just 13 per cent were exporters. In terms of sizebands, the 10-19 businesses were rather less likely to export (11 per cent) than the 20-49 businesses (17 per cent).
Table 3.8 shows the performance of businesses in terms of their growth and whether they were exporting businesses. For both 10-19 and 20-49 businesses exporting was associated with a higher proportion of businesses growing. For 10-19 businesses exporting was associated with an additional job created, whereas for 20-49 businesses job creation was similar, but the difference was manifested in a higher proportion of growing businesses (51 per cent of exports grew, compared with 34 per cent of non-exporters).
22% 25%
14%
18%
23%
22%
16%
15%
26%19%
0%
10%
20%
30%
40%
50%
60%
70%
80%
90%
100%
Sought finance Did not seek finance
Very difficult
Difficult
Neither easy nor difficult
Easy
Very easy

Table 3.8 Proportions of businesses growing (%) and job gains by size and exporting18
Exporting N=78
Not exporting N=523
10-19 % Growing 32% 28% Av. jobs change 1.8 0.5
20-49 % Growing 51% 34% Av. jobs change 2.0 2.1
The non-exporting businesses were asked whether they believed their business could realistically achieve levels of exports greater than ten per cent of their sales. Some 41 per cent of the low-level exporters believed they could achieve higher levels of exports, but only 5 per cent of those with zero exports believed they could achieve this level.
Table 3.9 below shows respondent ratings of six barriers to exporting, comparing the answers of the potential exporters with those that are already exporting. For each of the six categories potential exporters rated the obstacle as being more difficult than significant exporters did, despite being of a relatively similar size (an average of 21 and 22 employees respectively).
A lack of management time was rated to be the most difficult obstacle for potential exporters, which is something of an obstacle for the significant exporters, albeit at a lower level. Little knowledge of how to export and difficulty in finding customers also attract higher ratings from potential exporters. The fear of payment problems, the cost of exporting and being too small to export are rated as being less significant obstacles by potential exporters and their perceptions are not so distant from the significant exporters. Lack of management time and little knowledge of how to export showed a statistically significant result.19
18 Only six businesses in the 5-9 category were exporters 19 Chi squared tests showed lack of management time (p=0.002) and little knowledge of how to export (p=0.035) to be statistically significant.
32

Table 3.9 Ratings of obstacles to exporting by potential exporters and significant exporters (average of likert scores 1=insignificant, 5=significant) (N varies)
Potential exporters
Significant exporters
Lack of management time* 3.2 2.1 Little knowledge of how to export* 2.8 2.3 Difficulty finding overseas customers 2.8 2.1 Fear of payment problems 2.3 1.9 The cost of exporting 2.1 1.7 Being too small to export 1.7 1.4
Base= All respondents indicating they could potentially achieve exports equivalent to 10 per cent of sales
3.7 Innovation
Table 3.10 shows the proportions of businesses improving their products and services and improving processes that involved a significant investment or reorganisation of the business, as well as those doing neither across the previous five years. The majority of businesses reported no such significant innovation (62 per cent) and this was most common for the 10-19 businesses. Just over one quarter of businesses had made significant improvements to their products or services, and there was quite a substantial difference between the 10-19 businesses (23 per cent) and the 20-49 businesses (31 per cent). Only one fifth ( 21 per cent) of businesses reporting making significant process innovations across the previous five years, and there was very little difference according to sizeband. A separate question concerning intellectual property (patents, copyrights and trademarks) was also asked, and a minority of just nine per cent reported that they had done so, again with a higher proportion of 20-49 businesses doing so.
Table 3.10 Proportions of businesses improving products/services and improving processes (%)20
Improving products/services
N=162
Improving processes
N=124 Neither N=369
10-19 23 20 66 20-49 31 22 59 All 27 21 62
Base: All small businesses
20 5-9 businesses asked a different question yielding different results.

Table 3.11 and Table 3.12 show the proportions of businesses growing and job gains for both improved goods/services and improved processes. In both cases the proportion of businesses growing and jobs created were higher for innovating businesses, with higher results for 20-49 businesses and better results for those businesses with process innovations. Product or service innovation had resulted in an additional employee on average in terms of job growth, with a higher proportion growing and higher jobs growth among the 20-49 businesses. The differences between those adopting new processes and those not doing so were even more evident than for improved products/services and resulted in a difference of 1½ additional employees.
Table 3.11 Proportions of businesses growing (%) and job gains by size and improved goods/services
Innovating N=162
Not innovating N=439
10-19 % Growing 33% 27% Av. jobs change 1.5 0.4
20-49 % Growing 44% 33% Av. jobs change 3.0 1.7
Base: All small businesses
Table 3.12 Proportions of businesses growing (%) and job gains by size and improved processes
Innovating N=124
Not innovating N=477
10-19 % Growing 37% 26% Av. jobs change 1.8 0.5
20-49 % Growing 51% 33% Av. jobs change 3.4 1.2
Base: All small businesses
The survey also asked about small businesses collaborating with larger businesses to develop products/services and improve processes (Table 3.13). One quarter (25 per cent) of surveyed small businesses had engaged in such activity and this was equally common for 10-19 businesses and 20-49 businesses. These businesses tended to be those that had made their own significant innovation, but the two did not exactly correspond, such that 40 per cent of the innovators also collaborated, but as many as 17 per cent of non-innovators also collaborated, such that they received benefits even if they had not made their own significant investment in their business. This collaboration produced very similar results to other business improvements, but was notable for having created the most additional jobs on average (nearly five) among the 20-49 businesses, although these benefits were less evident for the 10-19 businesses.
34

Table 3.13 Proportions of businesses growing (%) and job gains by size and collaboration with larger firms21
Collaboration N=140
Collaboration N=406
10-19 % Growing 31% 27% Av. jobs change 1.3 0.4
20-49 % Growing 42% 35% Av. jobs change 4.8 1.2
Base: All small businesses
Table 3.14 shows the average ratings of difficulty associated with different factors concerning innovation. The differences in difficulty ratings between innovators and non-innovators was very slight, but for each of the categories innovators, on average offered a higher rating of the barrier. These results suggest that the relative effort associated with these factors is not so much of a deterrent to innovation, and that non-innovating businesses are put off for other reasons.
There remains some value in considering which obstacles the innovators rate highest. A further comment about non-innovators is that they rate obstacles similarly, albeit lower in each case. Overall, regulations surrounding innovation were rated as the greatest obstacle, followed closely by high costs and a market dominated by larger businesses. Resources (finance, personnel) tended to be rated lower in relative terms, than the external factors. Three results produced statistically significant differences between innovators and non-innovators: costs too high; lack of qualified personnel; and lack of internal funds. 22
Table 3.14 Ratings of obstacles to innovation by innovators and non-innovators (average of likert scores 1=not important, 5=important) (N varies)
Innovation No Innovation Regulations 2.7 2.5 Costs too high* 2.8 2.3 Market dominated by larger businesses 2.6 2.3 Lack of qualified personnel* 2.4 2.2 Lack of internal funds* 2.3 2.1 Lack of external finance 2.2 1.9 Difficulty in finding external partners 1.9 1.7
Base: All small businesses
21 Question on collaboration not asked of the 5-9 businesses 22 Chi squared tests showed costs too high (p=0.006); lack of qualified personnel (p=0.028); and lack of internal funds (p=0.015) to be statistically significant.
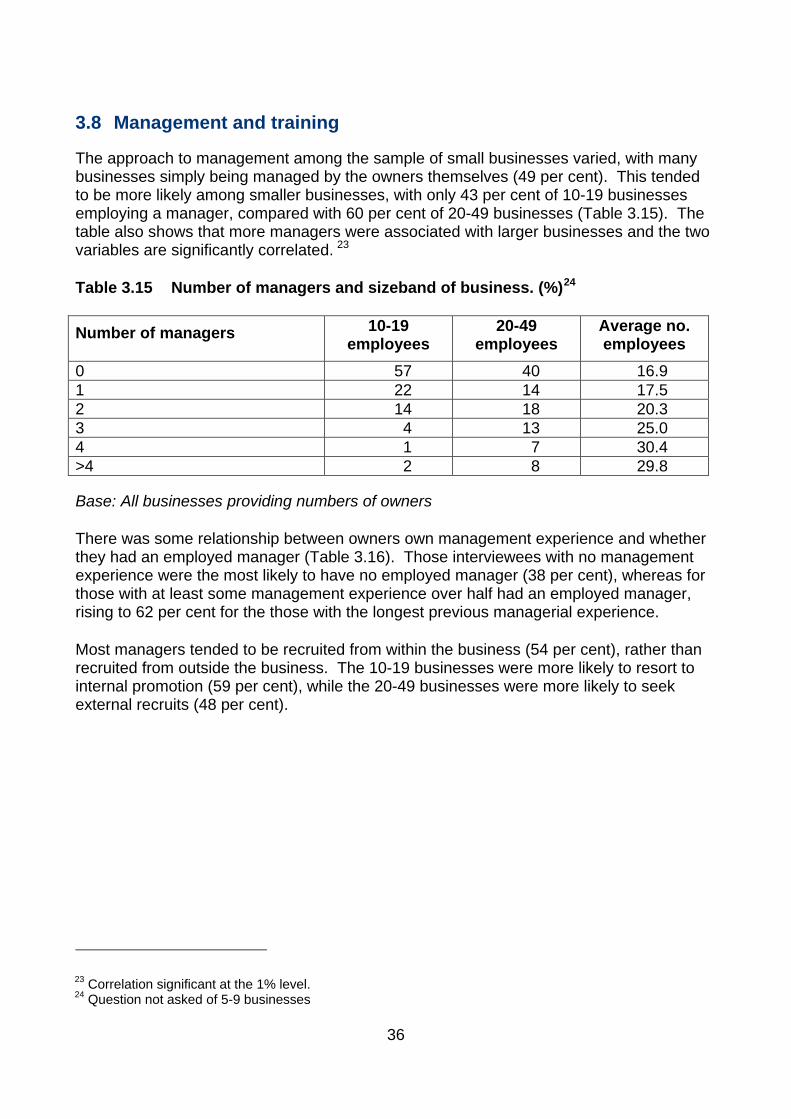
3.8 Management and training
The approach to management among the sample of small businesses varied, with many businesses simply being managed by the owners themselves (49 per cent). This tended to be more likely among smaller businesses, with only 43 per cent of 10-19 businesses employing a manager, compared with 60 per cent of 20-49 businesses (Table 3.15). The table also shows that more managers were associated with larger businesses and the two variables are significantly correlated. 23
Table 3.15 Number of managers and sizeband of business. (%)24
Number of managers 10-19 employees
20-49 employees
Average no. employees
0 57 40 16.9 1 22 14 17.5 2 14 18 20.3 3 4 13 25.0 4 1 7 30.4 >4 2 8 29.8
Base: All businesses providing numbers of owners
There was some relationship between owners own management experience and whether they had an employed manager (Table 3.16). Those interviewees with no management experience were the most likely to have no employed manager (38 per cent), whereas for those with at least some management experience over half had an employed manager, rising to 62 per cent for the those with the longest previous managerial experience.
Most managers tended to be recruited from within the business (54 per cent), rather than recruited from outside the business. The 10-19 businesses were more likely to resort to internal promotion (59 per cent), while the 20-49 businesses were more likely to seek external recruits (48 per cent).
23 Correlation significant at the 1% level. 24 Question not asked of 5-9 businesses
36

Table 3.16 Number of managers and sizeband of business. (%)
Management experience % businesses with employed manager
None 38 <3 years 52 3-5 years 54 6-10 years 53 11-15 years 56 >15 years 62
Base: All businesses providing numbers of owners and whether they employed a manager
Owners were also asked at what size they took on their first manager, or what size they would if they had not already done so. The results showed a remarkable difference, with manager-employing businesses having just 14 employees when they first employed a manager, compared with non-manager employing businesses estimating the correct level to be 26 employees and this difference is statistically significant.25
The survey also enquired about the types of senior manager employed. Table 3.17 challenges whether ‘senior manager’ may be a question of semantics and it is certainly true that many businesses not designating staff as ‘senior’ have dedicated staff for those job roles. Despite this, those businesses with the designation of senior management were more likely to have a dedicated resource for these roles, except for purchasing.26 A very large number of alternative categories attracted minor responses, but only 4 per cent gave answers equating to managing director (general manager, CEO, Managing Director), suggesting that owners were largely assuming this role themselves, but able to relinquish some control in other areas.
Table 3.17 Number of managers and sizeband of business. (%) (N=598)
Job role ‘Senior manager’ No Senior management
Operations Manager 61 38 Financial Director 51 38 Sales manager 47 39 Human Resources Manager 44 29 Purchasing Manager 27 26 Technology Manager 30 22
Table 3.18 shows that having senior managers employed within the business was associated with higher levels of growth. The proportions of growth for 10-19 businesses and 20-49 businesses were similar (39 per cent and 42 per cent respectively), although in
25 T-test significant at 1% level. 26 All results statistically significant at 5% level

this instance the difference in the proportions growing was more evident among the 10-19 businesses. This translated into an additional job being created in the 10-19 businesses and nearly two additional jobs in the 20-49 businesses, compared with those businesses not employing a senior manager.
Table 3.18 Proportions of businesses growing (%) and job gains by size and presence of senior managers27 (N=548)
Senior Managers
N=260
No Senior managers
N=288 10-19 % Growing 39% 20%
Av. jobs change 1.2 0.2 20-49 % Growing 42% 28%
Av. jobs change 2.8 1.0
3.9 Sales
Many of the factors previously discussed concern the capacity of the business to move forwards, but we also asked very direct questions about efforts to grow sales. Unsurprising, the vast majority of businesses had undertaken efforts to improve their sales or attract new customers. However 17 per cent of 10-19 businesses reported not making any such efforts, as did 14 per cent of 20-49 businesses. The survey also asked supplementary questions about exactly what actions had taken place.
Table 3.19 shows the somewhat unexpected result that for many of these types of business improvement, that performance was better among non-adopters than those adopting the practice. The only notable difference was for having a dedicated sales or marketing manager. It is not possible to explain why this is the case, nor that these practices are detrimental to the company, because we do not know how well they were implemented.
It may be that additional effort is expended in sales only when there are problems with order books that prompt action, while growing companies do not need to resort to such practices. This also suggests that companies may be better in undertaking some of the earlier activities in building capacity in their businesses, rather than the more obvious action of better selling.
27 Question not asked of 5-9 businesses
38

Table 3.19 Adoption of sales improvement practices and associated job gains
Sales improvement practices
% adopting practice
Jobs gain Adoption
Jobs gain Non-
adoption Approached new customers 77 1.4 1.3 More advertising 65 1.2 1.6 Devised a new marketing strategy 57 1.2 1.5 Dedicated sales/marketing manager 29 2.0 1.1 Undertaken training in marketing/sales 29 1.1 1.4
3.10 Market Constraints
Most of the obstacles discussed in sections 3.2-3.8 above could be considered as external to the business and might be classed as market or environmental constraints.
In addition to these questions the survey also asked about how the business differentiated itself from the market in terms of the products and services offered and how they positioned themselves in terms of price and quality etc. Table 3.20 shows the average likert scores, where owners rated their businesses from one to ten, where one indicated no agreement with the statement and ten full agreement. There was very little difference between the 10-19 businesses and the 20-49 businesses in terms of these average scores, but the scores themselves differ, as do their relation to growth. The highest scores came from the question about premium quality products and services, with our sample rating themselves as providers of premium products, in other words according to this self-reported evidence very few businesses could be described as market constrained (20 per cent). Customised products and services was rated just below seven on average and this indicator suggested 40 per cent of our sample of market constrained. The much lower averages for leading the way in products and services and dependence on price placed the typical business somewhere in the middle of the range and consequently this meant greater prevalence of market constraints (58 per cent and 65 per cent respectively).
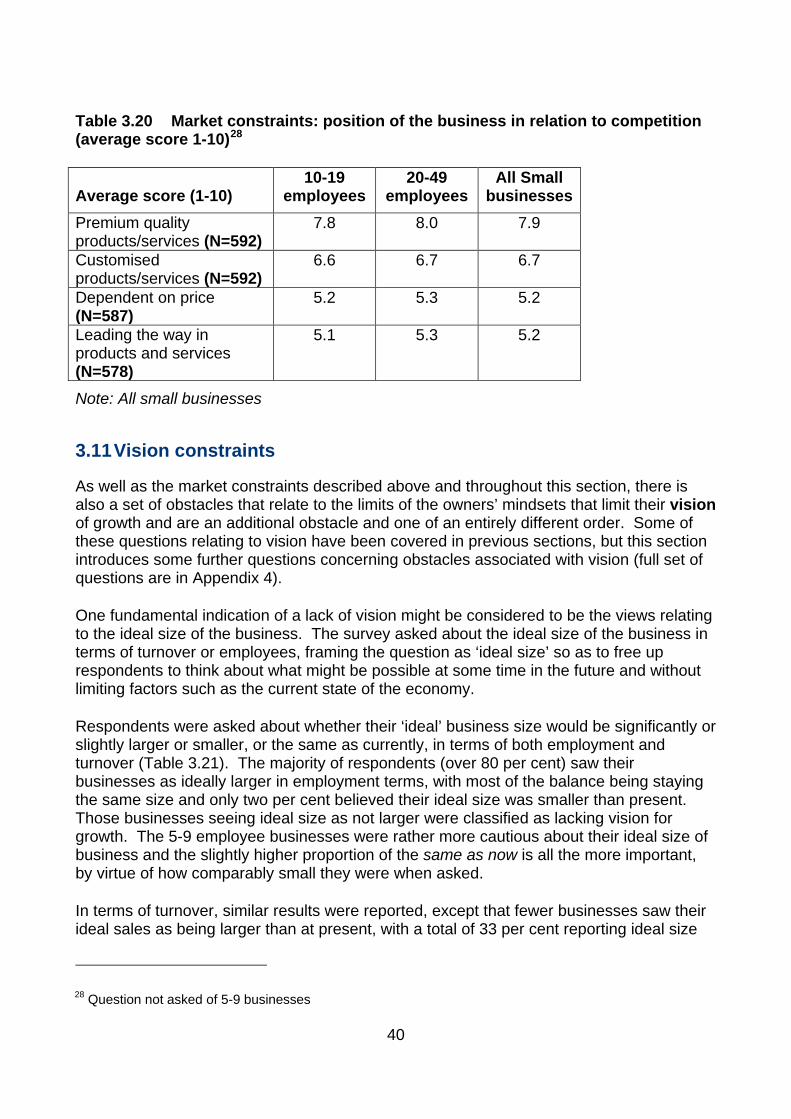
Table 3.20 Market constraints: position of the business in relation to competition (average score 1-10)28
Average score (1-10) 10-19
employees 20-49
employees All Small
businesses Premium quality products/services (N=592)
7.8 8.0 7.9
Customised products/services (N=592)
6.6 6.7 6.7
Dependent on price (N=587)
5.2 5.3 5.2
Leading the way in products and services (N=578)
5.1 5.3 5.2
Note: All small businesses
3.11 Vision constraints
As well as the market constraints described above and throughout this section, there is also a set of obstacles that relate to the limits of the owners’ mindsets that limit their vision of growth and are an additional obstacle and one of an entirely different order. Some of these questions relating to vision have been covered in previous sections, but this section introduces some further questions concerning obstacles associated with vision (full set of questions are in Appendix 4).
One fundamental indication of a lack of vision might be considered to be the views relating to the ideal size of the business. The survey asked about the ideal size of the business in terms of turnover or employees, framing the question as ‘ideal size’ so as to free up respondents to think about what might be possible at some time in the future and without limiting factors such as the current state of the economy.
Respondents were asked about whether their ‘ideal’ business size would be significantly or slightly larger or smaller, or the same as currently, in terms of both employment and turnover (Table 3.21). The majority of respondents (over 80 per cent) saw their businesses as ideally larger in employment terms, with most of the balance being staying the same size and only two per cent believed their ideal size was smaller than present. Those businesses seeing ideal size as not larger were classified as lacking vision for growth. The 5-9 employee businesses were rather more cautious about their ideal size of business and the slightly higher proportion of the same as now is all the more important, by virtue of how comparably small they were when asked.
In terms of turnover, similar results were reported, except that fewer businesses saw their ideal sales as being larger than at present, with a total of 33 per cent reporting ideal size
28 Question not asked of 5-9 businesses
40

as the same as now or smaller. For both sales and employment, a higher proportion of 20-49 businesses reported a larger ideal size.
Table 3.21 Respondents ideal size of business, in terms of employment, compared to currently (%)
5-9 employees
N=269
10-19 employees
N=264
20-49 employees
N=313
All Small businesses
N=577 Significantly larger 23 20 32 24 Slightly larger 49 58 51 56 The same size as now 22 19 17 18 Significantly or slightly smaller
6 2 1 2
Note: All small businesses
Passivity in some respects qualified the businesses as lacking in vision and two of these indicators are shown in Table 3.22, where the business had taken no action, where we would propose a more visionary business would be more likely to have taken these actions. One third of small businesses had not sought any external advice or information and one sixth had not taken any steps to try to increase sales or attract new customers. There was very little difference between the 10-19 businesses and the 20-49 businesses, although the latter were slightly more likely to have attempted to take action on improving sales. For these two questions it would appear that 5-9 businesses are slightly less susceptible to vision constraints.
Table 3.22 Vision constraints: No planning or taking advice in the last five years (%)
5-9
employees 10-19
employees 20-49
employees All Small
businesses Not sought external advice or information (N=588)
24 33 32 33
Not taken any steps to try to increase sales or attract more customers (N=594)
11 17 14 16
Note: All small businesses
Table 3.23 shows a series of questions concerning fears associated with growth and the possible consequences of growth on the business. Businesses were asked to respond on a likert scale from strongly agree to strongly disagree. The questions are generally posed negatively (e.g. growing my business would be too costly) and therefore agreement

indicates a failure of vision29. One third of businesses reported that growth would pose an unnecessary risk to the survival of the business, and a similar proportion indicated growth would be too costly, with only small differences between the sizebands. Slightly fewer than one third of businesses also indicated that growth would represent the loss of too much control of the business. The final row shows a very different question, asking about the preparedness of investing money in the business, and reporting a rather higher prevalence (46 per cent).
The results of the 5-9 businesses show some sharp divergence from the small businesses. The proportion fearing growth as posing a risk to survival was very similar, suggesting that this effect is relatively equal across different sizebands. The results for losing control were slightly different, but not markedly so. However, there were quite considerable differences in terms of preparedness to invest my own money to grow the business, which was much more of a fear for small businesses, perhaps because of the level of personal investment already committed, or a different view of external finance operating among the small businesses. More than double the proportion of 5-9 businesses succumbed to the fear of growing my business would be too costly. The rather lower figures for 10-19 businesses suggests that making this transition is easier than 5-9 businesses imagine and a rebuttal of their ungrounded fear.
Table 3.23 Vision constraints: Fears causing aversion to grow (%)
5-9
employees 10-19
employees 20-49
employees All Small
businesses Growing my business would be unnecessarily risky to its survival (N=592)
35 36 31 34
Growing my business would be too costly (N=591)
71 33 34 33
Growth would mean I’d lose too much control of the business (N=590)
20 33 26 31
I am prepared to invest my own money to grow the business (N=564)
25 45 49 46
Note: All small businesses
The final question relating to vision concerned whether owners personally desired business growth, posing the question so as to focus more on them, rather than the business. Table 3.24 shows that there was very little difference in terms of the personal desire for growth between the 10-19 businesses and the 20-49 businesses. Elsewhere in this report there is often a marked difference between these groups and this may relate to
29 Answers of strongly agree, agree and neither agree nor disagree qualify as vision constrained, except for I am prepared to invest my own money, which, because of its phrasing means that the order is reversed.
42

how these owners think about their businesses, rather than their personal viewpoints. Overall, there was a significantly positive correlation between desire for growth and historical employment growth in the past two years, indicating that this personal disposition is important. 5-9 businesses were not so different to small businesses (both 10-19 and 20-49), with precisely the same average, albeit a higher proportion offering the rating ‘10’, offset by a higher proportion of low ratings as well.
Table 3.24 Owners individual desire for business growth now (%)
Note: All small businesses
3.12 Capacity constraints
In addition to the external constraints and the internal vision constraints, a third type of constraint is evident, which relates to the internal capacity and capability of the business. Capacity constraints are manifested in issues such as staff training, operational and strategic planning and innovation. Businesses are subject to capacity-related obstacles when they do not conduct any of the activities in this category.
Table 3.25 shows the extent to which businesses had some investment in planned development, expressed in terms of the absence of a current updated business plan and no external staff training. More than half of the surveyed businesses had business plans that had been updated in the past twelve months. There was ten percentage points difference between the 10-19 businesses and 20-49 businesses. A similar question asked about the development of the workforce showed that four fifths (79 per cent) of businesses had invested in external training for their staff, with slightly more of the 10-19 businesses opting not to use external training. As might be expected these capacity constraints were more prevalent for 5-9 businesses. The difference in proportions between 5-9s and 10-19s for a recently updated business plan was just six percentage points, but this increased to sixteen percentage points for an absence of external staff training.
5-9 employees
N=272
10-19 employees
N=269
20-49 employees
N=315
All Small businesses
N=584 1 (Not at all) 5 4 4 4 2 2 1 1 1 3 4 2 1 2 4 4 3 2 3 5 13 17 13 15 6 5 6 8 7 7 11 11 15 13 8 13 17 16 17 9 5 6 5 6 10 (Very strong) 39 32 32 32 Average score 7.4 7.4 7.4 7.4

Table 3.25 Capacity constraints: No planning or external training (%)
5-9 employees 10-19
employees 20-49
employees
All Small businesses
No recently updated business plan in last 12 months (N=600)
55 49 38 43
No external staff training in the last five years (N=582)
40 24 19 21
Note: All small businesses
Table 3.26 shows a series of five questions concerning self-reported capability expressed in terms of: people management; staff training; implementing a business plan; dealing with regulation and managing cashflow. Businesses were asked to respond on a likert scale from very poor to very good, with answers of Very poor, poor, average or no experience qualifying as indicating a failure of capacity. In each case the difference between 10-19 businesses and 20-49 businesses was very small, with more important results relating to the prevalence of these capacity constraints. The highest recorded proportion of these capacity constraints was a low capability to implement a business plan, reported by one third of businesses. Although, many businesses had a current business plan this was not necessarily being realised within the business and implementation was a stumbling block for the business. Staff development and people management both recorded similar scores, close to 30 per cent indicating that for many businesses making optimal use of their staff and knowing how to do this was an issue. Capability to deal with regulation was a weakness for one in five businesses and managing cashflow was a deficiency for just 12 per cent of businesses.
The pattern among 5-9 businesses repeated the trend in Table 3.25 in showing a greater proportion of answers indicating capacity constraint, in each case reporting greater prevalence than small businesses. Dealing with regulation showed the greatest difference (16 percentage points). Capability to manage cashflow only affected a very small percentage of small businesses (12 per cent), but affected 22 per cent of 5-9 businesses. Other differences in responses were more modest, with a difference of six percentage points in implementing a business plan and just four percentage points in people management capability as 5-9 businesses made the transition to becoming small businesses. Overall, making this transition from being a micro business to a small business clearly requires a greater confidence in dealing with such matters, through undertaking activity more frequently or simply the larger scale of the business necessitating increased familiarity and competence.
44

Table 3.26 Capacity constraints: Self-reported capabilities (%) (N varies)
5-9
employees 10-19
employees 20-49
employees All Small
businesses Capability to implement a business plan (N=577)
43 37 32 35
Capability to train staff (N=595)
N/a 30 29 30
People management capability (N=592)
32 28 27 28
Capability to deal with regulation (N=575)
36 19 21 20
Capability to manage cashflow (N=590)
22 13 12 12
Note: All small businesses
3.13 Segmenting small businesses into constraint type
To begin to more fully understand the relative importance of different obstacles to growth, further analysis was undertaken to allocate respondents to one of four categories according to whether they were identified as being constrained by (i) their internal capacity and capability to grow; (ii) the external environment, including the market in which the business operates and (iii) the psychological limits or vision of the owner in relation to growth. A selection of key questions from our survey were used to allocate businesses to categories based on the number of obstacles faced in these areas. Businesses were classified as having one, two or all three constraints applying, while a smaller number were classified as being unconstrained (making up the fourth category). First we consider the effectiveness of aggregating obstacles (section 3.14), before we consider their separate treatment as clusters of obstacles classified into types of constraint (section 3.15).
3.14 Aggregated barriers
The telephone survey asked 31 key questions that represented obstacles to business growth30. The lowest number of obstacles faced by any business was one – no business faced no obstacles at all. The highest number faced by any business was 22 out of the total of 31. Thus, none of the 601 businesses surveyed31 were entirely constrained; all had at least some dimensions where they were in some respects unfettered by obstacles. The average number of obstacles was eleven.
30 Tables showing the questions taken from the telephone survey are shown in Appendix 1. The questions differ from the microbusiness study, in that those questions relating to one person businesses have been removed, while new questions have been added. 31 All 601 interviews were able to provide sufficient information to receive a score and also to be included in the later constraints analysis (Section 3.15 and 3.16)

Figure 3.4 shows the relationship between the number of obstacles and the proportion of businesses exhibiting growth over the period 2012-14. The expected relationship of an increasing number of barriers being associated with a lower proportion of businesses growing is shown by the trend line32.
Figure 3.4 Relationship between number of obstacles and proportion of growing businesses (2012-14)
Figure 3.5 shows the relationship between the number of obstacles and proportion of businesses described as having growth ambition. The graph shows a very pronounced downward trendline33. None of the businesses with 17 or more barriers were judged to have growth ambition, with growth ambition much more concentrated in those businesses with the fewest reported barriers.
The evidence presented here shows that aggregating obstacles has a weak association with previous growth, but a very strong relationship with growth ambition, based on the number of obstacles they face. The next section brings the obstacles together into clusters, based on types of constraint that businesses might face.
32 Although the inverse relationship is clear, correlation coefficient -0.069, the result is not statistically significant p=0.102. 33 A highly significant result, p=0.00
0%
10%
20%
30%
40%
50%
60%
70%
80%
90%
100%
0 1 2 3 4 5 6 7 8 9 10 11 12 13 14 15 16 17 18 19 20 21 22
Prop
ortio
n of
bus
ines
ses
expe
rienc
ing
grow
th
Number of obstacles per business
46

Figure 3.5 Relationship between number of obstacles and growth ambition
3.15 Pattern of constraints
Having shown that collectively representing barriers is instructive for highlighting differences in growth history, but more so for growth ambition, we now drill-down to examine how clusters of questions help explain growth. The same 31 obstacles in section 3.14 were recombined so that each question was allocated to one of the three types of constraint (Vision, Market, and Capacity). Businesses which reported a certain minimum number of obstacles for the constraint were designated as being so constrained.
Table 3.27 shows the extent to which small businesses are constrained by the categories outlined above. Small businesses are more limited by market and vision constraints (51 and 53 per cent respectively). The constraint which the lowest proportion of small businesses were subject to (38 per cent) was the capacity constraint i.e. those factors which relate to the capacity and capabilities of the business to internally develop and implement change. As many as 18 per cent of small businesses were unconstrained.34 When judged against these three constraints there is a higher proportion of 10-19
34 Unconstrained businesses still faced a number of obstacles, on average six obstacles. Businesses facing a single constraint had nine obstacles, those with two constraints faced 13 obstacles, while those with all three constraints faced on average 16 obstacles.
0%
10%
20%
30%
40%
50%
60%
70%
80%
1 2 3 4 5 6 7 8 9 10 11 12 13 14 15 16 17 18 19 20 21 22 23
Prop
ortio
n of
bus
ines
ses w
ith g
rwot
h am
bitio
n
Number of obstacles per business

businesses exhibiting signs of limiting factors that may affect growth, than the 20-49 businesses.
Table 3.27 Proportion of businesses according to type of constraint (%)
5-9
employees 10-19
employees 20-49
employees All small
businesses Vision 47 53 54 53 Capacity 45 40 34 38 Market 62 53 47 51 Unconstrained 13 16 21 18
A representation showing the substantial overlaps between these categories is presented at Figure 3.6. The size of each ellipse is exactly proportional to the size of the sample represented and the area of the overlap is also to scale. The figure highlights that the extent of overlap is by no means even, with just eight per cent of small businesses facing vision and capacity but not market constraints, while the vision and market constraint (but not capacity) accounts for 13 per cent. Only one third of small businesses are constrained in only one aspect (37 per cent), while 30 per cent have only two constraints and 15 per cent of businesses were classified as being subject to all three constraints (see Table 3.28).
Figure 3.6 Venn diagram of constraints
Market constrained
Capacity constrained
Vision constrained
Unconstrained = 18%
15%
14%
9%
6%13%
8%
16%
48

Table 3.28 Proportion of businesses by number of constraints (%)
5-9
employees 10-19
employees 20-49
employees All Small
businesses Unconstrained 13 16 21 18 One constraint 36 38 35 37 Two constraints 35 29 31 30 Three constraints 16 17 13 15
As already discussed, the proportion of businesses exhibiting each constraint is very sensitive to sizeband (Figure 3.7 and Figure 3.8). The 10-19 businesses are proportionately more constrained in each of the three categories, which corresponds to their lower levels of growth and lower growth ambition. This is particularly important in terms of there being proportionately more 10-19s that are subject to all three constraints and proportionately fewer than are unconstrained.
Figure 3.7 Venn diagram of constraints – 10-19 employees
Market constrained
Capacity constrained
Vision constrained
Unconstrained = 16%
17%
16%
9%
7%13%
15% 8%
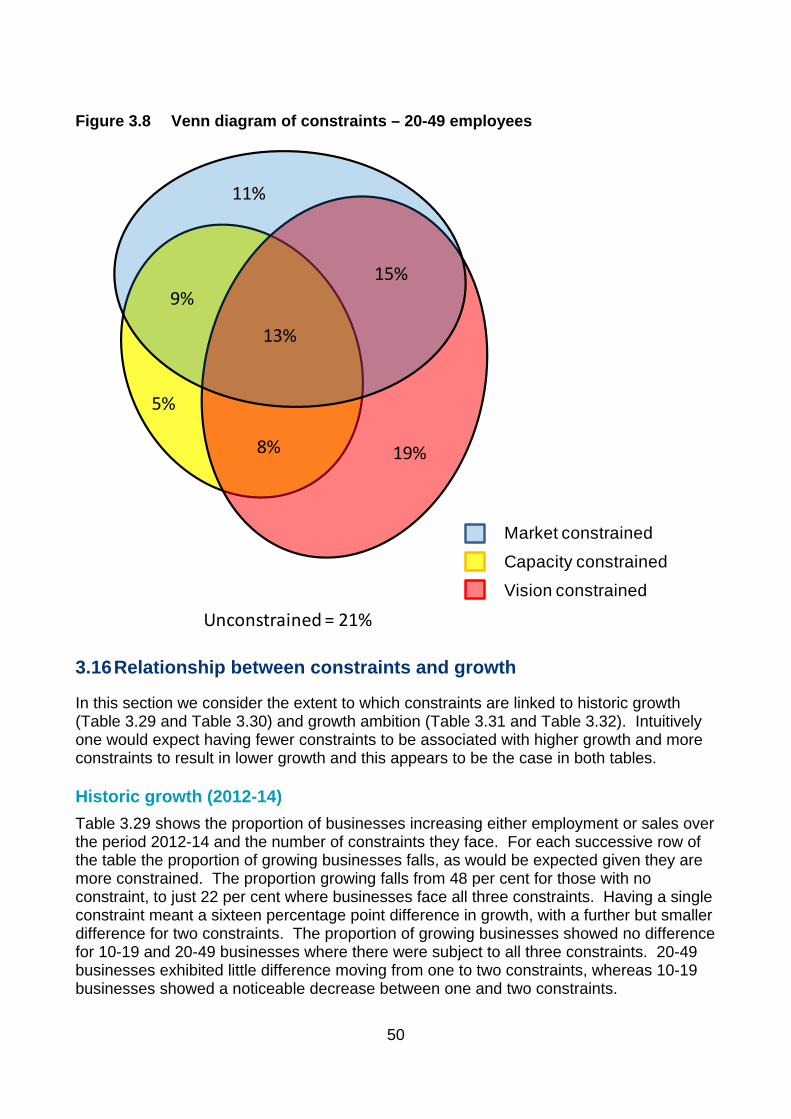
Figure 3.8 Venn diagram of constraints – 20-49 employees
3.16 Relationship between constraints and growth
In this section we consider the extent to which constraints are linked to historic growth (Table 3.29 and Table 3.30) and growth ambition (Table 3.31 and Table 3.32). Intuitively one would expect having fewer constraints to be associated with higher growth and more constraints to result in lower growth and this appears to be the case in both tables.
Historic growth (2012-14) Table 3.29 shows the proportion of businesses increasing either employment or sales over the period 2012-14 and the number of constraints they face. For each successive row of the table the proportion of growing businesses falls, as would be expected given they are more constrained. The proportion growing falls from 48 per cent for those with no constraint, to just 22 per cent where businesses face all three constraints. Having a single constraint meant a sixteen percentage point difference in growth, with a further but smaller difference for two constraints. The proportion of growing businesses showed no difference for 10-19 and 20-49 businesses where there were subject to all three constraints. 20-49 businesses exhibited little difference moving from one to two constraints, whereas 10-19 businesses showed a noticeable decrease between one and two constraints.
Market constrained
Capacity constrained
Vision constrained
Unconstrained = 21%
13%
8%
5%
9%
19%
11%
15%
50

Table 3.29 Proportion of businesses growing (2012-14) by number of constraints (%)35
5-9 employees 10-19
employees 20-49
employees
All Small businesses
No constraint 59 45 53 48 Any single constraint 46 31 36 32 Two constraints 51 19 34 25 All three constraints 37 22 21 22
This pattern is very much as expected, but there is a difference in growth according to the type of constraint (Table 3.30), with those capacity constrained far more likely to report growth than those affected by either of the other two constraints, mainly due to the 20-49 businesses. Of those only affected by a single constraint, those which were capacity constrained were most likely to report growth (43 per cent), compared to 33 per cent of those affected by only the vision constraint and 26 per cent of those only market-constrained.
Table 3.30 Proportion of businesses growing (2012-14) by type of constraint (%)
5-9 employees
10-19 employees
20-49 employees
All Small businesses
Capacity only 63 39 56 43 Vision only 54 33 33 33 Market only 32 24 32 26
Anticipated growth
Table 3.31 shows the proportion of businesses with substantive growth ambition and the number of constraints they face. The pattern here is similar to, but stronger than for growth history, which might suggest that owners’ views concerning growth are more synchronised with the obstacles they perceive than the actual growth they experience. For each successive row of the table the proportions of businesses expecting to grow in the future decrease, such that 34 per cent of unconstrained businesses indicated a substantive growth ambition, compared with only 2 per cent of those that were subject to all three constraints. The differences between 10-19 businesses and 20-49 businesses were most evident where there was no constraint, but where there were some constraints there was little difference.
35 The definition of growth used in the microbusinesses report is different and creates difficulties in comparison in Table 3.29 and Table 3.30.
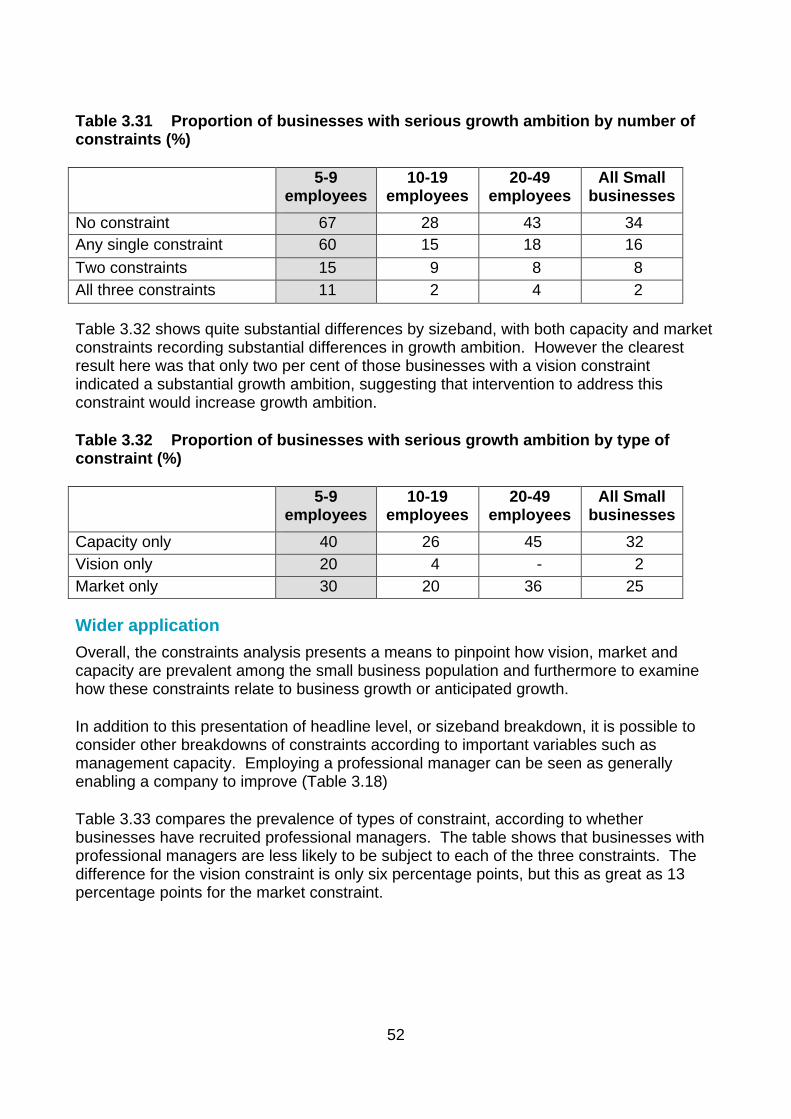
Table 3.31 Proportion of businesses with serious growth ambition by number of constraints (%)
5-9 employees
10-19 employees
20-49 employees
All Small businesses
No constraint 67 28 43 34 Any single constraint 60 15 18 16 Two constraints 15 9 8 8 All three constraints 11 2 4 2
Table 3.32 shows quite substantial differences by sizeband, with both capacity and market constraints recording substantial differences in growth ambition. However the clearest result here was that only two per cent of those businesses with a vision constraint indicated a substantial growth ambition, suggesting that intervention to address this constraint would increase growth ambition.
Table 3.32 Proportion of businesses with serious growth ambition by type of constraint (%)
5-9 employees
10-19 employees
20-49 employees
All Small businesses
Capacity only 40 26 45 32 Vision only 20 4 - 2 Market only 30 20 36 25
Wider application Overall, the constraints analysis presents a means to pinpoint how vision, market and capacity are prevalent among the small business population and furthermore to examine how these constraints relate to business growth or anticipated growth.
In addition to this presentation of headline level, or sizeband breakdown, it is possible to consider other breakdowns of constraints according to important variables such as management capacity. Employing a professional manager can be seen as generally enabling a company to improve (Table 3.18)
Table 3.33 compares the prevalence of types of constraint, according to whether businesses have recruited professional managers. The table shows that businesses with professional managers are less likely to be subject to each of the three constraints. The difference for the vision constraint is only six percentage points, but this as great as 13 percentage points for the market constraint.
52

Table 3.33 Proportion of constrained businesses by management involvement and type of constraint (%)
Professional Managers
No professional
managers Capacity only 34 41 Vision only 48 54 Market only 46 59
Table 3.34 shows the degree to which management influences the number of constraints businesses are subject to. The difference is evident in a higher proportion of unconstrained businesses with professional managers, compared to businesses without professional managers (22 per cent and 14 per cent respectively). This pattern is also manifest in businesses that are subject to all three constraints, where only 12 per cent of businesses with managers were fully constrained, compared to 18 per cent of those without professional managers.
Table 3.34 Proportion of constrained businesses by management involvement and number of constraints (%)
Professional Managers
No professional
managers Unconstrained 22 14 Any single constraint 39 36 Two constraints 27 31 All three constraints 12 18

4 Qualitative discussions with business owners
4.1 Introduction
In total, 50 business owners took part in the qualitative phase of the research: 19 owners participated across two focus groups, and a further 31 undertook a semi-structured telephone interview, lasting around 40 minutes, on average.
The aim of the focus groups was to explore in depth business owners’ views on growth, including how they conceptualise growth, perceived barriers, the consequences of growth for their business and their personal circumstances and evidence of mindsets among owners which may restrict their potential business growth. In particular, the focus groups sought to uncover ‘myths’: assertions about growth which were not correct and/or which served as a rationalisation or defence of their desire not to grow. As noted in the literature review, asking owners about their lack of growth may prompt a defensive response, or a justification for remaining small, rather than simply admitting that they would rather remain small. This did occur, although some did express the preference for remaining small as well. The point of this part of the research is not necessarily to persuade an owner to pursue growth when they would rather not, but to uncover systematic beliefs and biases which may prevent owners pursuing a growth strategy when they otherwise have the potential and inclination to do so. This process allows the development of a response, derived from the views of other owners, surveys, official data etc., to ‘rebut’ the myth and demonstrate that the obstacles to growth are not as high as may have been believed, or that the anticipated negative consequences of growth (e.g. a higher regulatory burden) have been exaggerated. It should be noted that none of the following myths are absolute i.e. they do not apply to all small businesses.
4.2 General attitude toward growth
Myth 1: You can’t grow during a recession. The slight majority of interviewees were satisfied at the current size of their business, given the situation of the market and the economy, and had no active plans to grow. Further growth was not necessarily explicitly ruled out, but was likely to be opportunistic and incremental; subject to an upper limit which the owner and management team considered they could manage; or subject to other perceived constraints (the size of the market, quality of the pool of potential new recruits etc). The majority who were not actively pursuing a growth strategy commonly cited one or more or the following limiting factors:
(i) they operated in a limited market (including those which relied on government funding or were restricted in their offer, such as private nurseries), or were only just beginning to see signs of a recovery in their sector. Growth, in such circumstances, was difficult – for example, it may entail having to open new premises elsewhere. This attitude was often compounded by an attitude that the return was too low for the work, resources and level of risk needed to expand
54

To get more places, we would have to open another nursery. But nobody wants to do that – it’s too hard work. We could start another one, in another part of town, but that’s not likely to happen. No money, too much hard work. Not scared, just tired. Wouldn’t go looking for something. (Nursery, South East, 20-49)
(ii) they could envisage no way to diversify their offering to increase their sales, limiting their potential market.
(iii) they could not find skilled or reliable staff to be able to meet higher demand, or felt that they were unable to train existing staff to a sufficiently high standard to be able to delegate higher level tasks. A related point is that some owners argued that growth beyond their current size may jeopardise the quality of the service, or the ‘personal touch’, which are seen as part of the USP which sets them apart from ‘faceless’ larger firms. Equally, some owners desired to continue being ‘hands-on’, rather than simply undertaking managerial functions, which would be jeopardised if they grew larger.
We haven’t grown as fast as we could have because we wanted to do everything well (Engineering, East, 20-49)
(iv) several asserted that they were aware that the business required more formal systems (or further development of the systems in place), to make the most of the current situation, or to enable further growth if the opportunity arose, but also that they lacked the time to develop such systems.
These topics are dealt with more fully in the sections below.
More importantly, when there was a clear opportunity, incremental growth was seen as less risky to the continued survival of the business. An explicitly growth-focused strategy. was perceived to be likely to require heavy investment, which would either deplete the business’s reserves, and/or entail borrowing, which many businesses desired to avoid. It was also seen as highly risky, as the owner could not guarantee that the return on the investment would be sufficient to meet the perceived costs, again risking the continued survival of the business.
Some noted that this implied it was difficult for a young firm to grow rapidly, or even attempt to grow rapidly, due to the learning curve necessary. For example, a construction business ‘over-expanded’ from under ten employees to approximately 90 over the course of its second and third years in business, simply by taking advantage of the plentiful pre-crash opportunities. The workforce then more than halved, as systems and management staff were not put in place to cope with that expansion, nor was there any strategy underlying the growth. Now, the business is seeking to expand again post-recession, but more cautiously and in a more planned manner, noting that
There’s greater confidence in the economy now – we needed to become more active to ensure we didn’t lose ground once things started to get better. (Construction, London, 20-49)

Similarly, a catering business had made a number of early mis-steps, including branching out into opening a deli when they had no retail or trade experience, while also initially over-estimating the likely demand for their core catering business:
Case study: Trying again after failure
A catering business, established over 12 years, recording capacity and market scores, just qualifying as constrained, caters for events, including weddings and runs a tearoom at one venue, working in partnership with the venue provider. Turnover sits between £250k and £499k, with around £60k profit pa. There is ambition: We’d like to get over the £500k mark but quality is really important to us. Three partners started the business with very little capital; all were working at an FE College teaching catering. For 12 months they kept their day jobs and used the income from the first ten events to start the business. But lack of experience meant they made their move too soon. After a year we (all) packed our jobs in but that was a mistake, there wasn’t enough money to pay three people’s wages. We didn’t understand about overheads, seasonality, people not paying. Our Bank Manager was useful and the FSB36, but it was difficult at the time to change what we were doing. They over extended themselves, buying equipment, a unit to work from and a retail outlet We started a deli – that was a mistake – massive overheads, bought lots of equipment – we didn’t know enough about retail. People liked what we did but in January and February no-one came and we still had to pay someone to be there. The experience was a painful one but brought learning. The business subsequently prospered under a reconfigured operating plan and seeking external help was important in this respect: We shut the shop; it was the best thing we did really. Stuck with what we’re best at. We made mistakes, didn’t know enough. Now we have a proper catering contract and have taken on tearooms at the venue. They approached us, they’re a huge customer so good customer relationship management is important – and we’ve been doing that for 7 years. We’ve been learning how to offset and minimise risk – we knew about cooking not business. At one time we had a huge loan but despite the recession we’ve now structured ourselves properly and that’s paid off. We spend quite a bit of time in the office – that was a big move - so we could concentrate on selling. It was a big turning point – and employing two people from college in the kitchen. We give gifts and pay above the usual rate – it gets us better staff. Keeping staff happy is important in hospitality – especially at weddings. Profits and survival/stability were often expressed as the over-riding concerns of the owner, with growth only considered if it leads to higher longer term profits, and does not put at risk the continued existence of the business. ‘Over-expansion’ could lead to closure; the construction business cited above came very close to bankruptcy, but survived due to downsizing, cash injections from the founders and their families, and gaining extended (and generous) credit terms from suppliers. As specifically noted by three interviewees, a business that grows too rapidly also risks becoming a potential target for a hostile takeover at a low selling price, either as a going concern or for asset-stripping.
This attitude towards survival is sometimes regarded as being particularly strong in family-owned businesses; the interviews found it more widespread, with owners citing
36 Federation of Small Businesses
56

responsibility for the livelihoods of their staff (and, by extension, the families of staff) and being unwilling to risk this through growth. Several also noted that this concern for their employees sets them apart from larger businesses. They often wished to preserve this ‘family atmosphere’, feeling that it both helped morale and appealed to potential clients, and that it has intensified during the recession. Alternative jobs being harder to find had contributed – in part – to their decision to retrench and prioritise survival, retaining as many existing staff as possible, over a riskier growth trajectory. This has also enabled those businesses to be in a good position to take advantage of the economic upturn, to tender for the increased number of opportunities which are now available, as noted above.
However, this did not mean that growth during the recession was not possible, nor that other apparently insurmountable obstacles were absolute barriers. Strategies included: maintain quality and higher prices, rather than lower prices raising the value added of their products and shifting into a less volatile marketplace; shifting the emphasis towards areas where they sold direct to end clients, rather than acting as subcontractors, whose margins were being squeezed; up-selling in terms of volume or value to existing customers (e.g. a catering establishment noted that they tried to encourage customers to return, or an accountancy practice had a range of extra services).
4.3 Planning
MYTH 2: Strategic planning is only useful when the business has a definite objective in mind. Around half of the interviewees reported that they undertook minimal planning or strategy activity – they regarded their business as stable or, at least, sufficiently simple that the owner could ‘keep it all in my head’, as one put it (which also put a natural barrier on how large the business could be, if it led to a resistance to delegation). For many, planning was largely restricted to short-term operational issues, or to be used when raising finance. More in-depth strategic thinking was commonly seen as only necessary at certain times. This attitude was also fuelled by the risk aversion noted above. For many, if the business was performing satisfactorily, there was no need to change this – which is a reductive and restricted view of the business planning process. Incremental growth could be accommodated within this, but, for most, there was no active pursuit of opportunities that could potentially lead to growth.
It’s difficult to plan long term. Things are really good now, so we plan slightly ahead, but it could all turn round so quickly. We’re so wary - we plan for consolidation at best, not growth. (Care, North East, 20-49)
We don’t have a business plan. We have a budget and know where we want to be in 12 month’s time. We did need a plan to apply for funding - but it was all a bit vague. (Engineering, South East, 20-49)
There was also a small amount of cynicism about the value of more longer term strategic plans. A minority of owners perceived that they allow little room for deviation, and which therefore meant they may miss the chance to exploit unforeseen opportunities – which could be seen as simply an excuse not to plan:

You write a plan, then throw it away. See where the business goes, rewrite it, on annual basis – it’s very difficult to predict where you’re going, a lot is dictated by customers. So, if you see a market opportunity, you need to go for it, even if it may be one you never envisaged. (Manufacturer, Yorkshire & the Humber, 20-49)
Case Study: Visionary business needing to formalise management A grounds maintenance business had consistently displayed positive evidence of vision and also a relative absence of visionary constraint since starting the business in 1997. The business was subject to none of the vision constraints in the questionnaire.
The business had started by laterally developing an aspect of the farming business and applying it to a more specific setting. What started as a sideline of the farming business has grown into a separate concern with sales over £1million, employing sixteen staff, growing year-on-year.
While each client-project is properly costed the expansion of the business is perhaps best characterised by a go-for-it attitude to pursue opportunities while worrying about the detail of implementation later: ‘don’t get over excited about the numbers, just worry about doing the work if we’re successful.’ Another aspect of visionary behaviour is investing more personal finance into the business as it was about to become a limited company in January 2015. Most recently the business has looked for external advice, working with a procurement consultant and a second consultant to enhance financial understanding.
If anything the business is constrained by capacity and market instead. One of the apparent issues with capacity is the lack of contemporary management practices from an aged owner (63) ‘My agriculture HND had some management in it and I suppose that has helped, but that was forty years ago’. The business has a management tier and one supervisor had been a supermarket manager, offering some more modern experience, albeit as a branch manager only. Overall this problem was summed up by the comment: ‘There has to be ratio of organisers and workforce, but I don’t know what that is... very much growing as you go and sort it out as you go along’. The business also faced some market constraints given that they were almost at a point of saturation in their niche schools market in their region.
Many owners did also acknowledge that they would likely plan more if they were more actively intending to grow the business, or if they saw evidence of potentially lucrative opportunities. Several of those lacking a current plan were aware of a growing need to develop both a more strategic outlook and more formal systems, because of a general neglect of strategic thought, with a number noting that years of unplanned growth had left them realising that the development of the business needed to ‘catch up’ with the situation that they had found themselves in. Arguably, this would have been the case regardless of the downturn in the economy, but, for many, the potential recovery provided a catalyst to actually take stock. This ‘catalyst’ effect – the prompting towards more strategic development after some time knowing this should have been done, but no action having been taken, emerged as an important theme for many companies throughout the interview. They had ‘not had the time’ to do so, or ‘things tended to drift’ away from initial good intentions. This emphasises the value of planning, and updating and review that
58

plan on a regular basis – not just for growth purposes, but to maintain effective and efficient processes and practices.
We’ve never had a planned budget – but now we do! We have a forecast, which is good and accountant has helped us there. Perhaps now we need to look at the need for a business plan. We’ve still no targets for countries or client numbers and maybe we need to think about that... in the past, as well, the accounts had never matched up with what we expected. So we took on someone new who got stuck in – and it's got straighter and straighter. Next financial year end, we will be where we thought we were this year in knowing where we are. Still some murkiness, but greater formality really does help.
(Travel services, South East, c10 years old, 10-19)
Making a related point, several owners noted their belief a business plan was definitely useful, but only if there was a good reason for doing one and a clearly-defined objective to aim for. The importance of embracing new ideas was also widely acknowledged; many owners were aware that they could easily become (or had already become) set in their ways. Both of these points, though, often came across as excuses for inaction, rather than an encouragement to undertake more strategic thinking. For example, one interviewee noted that he would welcome an inclusive business planning process, involving the staff more in generating ways forward:
I’m happy to do a business plan, and have done many in the past to get money, but here, it’s all locked up in my head. Yes, I’m a benevolent dictator, I want to do it all your way - but I want someone to challenge me and take the company in new directions – make me learn from them, and think of opportunities I hadn’t previously considered. (Testing services, South East, 20-49)
However, the first step would be finding the time necessary to involve the staff, and to train them appropriately in the first place – so, the planning would be unlikely to happen. The business was successful and profitable, but, unless the owner was stimulated in some way to take action, it risked stagnation (and possible takeover). The identification of why business planning should take place, and activity to free up the resources for a plan to be devised was important – which implies many owners need to be more reflective about how the business could develop, and the benefits of using time and financial resources today to reap rewards in the future.
A further rationalisation to not plan was that, if the business was relatively straightforward, fomalised systems could be seen as potentially more useful than planning per se; they would aid in running the business in its current state, with minimal reflection and thought on how it may develop. Others, similarly, considered that the management team worked so closely together that it formed a substitute for a formal plan.
We used to use a spreadsheet, which was fine when we had five clients and three of four staff. But with 20 staff you can’t really do that. We’ve invested in database systems to help manage that, helps a lot with record keeping, it’s specially designed for the care industry. (Care, North East, 20-49)

Originally we did have a plan. We often talk about a new one. But we’re small and need to review it a bit more consistently. Probably actually a good idea to focus a bit more but we don’t have a plan at the moment, and don’t have the time. But we do discuss things in the team all the time. (Catering, South West, 10-19)
In total, 15 out of the 50 interviewees had a reasonably up-to-date formal business plan; and a further eight reported formal, longer-term planning processes that fell some way short of a comprehensive business plan. Most of this latter group acknowledged that they needed to devote more time to business planning in the future:
We’re in the middle of updating our written business plan. Over the past few years, it’s always been about surviving, about stuff that’s in your head, writing it down and talking to the partners about it – agreeing that this is the way forward. But we all sat down two months ago, and put a way forwards together, including thinking about a succession plan. It’s a big step for the management team to take over [from the founders] after seeing us go without money for so long, so now we have to make money quickly. It’s a scary process – but you have to do it. (Construction, London, 20-49)
Case Study: Importance of planning and processes to sustainable growth
Business A started with two owners, with substantial experience within the industry. One employee was recruited very quickly, in a boom period for their construction area, just before the recession. Within a few years of starting, the workforce grew to around 90: ‘we over-expanded, as work was there. Not really planned – just taking opportunities of growth’. Business planning was only undertaken when necessary to raise finance (mostly for cashflow purposes – there was little investment necessary). There was no real management structure, not any real strategic direction: the owner stated that the much larger business led to a ‘little bit more hassle, but it’s not a direct ration – a bit more time, more time to organise’, indicating the absence of longer term planning. The financial crash led to a rapid downsizing, and a very risk-averse attitude, which has only alleviated with the prospect of an economic recovery. It was only through cash injections from the owners and their families, and very generous credit terms from key suppliers, that the business survived at all.
The business is now aiming to grow once more (with a view to selling it, as the owners approach retirement). Based on their experiences, they are approaching growth very differently. Among the lessons learnt from painful experience have been: (i) they are evaluating projects more carefully, turning down those that seem to be too risky; (ii) recruitment processes are being formalised, relying less on friends and contacts; (iii) there is greater emphasis on the administrative side – instituting processes, upgrading technical skills; (iv) pensions are being introduced, to aid recruitment and retention; (v) there is renewed investment in training, equipment and possible acquisition; (vi) there is a formal business plan.
As the owner put it, ‘there are lessons to be learnt on how management structure works within the company. We need to ignore that it’s an electrical company, and look at it just as a company instead’.
60
There is still evidence that there needs to be some prompt to first consider planning – which then might lead to a more strategic, longer term outlook. Five interviewees reported that the plan was a quite recent development, precisely because they had seen opportunities to grow, or because they needed to change some aspect of the business. This is well-illustrated by the following business, which was prompted into planning by the need to do so, rather than it being an intrinsic part of business ownership, and being surprised by how effective the process could be.
It’s the first time in 30 years that we have had a plan, because of the large investment [in a building] and all the other things we want to accomplish. We wanted to set out what’s needed in terms of the business and because it might help us get some grants towards converting the building. But, it was surprisingly useful! We know we need to improve, the problem is always finding the time or the resources to plan. That’s one of the hurdles: spending time on the business, rather than working at the business (Manufacturer, West Midlands, 10-19)
The more growth-oriented businesses were generally the most open to continuous, longer term strategic planning. They largely confirmed the opinions of those business quoted above that planning was necessary before embarking on growth, but took a more holistic view of the planning process, indicating that it should be seen as normal part of business operation, and regularly reviewed. Their view was that, while it may take time and resources to plan, it should not necessarily be regarded as difficult. This is a more flexible and expansive form of planning, albeit also more complex and time-consuming, than those described above:
Yes – we have a three year plan. It’s actually a mechanical process and incredibly easy. It’s reviewed annually. But ‘no plan survives contact with the enemy intact’, so you have to review it constantly, be agile. But you always need a very clear plan about what you want to do as you get larger.
(Software, South East, 20-49)
4.4 Exporting
The proportion of exporters and potential exporters achieved in the interviews was similar to that achieved by the quantitative survey (approximately one-fifth). They divided into two distinct groups:
(i) businesses where exports only accounted for a small proportion of their turnover (under 10%). This group reported that, often, this was not something that had been actively pursued, but came about through a foreign buyer seeking them out or coming across their website. Often, prior to achieving their first order, they had not considered exporting, or considered it too difficult, but becoming an exporter in a small way had convinced them that such a strategy was possible. However, despite this willingness and desire to aim for higher exports, there was widespread lack of awareness about how to proceed further, and actually implement an exporting strategy. Awareness of UKTI was high amongst this group, although interviewees often asserted that they had not made as much use of the
service as they may have done, or that they wanted to be more fully prepared to take advantage of the services before they fully engaged.
We export about five per cent. We would like to grow it, but it’s not really been planned a great deal. Most clients overseas found us through recommendations or, especially, through our website, but some orders also came through us exhibiting at UK trade shows. (Engineering, West Midlands, 10-19)
(ii) businesses exporting a higher proportion of their turnover. In all cases, this had been a deliberately pursued strategy, or an integral part of the business model (e.g. a business providing services to foreign visitors, on behalf of overseas insurance companies). The latter cases were informed, for the most part, by lengthy experience of the founder in the sectors and international markets in question. Others, though, noted that exporting had been a learning experience, and it could still prove a difficult or lengthy process to break into new markets. As such, they also emphasised the need to think highly strategically (e.g. analysing potential new markets fully before entry) and identify their competitive advantage in the global marketplace.
In three to five years we’ve gone from 10 per cent to 50 per cent exports, we expect that to grow hugely. Switching to markets abroad is painful, slow and expensive. Setting up a new pipeline to gain entry with no guarantee of success takes at least 18 months. You’re burning money, trying to learn the culture, find out who can help, who’s taking money for no good reason. So you have to switch resources and energy away from the UK, with a long lead time before you get to see anything. It can take three years from introduction to concluding a sale. To choose territories to enter, you have to do a proper business case analysis, based around ROI, GDP, national wealth, IP, technical compatibility and so on. (Software, South East, 20-49)
We export 25 per cent, up from five per cent last year. We’re concentrating on emerging markets in South America. To break in to those markets, we relied on one of our existing clients who worked globally. We got on to their global supply list. Once we had that listing that was a guarantee that we’d met their high quality standards. (Manufacturer, South East, 20-49)
As such, there appears to be no clear myth about exporting; all businesses noted the difficulties involved in increasing exports, the importance of seeking suitable advice and support, and the need to approach such a decision strategically – which relates to the points made above about planning, rather than necessarily exporting per se. Some initially started exporting almost ‘accidentally’, but emphasised the same points in developing the proportion exported as those that approached this more strategically.
4.5 Innovation
MYTH 3: Investment in R&D is too risky, expensive and difficult for a small business Approximately one third of respondents in the quantitative survey reported that they had introduced new products, services or both. Qualitative interviews indicated that, for the
62

most part, these often involved innovations new to the business (or even new to the UK) and reliant on introduced technology, rather than entirely new or improved products or services. For example, a ground maintenance business was among the first in the UK to buy new lawnmowers from New Zealand and have made a range of other technological investments to gain an edge in their market. They offered either an improvement to an existing service or a service which competitors currently cannot offer. This competitive edge facilitates growth, albeit incremental growth at best, and needs constant attention to keep ahead of other businesses.
Several, indeed, noted that it was necessary to keep up with the latest technology and offer the most up-to-date services simply to retain their market position, as the diffusion of such technological advancements was so rapid. Similar findings apply to non-technological innovations: a nursery was among the leaders in adopting dietary and inclusion standards, and kept up to date with the most recent ideas about early years pedagogy, in order to maintain the highest quality standards in the area.
Several businesses perceived that theirs ‘was not in an innovative business’ – they simply did jobs to a high technical standard, and the market for new techniques, or new products, in their sector was thought to be extremely small. These companies were ‘niche players’ – extremely skilled at their line of business, and sourcing new ideas and products where necessary, but not innovating in a broader sense:
We have moved into a different line of production for our company and deskilling tasks – so it is innovative for us but probably isn’t innovative for the industry - we’re just getting to where we should be. (Manufacturer, West Midlands, 10-19)
For the individual business itself, such a strategy offers several clear benefits and opportunities: diversification in services, providing a broader and larger customer base; segmentation of customers (e.g. into those satisfied or willing to pay for only basic services, and those desiring more advanced services); and up-selling basic services into more advanced services. This provides a less risky alternative to investing in developing new products or services, either within the business itself or through buying in knowledge services; as such, it provided a solid platform for future growth based on quality and customer service, rather than innovation per se. Over the past few years, however, it has proven difficult to actually realise growth, because of relatively low demand, both in general and in particular for more expensive or extra services. Nonetheless, continued investment in advanced technology enabled several respondents to state that they were more confident and optimistic about forthcoming growth that they would have been if they had not invested.
Being the market leader in a particular niche brings clear benefits for potential growth – but it may also lead to a decision against pursuing growth due to the security it offers. An engineering business has a long-standing reputation as a market leader for a particular type of construction, allowing it to offer new applications of that technology over the past 50 years. This has not necessarily led to growth, but has provided a steady, consistent stream of income. As such, while the business is ‘not particularly innovative’, it could be argued that they have shown innovation in maintaining, diversifying and growing that income stream, albeit not using it to add extra employees.

Several businesses started that they 'innovated' for each client – i.e. their unique selling point was the development of bespoke solutions, which needed high level skills and knowledge but was clearly less risky than launching a new product:
Our strengths are providing a service to meet the needs of the customer – and that could be in any area of mix of areas. We don’t rely on any one technology (Manufacturer, West Midlands, 10-19)
A geological survey business made the decision to concentrate on highly advanced testing, but this consequentially led to (unplanned) growth: the owner ‘never wanted to be biggest, I wanted to be the best. But then you tend to become biggest –clients come to you, as they want the best. During the recession, we not only kept going [through diversifying into new markets], but grew... if we concentrated on the cheap and cheerful tests, we could have been in trouble same way as lots of other companies.’
Similarly, a large number of interviewees had upgraded their internal administrative or management systems, enabling greater efficiency in tracking processes or in working arrangements. However, for the most part, these have been used with a view to cut costs, rather than enable higher growth.
Only a handful of interviewees stated that they actually developed entirely new products or services, and all stated that they had built growth plans around that desire to innovate. They had not found it easy or straightforward, and emphasised, in particular, the difficulties of (a) finding suitably qualified staff; and (b) the time and resources necessary to undertake R&D. Both of these drawbacks were thought to be exacerbated in a small business, as opposed to larger businesses which could attract more talented researchers, (especially in terms of higher salaries and the likelihood of career progression), and could have a large, dedicated R&D department with its own labs etc.
It’s very expensive to innovate. Even in a company with 25 people... we have our own small lab – but they’re not (directly) earning, It’s hard unless you’re big to do that properly. (Manufacturer, North West, 20-49)
In addition, it was emphasised that small businesses had to be careful in looking at the costs and likely returns, and the degree of (financial) risk
You need to have the spare cash to [innovate] – some things you know will work, but you need the money to be able to push it.(Manufacturer, North West, 20-49)
However, it was also noted that there can be ways around these problems, and encourage innovation, if businesses seek out partners to share costs:
We’re using the local university - we give them free samples, they’ll do some testing, and we both get something out of it– that’s the best way for us, rather than a full-time employee (Manufacturer, North West, 20-49)
You need to network with similar industries - if they have the right machines for trials, for samples - to get the stuff to market. Look for synergy – we collaborated with the Danish company that produced machine [that we use] and
64

a British company in the same industry as us, and produced a product from that collaboration. Don’t take it all on yourself! It’s high risk, high cost. (Manufacturer, Yorkshire & the Humber, 20-49)
Several businesses had approached Innovate UK to seek out partners; to date, this had been unsuccessful, but they had not been deterred, and regarded this as a potentially useful route.
Similarly, businesses which entrepreneurially identify an untapped niche in the market can create new sources of earnings through innovating in that area. However, this requires acting more strategically, and seeking out such a niche in the first place – which, again, faces the difficulties with the planning process outlined above:
We have diversified into new markets in the past, out of desperation as we’d lost a fair bit of business. We did brainstorming to get ideas and see how things are actually used in practice – and we thought of getting into a new market, for a new type of product that the industry is moving towards. We’re trying to do that now, only scratched the surface, but it’s potentially huge, and we’re trying to break into the European market with it.
(Manufacturer, Yorkshire & the Humber, 20-49)
4.6 Working capital and Investment Finance
Interviewees were asked about obstacles or enablers to growth deriving from the availability of working capital and investment finance. The clearest conclusion to emerge was that the majority of businesses preferred not to borrow if possible, seeking to finance investment from internal reserves. Indeed, in many cases, this had been an enduring principle since the business was established, with banks only being approached when necessary. This fits with the fairly risk-averse strategy indicated above, as the stability of the business, and the preservation of quality, is more important than investing for growth, which is unlikely to happen without a large reserve of cash:
We only buy replacements of odd computers here and there. We shop around for best prices – so we’re very cost conscious. We would only invest if it makes sense for the business. (Leisure, North East, 10-19)
Now and again, we dip into red, but out of it quickly. We would rather not have loans. To grow, we would have to use overdraft, which we would rather not do. (Manufacturer, West Midlands, 10-19)
Myth 4: There’s no way we can improve our cashflow situation Myth 5: Factoring is only useful if you’re in trouble Few had used any form of finance other than banks. Four had used invoice financing, and praised it highly. However, these businesses were generally growing, and profitable, and had little problematic debt; this allowed the fees for invoice financing to be relatively low. As such, these businesses regard invoice financing as, effectively, a cheap way in which to get a short-term loan when necessary, rather than an ongoing policy of dealing with debt – a ‘proactive’ way of using invoice financing, which was regarded as one of the few

effective tools to release working capital. These businesses all had ambitions to grow; they regarded invoice financing as one of the tools they could use to realise that ambition, along with investment in the business. As noted above, this attitude was relatively rare
[The factoring company] have been fantastic, a total lifesaver. Small organisation making a big difference. They allow us to factor (when we wish) our invoices. If we issue an invoice and we can show that the customer will be able to pay it we get an advance of 85% of invoice immediately, and a charge of 0.5% per month for 3 months. With payment terms of 60 days it brings your cashflow forward by around two months - effectively like a three month loan. We can use it as and when we wish. The only working capital arrangement we’ve found that actually works. (Software, South East, 20-49)
However, while many interviewees reported there is no longer a stigma associated with using invoice financing, most would not regard it in the same way. For most, it is mostly to used in a reactive manner, when there is a deeper problem with cashflow caused by difficulties collecting on debts. This entails higher fees than the above businesses quoted, so most businesses would prefer to use their own staff to chase up debts. This can be time-consuming and frustrating, and may well leave businesses in a position where investing for growth is restricted:
Factoring is great way to get cashflow going but can be very expensive, we thought we could do it better ourselves. (Construction, London, 20-49)
The trick to invoice discounting is to get out as soon as possible, and not be locked in - not many can get out once they're locked in. We used invoice finance to a small degree, but it's generally a nightmare, and has ridiculous rates - 6% for asset finance vs. 0.5% base. (Manufacturer, Yorkshire & the Humber, 20-49)
Myth 6: If my bank turns me down, there’s no alternative Given the widespread antipathy towards invoice financing, and general ignorance of alternative means of funding, access to finance for most depends on banks, which in turn is crucially dependent on the business track record and current position. As such, hostility towards banks was not universal, but was largely restricted to those in a poor business situation, which had unsuccessfully sought finance. Others were either more positive towards their supportive bank, or were resigned to not even approaching banks, as they were aware that they would likely be turned down. For example,
The guy at the bank has worked alongside us, kept an eye on us - it's not his fault he had to reduce things, so when he saw things improving, as soon as he had an opportunity to help us, he gave us a heads up. We had tried Funding Circle, tried factoring – but we had such a bad run that no one wants to touch our books. All great – but only on safe bets. (Construction, London, 20-49)
We haven’t invested yet, but we probably will in the long-term. But what we’re doing is getting the scaling up correct first. We’ve got to know that wherever we take the business, that it makes sense. (Event management, South East, 10-19)
66

A small number have persisted in seeking out financing, reasoning that, as long as the business plan is sound, there will be a provider which will be able to match their need:
We actually haven’t found it hard to find capital financing - our own bank may have rejected our application but another finance provider accepted our request, enabling us to match the RGF funding. The reason is that after a few years of not making any profit, banks are wary of lending to us, even though we have turned a corner and need their support. We think our bank were a bit over cautious, so it's up to us, really - we have to try to give them confidence. (Manufacturer, South East, 20-49)
Some businesses which have been refused by banks, have sought help from their suppliers. They had been a good customer in the past, so hoped that their suppliers would extend them credit until their business recovered:
Our wholesale suppliers, at times, have supported us through generous extended credit terms. We’ve had basically an interest free 500k loan for three years, and we still have effectively a 200k loan, that we owe. There's no interest on it, but we're trying to find a way to pay it all back as soon as we can, they've been good to us. (Construction, London, 20-49)
Others have brought down debt by using more nuanced methods than just repeatedly demanding payment from customers, or have adopted strategies to insure against a cashflow crisis in the first place:
Standard payment terms are 30 days, so the reality is 45 days - but we do give an additional discount for prompt payment. We’ve made inroads into debt collection. One small trick we’ve done – we had statements for late payment, they didn’t work; changed them to red, and all of a sudden.... take cards across the counter and telephone payments. Terms have always been 30 days – at the peak we went to 120, now down to 45-60, tops. Still only one member of staff on it. (Accountancy, North East, 20-49)
This last quote can be contrasted with another accountancy business, which had been less proactive in approaching the issues, and were less interested in increasing the value of their services or up-selling to existing clients or offering the wider range of services which the above accountants offered. In other words, the accountant above could be seen to have a more growth-oriented attitude, adopting a variety of proactive techniques to improve cashflow, in comparison to this more reactive stance:
We’re not very good at debt collection - not very good at pushing the issue. Quite often we’re talking to people who’ve been clients for a long time, they say they’re struggling to pay the VAT bill and it seems wrong to say pay mine first. We’re obliged to give them more time. (Accountancy, North East, 20-49)
This latter business also noted that ‘maybe that’s why we retain clients’ – indicating, along with their other answers, that the retention of current clients was more important than the attraction of new ones.

4.7 Management
4.7.1 High performance work practices MYTH 7: Our employees don’t want formal, pay-related incentives, and they’re no use in helping us grow. Having a performance-related pay (PRP) scheme (or related incentives) may aid a growth strategy as part of initiatives to introduce high performance working practices, to encourage greater involvement and effectiveness among employees. Performance related pay may attract more and/or ‘better’ employees (more skilled, hard working etc) to the business and this support growth both directly and indirectly. However, while it was often acknowledged as a possibility, most had never put a PRP scheme into practice, reasoning that basic wages were a more important draw, especially during the recession.
More common were ad hoc rewards: a reliance on ‘flexibility’ (in shifts and time off, principally) and/or ‘treats’, such as meals paid for by the business.
Our pay award has been better than cost of living, and there are perks: some senior staff take their vehicles home, all staff get a free mobile, we provide new work gear new every year. A guy broke his collar bone and was off work for four weeks and we just kept them on the payroll, rather than putting him on the sick But we should have more written policies ,the terms and conditions aren’t written down. (Business services, North East, 10-19)
One of [the staff] asks if they can have next Wednesday off, I always say, I’ll do my best. I’ll look at the diary and if the numbers are covered, nine times out of ten they can. I try and give little perks – if they’ve been really good, I pay for their tea once or twice a year, I pay for their Christmas night out... I try to be benevolent and I think that works. (Nursery, North East, 20-49)
Other forms of higher-cost rewards (e.g. gym membership) or attraction/retention of workers through higher pension contributions were less common, due to the perception that employees preferred to receive higher wages. Many combined this with the above strategy – treating employees well, in addition to paying them above the market rate. Several businesses had also retained a nominal bonus or profit-related pay scheme, but this had effectively been suspended during the recession.
We offer flexibility – if they need time off, they’ll get it. Seven years ago, we reduced the pay by ten per cent, and just literally last month put it back up by ten per cent: we reward by time, not money, as the money’s just not there. That policy helped retain staff, and people do want to work for us because of it - it’s not all about the money, it’s about looking after each other. (Construction, London, 20-49)
People who have passion, and already have jobs - how do you get them to join you? The benefits you can offer, how well spoken of by your employees you are, the overall package. (Manufacturing, Yorkshire & the Humber, 20-49)
68

A minority used forms of performance-related schemes to attract and retain workers, mostly in combination with other non-financial rewards and/or pensions, depending on the business objectives, and the level of seniority of the staff. These mostly took the form of individual bonuses for meeting targets, with bonuses based on whole business performance, or other similar metrics, rarer. One of the most common forms of bonuses was to reward staff when they had recommended potential new recruits who were eventually hired. This had proven reasonably, albeit patchily, successful at finding lower grade recruits, but not at higher grades, such that several businesses were moving towards more formal means of recruitment throughout the business.
We try to encourage and offer rewards for good ideas, and to encourage a sense of ownership. We have quarterly bonuses based on performance targets, everyone has a pension, not really many ‘treats’ per se but hoping to introduce them. (Manufacturer, West Midlands, 10-19)
Several have more specific strategic aims to their reward structure. showing how well-planned incentives can be used as part of a growth strategy, as opposed to simply motivating employees to work harder:
We think we can free up the partner’s time to chase new business, if the existing staff are properly encouraged to visit existing clients. build up the relationship and get more business and referrals, rather than just the partners doing that task. Seeking to incentivise staff – all ad hoc in past now making it systematic and transparent – and it’s now prospective rather than rewarding retrospectively for work well done. (Accountancy, North East, 20-49)
4.7.2 Consultation MYTH 8: We don’t need to engage the staff in a structured, involving way Consultation is another high performance working practice, informing employees about the business and encouraging their suggestions. Consultation was generally a mix of formal (regular team meetings) and, mostly, informal methods (several referred to an ‘open door’ policy). In most cases, communication tended to be top-down, with an opportunity for employees to contribute ideas, rather than a structured way in which the staff were more fully involved in, for example, the strategic direction of the business or planning operational issues. More in-depth consultation, with greater input from the staff would only tend to occur at times of greater change - partly because there was a widespread feeling that the staff would not want that sort of responsibility. Equally, though, many businesses noted that they would like a greater degree of formality, and greater and more regular structured dialogue between management and staff. This theme emerged in many areas during discussions, and owners stated that they knew that needed to happen, few gave any indication that it would actually be put into practice, with many reiterating the difficulty in finding time to do so. It was also common that ‘consultation’ was initially interpreted as ‘appraisal’ – a more top-down process, rather than an inclusive process that should encourage greater engagement. Similar caveats apply to meetings which were clearly more about top-down information provision, rather than consultative. Both are certainly
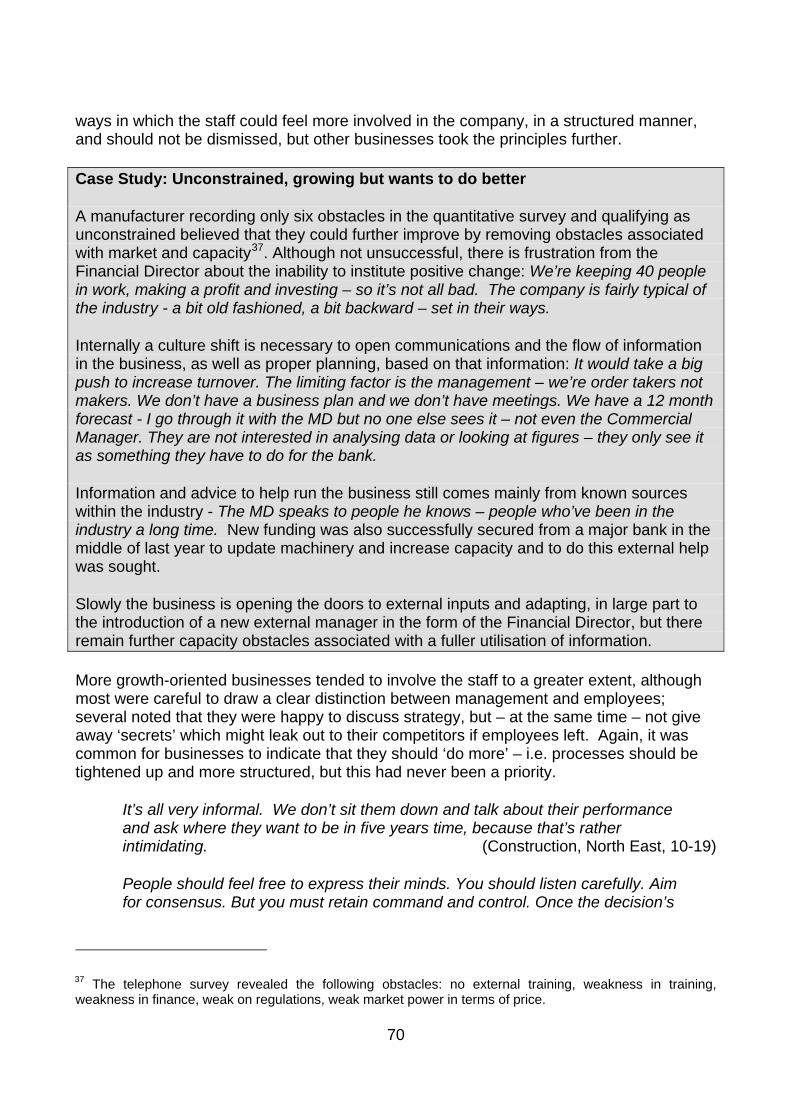
ways in which the staff could feel more involved in the company, in a structured manner, and should not be dismissed, but other businesses took the principles further.
Case Study: Unconstrained, growing but wants to do better
A manufacturer recording only six obstacles in the quantitative survey and qualifying as unconstrained believed that they could further improve by removing obstacles associated with market and capacity37. Although not unsuccessful, there is frustration from the Financial Director about the inability to institute positive change: We’re keeping 40 people in work, making a profit and investing – so it’s not all bad. The company is fairly typical of the industry - a bit old fashioned, a bit backward – set in their ways.
Internally a culture shift is necessary to open communications and the flow of information in the business, as well as proper planning, based on that information: It would take a big push to increase turnover. The limiting factor is the management – we’re order takers not makers. We don’t have a business plan and we don’t have meetings. We have a 12 month forecast - I go through it with the MD but no one else sees it – not even the Commercial Manager. They are not interested in analysing data or looking at figures – they only see it as something they have to do for the bank.
Information and advice to help run the business still comes mainly from known sources within the industry - The MD speaks to people he knows – people who’ve been in the industry a long time. New funding was also successfully secured from a major bank in the middle of last year to update machinery and increase capacity and to do this external help was sought.
Slowly the business is opening the doors to external inputs and adapting, in large part to the introduction of a new external manager in the form of the Financial Director, but there remain further capacity obstacles associated with a fuller utilisation of information.
More growth-oriented businesses tended to involve the staff to a greater extent, although most were careful to draw a clear distinction between management and employees; several noted that they were happy to discuss strategy, but – at the same time – not give away ‘secrets’ which might leak out to their competitors if employees left. Again, it was common for businesses to indicate that they should ‘do more’ – i.e. processes should be tightened up and more structured, but this had never been a priority.
It’s all very informal. We don’t sit them down and talk about their performance and ask where they want to be in five years time, because that’s rather intimidating. (Construction, North East, 10-19)
People should feel free to express their minds. You should listen carefully. Aim for consensus. But you must retain command and control. Once the decision’s
37 The telephone survey revealed the following obstacles: no external training, weakness in training, weakness in finance, weak on regulations, weak market power in terms of price.
70

been made you need everyone to fall in line behind it, you can’t continuously reassess. (Software, South East, 20-49)
4.7.3 Recruitment and people management MYTH 9: I can’t get recruits to fit my needs Most businesses, especially those less oriented towards growth, continued recruiting the majority of new employees informally – either people they had worked with, or ‘friends of friends’, where possible. People management tended to be organised, as indicated above, in a similarly informal way. However it was also reported that this informality in recruitment and management had led to problems as the business grew larger. This again reiterates the point that many businesses know they need to restructure processes, but regard this as a lower priority until the point where it becomes a necessity. For example:
In the past it’s relied more on friendships and people’s good nature, but we’ve probably got to be more professional in the way we approach it. We need to tighten up on how we manage staff, appraisals, as well. (Business services, East Midlands, 10-19)
Recruiting is high on our agenda now. In the past it’s been via people we know through industry, word-of-mouth, friends or friends of friends – and that’s not been the best. We’ve used an agency a little bit in the past but one we’ve known for god knows how long, so that’s pretty limited. We’ve never used Jobcentre Plus. So now we’ve started to properly recruit again for the first time in years, I’m not too sure what to do! I We need to work it out... we have systems we’ve utilised, that we manoeuvre around, things I’m trying to reinforce – so that when people join , there’s a system in place for them to work with. So we need more formal systems, a bigger management. (Construction, London, 20-49)
There remains a widespread perception that the quality of new recruits is insufficient to allow growth. As the arguments above imply, though, that may be down to inadequate recruitment methods and processes, and/or inadequate incentives aimed at recruiting higher level workers (or even lower level workers, compared to opportunities elsewhere) – or even unrealistic expectation of recruits (which, again, may be a rationalisation for a lack of growth):
Good graduates go to the big companies, down in London. Oxbridge guys are lined up for higher level jobs. It’s a struggle to find good graduates locally, they aim for larger firms (Manufacturer, Yorkshire & the Humber, 20-49)
Always looking for good people but young people don’t want to work in construction. (Plant hire, South East, 20-49)
By contrast, businesses which had good recruitment processes, a clear idea about their needs, and training programmes tended not to mention difficulties in recruitment as being a major obstacle. A lack of management skills, in particular, recurred as a common complaint –but mostly in businesses which did not undertake management training. Several businesses noted that they were unwilling to take on more permanent staff due to

the seasonality of business or similar constraints. However, others found a way around this by being flexible, which has benefits for both business and employee.
One of our full timers goes away for four months every year to work in another business – that works well. It means our costs are reduced for a while but we hang on to her skills and the knowledge of the business. (Catering, South West, 10-19)
4.7.4 Delegation and management structure Myth 10: My business doesn’t need to restructure its management as it grows Very few interviewees had an externally recruited manager. Virtually all had promoted internally, rather than seeking a management level recruit, and stated that this is how they preferred to operate. Indeed, the wider issue of willingness and ability of owners to delegate were a key concern, and is essential to growing the business. For many, this had initially proven difficult; some had never quite managed to do so, but mostly recognised that this was holding the business back, and delegation had to happen for the business to grow further, or even for its full potential at its current size to be realised. More growth-oriented businesses had a more defined management structure, into which either an external manager or one promoted internally, can have a defined place, and know exactly what tasks are needed for their role. That facilitates the delegation of task from the owner, acknowledging that this can be a difficult process. Most owners who could not delegate were well aware of the need to do so, but had not found a way to readily do so, compounded, in many cases, by a lack of management training among employees. This echoes findings throughout this section that formalisation of management processes is crucial to removing potential obstacles:
It was hard to give up control of some things – but [the senior manager] had worked hard, got her degree, I knew from her track record in the business that she would do the job, that’s why I promoted her. If we grow any more, though, we would need more managers, and it’s hard to find the right person – the staff aren’t at the right level, so I would have to bring someone I don’t know from outside... which is a much bigger risk, and I don’t know if I’d want to do that. (Education, South East, 10-19)
It’s not impossible that we bring in a professional manager – but I’m such a control freak. Which I know is my problem, no-one else’s! I can see why it would be a good thing, but I can also see getting one of those business people in who tell you how to run company – and they’d just give me the biggest bollocking. I don’t let go of things. Don’t think anyone does it as well as I do, which is a load of crap – but it’s just how you feel. (Construction, London, 20-49)
Case study: Not having a professional manager
The sole founder and owner had 20 years of experience in a particular field in scientific testing, and set up in 1995 with 3 people. It now has 33 staff, and ‘could grow a lot more’. Growth has followed a strategy with two clear principles: (i) an emphasis on quality and value added over the ‘cheap and cheerful’ end – i.e. to ‘aim to be the best, not the biggest’; and (ii) to concentrate on areas where demand is likely to be consistently high: ‘man will
72

always need food, energy and mineral resources’. This entailed recruiting employees with a high level of technical skill, and following market demand for high value services. This latter strategy accounts for the concentration on work abroad in the last ten years, making exports highly important in the business’s strategy.
Therefore, it is clear that the business does not suffer from either major market constraints or (in some ways) vision constraints - it has grown strongly and consistently in the past and continues to do so. As the owner says, 'if you asked 10 yrs ago, would we ever have 33 people, I would have said no, that’s unmanageable... but now we have 33, I feel it could go up to 50... we could increase capacity by not just 50%, maybe 100%.'
However, the business does have a clear and acknowledged capacity constraint to accomplishing that: 'the problem is me. I'm 66. I would need additional management help.' The owner does not, and feels he cannot, delegate to the extent that is needed. He is a 'benevolent dictator'. No employees, he feels, are skilled at people management, have the drive to assist or take over his role, or the vision to take the business forward and develop new ideas. The employees have shown no interest in developing their skills in these areas, and the owner has not pushed the issue: 'We could reap significant rewards to the company and individual, if they were exposed to managerial training. I would love to delegate - but the problem is finding the right person to delegate to.'
This is compounded by difficulties hiring an external manager: 'There's no business mgr here– as you need business expertise and technical expertise - it's hard to recruit a professional manager from another field. But it's actually my ineptitude in trying to make the big decision and get someone in who can manage a business' - or to convince employees to train in those skills.
The business thus has scope to grow further, but is unlikely to achieve this - and, in addition, potentially faces a crisis when the owner retires, and possibly takeover or closure.
As such, those with a growth orientation have clearly thought to a greater extent about management structure, with a view towards installing a structure that serves their growth plans, and how roles function together: Not all changes may be effective, necessarily, but the process of planning itself, and trying to address difficulties has been a learning experience:
At the top end, we had to restructure – it’s taken a year. We’ve taken out the financial fiduciary control – providing fully independent FD and financial review – otherwise there’s a risk they can go native. Financial and operational control should be completely independent. We use a contract FD now to provide checks and balances, their key role is strategic, to drive the business forward and ensure independence of financial control. We also have two other non-execs on the Board. (Software, South East, 20-49)
4.8 Regulation
While there was a general feeling that regulation has increased, and is definitely a burden on businesses, it was less negatively regarded than amongst micro businesses in the

previous study. The attitude was closer to ‘it has to be done’ (as one business put it) than ‘regulation deters me from growing’. Owners were thus often resigned to meeting the demands that regulation placed on them:
26 years ago, I could do the paperwork, it was minimal. Now, every single thing has to be written down, every single thing has to be double checked, it’s non-stop – for the staff as well as me. I’m not wary of regulations, though and they don’t stop me growing the business – it’s more work even if we stay the same size! (Education, South East, 10-19)
I spend a fair amount of time on regulation, but not massive. Quite a lot of time on H&S but doesn’t affect our appetite for growth. (Manufacturer, West Midlands, 10-19)
A willingness to outsource some needs (particularly HR) was more in evidence than among microbusinesses:
We weren’t trained to be human resources managers, so we’ve had a few problems in that area and now we contract that out, outsourced staff handbook and staff policies. (Accountancy, North East, 20-49)
Very little time on regulation. HR is the main one we contract out. It's a great weight of your mind - but it's a big mental hurdle, outsourcing. (Travel services, South East, 10-19)
A small minority of owners did complain about a larger burden stemming from regulation. Most of this group simply complained about the resource burden of keeping up to date and compliance; few indicated that these factors deterred them from growing further. Employment law, and health and safety to a lesser extent, were cited as the main burdensome areas.
For the small business employment law is our worst enemy. I can see why it’s there, but its hard at times. I’ve never fell foul of it, but it's the threat. In the back of my mind you’re thinking am I going get taken to court. (Nursery, North East, 20-49)
Only one business owner explicitly indicated that regulations would deter him from growing, and this was in very specific circumstances (immigration regulations making it difficult to hire Indian chefs).
4.9 Advice and support
Myth 11: It is not worth devoting the time to networking When asked about advice, support and networking, the dominant theme among interviewees was lack of time. Most recognised the value of such activity, and most had also either used or at least investigated it in the past. Most would also like to network more, or seek advice and support to a greater extent, but the time spent actually managing the businesses means this is difficult. In many, advice-seeking behaviour has simply
74

never been seen as a priority, even where avenues to ask questions are readily available, and gaps in capability and capacity have been identified. Unless there is a pressing need to gain advice to overcome a bottleneck, or where the returns to improvement are high and apparent, seeking such support is likely to be postponed until necessary.
Not been to business clubs, Chamber... it’s a poor excuse but I just don’t have time. Very open to all sorts of things - I've been approached by the Watford one, and our accountant has a monthly business forum – I really should go but it’s finding the time. (Testing services, East, 20-49)
There could be slicker management in the office. We’re good at keeping up with practice in our field, but less good at getting support on best practice for managing the business. We need to get more organised in terms of our paperwork and systems. (Construction, North East, 10-19)
This attitude partly derived from the low perceived level of direct benefits in return for the time commitment. While networks could prove useful in making connections or in providing legal or similar advice, many owners also regarded them as too often being just ‘a talking shop’ or unlikely to generate new business for their own particular line of trade. Attendance at such organisations was thus seen as of second order importance:
In retail, we have dos and functions, you need to be seen - but it’s hard to get much out of it [financially] (Retailer, Yorkshire & the Humber, 10-19)
Myth 12: There’s no business support out there for me Few interviewees had used government-funded advice or support in the recent past – partly through distrust and poor past experiences, but more widely through ignorance of the content of the support itself, their eligibility, and ways in which to find suitable support (which applied to private sector as well as public sector support). However, it was also clear that these perceptions, and lack of knowledge, were less widespread than among microbusinesses.
Not really used any government support schemes. Wouldn’t know where to find them if I need them. (Manufacturer, East, 20-49)
There was some perception that it was difficult to get any support for free, that it was difficult to judge the benefits of paid-for support, and that a large number of private companies were acting as unscrupulous ‘middlemen’ in trying to get businesses to pay extra through them to access lower cost schemes.
However, a substantial minority of businesses – especially those with a more growth-oriented strategy – were more proactive in how they approached the issues of support, and/or were more willing to pay for support; to use a wider range of support; and to be clearer about the purposes for which they needed support:
We cancelled our membership of EEF, as it's too general and not what we were looking for. But we do look out for training courses and seminars that are more specific - advice on the Autumn Statement, HR... (Engineering, South East, 20-49)

We use our local audit firm to bounce ideas off and they can make recommendations. And we’re members of the Chamber, we don’t go to meetings but we ring them up for advice. (Manufacturer, West Midlands, 10-19)
Several had also attempted to make use of non-executive directors as a lower cost way to gain advice of a fresh perspective on the business; they advocated caution in ensuring that both parties are clear on how the director will be used. The following two quotes provide a good contrast:
In the past we had a non exec director but it didn’t work out. Lots of ideas were coming through and money was wasted starting things off that never got followed through. (Engineering, South East, 20-49)
We are trying to use non-execs more. We have a financial advisor we pay, but it would be good to have someone we can call on regularly without paying so much. (Software, South East, 20-49)
In addition, growth-oriented interviewees were more open to using a consultant; they recognised that this may be expensive, but would be likely provide good advice on specific issues, or on managing the business in general, and help profitability. They were also fairly open to engaging a mentor, as long as this was for a specific purpose and fitted with the development needs of the business, especially if it was someone they knew personally, and had track record of success. This fitted with a more reflective and strategic approach to the business:
Recently I used procurement training. helped by a grant from [a local enterprise agency] and will soon receive mentoring advice from [a large national coaching company] - especially financial advice. We’re turning over £1m – so we need more help and understanding above just audit and accounts. We see these as worthwhile investments. (Construction, North East, 10-19)
76

5 Conclusions This report complements the earlier BIS study Understanding growth in microbusinesses and there are commonalities in the findings of these reports, with the general caveat that these small businesses are more complex entities than microbusinesses. Both reports provide evidence that the more (self-reported) obstacles a business faces (or believes it will encounter), the less likely it is to demonstrate sales or employment growth. These reports are premised on the idea that business growth will not occur for every business, but that removing these obstacles is conducive to growth, creating a more optimal environment and increasing the likelihood of sustainable growth.
Some obstacles are simply the non-adoption of good business practices. Adoption of business improvement processes (financial investment, exporting, innovation, collaboration, introducing a management team) were shown to have a positive effect on business growth for small businesses. More subtly, these obstacles also incorporate attitudes to growth, positing that owners are subject to mindsets that permeate their thinking about how to do business and how to run their own business and that these mindsets place fundamental limits on introducing organisational change. This second category of attitudinal obstacles generally discusses difficulty, with owners representing themselves and their businesses as ‘can do’ or ‘can’t do’. This set of obstacles may be a self-fulfilling prophecy, justifications or excuses which are believed to be true, rather than the product of experience, or of rational, informed analysis of the business and its market position.
Bounded rationality means that owners are unable to process information associated with their business in the most efficient way possible. Altering this ‘matrix of perceptions, appreciations and actions’ could enable businesses to achieve outcomes such as being better managed, more efficient, and more profitable, thereby improving the likelihood of business growth. However, this would entail shifting the ‘habitus’ – the unconscious influences – of owners, opening up possibilities to improve and support their abilities to work ‘on’ the business.
Research Findings
Patterns of growth • In the years 2012-14 our sample of 600 small businesses showed some small net
growth on average; 31 per cent of businesses had both sales and employment growth over this period and 46 per cent had increased employment (just over one job per business). One in six businesses (17 per cent) had experienced contraction over this period.
• Over the longer time horizon of 2009-14, small businesses were a little more dynamic, creating a net gain of 1½ additional jobs per business. Fifteen per cent of the stock of 2014 small business began 2009 as microbusinesses. 56 per cent of small businesses had increased employment over this period.

Growth Ambition • Three quarters (75 per cent) of businesses report an ambition to grow their
businesses over the next three years.
• Only 15 per cent of businesses indicated they had a substantive growth ambition.38 This group were clearly more likely to have achieved growth in practice, with 21 per cent of growing businesses showing growth ambition, double the rate of non-growing businesses (10 per cent).
• Growth ambition was higher among younger business owners.
Obstacles to growth • Businesses with 10 to 19 employees reported more conventional obstacles39 to
business growth than those with 20 to 49 employees. The average number of obstacles mentioned was 5.3 for 5-9 businesses, 4.4 for 10-19 businesses and 3.8 for 20-49 businesses.
• This study goes beyond this standard set of obstacles to ask specific questions, identifying a wider set of 31 obstacles.40 This includes sets of questions about the uptake of business improvement processes, business capabilities, perceived demand and lack of ambition.
• Growth performance of businesses was strongest where they had made some form of business improvement compared with those not making improvements (financial investment, exporting, innovation, collaboration, introducing a management team).
• Introducing new processes was rated as being easier by those that had implemented them, compared to those that had not done so.
• Where businesses disclosed an obstacle relating to business capability, there was a strong inverse relationship between their competence in the matter and there being an obstacle.
• Owners tended to overstate the difficulty of implementation. Compared to businesses that had achieved growth, non-growing micro and small businesses tend to overstate both the challenges involved and the capacities needed to deal with these.
38 Substantive growth ambition was defined by businesses seeking to grow their sales by more than 20 per cent over the next three years, growing income significantly after the next three years and a strong personal desire of the owner to grow. 39 The survey and our analysis replicates standard categories from the BIS SBS survey. Full findings from the Small Business Survey 2012 are available here 40 Unlike SBS categories of obstacles these are not explicitly identified by the business as being obstacles. Instead the researchers infer that particular responses put the business in adverse circumstances (e.g. Have not taken any steps to increase sales in the last five years, low capability of developing a business plan etc) and classify these responses as obstacles.
78

• A further instance of exaggerating difficulty was evident in perceptions about the point at which it was necessary to appoint an external manager differed substantially, between those that had (14 employees) and those that had not (26 employees).
Capacity, Market and Vision constraints to growth • The individual 31 obstacles considered in this research were categorised as
belonging to one of three sets of related perceived and actual constraints. These related to capacity of the business to grow, the external environment including the market and the vision of the owner and their attitudes towards growth. Combining the obstacles in this way provides a better predictor of achieved growth and growth ambition than narrower measures.
• Fewer small businesses were constrained in terms of their capacity (38 per cent), but relatively more constrained in terms of their vision (53 per cent) and market (51 per cent).
• The three categories and their interactions are described in the Venn diagrams below showing results separately for businesses with 10-19 and 20-49 employees. The figures show that larger businesses tended to be less capacity constrained and less market constrained, as well as more likely to be unconstrained in any dimension. These patterns are potentially very informative. They define which businesses are multiply constrained and therefore very unlikely to achieve growth, and which only face one type of constraint and thus are more likely to be capable of readily achieving growth.
• These analyses highlight limits to the effectiveness of initiatives that focus on specific factors. For example, initiatives that seek to improve business capacities alone are only likely to impact on the six per cent of small businesses that are only constrained in this area. For the remaining 94 per cent of businesses, these measures might be necessary but they are not sufficient in themselves to improve performance and create growth. Indeed, given the very small proportions of small businesses constrained in just one category, these findings suggest that effective interventions need to be either specifically targeted or holistic and multi-dimensional. This is particularly the case for the 10-19 businesses.

Venn diagram of constraints – all small businesses
Venn diagram of constraints – businesses with 10-19 employees
Market constrained
Capacity constrained
Vision constrained
Unconstrained = 18%
15%
14%
9%
6%13%
8%
16%
Market constrained
Capacity constrained
Vision constrained
Unconstrained = 16%
17%
16%
9%
7%13%
15% 8%
80

Venn diagram of constraints – businesses with 20-49 employees
Mindsets The data provided by businesses that had and had not grown, suggests that the ambitions and perceptions of the obstacles and challenges involved are often shaped by the mindsets or ‘innate dispositions’ of businesses owners. Simply put, owners disposed to growth have greater ambition and tend to report fewer obstacles than those that are more negatively disposed to growth. These mindsets are embodied in the quantitative evidence associated with overestimating the difficulty of implementing business improvements or overestimating the size at which a business should introduce professional management. The qualitative evidence was able to go further and directly challenge owners’ views, finding clusters of evidence that grouped together a lack of faith that business improvements yielded demonstrable benefits, with difficulties in implementation. In discussion with business owners it was common to find that they saw no way forward, or no viable alternative on particular issues and this ‘can’t do’ mindset insidiously caused immobility in taking decisive action.
One of the most important aspects of this study of small businesses that distinguishes it from research on micro businesses is the additional complication of a layer of management in the business. Releasing the full potential of management (and for that matter the whole workforce) to make a valued contribution to the business is a key area where many owners fail to make best use of existing resources.
Myths A set of twelve myths were distilled from the evidence gathered. The potential growth of a wide cross-section of micro businesses was being held back by these myths. The myths
Market constrained
Capacity constrained
Vision constrained
Unconstrained = 21%
13%
8%
5%
9%
19%
11%
15%

are unpinned by a reluctance to plan, strategise or develop the business and a focus on working in rather than on the business. The twelve commonly observed myths were:
Myth 1: You can’t grow during a recession.
Myth 2: Strategic planning is only useful when the business has a definite objective in mind.
Myth 3: Investment in R&D is too risky, expensive and difficult for a small business
Myth 4: There’s no way we can improve our cashflow situation
Myth 5: Factoring is only useful if you’re in trouble
Myth 6: If my bank turns me down, there’s no alternative
Myth 7: Our employees don’t want formal, pay-related incentives, and they’re no use in helping us grow.
Myth 8: We don’t need to engage the staff in a structured, involving way
Myth 9: I can’t get recruits to fit my needs
Myth 10: My business doesn’t need to restructure its management as it grows
Myth 11: It is not worth devoting the time to networking
Myth 12: There’s no business support out there for me
Policy Considerations
These findings appear to be policy relevant in a number of respects.
The findings elucidate a wider set of obstacles to growth than are investigated in most business surveys.
Within this, the analysis, demonstrated in the Venn diagrams, which shows how these obstacles work in concert to constrain growth has clear relevance to thinking about the targeting of policy. Indeed this analysis provides a de facto segmentation model that could be used either in its own right or as a supplement to other such models.
The findings relating to the ‘mindsets’ of business owners are also potentially important. If the behaviours of businesses owners are shaped by their innate dispositions and these dispositions ultimately affect business performance, this has clear implications for policy. For example, some businesses owners are, at a deep level, disposed to resist change and growth, the problem here is not an information failure; providing these business owners with information and advice will not in itself change the way they run their businesses.
82
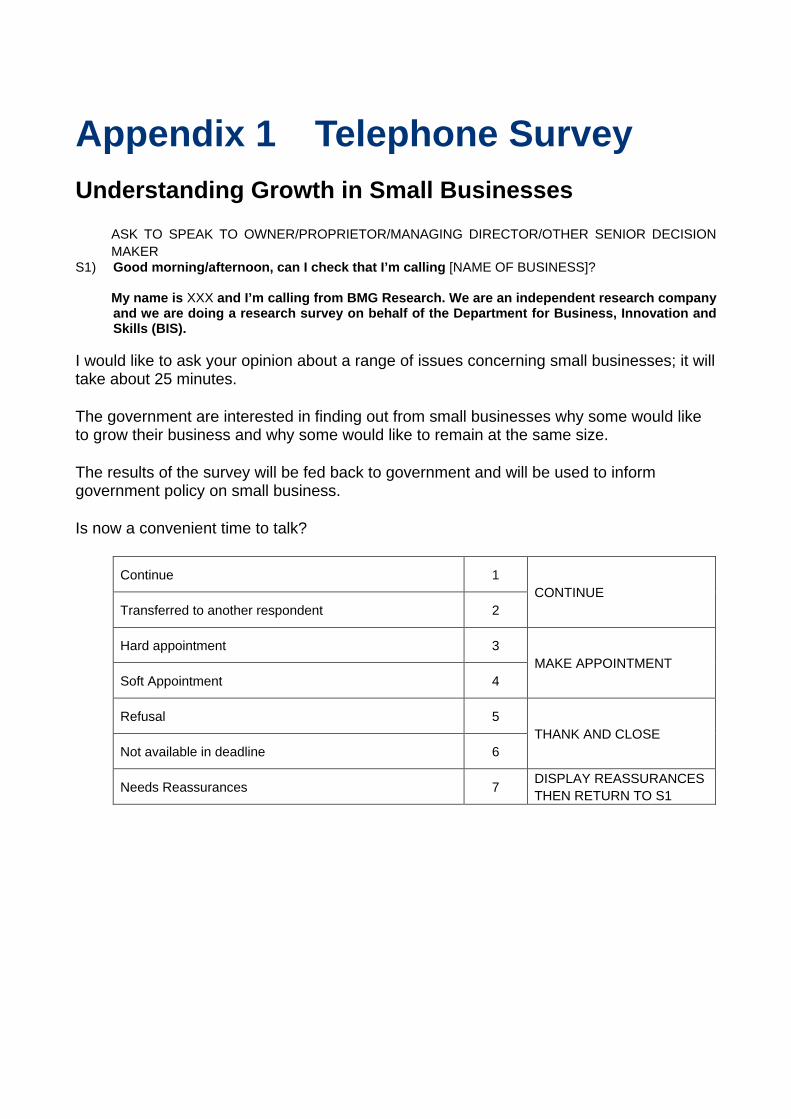
Appendix 1 Telephone Survey Understanding Growth in Small Businesses
ASK TO SPEAK TO OWNER/PROPRIETOR/MANAGING DIRECTOR/OTHER SENIOR DECISION MAKER
S1) Good morning/afternoon, can I check that I’m calling [NAME OF BUSINESS]?
My name is XXX and I’m calling from BMG Research. We are an independent research company and we are doing a research survey on behalf of the Department for Business, Innovation and Skills (BIS).
I would like to ask your opinion about a range of issues concerning small businesses; it will take about 25 minutes.
The government are interested in finding out from small businesses why some would like to grow their business and why some would like to remain at the same size.
The results of the survey will be fed back to government and will be used to inform government policy on small business.
Is now a convenient time to talk?
Continue 1 CONTINUE
Transferred to another respondent 2
Hard appointment 3 MAKE APPOINTMENT
Soft Appointment 4
Refusal 5 THANK AND CLOSE
Not available in deadline 6
Needs Reassurances 7 DISPLAY REASSURANCES THEN RETURN TO S1

REASSURANCES TO USE IF NECESSARY
• Your co-operation will ensure that the views expressed are representative of all small businesses
• Whether or not you like the government’s actions, this is your chance to influence them – everyone’s views will be taken into account
• The results will be available in early 2015 and will be posted on the Department for Business, Innovation and Skills website www.bis.gov.uk
• All information collected will be treated in the strictest confidence. Responses will not be attributed to any individual or company. Results will be reported in the form of aggregated statistics.
• We work strictly within the Market Research Society Code of Conduct
• If you require further information you can call Emma Parry at BMG on 0121 333 6006, or Michelle Harrison at BIS on 0114 207 5195
ASK ALL S2 Can I just check, are you one of the most senior person in day-to-day control of your business?
Continue 2 CONTINUE
Transferred to another respondent 2
Hard appointment 3 MAKE APPOINTMENT
Soft Appointment 4
Refusal 5 THANK AND CLOSE
Not available in deadline 6
Needs Reassurances 7 DISPLAY REASSURANCES THEN RETURN TO S2
ASK ALL S3 Firstly, I’d like to ask a few questions about your business. How many employees does your business currently employ across all sites, excluding owners and partners?
• EXCLUDE SELF-EMPLOYED • EXCLUDE OWNERS/PARTNERS • INCLUDE DIRECTORS • INCLUDE FULL AND PART TIME • INCLUDE TEMPORARIES/CASUALS, BUT NOT AGENCY STAFF
ENTER NUMBER (0-999)
Don’t know
Refused
84

ASK IF DK/REF AT S3 S4 Do you employ ......READ OUT. SINGLE CODE ONLY
Less than ten people? 1
10-19 people? 2
20-49 people? 3
50 people or more? 4
Don’t know / refused 5 S3/4 QUOTA
Quota cell Definition Number of interviews to achieve
Micro (0-9) S3/0-9 or S4/1 THANK AND CLOSE
Small (10-19) S3/10-19 or S4/2 300
Small (20-49) S3/10-19 or S4/3 300
Medium/large (50+) S3/50-999 or S4/4 THANK AND CLOSE S4/5 DK/REF THANK AND CLOSE
ASK ALL S5 I have the following as a general description of your business [INSERT DESCRIPTION BASED ON SIC CODE ON SAMPLE] as a general classification of your organisation’s principal activity. Bearing in mind this is a general classification only, does this sound about right?
Yes 1 No 2
ASK IF DISAGREES WITH DESCRIPTION (S5/2)
S6 What is the principal activity of your organisation?
PROBE AS NECESSARY: • What is the main product or service of this organisation? • What exactly is made or done at this organisation? • What material or machinery does that involve using?
PROBE FULLY. RECORD DETAILS AND CODE BELOW
Don’t know X
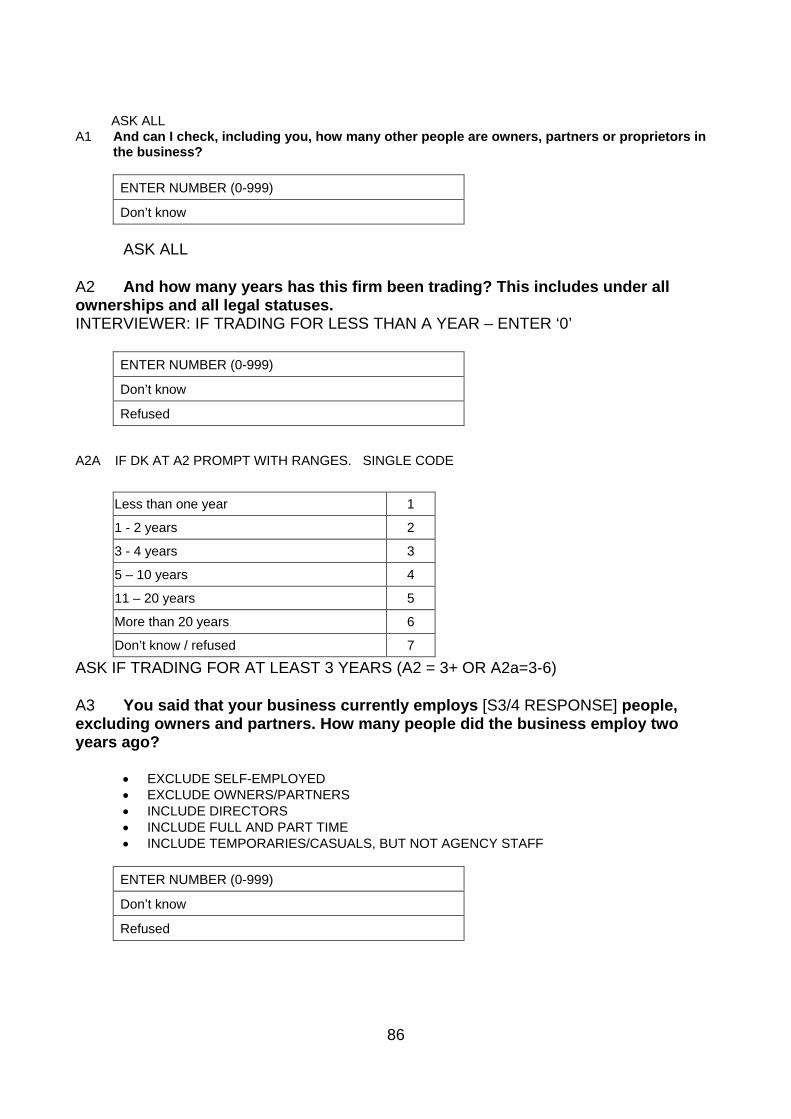
ASK ALL A1 And can I check, including you, how many other people are owners, partners or proprietors in
the business?
ENTER NUMBER (0-999)
Don’t know ASK ALL
A2 And how many years has this firm been trading? This includes under all ownerships and all legal statuses. INTERVIEWER: IF TRADING FOR LESS THAN A YEAR – ENTER ‘0’
ENTER NUMBER (0-999)
Don’t know
Refused
A2A IF DK AT A2 PROMPT WITH RANGES. SINGLE CODE
Less than one year 1
1 - 2 years 2
3 - 4 years 3
5 – 10 years 4
11 – 20 years 5
More than 20 years 6
Don’t know / refused 7 ASK IF TRADING FOR AT LEAST 3 YEARS (A2 = 3+ OR A2a=3-6)
A3 You said that your business currently employs [S3/4 RESPONSE] people, excluding owners and partners. How many people did the business employ two years ago?
• EXCLUDE SELF-EMPLOYED • EXCLUDE OWNERS/PARTNERS • INCLUDE DIRECTORS • INCLUDE FULL AND PART TIME • INCLUDE TEMPORARIES/CASUALS, BUT NOT AGENCY
ENTER NUMBER (0-999)
Don’t know
Refused
STAFF
86

ASK IF DK AT A3
A3a Do you know if you employed more people than now, less than now or about the same?
More than now 1
Less than now 2
About the same as now 3
Don’t know 4 ASK IF TRADING FOR AT LEAST 5 YEARS (A2 = 5+ OR A2A=4-6)
A4 And how many people did the business employ five years ago?
• EXCLUDE SELF-EMPLOYED • EXCLUDE OWNERS/PARTNERS • INCLUDE DIRECTORS • INCLUDE FULL AND PART TIME • INCLUDE TEMPORARIES/CASUALS, BUT NOT AGENCY
ENTER NUMBER (0-999)
Don’t know
Refused
STAFF
ASK IF DK AT A4
A4a Do you know if you employed more people than now, less than now or about the same?
More than now 1
Less than now 2
About the same as now 3
Don’t know 4
ASK ALL A7 Did you start up this business yourself, inherit or buy it?
PROMPT AS NECESSARY. SINGLE CODE
Started business myself / with others 1
Inherited business / started by family 2
Bought business 3
None of the above 4
Refused 5

ASK ALL
A9 Do you regularly use agency or temporary staff?
Yes 1
No 2
Don’t know 3
ASK ALL A10 Can you please tell me the approximate turnover of your busi12 months?: IF NECESSARY REMIND RESPONDENT THAT ALL INFABSOLUTELY CONFIDENTIAL. SINGLE CODE. PROMPT IF NECESS
Less than £25,000 1
£25,000 to £49,999 2
£50,000 to £72,999 3
£73,000 to £76,999 4
£77,000 to £99,999 5
£100,000 to £249,999 6
£250,000 to £499,999 7
£500,000 to £999,999 8
£1m to £1.49m 9
£1.5m to £2.8m 10
£2.81m to £4.99m 11
£5m - £9.99m 12
£10m - £14.99m 13
£15m - £24.99m 14
£25m or more 15
Don’t know 16
Refused 17
ASK IF THREE YEARS + OLD (A2/3+ OR A2A/3-6)
A11 Comparing the situation now with two years ago in 2012, would yoturnover of your business has increased, decreased or stayed roughly thSINGLE CODE. PROMPT AS NECESSARY.
Increased 1
Decreased 2
Roughly the same 3
DO NOT READ OUT: Don’t know 4
88
ness in the past ORMATION IS ARY.
u say the e same?

DO NOT READ OUT: Refused 5

ASK IF FIVE YEARS + (A2/5+ OR A2A/4-6) A12 Between 2009 and 2012 would you say the turnover of your business increased, decreased or stayed roughly the same? SINGLE CODE. PROMPT AS NECESSARY.
Increased 1
Decreased 2
Roughly the same 3
DO NOT READ OUT: Don’t know 4
DO NOT READ OUT: Refused 5 ASK ALL ONE YEAR + (A2/1+ OR A2A/2-6)
A13 Taking into account all sources of income in the last financial year, did you generate a profit or surplus?
Yes 1
No 2
Don’t know 3
Refused 4 ASK IF MADE A PROFIT (A13/1)
A14 Can you please tell me what the approximate net profit of your business was in the last financial year? IF NECESSARY REMIND RESPONDENT THAT ALL INFORMATION IS ABSOLUTELY CONFIDENTIAL. SINGLE CODE. PROMPT IF NECESSARY.
Less than £1,000 1
£1,000 - £4,999 2
£5,000 - £9,999 3
£10,000 - £24,999 4
£25,000 - £49,999 5
£50,000 - £74,999 6
£75,000 - £99,999 7
£100,000 - £249,999 8
£250,000 - £299,999 9
£300,000 - £499,999 10
£500,000 - £999,999 11
£1m - £2.499m 12
Over £2.5m 13
Don’t know 14
Refused 15
90


B Growth Ambitions
ASK ALL B1 Do you plan to grow the business over the next three years?
SINGLE CODE
Yes 1
No 2
Don’t know 3
ASK IF DON’T PLAN TO GROW BUSINESS (B1/2-3) B1A Why have you decided not to grow your business over the next three years?
INTERVIEWER PROBE (BUT DO NOT PROMPT): And are there any other reasons? IF RESPONDENT INTENDS TO RETIRE/SELL BUSINESS, CHECK THAT THIS IS IN THE NEXT THREE YEARS DO NOT READ OUT. CODE ALL THAT APPLY Not enough business / work available 1
Happy at this size 2
Don’t need more staff 3
Can’t get (more) financing 4
Too stressful 5
Difficult to find the right staff 6
Extra regulations / red tape 7
Don’t want to take out (more) financing 8
Intend to retire in next 3 years 9
Intend to sell / pass on the business in next 3 years 10
Other (PLEASE SPECIFY) 11
Don’t know 12
Refused 13
ASK IF DON’T PLAN TO GROW BUSINESS (B1/2-3) B1B Do you believe this business could grow if you wanted it to?
Yes 1
No 2
Don’t know 3
Refused 4
92

ASK IF PLAN TO GROW BUSINESS (B1/1) B2 Do you plan to grow the organisation over the next three years in terms of the numbers employed? IF YES: by approximately what percentage? SINGLE CODE
ENTER PERCENTAGE (0-999)
No – will not grow employment
Yes - Don’t know by what percentage
Don’t know if will grow employment
Refused
ASK IF DON’T KNOW PERCENTAGE AT B2
B2a Might you be able to say roughly by how much? Would it be...
READ OUT. SINGLE CODE
By up to 20% 1
By between 20% and 50% 2
By more than 50% 3
DO NOT READ OUT: Don’t know 4
DO NOT READ OUT: Refused 5 ASK IF PLAN TO GROW BUSINESS (B1/1)
B3 Do you plan to grow the organisation over the next three years in terms of turnover? IF YES: by approximately what percentage?
ENTER PERCENTAGE (0-100)
No – will not grow turnover
Yes - Don’t know by what percentage
Don’t know if will grow turnover
Refused
ASK IF DON’T KNOW PERCENTAGE AT B3
B3A Might you be able to say roughly by how much? Would it be...
READ OUT. SINGLE CODE

By up to 20% 1
By between 20% and 50% 2
By more than 50% 3
DO NOT READ OUT: Don’t know 4
DO NOT READ OUT: Refused 5
94

ASK ALL EXCEPT THOSE WHO PLAN TO RETIRE/ CLOSE BUSINESS IN NEXT 3 YEARS (NOT B1A/9-10)
B4 From your personal perspective, what is the ideal size of your business in the long term - i.e. beyond the next three years - in terms of turnover? READ OUT. SINGLE CODE
Significantly larger than its current size 1
Slightly larger 2
The same size as now 3
Slightly smaller 4
Significantly smaller 5
DO NOT READ OUT: Don’t know 6 ASK ALL EXCEPT THOSE WHO PLAN TO RETIRE/ CLOSE BUSINESS IN NEXT 3 YEARS (NOT B1A/9-10)
B5 From your personal perspective, what is the ideal size of your business in the long term - i.e. beyond the next three years - in terms of employment? READ OUT. SINGLE CODE
Significantly larger than its current size 1
Slightly larger 2
The same size as now 3
Slightly smaller 4
Significantly smaller 5
DO NOT READ OUT: Don’t know 6
ASK ALL EXCEPT THOSE WHO PLAN TO RETIRE /CLOSE BUSINESS IN NEXT 3 YEARS (NOT B1A/9-10)
B6 On a scale of 1 to 10 (with 1 being not at all and 10 being very strongly), how strongly do you as an individual desire business growth now? SINGLE CODE
Not at all Very strongly
1 2 3 4 5 6 7 8 9 10
Don’t know 11

ASK IF PLAN TO GROW BUSINESS (B1/1)
B7 What actions are you doing to grow your business? DO NOT PROMPT. MULTICODE OK
Introducing new/ significantly improved products and/or services 1
Introducing improved processes 2 Diversifying into new markets/seeking out new opportunities/new customers 3
Recruiting additional staff 4
Investing in job role specific training for existing staff 5
Seeking to acquire other businesses 6
Developing marketing strategy 7
Developing export markets 8
Investing in larger/new premises/adding another site 9
Restructuring the business 10
Developing online presence 11
Other (SPECIFY) 12
Nothing / Not sure yet 13
Don’t know / Refused 14
96

C Internal Capacities and Capabilities
ASK ALL C1 I’d now like to turn to the range of tasks that you might need to do when running a business, and for you to tell me how capable you think your business is at doing them.
I’m going to read out a list of business activities and I’d like you to rate your business from 1 to 5, where 1 is rated as very poor and 5 as very strong. If, for any of the following, you are not able to answer as your business has not done any of the below please let us know
You can include in your assessment any external expertise you use to achieve the task. How capable would you say your business is at... READ OUT. REMIND RESPONDENT OF CODES AS NECESSARY. DP: ROTATE STATEMENTS.
Very Poor Poor Average Strong Very Strong
Don’t know
NA –No experience of
People management, such as recruitment and delegation 1 2 3 4 5 6 7
Training staff? 1 2 3 4 5 6 7
Developing and implementing a business plan and strategy 1 2 3 4 5 6 7
Taking decisions on regulation and tax issues 1 2 3 4 5 6 7
Managing cashflow 1 2 3 4 5 6 7
E-commerce? 1 2 3 4 5 6 7 ASK ALL
C2 If you have a written business plan has it been reviewed in the last 12 months? SINGLE CODE
Have a business plan AND reviewed in last 12 months 1
Have a business plan BUT NOT reviewed in last 12 months 2
No – Do not have a written business plan 3
DO NOT READ OUT: Don’t know 4
DO NOT READ OUT: Refused 5

D Obstacles to Success / Growth
ASK ALL I would now like to ask some questions about the challenges facing businesses as they grow. ADD IF DO NOT INTEND TO GROW IN NEXT 3 YEARS (B1/2): I know you said earlier that you do not intend to grow your business in the next 3 years, but we’re still interested in what sort of difficulties you might face if you did want to grow.
D1 I am going to read you a list of issues, and for each I would like you to tell me which, if any, represent obstacles to your business growing. READ OUT. MULTICODE. RANDOMISE CODES 1 TO 12
ASK IF D1 MULTICODED
D2 And which currently represents the biggest obstacle to your business growing? SHOW LIST OF THOSE MENTIONED AT D1 PLUS DK/REF. SINGLE CODE ONLY
D1 D2
The economy 1 1
Obtaining finance 2 2
Cash flow 3 3
Taxation, VAT, PAYE, National Insurance, Business Rates 4 4
Recruiting staff 5 5
Regulations 6 6
Availability / cost of suitable premises 7 7
Competition in the market 8 8
Shortage of managerial skills / expertise 9 9
Shortage of skills generally 10 10
Pensions 11 11
Are there any other obstacles? (PLEASE SPECIFY) 12 12
DO NOT READ OUT: No obstacles (SINGLE CODE ONLY) 13 13
DO NOT READ OUT: No opinion (SINGLE CODE ONLY) 14 14
DO NOT READ OUT: Refused (SINGLE CODE ONLY) 15 15
NB: NO D3-D4
98

ASK IF CASHFLOW AN OBSTACLE (D1/3) D5 Which of the following steps, if any, have you taken in the last 5years to improve your business’s cashflow? Have you... READ OUT. MULTICODE.
Sold invoices / factoring 1 Reduced bad debts 2 Used government provisions to change payment schemes of taxes 3 Improved your payment terms with suppliers 4 Achieved quicker payment times from customers 5 Got credit from suppliers 6 Changed suppliers to decrease costs 7 Increased overdraft 8 Anything else? (SPECIFY) 9 DO NOT READ OUT: None of the above 10 DO NOT READ OUT: Don’t know 11 DO NOT READ OUT: Refused 12
NB: NO D6 ASK IF REGULATIONS AN OBSTACLE (D1/6)
D7 Which of the following are specific challenges associated with regulations? READ OUT. MULTICODE
Burdensome regulations 1
Unsure which regulations apply to your business 2
Regulatory costs are disproportionately greater with growth 3
Not knowing how to implement specific regulations 4
The fear that if the business grows it might be subject to more regulations 5
Anything else? (PLEASE SPECIFY) 6
DO NOT READ OUT: None of the above 7
DO NOT READ OUT: Don’t know 8
DO NOT READ OUT: Refused 9

E Finance
ASK ALL E1 Have you made, or attempted to make, a significant investment related to growing your
business in the past 5 years?
Yes 1
No 2
Don’t know 3
Refused 4 ASK IF MADE OR TRIED TO MAKE SIGNIFICANT INVESTMENT (E1/1)
E2 For which specific reasons were you making the investment? DO NOT READ OUT. MULTICODE
Start-up business 1
To purchase an asset (e.g. equipment) 2
New premises/refurbish existing premises 3
To fund a new product or service 4
To fund entry into a new market 5
Other (SPECIFY) 6
DO NOT READ OUT Don’t know 7
DO NOT READ OUT Refused 8 ASK IF MADE OR TRIED TO MAKE SIGNIFICANT INVESTMENT (E1/1)
E3 Did this investment involve seeking external finance?
Yes 1
No 2
Don’t know 3
Refused 4
ASK IF PLANNED INVESTMENT, BUT DID NOT USE EXTERNAL FINANCE (E3/2)
E4A Why did you not use external finance? Was this because you could not raise it, or did you face other significant obstacles? SINGLE CODE ONLY
Did not need/require external finance 1
Could not raise finance 2
Other significant obstacles (SPECIFY) 3
Decided against it 4
Don’t know 5
100

Refused 6

ASK IF MADE OR TRIED TO MAKE SIGNIFICANT INVESTMENT (E1/1) E4B How much has your business invested in this growth project in the last five years? This may have involved internal or external finance. IF NECESSARY REMIND RESPONDENT THAT INFORMATION IS CONFIDENTIAL. SINGLE CODE. PROMPT IF NECESSARY.
Less than £1,000 1
£1,000 - £4,999 2
£5,000 - £9,999 3
£10,000 - £24,999 4
£25,000 - £49,999 5
£50,000 - £74,999 6
£75,000 - £99,999 7
£100,000 - £249,999 8
£250,000 - £299,999 9
£300,000 - £499,999 10
£500,000 - £999,999 11
£1m - £2.499m 12
Over £2.5m 13
Don’t know 14
Refused 15 ASK IF APPLIED FOR EXTERNAL FINANCE (E3/1)
E5 Before putting in your application for finance or approaching providers what if anything did you do to prepare? READ OUT 1-4. MULTICODE.
Drew up a business plan or updated your existing plan 1 Took advice on applying for finance 2 Considered alternative sources of finance (for example venture capital or crowd sourcing) 3
Anything else? (SPECIFY) 4 DO NOT READ OUT: None of the above 5 DO NOT READ OUT: Don’t know 6 DO NOT READ OUT: Refused 7
102

ASK IF APPLIED FOR EXTERNAL FINANCE (E3/1) E6 On a scale of 1 to 5 where one is very easy and five is very difficult, how easy or difficult was it for you to obtain the finance you required? SINGLE CODE ONLY
Very easy 1
2
3
4
Very difficult 5
Don’t know 6
Refused 7
ASK IF DID NOT SEEK FINANCE, EXCEPT IF THEY DID NOT NEED IT (E1/2-4 OR E3/2-4, BUT NOT E4A/1)
E7 Which of these, if any, are reasons why you have not applied for external finance for the purpose of growth in the last five years? READ OUT. RANDOMISE ORDER OF READING 1-7. MULTICODE OK 1-8
ASK IF MORE THAN ONE REASON AT E7 (1-8)
E8 And which of these was the main reason for not applying for finance? SINGLE CODE ONLY
You did not need finance 1 1
You used internal savings instead 2 2
You thought you would be rejected 3 3
You thought external finance would be too expensive 4 4
You didn’t want to take on additional risk 5 5
It was not the right time because of economic conditions 6 6
You didn’t know where to find the appropriate finance 7 7
Other reasons (SPECIFY) 8 8
Don’t know 9 9
Refused 10 10
ASK ALL
E9 On a scale of 1 to 5 where one is very easy and five is very difficult, if you attempted to get finance for a major investment today, how easy or difficult do you think it would be to obtain? SINGLE CODE ONLY
Very easy 1
2
3
4
Very difficult 5
Don’t know 6
Refused 7
104

F Exporting
ASK ALL F1 Approximately what percentage of your turnover comes from outside of the UK, including
overseas licensing and fees from overseas companies? WRITE IN PERCENTAGE (0-100%)
WRITE IN % Don’t know Refused Turnover from outside of the UK X Y
ASK IF LESS THAN 10% EXPORTED (F1/0-9 OR DK/REF) F2 Do you have goods or services that could be exported in significant quantities? By this I
mean exports that could account for at least 10% of your turnover?
Yes 1 No 2 Don’t know 3 Refused 4
ASK IF 10% OR MORE EXPORTED (F1/10-100) OR COULD POTENTIALLY EXPORT (F2/1)
F3 On a scale of one to five, where one is insignificant, and five is very significant, how significant were the following barriers (IF 10% OR MORE EXPORTED when you first started exporting) (IF COULD POTENTIALLY EXPORT in preventing you from exporting more)? READ OUT. RANDOMISE ORDER OF STATEMENTS. SINGLE CODE FOR EACH
Insignificant Significant DK REF Little knowledge of how to export 1 2 3 4 5 X Y Difficulty finding overseas customers or opportunities 1 2 3 4 5 X Y
Fear of payment problems 1 2 3 4 5 X Y Lack of management time to pursue export opportunities 1 2 3 4 5 X Y
The cost of exporting 1 2 3 4 5 X Y Being too small to export 1 2 3 4 5 X Y

G Innovation
ASK ALL
G1 During the last five years, has your business introduced a new or significantly improved goods, service or process that has involved a significant investment of money or time, or a significant reorganisation of the business?
Please include all product or process innovation, regardless of origin, but excluding the simple resale of goods purchased from other businesses, and changes of a solely aesthetic nature
IF YES: Does this apply to significantly improved goods or services, or processes? MULTICODE OK 1-2
Yes – goods/services 1 Yes - processes 2 No - neither 3 Don’t know 4
ASK ALL WITH ANY INNOVATION (G1/1-2)
G2 On a scale of 1 to 5 where one is very easy and five is very difficult, how easy or difficult was it to improve these goods or services or processes? SINGLE CODE ONLY
Very easy 1
2
3
4
Very difficult 5
Don’t know 6
Refused 7
106

ASK ALL G3 Has your company registered any Intellectual Property in the past five years? PROMPT IF
NECESSARY: IP includes patents, copyrights and trademarks
Yes 1 No 2 Don’t know 3
ASK ALL
G4 Do you collaborate with larger businesses in developing new products, services or processes? IF YES: Have you introduced new products, services or processes in the past five years as a result of this?
Yes 1 No 2 Don’t know 3
ASK ALL G5 On a scale of one to five, where one is not at all important, and five is very important, in the
last five years how important were the following barriers in preventing you from innovating? RANDOMISE ORDER OF STATEMENTS. SINGLE CODE FOR EACH
Not important Important DK REF Lack of internal funds 1 2 3 4 5 X Y Lack of external finance 1 2 3 4 5 X Y Costs too high 1 2 3 4 5 X Y Lack of qualified personnel 1 2 3 4 5 X Y Difficulty in finding external partners 1 2 3 4 5 X Y Market dominated by larger businesses 1 2 3 4 5 X Y
Regulations 1 2 3 4 5 X Y
H Management and training
ASK ALL H1 In the last five years have you tried to recruit employees?
Yes 1 No 2 Don’t know 3 ASK ALL
H4 What, if any, of the following steps have you taken to improve the skills of your workforce in the last five years? Have you... READ OUT. MULTICODE.
Undertaken internal training 1 Undertaken external training 2 Used external agency staff/subcontractors/consultants to fill in skills gaps 3 Conducted a skills audit of your business 4 Recruited new staff 5 Anything else?(SPECIFY) 6 DO NOT READ OUT: None of the above 7 DO NOT READ OUT: Don’t know 8 DO NOT READ OUT: Refused 9
ASK ALL
H5 Apart from the owners of the business, do you have any other employees you would classify as being part of a SENIOR management team? By senior, we mean someone at the level of a finance director or HR manager, not supervisors or lower level managers.
Yes 1 No 2 Don’t know 3
108

ASK ALL WITH SENIOR MANAGEMENT TEAM (H5/1)
H5a How many of these other senior managers do you have? WRITE IN 0-49
WRITE IN Don’t know X Refused Y ASK ALL
H5b Do you have senior managers or directors fulfilling these job roles? READ OUT. MULTICODE OK 1-7
Finance director 1 HR manager 2 Sales or marketing manager 3 Operations manager 4 Procurement managers 5 Technology officer 6 Other dedicated managers (SPECIFY ROLE) 7 None of these 8 Don’t know 9 Refused 10
ASK ALL H5c Have you ever recruited employees specifically to join the management team?
Yes 1 No 2 Don’t know 3
ASK IF HAVE MANAGEMENT TEAM (H5/1) H6 How many employees did you have when a senior manager, other than the owners, was first appointed?
• EXCLUDE SELF-EMPLOYED • EXCLUDE OWNERS/PARTNERS • INCLUDE DIRECTORS • INCLUDE FULL AND PART TIME • INCLUDE TEMPORARIES/CASUALS, BUT NOT AGENCY STAFF
ENTER NUMBER (0-999)
Don’t know
Refused

ASK IF DK AT H6
H6a Do you know if you employed more people than now, less than now or about the same?
More than now 1
Less than now 2
About the same as now 3
Don’t know 4
ASK ALL WITHOUT SENIOR MANAGEMENT TEAM (H5 NOT 1)
H6b Excluding the owners, how many employees do you think you would need to have for you to consider recruiting other senior managers? WRITE IN 10-999
WRITE IN Don’t know X Refused Y
ASK ALL
H7 On a scale of 1 to 5 where one is very easy and five is very difficult, how easy or difficult (IF H5/1 did you find it to expand the management team?) (IF H5 NOT 1 do you think it would be to expand the management team? SINGLE CODE ONLY
Very easy 1
2
3
4
Very difficult 5
Don’t know 6
Refused 7
ASK ALL H8 Which of the following apply to your business? READ OUT. MULTICODE.
You have a staff training plan 1 You have a dedicated budget for training 2 You have formal procedures in place for employee consultation, such as a staff association, employee forum or trade union consultation 5
You hold an ISO 9000 standard 6 You conduct training needs assessments 7
110

DO NOT READ OUT: None of the above 8 DO NOT READ OUT: Don’t know 9 DO NOT READ OUT: Refused 10

ASK ALL
H9 Does your business have any pay and incentives schemes for your employees? SINGLE CODE ONLY
Yes 1
No 2
Don’t know 3
Refused 4 ASK ALL
H10 Which, if any, of the following steps has your business undertaken in the last 5 years to free up time to concentrate on managing the business? READ OUT. MULTICODE.
Taken on more employees 1
Improved HR practices or the way staff are managed 2
Upgraded / bought in new software to help with managing the business 3
Subcontracted / outsourced some areas of your work 4 Used consultants to help manage the business 5 Anything else (SPECIFY) 6 DO NOT READ OUT: None of the above 7 DO NOT READ OUT: Don’t know 8 DO NOT READ OUT: Refused 9
ASK ALL H11 In the last five years have you taken any steps to try to increase the amount of sales you are
making or attract more customers?
Yes 1 No 2
Don’t know 3
ASK ALL WHO HAVE TAKEN STEPS TO INCREASE SALES (H11/1) H12 Which of the following steps have you taken? READ OUT. MULTICODE.
More advertising 1 Employed a dedicated sales person or marketing manager 2
Devised a new marketing strategy 3
Approached new customers 4 Undertaken training in marketing or sales 5 Anything else (SPECIFY) 6 DO NOT READ OUT: None of the above 7 DO NOT READ OUT: Don’t know 8
112

DO NOT READ OUT: Refused 9

ASK ALL H13 In the last five years have you sought external advice or information from any of the following on matters affecting your business? READ OUT. MULTICODE
A formal source such as a business mentor, accountant, bank 1 Business groups, networks or associates 2 Friends and family 3 DO NOT READ OUT: No none of the above 4 DO NOT READ OUT: Don’t know 5
I Motivations and mindsets
ASK ALL
I1 Now thinking about your business specifically how far do you agree or disagree with the following statements about what growth means or would mean for your business? READ OUT. CODE ONE PER ROW.
Disagree strongly
Disagree slightly
Neither / nor
Agree slightly
Agree strongly
Don’t know
Growing my business would be unnecessarily risky to its survival
1 2 3 4 5 6
Growing my business would be too costly 1 2 3 4 5 6
Growth would mean too much time would be spent managing rather than earning.
1 2 3 4 5 6
Growth would mean I’d lose too much control of the business.
1 2 3 4 5 6
I am prepared to invest my own money to grow the business
1 2 3 4 5 6
114

ASK ALL I2 Compared to others in your industry, how would you describe your product or service offering? Please use a scale where 10 indicates a substantial amount of customisation, and 1 that there is no difference. SINGLE CODE
No difference Substantial customisation
1 2 3 4 5 6 7 8 9 10
Don’t know 11 ASK ALL
I3 To what extent is your competitive success dependent on price? Please use a scale where 10 indicates that it does not depend on price at all, and 1 that it is wholly dependent. SINGLE CODE
Wholly dependent on price Does not depend on price
1 2 3 4 5 6 7 8 9 10
Don’t know 11 ASK ALL
I4 Do you lead the way in terms of developing new products, services or techniques? Please use a scale where 10 indicates that you often lead the way, and 1 that you very rarely or never lead the way. SINGLE CODE
Rarely/never lead the way Often lead the way
1 2 3 4 5 6 7 8 9 10
Don’t know 11 ASK ALL
I5 How would you describe your products or services? Please use a scale where 10 indicates that they are of premium quality, and 1 that they are standard or basic. SINGLE CODE
Standard/basic Premium quality
1 2 3 4 5 6 7 8 9 10
Don’t know 11

J Demographics
ASK ALL We are almost at the end of the survey. I would like now to ask a few short questions about your business, just so we can group similar businesses together for analysis purposes...
ASK ALL
J3 Is your business a family owned business? (A family business is majority owned by members of the same family) SINGLE-CODE
ASK IF FAMILY BUSINESS (J3/1).
J4 And for how many generations has the business been in the control of your family? SINGLE-CODE
ASK IF A1 GREATER OR EQUAL TO 2
J5 How many of your [RESPONSE TO A1] owners / partners are women?
ENTER NUMBER (RANGE=0 to value given at A1) Don’t know X Refused Y
Yes 1 No 2 Don’t know 3
1 1 2 2 3 3 4 4 Other [PLEASE SPECIFY] 5 Don’t know 6 Refused 7
116

ASK IF A1 GREATER OR EQUAL TO 2
J6 Can I ask which ethnic group the majority of the owners or partners of your business would be in? PROMPT AS NECESSARY. MULTICODE OK (IF NO MAJORITY AND SPLIT EVENLY).
White English/Welsh/Scottish/Northern Irish/British 1 Irish 2 Any other White background 3 Mixed / multiple ethnic groups White and Black Caribbean 4 White and Black African 5 White and Asian 6 Any other Mixed / multiple ethnic background 7 Asian/Asian British Indian 8 Pakistani 9 Bangladeshi 10 Chinese 11 Any other Asian background 12 Black / African / Caribbean / Black British African 13 Caribbean 14 Any other Black / African / Caribbean background 15 Other ethnic group Arab 16 Any other ethnic group (specify) 17 DO NOT READ OUT: Don’t know 18 DO NOT READ OUT: Refused 19

ASK IF ONLY ONE OWNER (A1/1)
J7 Which ethnic group do you consider yourself to be in? PROMPT AS NECESSARY. SINGLE CODE.
White English/Welsh/Scottish/Northern Irish/British 1 Irish 2 Any other White background 3 Mixed / multiple ethnic groups White and Black Caribbean 4 White and Black African 5 White and Asian 6 Any other Mixed / multiple ethnic background 7 Asian/Asian British Indian 8 Pakistani 9 Bangladeshi 10 Chinese 11 Any other Asian background 12 Black / African / Caribbean / Black British African 13 Caribbean 14 Any other Black / African / Caribbean background 15 Other ethnic group Arab 16 Any other ethnic group 17 DO NOT READ OUT: Don’t know 18 DO NOT READ OUT: Refused 19
ASK ALL
J8 What is the legal status of your organisation? READ OUT AS NECESSARY. ALLOW MULTICODE ONLY IF ‘OTHER’ MENTIONED
Sole proprietorship 1
Partnership 2
Limited Company (LTD) 3
Other (specify) 4
Don’t know 5
Refused 6
118

Just to finish off I’d like to ask a few questions about you, again this would just be for classification purposes....
ASK ALL
J10 Can I ask your age please?
ENTER NUMBER (ALLOW 16 – 99)
Refused Y
ASK IF REFUSED AGE QUESTION (J10 = REF)
J11 Would you be able to tell me if you are …? READ OUT. SINGLE CODE.
Under 25 1 Between 25 and 34 2 Between 35 and 44 3 Between 45 and 49 4 Between 50 and 54 5 Between 55 and 64 6 Over 64 7 Refused 8
ASK ALL
J12 About how many hours a week would you say you work on this business at the moment? Would you say it is.... PROMPT AS NECESSARY
1-7 hours 1 8-14 hours 2 15–21 hours 3 22–29 hours 4 30-35 hours 5 36–50 hours 6 51 hours or more 7 Don’t know / varies too much to say 8 Rather not say 9

ASK ALL WHERE BUSINESS IS MORE THAN 12 MONTHS OLD (A2/1+ OR A2A/2-7)
J13 About how much personal income would you say you derive annually from the business? PROMPT AS NECESSARY
ASK ALL
J14 Can I ask if prior to running this business you had any management experience with other businesses or organisations?
Yes 1 No 2 Don’t know 3
ASK IF HAD PREVIOUS MANAGEMENT EXPERIENCE (J14/1)
J15 About how many years of management experience did you have prior to running this business? ...Did you have... READ OUT. SINGLE CODE.
Less than a year 1 1 – 2 years 2 3 – 5 years 3 6 – 10 years 4 11 – 15 years 5 16 or more years 6 Don’t know 7 Rather not say 8
ASK ALL
Nothing 1 Up to £10,000 2 Up to £50,000 3 Up to £100,000 4 Over £100,000 5 Don’t know 6 Refused 7
120

J16 From the following list I am going to read out, can you tell me when we come to a qualification that you hold?
READ OUT. SINGLE-CODE
A postgraduate degree or doctorate, NVQ / SVQ Level 5 or equivalent 1 A degree or higher degree, HND, HNC, NVQ / SVQ Level 4 or equivalent 2 A levels, SCE higher, NVQ / SVQ Level 3 or equivalent 3 GCSE, O Levels, SCE standard, NVQ / SVQ Level 2 or equivalent 4 Other [PLEASE SPECIFY] 5 No formal qualifications 6 DO NOT READ OUT: Refused 7 ASK ALL
J17 INTERVIEWER CODE GENDER OF RESPONDENT
Male 1 Female 2
ASK ALL
That is the end of the interview, thank you once again for your time.
J18 Would it be possible for BIS to link your responses to other information that you have provided previously to the Government? By this data linkage, BIS can reduce the burden of our surveys on your business and can improve the evidence that it uses.
Data will only be used to inform research on businesses in aggregate - we will never release information that identifies any individual business - and your survey responses remain strictly confidential. Do you give your consent for us to do this?
Yes 1
No 2
ASK ALL J19 BIS is intending to carry out follow up research into growth among small businesses in the
next c
Yes 1 Maybe 2 No 3
ouple of months. Would you be willing to help with that research? SINGLE-CODE
I declare that this survey has been carried out under BMG instructions and within the rules of the MRS Code of Conduct.

122

Appendix 2 Qualitative Interview script Growth Interviews
Interviewee/position:
Company:
Interview date: _____________________________________________________
Interviewer: _______________________________________________________
THE INTERVIEW ‘CONTRACT’
Introduction: Thank you for taking the time to meet with us/talk with us.
Objectives: BMG and Durham University have been asked by the Department for Business, Innovation and Skills to better understand the processes of business growth – what growth means to you and your business, how your business achieved growth, and any problems, obstacles or enablers you encountered along the way. There are no ‘right’ or ‘wrong’ answers – we are simply interested in learning how your business grew, and how it might grow in the future, including what support you may need for that to happen. These interviews will help to inform government policy towards business support and how it may develop.
Objectives of the interviews:
• To gather information and obtain your personal views of:
o your experience and perception of business growth
o the ways in which you grew, what helped you or hindered you both internally and external to the business
o your capacity to grow, and how you might grow in the future
Confidentiality: The feedback, which you provide during this interview, is confidential and will not be attributed.
Time contract: The interview is designed to last around 40 minutes.
Note taking and questions: Although we are using a list of questions to enable us to draw out common themes, please feel free to input as appropriate.

• I will be recording the discussion in order to ensure we capture your thoughts accurately. If you would rather the session not be recorded, please tell me, and I will only take written notes.
• Are there any points you would like me to clarify before we proceed further?
Throughout: probe for how things have changed as the business has grown larger, and how their attitudes and perceptions have changed - especially when they have made changes as they have grown larger, and how attitudes to staff, delegation, regulation, raising finance etc have changed. BACKGROUND
1. Can you provide a brief history of your business? Prompts When was it established/did you buy/inherit it? How has it developed since then? What are the key moments – the periods of growth/decline etc? What is the businesses USP/competitive advantage, and how has this changed? Do you compete on price, quality, customer service etc? Are you a market leader in your field? How would you say you compared with your competitors? When you’ve grown the business in the past has there been episodes of stop and start growth or of decline? What made you grow and what made you stop/downsize? If bought the business – why did you buy rather than start? What were the advantages/disadvantages? How did that affect your attitude to growth? Anticipated growth?
2. What does growth mean to you? What does success mean to you - is that growth? Probe: What advantages and disadvantages of growth do you see personally? Explore attitudes to risk: do you think advantages outweigh the disadvantages e.g. financial risks, hassles, increased workload; and social norms: do you feel you should grow your business to create employment, for your children, be part of UK plc etc How do you measure? Turnover, employment, profits, efficiency?
3. How has your/the business’s attitude to and capacity for growth changed over the years? Probe about what that means for the business going forward – how has growth impacted their attitudes towards risk and growth, and their capacity for more growth, and how has and might this impacted on the business in the past and into the future
4. Are you planning for future growth? If not, why not? What is the obstacle? Do you think you can achieve growth, but do not want to? Or do you think that growth is too difficult, but you want to? Are you taking stock after a previous growth experience? If yes: What are your intentions about growth? What are you actively doing to achieve growth? Explore the reasons/rationale – why they have chosen to pursue growth, and why
124
now? What do they think are the main risks of actively planning for growth, and the costs etc? Where do they want to end up?
5. How has the business’s management structure changed since it was established? Are there non-owner managers? Internally promoted, or specifically recruited as managers? What are the pros and cons of each? To what degree do you delegate or contract out? At what level was it/might it be necessary to bring in a professional manager? Have you had any management training yourself? Probe: What sort? When did you get it? How did this impact on your ability/desire to achieve growth? What other managerial posts might you create if you grow larger? What are the risks associated with external managers?
6. Is it a family business? Is that important in your attitude towards growing the business? Would you bring in non-family managers, or involve non-family employees?
7. What is the ideal size of your business? Has this changed as you have grown? What are the benefits of being at that size? Do you think it is achievable – what are the risks? What would you have to do to get there?
Training/Staff motivation/Recruitment
8. How have you approached the recruitment of new staff? How has this changed as you have grown larger? How difficult is it to recruit new staff? How have your staffing needs changed as you grew? Do you intend to recruit more staff in the future? What are the difficulties you envisage? Are there skills shortages? How has this changed over the years, and as you have grown larger? What is the risk of adding more staff? What are the costs of recruiting and have they changed as you have grown?
9. How much, and what type of training, do your staff receive? How has this changed over the years? Do you have a training plan/budget? Why/how does training impact on your business? What are the costs and benefits? do they invest in training?
10. Do you have any formal or informal staff consultation systems? How has this changed over the years, as you have grown? Do you intend to introduce (further) such systems? Has this had any impact on growth? On morale/retention etc? Probe if staff feel ‘ownership’ of the business.
11. Do you have any form of reward for staff (eg profit-sharing, better pensions arrangements, treats)? When was this introduced? What effects did it have – did it contribute to growth? What were the obstacles to doing do? Do you plan to undertake staff consultation in more depth or through other channels? If no: why not? Do you plan to introduce it in the future? What are the impacts you envisage?

Working capital 12. Do you have any difficulties related to working capital or cashflow? What have you
done to improve cashflow? How has that impacted on your growth? Do you need stable/predictable cashflow to pursue growth? Has lack of stability in cashflow held back your growth? What help have the banks provided? Investment capital
13. Have you made a significant investment in the past 5 years? Why/why not (probe: did you want to but could not get funds?) Did you have any difficulties – if so what, and how did you overcome them? Do you intend to in the future? What for? What obstacle do you envisage? How difficult do you think it would be to obtain the finance you required? Or would you rather rely on internal sources? What did you do to prepare? Did you seek out any support related to applying for finance?
14. What, if any, do you perceive as the main difficulties affecting access to finance? How have these changed as you have grown? Prevailing economic conditions
15. How have the prevailing economic conditions affected your growth over the past few years? What sort of strategies did you adopt to deal specifically with the recession? How confident do you feel about your sector now? Is the level of competition you face increasing/decreasing? Do you believe that you operate in a limited market? How confident do you feel about the future, and about pursuing growth? Are there any specific issues you feel uncertain about e.g. interest rates, EU, legislation, skill shortages that might lead to you being unwilling to pursue growth? Strategy
16. Do you have a business plan? Is it regularly updated? How is it used in target setting? What sort of metrics do you collect, and how do you analyse them? Do you have any other similar plans - HR, training etc.? How has the business plan, and its use, changed as you have grown?
Export
17. Do you export your goods/services? If not, would it be possible to export? Why do you not export? Do you plan to start? What sort of support might you need/did you use?
18. When and how did you start exporting? Was it part of a planned strategy? If yes, how did you go about it? What support did you need? How difficult was it to start exporting? How has that changed over time? If not, has it become a strategy now? Do you plan to try and increase exports in the future? Or to pursue a different strategy about exports? How has exporting impacted on your business growth?
126

19. Do you have any other partnership or collaborative links with other businesses? (domestic or foreign) Technology/innovation
20. How central to your business is innovation/R&D or high technology? Do you (or did you) pursue a strategy based on innovation? Or on high technology? Do you hold IP? Is there scope to increase your level of innovation/technology usage? Do you intend to do so? If not, why not? How has your level of innovation/R&D changed as you have grown? Do you regard your business as ‘cutting edge’, a ‘technological leader’ etc?
21. How difficult was it to start adopt a more R&D-intensive strategy/do you think it would be to undertake a more R&D intensive strategy? Talk more generally about innovation. What are the costs and benefits and risks of pursuing a strategy more focused on R&D? Have you sought any support for innovation or in other technology areas?
22. What has been the impact of innovation on your business growth? What have been the costs and benefits? How do you anticipate your R&D/tech strategy changing in the future? Regulation
23. How much time do you spend dealing with regulation and legislation? How has this changed as you have grown? Does this change match to what your expectations were when your business was smaller? What impact does regulation etc have on your business growth? Does regulation make you unwilling to grow further? Did it in the past, and how did you overcome this?
Other 24. What is your work/life balance like?
How has this changed as the business has grown? How have your feelings about delegation changed? And the amount/type of work you delegate. Have you become more efficient/make better use of your time?
25. Where do you get information and advice from to help run your business? How has the source and type of support and advice changed over the years? Do you need specific support at the moment to help overcome a problem or realise a growth plan? Do you know where to find trusted advice and support?

Appendix 3 Myths from 2013 Myth 1: I am not a business Myth 2: I can’t grow in a recession Myth 3: It’s difficult to find the right person to employ and I haven’t got time to look for them Myth 4: Taking on employees is too complex and too fraught Myth 5: Taking on employees is too risky and too costly Myth 6: The market is too limited in my area Myth 7: I need finance to grow but banks won’t lend and there’s no alternatives Myth 8: I don’t have any options to control cashflow Myth 9: There’s no point in networking or seeking external advice Myth 10: If I grow any larger, the regulatory burden would be too heavy for me to cope with
128

Appendix 4 Explaining the three constraints Using the survey 31 questions were identified as obstacles to growth and these were allocated to one of each of the three categories. Crucially these obstacles go beyond the usual barriers to growth, as used for example in the SBS survey, and include indicators of a lack of vision, capacity and external or market constraints to growth. These 31 questions were clustered in alignment with each of these three constraints and businesses needed to meet a minimum number of criteria to be aligned within these categories. Businesses could be allocated to one or more of the constraint categories.
Capacity Constraint
There were 9 questions which represented obstacles that would be considered as capacity constraints (Table A.1). A score of 9 was therefore possible, but few businesses were so acutely constrained to record the higher scores. Matching four out of nine represented a good indication that the business was capacity constrained. Using this definition, 38 per cent of the unweighted sample were shown to be capacity constrained.
Table A.1 List of barriers for Capacity constraint
Questionnaire Number Qualifying criteria
Proportion of sample qualifying
C2 If you have a written business plan has it been reviewed in the last 12 months?
No plan or no updated plan 41.9%
H4 What, if any, of the following steps have you taken to improve the skills of your workforce in the last five years? Have you undertaken external training?
No external training in the last five years 21.2%
D1A I am going to read you a list of issues, and for each I would like you to tell me which, if any, represent obstacles to your business growing. The economy
Economy reported as obstacle 58.1%
F2 Do you have goods or services that could be exported in significant quantities? By this I mean exports that could account for at least 10% of your turnover?
Reported as unable to achieve 10% of sales as exports 73.7%
C1A How capable would you say your business is at People management, such as recruitment and delegation
Very poor, poor, average or no experience 28.6%
C1B How capable would you say your business is at Training staff
Very poor, poor, average or no experience 30.1%

Questionnaire Number Qualifying criteria
Proportion of sample qualifying
C1C How capable would you say your business is at Developing and implementing a business plan and strategy
Very poor, poor, average or no experience 35.4%
C1D How capable would you say your business is at Taking decisions on regulation and tax issues
Very poor, poor, average or no experience 21.0%
C1E How capable would you say your business is at Managing cashflow
Very poor, poor, average or no experience 12.5%
Market constraint
There were 10 questions determined as relating to market constraints (Table A.2). A score of 10 was therefore possible, but few businesses were so acutely constrained to record the higher scores. Matching four out of ten represented a good indication that the business was market constrained and using this definition 51 per cent of small businesses were considered to be market constrained (unweighted sample).
Table A.2 List of barriers for Market constraint
Questionnaire Number Qualifying criteria
Proportion of sample
qualifying B1AA Why have you decided not to grow your business over the next three years?
Not enough business/work available 4.3%
B1B Do you believe this business could grow if you wanted it to? No 5.2% D1B I am going to read you a list of issues, and for each I would like you to tell me which, if any, represent obstacles to your business growing.
Obtaining finance 24.0%
D1D I am going to read you a list of issues, and for each I would like you to tell me which, if any, represent obstacles to your business growing.
Taxation, VAT, PAYE, National Insurance, Business Rates 46.9%
D1F I am going to read you a list of issues, and for each I would like you to tell me which, if any, represent obstacles to your business growing. Regulations 49.8% D1H I am going to read you a list of issues, and for each I would like you to tell me which, if any, represent obstacles to your business growing.
Competition in the market 50.2%
I2 Compared to others in your industry, how would Scores of 6 or 38.9%
130
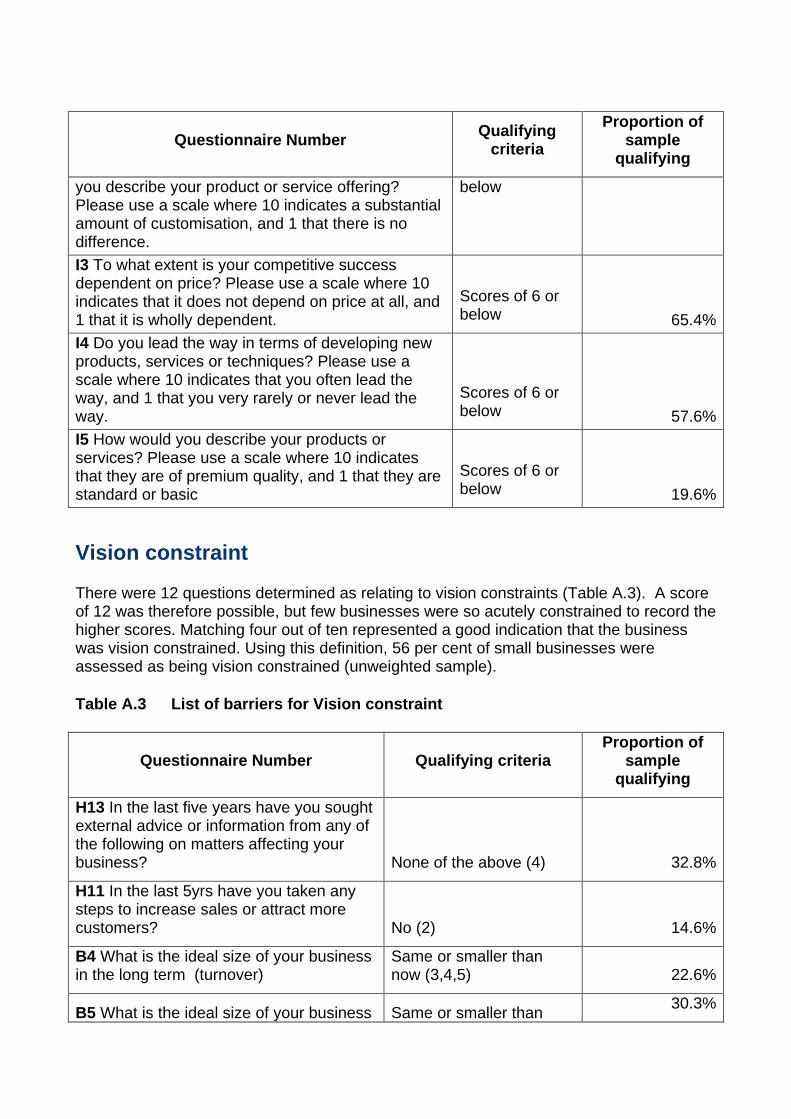
Questionnaire Number Qualifying criteria
Proportion of sample
qualifying you describe your product or service offering? Please use a scale where 10 indicates a substantial amount of customisation, and 1 that there is no difference.
below
I3 To what extent is your competitive success dependent on price? Please use a scale where 10 indicates that it does not depend on price at all, and 1 that it is wholly dependent.
Scores of 6 or below 65.4%
I4 Do you lead the way in terms of developing new products, services or techniques? Please use a scale where 10 indicates that you often lead the way, and 1 that you very rarely or never lead the way.
Scores of 6 or below 57.6%
I5 How would you describe your products or services? Please use a scale where 10 indicates that they are of premium quality, and 1 that they are standard or basic
Scores of 6 or below 19.6%
Vision constraint
There were 12 questions determined as relating to vision constraints (Table A.3). A score of 12 was therefore possible, but few businesses were so acutely constrained to record the higher scores. Matching four out of ten represented a good indication that the business was vision constrained. Using this definition, 56 per cent of small businesses were assessed as being vision constrained (unweighted sample).
Table A.3 List of barriers for Vision constraint
Questionnaire Number Qualifying criteria Proportion of sample
qualifying H13 In the last five years have you sought external advice or information from any of the following on matters affecting your business? None of the above (4) 32.8% H11 In the last 5yrs have you taken any steps to increase sales or attract more customers? No (2) 14.6% B4 What is the ideal size of your business in the long term (turnover)
Same or smaller than now (3,4,5) 22.6%
B5 What is the ideal size of your business Same or smaller than 30.3%

Questionnaire Number Qualifying criteria Proportion of sample
qualifying in the long term (employment) now (3,4,5) B1AB Why have you decided not to grow your business over the next three years?...Happy at this size Happy at this size (1) 10.7% B2 Do you plan to grow over the next three years (employment) (any %<20 or 'no') 47.1% B3 Do you plan to grow over the next three years (turnover) (any %<20 or 'no') 35.9% I1A Growing my business would be unnecessarily risky to its survival
Agree strongly, agree, neither agree nor disagree 32.6%
I1B Growing my business would be too costly
Agree strongly, agree, neither agree nor disagree 40.1%
I1DGrowth would mean I’d lose too much control of the business.
Agree strongly, agree, neither agree nor disagree 28.8%
I1E I am prepared to invest my own money to grow the business
Disagree strongly, disagree, neither agree nor disagree 46.1%
B6 On a scale of 1 to 10 (with 1 being not at all and 10 being very strongly), how strongly do you as an individual desire business growth now? Responses from 1-7 44.1% Table A.4Table A.4 shows the total number of barriers that businesses were subject to. Although the body of the report suggests that some were unconstrained, having not qualified for any of the three types, it was certainly not the case that they were not subject to any obstacles at all. The table shows that all but one of the businesses were subject to at least one or more obstacles. At the top end of the scale the most barriers that were recorded was 22. Overall the pattern of the frequency distribution is similar to the normal distribution, with low numbers towards the start and end, with higher numbers in the middle, the median number of barriers was 11.
132

Table A.4 Total number of barriers per business
Total barriers Frequency Cumulative frequency (%) 0 1 .2 1 3 .7 2 2 1.0 3 6 2.0 4 15 4.5 5 23 8.3 6 35 14.1 7 40 20.8 8 55 30.0 9 64 40.6 10 62 50.9 11 64 61.6 12 47 69.4 13 45 76.9 14 32 82.2 15 43 89.4 16 24 93.3 17 15 95.8 18 12 97.8 19 4 98.5 20 3 99.0 21 4 99.7 22 2 100.0

Appendix 5 Defining substantive ambition Substantive growth is a definition developed in the 2012 BIS study Growth ambitions amongst UK SMEs38. There are five qualifying questions to identify a business as having substantive ambition (shown below).
This report uses this same method of discriminating between businesses with substantive growth ambition (low ambition was not analysed for this report). The qualifying list of questions for growth ambition in our questionnaire (Appendix 1) corresponds with the list shown below: Q33 corresponds with B1; B3 corresponds with Q35 (turnover); B4 corresponds with Q13a and B6 corresponds with Q14a. We omit the question ‘Do you have an ambition to grow the business beyond a point where it is able to provide you with what you would consider to be a reasonable income?’ since it was thought that this was less relevant for small businesses.
Table A.5 Process for calculating substantive ambition
Characteristic Substantive ambition41
Low ambition (1)
Low ambition (2)
Q33 Do you intend to grow the organisation over the next three years?
Yes Any42 No
Q35 Do you plan to grow the organisation by at least 20% over the next three years in terms of turnover?
Yes Any No
Q13a From your personal perspective, what is the ideal size of your business in the long term (beyond the next three years) in terms of turnover?
Significantly larger than its
current size
Any No higher than ‘Slightly larger
than its current size’
Q14a How strongly as an individual do you desire business growth now? (rating scale 1 – 10)
10 1-5 inclusive 1-7 inclusive
Source: Business growth ambition amongst UK SMEs (TBR 2012)
41 NB Respondents must provide the relevant required answer to each question to be categorised as substantively ambitious. 42 The table entry "any" in this column reflects the fact that irrespective of a respondent's answer to these particular questions, they will still be categorised as 'low ambition' because they have rated themselves as five or lower on the scale of ambition out of ten.
134

© Crown copyright 2015 This publication is licensed under the terms of the Open Government Licence v3.0 except where otherwise stated. To view this licence, visit nationalarchives.gov.uk/doc/open-government-licence/version/3 or write to the Information Policy Team, The National Archives, Kew, London TW9 4DU, or email: [email protected]. Where we have identified any third party copyright information you will need to obtain permission from the copyright holders concerned. This publication available from www.gov.uk/bis Contacts us if you have any enquiries about this publication, including requests for alternative formats, at: Department for Business, Innovation and Skills 1 Victoria Street London SW1H 0ET Tel: 020 7215 5000 Email: [email protected] BIS/15/154