understanding the impact of … the impact of collaboration software on product design and...
TRANSCRIPT

UNDERSTANDING THE IMPACT OF COLLABORATION SOFTWARE ON PRODUCT DESIGN AND DEVELOPMENT
Rajiv D. Banker Fox School of Business
Temple University Philadelphia, PA 19122
Indranil R. Bardhan*
School of Management, SM 41 The University of Texas at Dallas
Richardson, TX 75083
Ozer Asdemir Krannert School of Management
Purdue University, West Lafayette, IN 47907 * Corresponding author, [email protected]
Comments on an earlier version from Vish Krishnan, Robert Zmud, Gregory Dess, Satish Nambisan, and participants at the Workshop on Information Systems and Economics (WISE) and referees for the Ninth Conference on Information Systems and Technology (CIST) are gratefully acknowledged. ______________________________________________________________________________
ABSTRACT
Prior research suggests that supply chain collaboration has enabled companies to compete more efficiently in a global economy. We investigate a class of collaboration software for product development called collaborative product commerce (CPC), and estimate its impact on product quality, design cycle time and development cost. We develop a theoretical framework to study the impact of CPC on product design and development. Based on data from CPC implementations in 72 firms, we test and empirically validate research hypotheses on the impact of CPC. We find that CPC implementation is associated with greater collaboration among product design teams which, in turn, have a significant positive impact on product quality and a reduction in cycle time and product development cost. Based on a subset of firms for which operational metrics were collected, we find that CPC is associated with substantial quantifiable improvements in product design quality, design turnaround times, and product development and rework costs.
Keywords: Collaborative Product Commerce, new product development, product design, information systems, collaboration software.

1
1.0 Introduction
The accelerating rate of technological change, coupled with growing demand for
customized products has dramatically reduced product life cycles. There is increasing reliance
on the use of information technology (IT) to manage the product development life cycle
(Krishnan and Ulrich, 2001; Nambisan, 2003). Collaborative Product Commerce (CPC) is a
relatively new, web-based technology used to streamline product design and development
processes that are not well structured or require significant manual intervention. CPC software
enables product design engineers to collaborate by facilitating the sharing of product data used in
the design, development and management of products (Welty and Becerra-Fernandez, 2001;
Carroll, 2001).1 Specific business processes that can be facilitated include product data
management, product design, product development cycle management, product introduction,
change request management, engineering change implementation, and strategic sourcing.
Little attention has been given to studying the impact of information systems on product
development. In a recent article, Krishnan and Ulrich (2001) concluded that “… the benefit of
new tools to manage product knowledge and support development decision making within the
extended enterprise needs to be explored in greater detail …” In this research, we develop a
conceptual framework to study the impact of CPC on the extent of collaboration between product
design teams involved in the development of new products. We draw on prior research in
software engineering, new product development and organizational science to better understand
the role of collaboration in product development and test our hypotheses regarding the impact of
CPC on product design and development. Using product design and development data collected
1 These systems have also been labeled product life-cycle management (PLM) systems, since they go beyond the realm of basic product data management and span other processes within the product development lifecycle to enable inter-organizational, cross-functional collaboration (O’Marah, 2001).

2
from a cross-sectional survey of 72 companies, we empirically test our hypotheses regarding
implementation of CPC software and its impact on product design and development.
We find that CPC has a significant impact on the level of collaboration among product
design teams. Furthermore, improvements in the frequency and intensity of collaboration leads
to improved performance, in terms of greater product design quality, lower design cycle time,
and reduced product development cost. We find that it is important to consider both direct and
indirect effects of CPC, since the impact of CPC on product quality, cycle time and cost, is
mediated through improvements in team collaboration. We validate our survey results using a
subset of firms from which we collected objective performance metrics. Our primary
contribution to the existing body of literature on collaboration is to: (a) develop a better
understanding of the role of IT in product design and development, and (b) empirically validate
the impact of collaboration software on product development with data from a cross-section of
companies across several industries.
2.0 Conceptual Foundations
In this section, we describe the role of CPC in product development, and draw on prior
research in product development and media richness theory to develop our research model.
2.1 Literature Review
Effective communication among product development teams is an important element of
research and development (R&D) performance (De Meyer, 1991). One of the most important
issues in improving R&D productivity is stimulating communication among virtual product
design teams (Nambisan, 2002; Loch and Terwiesch, 1998). Since product design engineers
often deal with unstable and volatile product design information and must communicate critical
parameters as they become known, collaboration among design teams is critical to mitigate the

3
impact of information uncertainty and reduce ambiguity related to imprecise product design data
(Sosa et al., 2002; Clark and Fujimoto, 1991; Hoegl and Gemuenden, 2001).
Most prior research in product development has focused primarily on the people and
process dimensions, while the role of information technology (IT) has generally been ignored.
Tushman (1977) showed that high levels of interactions and coordination between
interdependent groups are necessary to successfully complete complex tasks. The impact of
inter-team communication on project success has also been studied by Ancona and Caldwell
(1990, 1992) and summarized by Brown and Eisenhardt (1995) in their review on product
development. Recently, Hoegl et al., (2004) studied longitudinal data on 39 projects within a
single firm and showed that inter-team coordination and project commitment have a significant
positive impact on the performance of multi-team R&D projects. However, they did not
specifically investigate the role of IT in facilitating inter-team collaboration and their results are
primarily based on a small sample of projects within a single firm. Easley et al. (2003) explored
the role of a group communication system in a controlled university setting, and found that
collaborative system use has a positive impact on teamwork quality and performance. Terwiesch
et al., (2002) suggest that the role of the IT medium used for information exchange in product
development settings needs to be further examined.
We extend the current body of knowledge on collaboration systems by studying the role
of a specific class of IT in facilitating collaboration within a product development environment.
The nature of collaboration during product design and development ranges from face-to-face
meetings and electronic communications involving phone, fax and e-mail to the exchange of
formal design documents through shared databases and groupware. The frequency and intensity
of such interactions depends on several factors including missing product data, ease of access,
4
data definition, and identification and evaluation of alternative design tradeoffs (Davis et al.,
2001).2 In many firms, these interactions are not well structured, and the ability of design
engineers to collaborate effectively is impeded by the lack of a single platform and appropriate
standards to exchange product design data.
CPC comprises a class of software that facilitates management and communication of
product data generated during product design and development. CPC provides a multitude of
capabilities, including communication, visualization, calculation and simulation tools that enable
creation of new product knowledge (Yassine et al., 2004). CPC software enable design
engineers, product managers, and manufacturing engineers to collaborate across geographical
and inter-organizational boundaries to gather design requirements from disparate sources, share
product design information, conduct design iterations, verify and test product design and provide
the final hand-off to other departments such as production and marketing (Adler, 1995; McGrath
and Iansiti, 1998). Such systems support a broader range of design support and system-to-
system collaboration capabilities for real-time processing of structured and unstructured product
data (Nambisan, 2003; Baba and Nobeoka, 1998). The scope of CPC software includes several
processes which comprise the product development lifecycle as described in Table 1.3
While several articles have touted the perceived benefits of CPC and their impact on
product development processes (Carroll, 2001; Port, 2003; Mulani and Matchette, 2001), these
claims are based on anecdotal evidence and have not been supported by empirical research.4 We
2 Interactions between product design engineers are typically structured around engineering drawings, product specifications, design inputs and outputs, test reports, and engineering change orders (Liker et al., 1992). See Davis et al. (2001) for a schematic representation of the information flows between different entities involved in product development. 3 Heterogeneity among technologies used for product development is not an issue, since we controlled for heterogeneity in our questionnaire by defining the scope and functionality of the CPC software. 4 General Motors and Boeing represent well-cited success stories of design collaboration. GM’s system connects 11 of its 14 global design groups such that design work on a car built for the Brazilian market is split between Germany and Brazil. Such collaboration has shortened the design cycle time from 36 to 18 months (Mulani and Lee, 2001).
5
propose a theoretical framework to better understand how CPC software facilitates collaboration
during product development and empirically study its subsequent impact on the outcomes of
product development using real-world data.
2.2 Theoretical Framework
The need for intra- and inter-team collaboration during product development arises due to
task interdependencies and the volatility of information content during the design creation and
development process (Hoegl et al., 2004; Terwiesch et al., 2002). Task interdependencies refer
to the intensity and flow of information exchange between design teams and are dependent on
the complexity of the product architecture (Gerwin and Moffat, 1997). Product design projects
typically consist of several interdependent modules where the work of one team is dependent on
progress in other teams. Since different work streams need to be synchronized to meet project
schedules and budget constraints, effective collaboration is critical to mitigate the risks
emanating from poor coordination, which may lead to significant rework and project delays
(Joglekar et al., 2001; Loch and Terwiesch, 1998; Hoegl et al., 2004).
We draw on prior research on media richness theory and virtual teams to develop our
research framework and create a better understanding of the impact of collaboration software on
product design and development. Daft and Lengel (1986) argue that communication media
determine the richness of the information processed, and that media richness facilitates inter- and
intra-firm interactions. Media richness represents the capacity of communication media to
process information that can overcome diverse frames of reference, support communication
across multiple channels, and allow managers to coordinate inter- and intra-organizational
communications and reconcile any differences (Dennis and Kinney, 1998). DeSanctis and
Jackson (1994) and Maznevski and Chudoba (2000) showed that the benefits from using more

6
complex communications technologies increased as the tasks became more complex. Prior
research on business-to-business logistics suggests that rich media may be particularly important
where time to market is an important factor and multiple parties must conduct complex activities
in an integrated manner (Vickery et al., 2004).
Information rich media permit transmission of complex and/or tacit knowledge and
support extensive versus routine problem solutions (Yassine et al., 2004; Vickery et al., 2004).
Daft and Lengel (1986) argue that managers rely on rich information when there is high
uncertainty and where problems involve interfaces across organizational boundaries (Moenaert
and Souder, 1996). Hence, media richness is particularly relevant to product design and
development processes, which are characterized by high complexity and turbulence arising from
project interdependencies that result in product design changes, and new allocations and
interfaces (Hoegl et al., 2004; Hinds and Kiesler, 1995; Thomke and Reinertsen, 1998).
Electronic media such as CPC, which are primarily used for industrial product development
processes and applications, can be classified on the high end of the “media richness” spectrum
proposed by Daft and Lengel (1986) which relates information richness to the complexity of
organizational phenomena (Vickery et al., 2004, page 1109). Based on their field study with
third-party logistics companies, Vickery et al. (2004) argue that media rich communications have
a significant positive effect on customer relational performance since rich media have the
communication capabilities to strengthen customer-supplier relationships.
CPC software provides an information rich medium that supports product design
collaboration by facilitating synchronous communication across virtual product development
teams. For example, CPC-enabled collaboration facilitates efficient electronic storage, retrieval
and reuse of product designs and allow engineers to compress the overall product development

7
time by reducing latency. Improvements in product design quality arise from the ability to
share design ideas between team members electronically and support real-time version control,
which enables design engineers to track design defects efficiently and create design changes
faster and easily. Hence, the basic premise of CPC implementation is that improvement in
product design cycle time, cost and quality can be attained by greater collaboration among
product design teams. Figure 1 describes our research framework in terms of the relationships
between CPC and product development outcomes.
3.0 Research Hypotheses
We draw on prior research primarily from two streams of literature, product development
and media richness theory, to guide the development of our research hypotheses. A detailed
explanation of the hypothesized relationships follows.
3.1 Collaboration
Product development processes entail knowledge creation and information sharing across
organizational boundaries. Collaboration among product design teams typically entails sharing
of knowledge that exists in two forms, explicit and tacit (Nonaka, 1994; Yassine et al., 2004).
While explicit knowledge involves design data that can be easily codified, stored and transferred,
tacit knowledge is created through a design engineer’s experience such as the judgment involved
in making critical product design decisions (Nambisan, 2002).
In order to understand how information technologies, such as CPC, support collaboration,
it is necessary to develop an understanding of three types of processes involved in effective
knowledge creation and collaboration in virtual NPD environments: internalization,
externalization, and combination (Nonaka, 1994). CPC supports externalization, which involves
conversion of tacit to explicit knowledge transfer, by providing capabilities for electronic
8
blackboards and virtual meetings through online teamspaces/chat rooms, which enable design
engineers to share their insights into product designs and conduct design reviews electronically.
CPC also supports internalization, which involves explicit knowledge transfer, by allowing
design teams to share databases and re-use existing product designs in developing new products.
CPC software, which entails three-dimensional visualization and simulation capabilities, also
supports knowledge combination by facilitating integration of existing design data with tacit
knowledge gleaned from experienced design engineers (Nambisan, 2003).
CPC software influence the richness of information sharing within and across
geographically distributed product design teams by facilitating faster information transfer,
restructuring processes to eliminate redundancies, revising task interdependencies, and allowing
for concurrency between different tasks. Hence, we hypothesize that CPC implementation will
increase the level of collaboration between product design teams.
Hypothesis 1: CPC implementation is associated with an improvement in the level of
collaboration, controlling for the impact of process and product design maturity.
Organizations that exhibit higher levels of process maturity are more likely to adopt
standard practices to support product development integration strategies and use quantitative
targets to manage projects, mitigate risk, coordinate training, and manage key stakeholders
(Krishnan et al., 2000). These practices, in turn, facilitate greater collaboration between design
teams by enabling timely access to product design data. Hence, we control for the impact of
process maturity in studying the impact of CPC on collaboration.
We also control for the impact of product design maturity, as prior research suggests that
design maturity and product performance have a positive relationship since certain high-

9
performance goals may necessitate more complex product designs, such as more integrated
product architectures (Novak and Eppinger, 2001; Ulrich, 1995).
3.2 Product Quality
Product design collaboration typically entails intra-departmental interaction within
product design teams, as well as boundary spanning activities where teams interact with outside
groups and across departments which involve interface with other processes, such as marketing
and manufacturing. Such interactions are characterized by the need to synchronize
interdependent tasks and schedules, where teams that are responsible for different parts of a
product, coordinate their workflows and contribute to overall product integration (Hoegl et al.,
2001, 2004). Without effective collaboration, task interdependencies might lead to errors which
require design rework or other product changes.
New product development projects are typically characterized by concurrent
development wherein tasks are carried out in parallel and are dependent on preliminary
information from other tasks/modules. This frequently leads to substantial design changes and
rework which could consume upto 50% of engineering capacity and a third of the development
budget (Terwiesch et al., 2002). Clark and Fujimoto (1991) suggest that intensive collaboration
is a key driver of product development performance, since it allows design teams to release
preliminary information early, and lets downstream users coordinate future design iterations by
providing greater visibility into the change management process.
Design reworks occur if downstream users allocate resources and create designs based on
upstream design information that was not stable. Engineering change orders happen when
downstream design decisions are based on upstream design data that was not precise (Terwiesch
et al., 2002). The cost of downstream adjustments can be reduced by making downstream

10
decisions so flexible that future adjustments are less costly. By enabling both synchronous
(through shared databases, groupware) and asynchronous information exchange (through online
teamspaces, electronic blackboarding), CPC facilitates collaboration between upstream and
downstream users by providing greater visibility into the product data and design iteration
process. Hence, we hypothesize that by improving the content, timing and intensity of
information exchange, CPC will reduce the need for downstream product design adjustments
which, in turn, lead to better product quality.
Hypothesis 2: CPC usage is associated with greater improvements in product design quality.
3.3 Product Design Cycle Time
Product design cycle time is defined as the overall time elapsed from product
conceptualization until the final user acceptance of the product design. It is a function of the
cycle time required to complete the design (from initial product proposal to product design
verification and acceptance) as well as the time required to communicate design changes. CPC
shortens product design times by allowing design engineers to create final designs more quickly
by providing efficient storage and retrieval capabilities and automating predictable
computational procedures (Cordero, 1991). By facilitating design reuse, through the use of
shared databases and codification of tacit knowledge, CPC allows product design teams to
compress the design time through reuse of past designs (Adler, 1995; Baba and Nobeoka, 1998).
CPC-enabled collaboration also increases product data visibility and provides design
engineers with real-time access to the most recent designs, which enables them to evaluate new
designs and conduct design iterations rapidly. Design iterations shorten product development
times by providing engineers with intuition for the sensitivity of the product design to key design
parameters and the robustness of product designs (Eisenhardt and Tabrizi, 1995). Such design

11
iterations improve designers’ cognitive abilities to shift with new design data, which improves
design flexibility, and shortens product development times by improving the confidence of
development teams (Eisenhardt, 1989). Inter-team collaboration also has a positive impact on
their ability to adhere to project schedules (Hoegl et. al., 2004). Hence, we hypothesize that CPC
implementation is associated with a reduction in product design cycle time, after controlling for
the impact of product design maturity, product size, and process maturity.
Hypothesis 3: CPC implementation is associated with a reduction in product design cycle time.
3.4 Product Development Cost
We argue that CPC has an indirect impact on product development cost through its
impact on product design quality and design cycle time. CPC helps to reduce latency by
reducing the time spent waiting and searching for product information, reduces project durations
by enabling concurrent work, and facilitates tracking and monitoring of project schedules. By
reducing rework, eliminating non-value added tasks, and identifying functional gaps in product
design across multiple teams, CPC improves the overall design quality by reducing the number
of engineering defects. As described in Terwiesch et al., (2002), such early detection and
correction of design errors improves downstream manufacturing flexibility and reduces any
design adjustment costs later if the product information is unstable. Hence, CPC implementation
is associated with a significant reduction in overall product development costs through its impact
on product design quality and cycle time.
Hypothesis 4: CPC implementation is associated with a reduction in product design and
development costs.
We control for the impact of process and design maturity since prior research has shown
also showed that more mature project management practices are associated with higher product

12
quality and greater development productivity (Harter et al., 2000). The rationale behind this
perspective is that by adopting those practices which help to increase process capabilities,
product defects can be detected early in the design cycle which avoids rework to correct design
errors detected at later stages (Swanson et al., 1991; Terwiesch et al., 2002). We control for the
effect of product size to account for the possibility that two products designed, one before CPC
and another after CPC, may be significantly different in terms of the number of product
components and hence entail different collaboration requirements. Prior research in software
and product development has shown that product size is a significant predictor of the outcomes
of the development (Harter et al., 2000; Eisenhardt and Tabrizi, 1995).
Our conceptual research model and hypothesized relationships are shown in Figure 1.
4.0 Research Data
A cross-sectional survey methodology was employed for data collection. An initial
survey instrument was tested with respondents from thirty-six firms to verify whether
respondents were able to understand the survey questions, and to make appropriate adjustments
to the variables of interest based on the contextual nature of CPC usage in product development
organizations. The initial survey, which consisted of an eighteen-page questionnaire, was used
to collect a variety of qualitative and quantitative data on the usage of CPC software across the
product development lifecycle, the types of business processes which CPC software support, and
the business benefits associated with product development outcomes after CPC implementation.
The final survey questionnaire, as shown in Appendix A1, was mailed to product
development managers and/or executives at 122 companies which were identified with the help
of a consulting firm as being actively involved in new product design and development. We
believe that potential heterogeneity among technologies used for product development is not an

13
issue since we defined the scope and functionality of CPC software in our survey design. We
also ensured that respondents understood the types of software that typically fall under the
domain of CPC technologies by providing a few examples of vendor software in this category.5
A total of 72 companies responded with complete data to the entire questionnaire for an
overall response rate of 59%. Non-response bias was assessed by comparing the annual sales of
publicly traded, respondent firms to the annual sales of 45 non-respondent firms. A t-test
indicates that there does not exist a statistically significant difference between the two groups (t
= 0.71; p-value = 0.27). In addition, ten out of the fifty non-respondent firms, picked at random,
were contacted. We learned that product development managers at these firms were not able to
complete the survey to protect the confidentiality of their operations. Their responses mitigated
the concern that systemic factors might be a reason for non-response.
The profile of companies surveyed in this research is shown in Table 1.6 Panel A
provides the distribution of survey participants by industry, while Panel B provides a summary
of financial characteristics for a subset of publicly traded firms, for which data was reported in
Compustat, based on their annual sales, margin (i.e., net income / sales), assets, and research &
development (R&D) spending in the survey year. Fifty-seven firms had implemented CPC
software as the basic engine for collaboration involving product design, engineering, and end-to-
end coordination of the product development process. The remaining fifteen firms had not
implemented CPC software at the time of the survey. A large majority of the firms had
implemented CPC within the 12- to 24-month period prior to our survey. During preliminary
5 This step was necessary to ensure that there was no ambiguity in the definition of CPC and companies had a clear understanding of the types of software that comprised CPC for new product development. 6 Although our sample size is relatively small, it is comparable to other studies reported in the product development and software economics literature (Eisenhardt and Tabrizi, 1995; Hoegl et al., 2004; Gupta and Wilemon, 1990; Harter et al., 2000).
14
screening, we also ensured that project managers had a broad view of the project and could
provide data on the survey questions for variables that were measured at different points in time.
For companies which implemented the CPC software, managers were asked to identify
two typical products – one designed before the CPC solution was implemented and the other
designed after CPC implementation. We collected data for each survey question, before and
after implementation of CPC. Respondents were asked to provide their responses on a seven-
point Likert scale. For each variable, the difference between “before and after CPC
implementation” responses provides an estimate of the change (∆) in outcomes. For companies
which did not implement the CPC software, we asked managers to identify two typical products,
one that was designed a couple of years ago and another that was designed more recently.
A follow-up telephone conversation was conducted with a senior product development
executive from each respondent firm to verify the accuracy of the survey responses. These
conversations were recorded and provide in-depth details regarding the nature of the CPC
implementation, types of product development processes that were affected by the
implementation, and its impact on supplier- and customer-related initiatives. We mitigated the
effect of potential recall bias in survey responses by providing a specific context to the CPC
implementation and asking respondents to recall events related to CPC usage, specific software
modules that were implemented, and the business processes that were affected after CPC
implementation. For a subset of twenty-seven firms, we collected objective performance metrics
on the extent of product quality, cycle time, and cost improvements before and after
implementation of CPC. Changes in these operational metrics were compared to the survey data
to verify the accuracy of the survey responses.
15
4.1 Construct Measurement
We define the product quality construct using items adapted from Adler (1995) and
Terwiesch et al. (2002), where quality is described as a function of the number of product design
defects and engineering change orders (ECOs). Design defects represent errors in engineering
design when the product design is not compatible with technical or functional specifications.
Since product designs are often changed, after the product design specifications are sent to
manufacturing, ECOs are changes that manufacturing sends back to design to ensure
producibility (Adler, 1995). Hence, ECOs represent a common form of quality problem where
the organization coordinates the implementation of design changes as proposed by
manufacturing, marketing or customers directly.
The collaboration construct is measured as a function of three variables: the frequency of
interactions, the content of information exchange, and the openness to share product design
information during collaborative interactions. We draw upon early work by Aram and Morgan
(1976) who measure team collaboration based on the extent of problem solving though support
and integration and the extent of open and authentic communication. We adapted our item
definitions based on the nature of collaboration in information rich media, as reported in Hinds
and Kiesler (1995), Hoegl and Gemuenden (2001), Vickery et al., (2004), and Easley et al.,
(2003). Our indicators represent the intensity and relevance of collaborative exchanges between
product teams, which is necessary to examine the impact of an information-rich medium, such as
CPC, on the outcomes of product development.
Product design cycle time is measured as a function of the length of the design cycle and
the average time that it takes to communicate and turn around design changes related to product
design. The length of the design cycle is measured as the time from product initiation (phase 0

16
in Table 1) to the product design verification and manufacturing development phase (phase 4).
Similar measures to define product development cycle times have been reported in the literature
on product development (Eisenhardt and Tabrizi, 1995, Zirger and Harley, 1996; Griffin, 1997).
Product development cost is measured by two items: the cost of product design and
prototyping, and the cost of overall product development. We adapt this construct from prior
research on software development, where the total cost incurred in product development and
support is measured based on total effort expended (Krishnan et al., 2000). We also draw on
prior work on multi-team R&D projects where the product development budget is measured as a
two-item scale consisting of product development and prototype costs (Hoegl et al., 2004).
The design maturity construct is measured by three items: the degree of inter-
connectedness between product components, the extent of reuse of existing design features, and
the number of new design features in a typical product. The number of new design features or
functions quantifies the complexity and diversity of the set of needs a product delivers (Griffin,
1997). Our scale items were adapted from Novak and Eppinger’s (2001) and Griffin’s (1997)
research on product development.
We defined the process maturity construct based on the Capability Maturity Model–
Integrated Product Development (IPD) framework which was developed by the Software
Engineering Institute. Process maturity is measured as a function of four items: the integration
and concurrency of planning and design processes, quantitative targets for project and risk
management, standard practices to support product integration, and existence of standard
practices for work reviews. These indicators reflect a measure of the organization’s investments
in implementing best-in-class practices to improve process capabilities that support product
development (Harter and Slaughter, 2003; Mendelson, 2000).

17
4.2 Construct Validity and Reliability
Since our survey data are self-reported, we performed a Harmon’s one-factor test to
check for common methods bias. We first computed the difference scores (∆) between post-CPC
and pre-CPC values for all indicator variables (items). These difference scores were entered into
a single exploratory factor analyses (EFA) which showed the presence of six factors that account
for 77.4% of the variance in the data. The factor structures matched the ones which we
identified in our research model. The EFA analyses indicate that the explanatory and dependent
variables load on different constructs, which suggests that common methods bias is not evident
in the data (Podsakoff and Organ, 1986). Cronbach alpha values for our constructs range in
value from 0.68 to 0.87, which meets the test for internal consistency of our factors.
Descriptive statistics for our factors (as constructed from the difference scores), including
the mean, median, standard deviation and correlation matrix, are shown in Table 3. Next, we
performed a confirmatory factor analysis (CFA) on the difference scores to establish the
reliability of our proposed factors. All factor loadings were significant at the 1% level as shown
in Table 4. The composite reliability of a construct reflects the internal consistency of its
indicators (Werts et al., 1974) and it exceeds the recommended value of 0.7, for new scale
development, for all constructs except for ∆(Collaboration) and ∆(Design Maturity), where the
reliability was above the threshold of 0.6 (Nunnally and Bernstein, 1994).
Convergent and discriminant validity was established by measuring the degree of
agreement in responses to different survey items (Phillips and Bagozzi, 1986). The t-values for
all factor loadings were significant at the 1% level and confirm that our measures satisfy
convergent validity. To establish the discriminant validity of the constructs, we used a sequential
chi-square difference test which was significant at the 1% level for all construct pairs (Anderson

18
and Gerbing, 1988). We also calculated the average variance extracted (AVE), which is used to
asses the variance shared between a construct and its measurement items. The AVE values for
all factors, exceed the threshold of 0.5, and are greater than the inter-construct (off-diagonal)
correlations. These results provide an additional test for discriminant validity between our
constructs (Fornell and Larcker, 1981).
We computed our factors based on the multivariate mean values of the items which
comprise each factor. Multivariate means, which are based on the summated mean values of the
difference scores of items, offer the advantage of being replicable across samples (Rai et al.,
2006). It is the recommended approach when new measures are developed and transferability is
desired (Hair et al. 1995), and is an accepted approach when the items are internally consistent as
is true in our case (Rozeboom, 1979).
5.0 Analyses and Results
All model variables are expressed in the form of difference scores which measure the
change in observed values of our model variables, before and after CPC implementation. For
example, ∆(collaboration) is expressed as the mean difference score of the three items that
comprise the collaboration factor.
Difference scores for the other model variables were also constructed in a similar manner.
We note that our use of difference scores, based on variables that are measured on a Likert scale,
is a standard approach that is widely used in the biostatistics and medical literature where there
are not yet widely accepted objective measures of disease activity (Bajorski and Petkau, 1999;
Shapiro et al., 1998). In order to test whether there exists significant differences between the
CPC (treatment) and non-CPC (control) groups, we ran a Wilcoxon rank sum test on the
difference scores. The Wilcoxon rank sum statistic, expressed in Mann-Whitney form, was
19
statistically significant for all model factors at p<0.01, except for ∆(Process maturity) which was
significant at p<0.05. We also observe that ∆(product size) is not statistically significant. This
confirms that changes in the observed outcomes are not being driven by changes in product size.
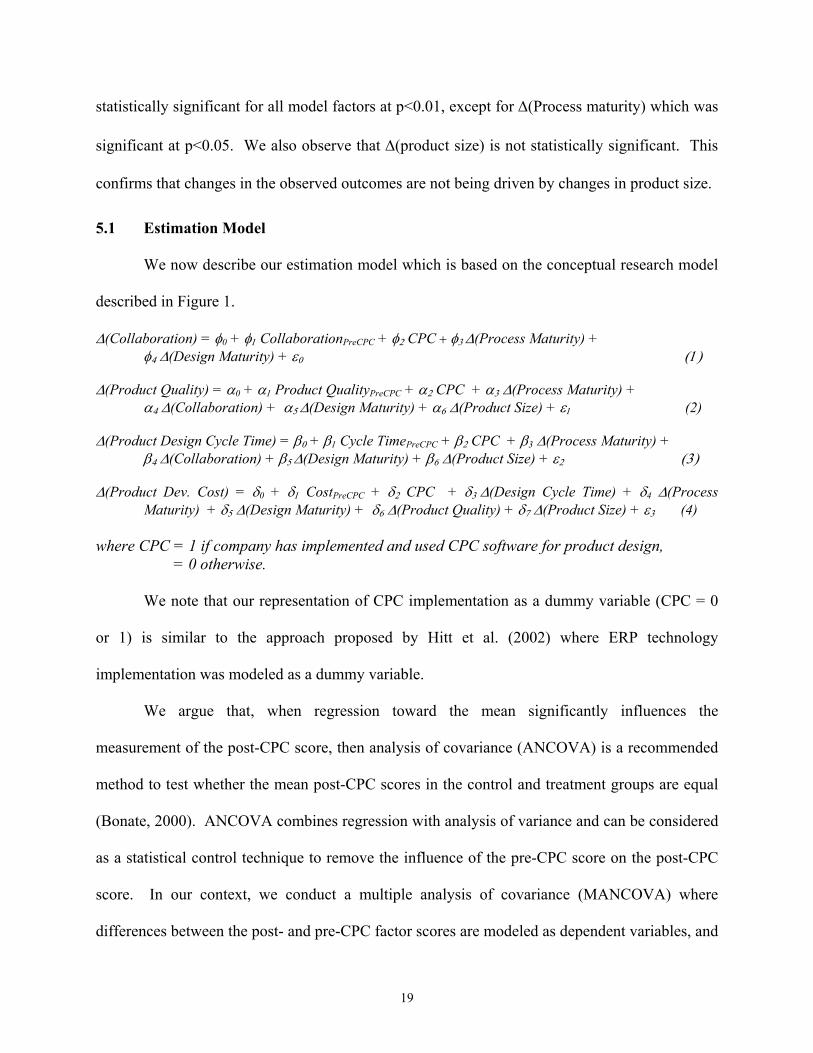
5.1 Estimation Model
We now describe our estimation model which is based on the conceptual research model
described in Figure 1.
∆(Collaboration) = φ0 + φ1 CollaborationPreCPC + φ2 CPC + φ3 ∆(Process Maturity) + φ4 ∆(Design Maturity) + ε0 (1)
∆(Product Quality) = α0 + α1 Product QualityPreCPC + α2 CPC + α3 ∆(Process Maturity) +
α4 ∆(Collaboration) + α5 ∆(Design Maturity) + α6 ∆(Product Size) + ε1 (2) ∆(Product Design Cycle Time) = β0 + β1 Cycle TimePreCPC + β2 CPC + β3 ∆(Process Maturity) +
β4 ∆(Collaboration) + β5 ∆(Design Maturity) + β6 ∆(Product Size) + ε2 (3) ∆(Product Dev. Cost) = δ0 + δ1 CostPreCPC + δ2 CPC + δ3 ∆(Design Cycle Time) + δ4 ∆(Process
Maturity) + δ5 ∆(Design Maturity) + δ6 ∆(Product Quality) + δ7 ∆(Product Size) + ε3 (4) where CPC = 1 if company has implemented and used CPC software for product design,
= 0 otherwise.
We note that our representation of CPC implementation as a dummy variable (CPC = 0
or 1) is similar to the approach proposed by Hitt et al. (2002) where ERP technology
implementation was modeled as a dummy variable.
We argue that, when regression toward the mean significantly influences the
measurement of the post-CPC score, then analysis of covariance (ANCOVA) is a recommended
method to test whether the mean post-CPC scores in the control and treatment groups are equal
(Bonate, 2000). ANCOVA combines regression with analysis of variance and can be considered
as a statistical control technique to remove the influence of the pre-CPC score on the post-CPC
score. In our context, we conduct a multiple analysis of covariance (MANCOVA) where
differences between the post- and pre-CPC factor scores are modeled as dependent variables, and
20
the independent variables are represented by the treatment factor (i.e., CPC) and the pre-CPC
score (covariate). In other words, we control for the effect of the pre-CPC score on the
difference scores (Shapiro et al., 1998; Hennig et al., 2003).7 The MANCOVA test reports a
significant multivariate main effect (p < 0.0001) for the effect of CPC on all outcome variables:
collaboration, product quality, product design cycle time, and cost.
Our system of equations in (2) thru (5) can be estimated efficiently using ordinary least
squares (OLS) if the errors across equations are uncorrelated.8 However, because each
observation in any equation is related to corresponding observations from the same company in
the other equations, the error terms in the regressions may be correlated. Therefore, for
consistent and efficient estimation, we estimated the system of equations using seemingly
unrelated regressions (SUR) that allows for correlation of disturbances across equations (Lahiri
and Schmidt, 1978; Greene, 1997).
In our research context, most factors represent reflective constructs based on the
definition offered by Jarvis (2003). It is possible, that collaboration and design maturity can be
construed as formative constructs based on the definition of the items that comprise these
constructs. We explored partial least squares (PLS) estimation, as an alternative estimation
approach, since PLS techniques allow us to model both formative and reflective constructs and
provide consistent estimates for small sample data. We present the results of our PLS
estimation, using the PLS procedures in SAS release 6.11, in Appendix A2, and discuss these
results in the next section.
7 We note that the estimation of the treatment effect is independent of using the post-CPC score or the difference score as the dependent variable. Both methods produce the same result (Laird, 1983). 8 Our use of ordinal data in OLS regressions is a statistical technique (Labovitz, 1970; Conover and Iman, 1981).
21
5.2 Collaboration
The estimated regression coefficients, in column (1) of Table 5, indicate that
implementation of CPC software has a positive impact on collaboration (φ2 = 1.16). We note that
the impact of CPC on ∆(Collaboration) is statistically significant, after controlling for the pre-
CPC value of ∆(Collaboration). Hence, our results supports hypothesis H1, and suggest that
CPC has enabled firms to realize significant improvements in the degree of team collaboration
during product design and development.
Our results indicate that process maturity has a significant impact (φ3 = 0.21) on the level
of collaboration between product design teams. This suggests that, organizations that have
implemented well-defined process management practices, are more likely to realize higher levels
of product design collaboration compared to those where the product development processes are
less mature. Our results also indicate that design maturity has a positive impact on the extent of
collaboration (φ4 = 0.16). Products that have a high degree of component inter-connectedness
and new design features are more likely to require greater collaboration, since they entail strong
task inter-dependencies and uncertainty of product design data.9 In other words, the need for
greater design collaboration is driven by task interdependencies inherent in product design data.
5.3 Product Quality
The results, shown in column (2) of Table 5, indicate that the direct impact of CPC on
product quality is not statistically significant (α2 = 0.10). We note, however, that improvements
in the level of collaboration after CPC implementation have a positive impact on product quality
(α4 = 0.31).
9 That is, task interdependencies are greater when product components are highly integrated (as opposed to being modular) and product design data changes rapidly over time as is the case with new product designs.
22
Since the impact of CPC on product design and development consists of both direct and
indirect (i.e., mediated) effects, we estimate the magnitude and significance of such indirect
effects as well. For instance, the indirect impact of CPC on product quality through its impact on
∆(Collaboration) in equation (2) is estimated as:
δ(∆Product Quality) = δ(∆Product Quality) * δ(∆Collaboration) δ(CPC) δ(∆Collaboration) δ(CPC)
= α4 * φ2 (5)
In other words, the marginal impact of CPC on ∆(collaboration) is represented by φ2,
while the marginal impact of ∆(collaboration) on ∆(product quality) is represented by α4. The
cross-product of these terms represents the indirect impact of CPC. The overall impact of CPC
is then estimated as the sum of the direct and indirect effects, as shown in Table 6 (row B). The
overall impact of CPC on ∆(Product quality) is statistically significant, and our results provide
support for hypothesis H2. In terms of practical implications, our results imply that collaboration
through CPC enables early detection of potential product design flaws which, in turn, prevents
quality errors further downstream that are typically costlier to correct (Harter et al. 2000;
Terwiesch et. al., 2002). These results are supported by analytical work developed by Thatcher
and Pingry (2004), and by anecdotal evidence which we collected during our interviews with
senior product development managers:
“CPC has reduced the number of reworks required. It’s allowed us to catch and correct errors before they are introduced. We’re reducing reworks, by not creating the bugs in the first place. There are three aspects of this that result in staff time reductions: the time spent reengineering the design, the time to pull the inventory and rework that, and the time in the field in product support if the change or error was significant …”
-- Manager, Hardware Engineering Services, High-tech Electronics Manufacturer
Our results also indicate that product design maturity has a positive impact on product
quality (α5 = 0.31). The result implies that product designs, which are mature in terms of inter-

23
connectedness between product components and design reuse, are more likely to lead to
improvements in product quality. We also find that product size has a negative impact on
product quality, although its impact is significant at p < 0.10. This implies that, ceteris paribus,
larger products, which entail a higher number of design components, are likely to realize smaller
improvements in product quality.
5.4 Product Design Cycle Time
The results, shown in column (3) of Table 5, indicate that the direct impact of CPC on
product design cycle time is negative and statistically significant (β2 = -0.60). Our results also
indicate that the change in the level of collaboration, after implementation of CPC, is associated
with a reduction in product design cycle time (β4 = -0.11). We estimate the indirect (mediated)
impact of CPC on product design cycle time as β4 * φ2. While the indirect impact is negative but
not statistically significant, as shown in Table 6, our results imply that CPC leads to an overall
reduction in product design cycle time.
Our results support hypothesis H3 and imply that, by enabling product design teams to
improve the extent of product design collaboration, CPC allows engineers to communicate
design changes faster by requiring fewer iterations and is associated with a significant reduction
in the product design cycle time. Our observations are also supported by anecdotal evidence
collected during the course of our interviews:
“The CPC software has reduced cycle time to find the product data dramatically. It has also forced us to improve the quality of our data … CPC has reduced product design management time for some tasks by a factor of 60. For example, processing an engineering change order used to take 60 days, now we can do it in a day. On the low end of reduction of cycle time, it has reduced it by about 10 to one …” Director of Product Lifecycle Management, Fortune 500 Industrial Products Conglomerate
We also find that process maturity and product design maturity have a significant impact
on reduction in product design cycle time, as indicated by their negative regression coefficients

24
in column (3) of Table 5. In other words, products that are characterized by greater design reuse
and integrated product architectures are more likely to realize significant reductions in product
design cycle times ceteris paribus. Our results suggest that process maturity has a significant
impact in reducing product design cycle times. We also observe that larger products are
associated with longer product design cycle times since they are more likely to consist of a larger
number of design components which entail more complicated designs.
5.5 Product Development Cost
Analyses of the regression results, in column (4) of Table 5, indicate that CPC has a
direct significant impact on reduction in product development costs (δ2 = -0.56). We observe
that CPC also an indirect effect on product development costs through its impact on ∆(Product
quality) and ∆(Design cycle time). We note, for instance, that improvements in product design
quality are associated with a significant reduction in product development costs (δ6 = -0.34).
Similarly, a positive regression coefficient for ∆(Design cycle time) indicates that increases in
product design cycle times lead to higher product development cost. These results are consistent
with prior research in the product development literature.
The indirect impact of CPC on ∆(product development cost) is estimated as the sum of its
marginal impact on product quality and design cycle time. Hence, we have
δ(∆Product Dev. Cost) = δ(∆Product Dev. Cost) * δ(∆Product Quality) + δ(CPC) δ(∆Product Quality) δ(CPC)
δ(∆Product Dev. Cost) * δ(∆Design Cycle Time) δ(∆Design Cycle Time) δ(CPC)
= δ6 * [α2 + α4 * Φ2 ] + δ3 * [β2 + β4 * Φ2 ] (6) We observe that the indirect impact of CPC on ∆(Product Dev. cost), as reported in row
D of Table 6, is significant at the 1% level. The overall impact of CPC on product development
25
cost is also significant and is primarily caused by the improvement in product quality enabled
through CPC. Hence, our results support hypothesis H4 and we provide empirical evidence to
validate the analytical models in Thatcher and Pingry (2004) who argue that IT tools lower the
fixed cost of product development.
Our regression results also indicate that improvements in process maturity lead to lower
product development costs (δ4 = -0.23). Taking our earlier results into consideration, this
indicates that investments in creating mature design processes are associated with higher product
development costs, which may be offset by improvements in product quality. These results are
consistent with prior research in software development, as reported by Harter et al. (2000).
We checked for the possibility that unobserved variation in collaboration may be
correlated with product quality and design cycle time. We used an instrumental variables
approach described by Hausman (1983). Using ∆(Product size) as an instrumental variable, we
estimated the residuals as the difference between the observed and predicted values of
∆(collaboration) in equation (1). In the second stage, we used the estimated residuals as
independent variables in (2) and (3) and estimated their coefficients. The coefficients of the
residuals are not statistically significant. Our results indicate that correlations between
unobserved factors that influence collaboration and product quality and cycle time are not
significant, and confirm that the SUR model provides consistent and efficient estimates.
Our PLS estimation results, shown in Appendix A2, are consistent with the SUR
estimates. We note that CPC has a significant impact on the extent of collaboration, and on
improvement in product quality, design cycle time, and development cost. The path analysis
also indicates that the impact of CPC on product development performance is partially mediated
through its impact on collaboration. Hence, PLS estimation supports all four hypotheses.

26
6.0 Implications for Practice
As part of our research, we interviewed product development managers to collect
objective performance metrics on the extent of change in product development outcomes after
implementation of the CPC software. For a subset of 27 firms, we probed respondents on how
CPC had changed their product development processes, how it had affected staff time and costs
in product data and design management, and their ability to interact and share product
information with customers and partners. We collected data on several quality, cost and cycle
time metrics including number of product errors, approximate average cost per product error,
number of reworks, average cost per design rework, number of engineering change orders
(ECOs) and average turnaround time per ECO.
In Table 7, we have provided an illustrative example of the reported changes in product
development metrics for firms in four industries: telecommunications, industrial machinery,
automotive, and high-tech electronics manufacturing. For example, a large telecom equipment
manufacturer reported an approximately 50% reduction in the number of product errors and the
average cost per product error, as well as a decrease in the average turnaround time per ECO
from 8 to 4 days. A large Tier 1 supplier to the Big 3 US automotive companies reported that the
number of product errors dropped, from ten (per product) before CPC, to three after CPC. The
cost per product error incurred a substantial reduction falling from $50,000 to $45,000, while the
number of ECOs dropped in half from twenty (per product) before CPC to ten after CPC.
Since industry clock speed dictates the frequency of new product introduction and drives
product innovation (Mendelson, 2000), it is possible that different types of industries may realize
different levels of improvement from CPC implementation. Since our survey does not measure
industry clockspeed, we classified sixteen firms from the high-tech / electronics manufacturing,
27
medical devices, and retail industries into the high clockspeed category based on our analyses of
the literature (Mendelson and Pillai, 1999). We used a dummy variable to classify high- and
low-clockspeed firms in our regression model. However, our preliminary analysis indicates that
industry clockspeed does not have a significant impact on product development performance.
7.0 Discussion and Conclusions
The development of new information technologies is revolutionizing new product
development and our research represents one of the first studies in an emerging field to study the
impact of collaboration software on product design and development. We studied the impact of
collaboration software on the product development lifecycle, using data collected from CPC
implementations in 72 companies. We found that implementation of information-rich media,
such as CPC, is associated with a significant increase in the extent of product design
collaboration. CPC-enabled collaboration also has a significant impact on reduction in design
cycle times and improvement in design quality. While CPC does not have a direct impact on
product development cost, its indirect impact is significant and suggest that managers should not
ignore these mediated effects in their evaluation of the productivity impact of CPC. Based on
financial data for a subset of public companies in our sample, we found high performance firms
are no more likely to implement CPC as compared to the low performers.
Our results also indicate that variables such as product size, design maturity, and process
maturity play important roles in terms of their impact on product development. Higher levels of
process maturity lead to greater collaboration among product design teams, and reduction in
product design cycle time and development costs. Product design maturity also has a significant
impact on increase in product quality and reduction in design cycle time. However, more mature

28
product designs are likely to be associated with an increase in product development costs. These
results are consistent with prior research in software and product development.
From a theory development perspective, our results suggest that media richness is an
important factor in enabling team collaboration in product design and development.
Information-rich media, such as CPC, facilitate intra- and inter-team, cross-functional,
collaboration by providing both synchronous and asynchronous collaboration capabilities. These
capabilities enable design teams to reduce or eliminate latency, and improve their design
iteration processes so that design quality problems are detected much earlier in the design
lifecycle. We observe that collaboration mediates the impact of CPC on product quality. These
improvements, in turn, lead to significant reductions in design cycle times and development
costs. Hence, we contribute to the emerging literature on the role of IT in product development
by proposing and validating a framework to study the impact of IT in product development
organizations; an area that has been identified as fertile for inter-disciplinary IS research
applications (Nambisan, 2003). Our research represents an initial attempt to (a) link the
operational impact of CPC to process-level metrics, and (b) validate the survey responses
through an objective data collection effort aimed at studying the impact of CPC on outcomes of
the product development process.
7.1 Limitations and Future Research
Our study opens the door for future research to explore several new possibilities. Future
research will entail field studies with the objective of closely observing product development
projects over time, where we can study the influence of project-specific factors on project
outcomes, examine the extent of IT usage in different stages, and observe how the intensity of
collaboration changes over time. One limitation of our study was that CPC was measured as a
29
binary variable in terms of its implementation. Future research will include field studies to
measure the extent of CPC system usage through system logs and other archival records. This
would serve to alleviate potential concerns regarding the extent of CPC usage.
Future research may include collection of a larger data sample, across a broad spectrum
of industries, to empirically estimate the impact of CPC on operational and firm financial
performance and to test industry-specific effects. Another possibility includes identifying the
critical success factors for CPC implementation and the role of organizational characteristics,
such as team size, in moderating the impact of CPC on product development. It is also important
to develop a better understanding of the role of collaboration software across different phases of
product development and study whether CPC-enabled collaboration in earlier phases results in
better product performance compared to later phases. Another avenue for exploration is to study
the time between CPC implementation and usage of CPC for product development, and how this
time lag may impact the benefits of CPC implementation.
REFERENCES
Adler, P.S, 1995. Interdepartmental interdependence and coordination: The case of the design / manufacturing interface. Organization Science. 6(2), 147-167.
Ancona, D.G., D.F. Caldwell, 1990. Information technology and work groups: the case of new product teams. J. Galegher, R. Kraut, C. Egido, eds. Intellectual Teamwork: Social and Technological Foundations of Cooperative Work. Lawrence Erlbaum Associates, Hillsdale, NJ, 173-190.
Ancona, D.G., D.F. Caldwell, 1992. Bridging the boundary: External activity and performance in organizational teams. Administrative Science Quarterly. 37, 634-665.
Anderson, J.C, D.W. Gerbing. 1988. Structural equation modeling in practice: A review and recommended two-step approach. Psychological Bulletin. Vol. 103, 411-423.
Aram, J.D., C.P. Morgan. 1976. The role of project team collaboration in R&D performance. Management Science. 22(10), 1127-1137.
Baba, Y., K. Nobeoka. 1998. Toward knowledge-based product development: The 3-D CAD model of knowledge creation. Research Policy. 26, 643-659.
Bajorski, P., J. Petkau. 1999. Nonparametric two-sample comparisons of changes on ordinal responses. Journal of the American Statistical Association. 94(447), Theory and Methods, 970-978.
Bonate, P. 2000. Analysis of pretest-posttest designs. Chapman & Hall / CRC Press, Boca Raton, FL. Brown, S., K.M. Eisenhardt. 1995. Product development: Past research, present findings and future
directions. Academy of Management Review. 20(2), 343-378.

30
Carroll, M. July 2001. Collaborative commerce: The next big thing in global manufacturing. eAI Journal. 20-24.
Clark, K.B., T. Fujimoto. 1991. Product development performance: Strategy, organization and management in the world auto industry. Harvard Business School Press, Boston, MA
Conover, W.J., R.L. Iman. 1981. Rank transformations as a bridge between parametric and nonparametric statistics. The American Statistician. 35(3), 124-129.
Cordero, R., 1991. Managing for speed to avoid product obsolescence: A survey of techniques. Journal of Product Innovation Management. 8, 283-294.
Daft, R.L., R.H. Lengel. 1986. Organizational information requirements, media richness, and structural design. Management Science. 32(5), 554-571.
Davis, J., E. Subramanian, S. Konda, H. Granger, M. Collins, A. Westerberg. 2001. Creating shared information spaces to support collaborative design work. Information Systems Frontiers. 3(3), 377-392.
Dennis, A.R., S.T. Kinney. 1998. Testing media richness theory in the new media: The effects of cues, feedback, and task equivocality. Information Systems Research. 9(3), 256-274.
DeSanctis, G., B.M. Jackson. 1994. Coordination of information technology management: Team-based structures and computer-based communication systems. Journal of Management Information Systems. 10(4), 85-110.
De Meyer, A. Spring 1991. Tech talk: How managers are stimulating global R&D communication. Sloan Management Review, 49-58.
Easley, R.F., S. Devaraj, M. Crant. 2003, Relating collaborative technology use to teamwork quality and performance: An empirical analysis. Journal of Management Information Systems. 19(4), 247-268.
Eisenhardt, K.M., 1989. Building theories from case study research. Academy of Management Review. 14(4), 532-550.
Eisenhardt, K.M., B. Tabrizi. 1995. Accelerating adaptive processes: Product innovation in the global computer industry. Administrative Science Quarterly. 40, 84-110.
Fornell, C., and D. Larcker, “Evaluating Structural Equation Models with Unobservable Variables and Measurement Errors,” Journal of Marketing Research (18:1), 1981, pp. 39-50.
Gerwin, D., L. Moffat, 1997. Authorizing processes changing team autonomy during new product development. Journal of Engineering Technology Management. 14, 291-313.
Greene, W., 1997. Econometric Analysis. 3rd edition, MacMillan Publishing Company, New York, NY. Griffin, A., 1997, The effect of project and process characteristics on product development cycle time.
Journal of Marketing Research, XXXIV, 24-35. Gupta, R., D. Wilemon. 1990. Accelerating the development of technology-based new products.
California Management Review. 32(2), 24-44. Hair, J., R. Anderson, R. Tatham, and W. Black, Mutivariate Data Analysis, 5th edition, 1998, Prentice
Hall, Upper Saddle River, NJ. Harter, D.E., M.S. Krishnan, S. Slaughter. 2000. Effects of process maturity on quality, cycle time, and
effort in software product development. Management Science. 46(4), 451-466. Harter, D.E., S. Slaughter. 2003. Quality improvement and infrastructure activity costs in software
development: A longitudinal analysis. Management Science. 49(6), 84-800. Hausman, J. 1983. Specification and estimation of simultaneous equation models. Z. Griliches and M.
Intriligator, ed. Handbook of Econometrics, 1, North Holland Pub., New York, 403-426. Hennig, C., D. Mullensiefen, J. Bargmann. 2003. Comaprison of changes in a pretest-posttest design with
Likert scales. Research Report No. 113. Eidgenossische Technische Hoschschule, Zurich, Switzerland.
Hinds, P., S. Kiesler. 1995. Communication across boundaries: Work, structure, and use of communication technologies in a large organization. Organization Science. 6(4), 373-393.
Hitt, L.M., D.J. Wu, X. Zhou. Investment in enterprise resource planning: Business impact and productivity measures. Journal of Management Information Systems. Summer 2002. 19(1), 71-98.
31
Hoegl, M.M., H.G. Gemuenden. 2001. Teamwork quality and the success of innovative projects: A theoretical concept and empirical evidence. Organization Science. 12(4), 435-449.
Hoegl, M.M., K. Weinkauf, H.G. Gemuenden. 2004. Interteam coordination, project commitment, and teamwork in multiteam R&D projects: A longitudinal study. Organization Science. 15(1), 38-55.
Jarvis, C.B., S.B. Mackenzie, P.M. Podsakoff. 2003. A critical review of construct indicators and measurement model misspecification in marketing and consumer research. Journal of Consumer Research. 30(2), 199-218.
Joglekar, N., A.A. Yassine, S.D. Eppinger, D.E. Whitney. 2001. Performance of coupled product development activities with a deadline. Management Science. 47(12), 1605-1620.
Krishnan, M.S., C. Kriebel, S. Kekre, T. Mukhopadhyay. 2000. An empirical analysis of productivity and quality in software products. Management Science. 46(6), 745-759.
Krishnan, V., K. Ulrich. 2001. Product development decisions: A review of the literature. Management Science. 47(1), 1-21.
Labovitz, S., 1970. The assignment of numbers to rank order categories. American Sociological Review. 35(2), 515-524.
Lahiri, K., P. Schmidt. 1978. On the estimation of triangular structural systems Econometrica. (46), 1217-1221.
Laird, N. 1983. Further comparative analyses of pretest-posttest research designs. American Statistician. 37, 329.
Liker, J.K., M. Fleischer, D. Arnsdorf. 1992. Fulfilling the promised of CAD. Sloan Management Review. Spring 1992, 74-86.
Loch, C., C. Terwiesch. 1998. Communication and uncertainty in concurrent engineering. Management Science. 44(8), 1032-1048.
Maznevski, M.L., K.L. Chudoba. 2000. Bridging space over time: Global virtual team dynamics and effectiveness. Organization Science. 11(5), 473-492.
McGrath, M., M. Iansiti. 1998. Envisioning IT-enabled innovation. Insight Magazine. 2-10. Mendelson, H., Organizational architecture and success in the information technology industry.
Management Science. (46:4), 2000, 513-529. Mendelson, H., R.R. Pillai. 1998. Clock-speed and informational response: Evidence from the
information technology industry. Information Systems Research. 9(4), 415-433. Moenaert, R.K., W.E. Souder. 1996. 1996. Context and antecedents of information utility at the R&D /
Marketing interface. Management Science. 42(11), 1592-1610. Mulani, N., J. Matchette. 2001. Lifecycle collaboration: Linking strategy and execution to sustain
superior performance. Achieving Supply Chain Excellence through Technology. 4, 206-208. Montgomery Research, San Francisco, CA.
Mulani, N., H. Lee. 2001. New business models for supply chain excellence. Achieving Supply Chain Excellence through Technology. 4, 206-208. Montgomery Research, San Francisco, CA
Nambisan, S. 2002. Designing virtual customer environments for new product development: Toward a theory. Academy of Management Review. 27(3), 392-413.
Nambisan, S. 2003. Information systems as a reference discipline for new product development. MIS Quarterly. 27(1), 1-18.
Nambisan, S., D. Wilemon. 2000. Software development and new product development. IEEE Transactions on Engineering Management. 47(2), 211-220.
Nonaka, I., 1994. Dynamic theory of organizational knowledge creation. Organization Science. 5(1), 14-37. Novak, S., S. Eppinger. 2001. Sourcing by design: Product complexity and the supply chain. Management
Science. 47(1), 189-204. Nunnally, J.C., I. H. Bernstein. 1994. Psychometric Theory, McGraw Hill, NY. O’Marah, K. 2001. Make to Desire: How new technologies are revolutionizing lifecycle management in
Achieving Supply Chain Excellence through Technology. Montgomery Research, San Francisco, CA. Phillips, L., R. Bagozzi. 1986. Assessing measurement error in key informant reports: A methodological
note on organizational analysis in marketing. Journal of Marketing Research. 18, 395-415.

32
Podsakoff, P.M., D.W. Organ. 1986. Self-reports in organizational research: Problems and prospects. Journal of Management. 12(4), pp. 531-544.
Port, O. 2003. Design tools move into the fast lane: New software turns ideas into reality in record time. BusinessWeek (June 2) 84B.
Rai, A., Patnayakuni, N. and Patnayakuni, R. 2006. Firm performance impacts of digitally-enabled supply chain integration capabilities. MIS Quarterly. Volume 30 (forthcoming).
Rozeboom, W.W. 1979. Sensitivity of a linear composite predictor items to differential item weighting. Psychometrica. 44(3), 289-296.
Shapiro, S.L., G.E. Schwartz, G. Bonner. 1998. Effects of mindfulness-based stress reduction on medical and pre-medical students. Journal of Behavioral Medicine. 21(6). 581-598. Sosa, M.E., S. Eppinger, M. Pich, D. McKendrick, S. Stout. 2002. Factors that influence technical
communication in distributed product development: An empirical study in the telecommunications industry. IEEE Transactions on Engineering Management. 49(1), 45-58.
Swanson, K., D. McComb, J. Smith, D. McCubbrey. 1991. The application software factory: Applying total quality techniques to systems development. MIS Quarterly. 5(4), 566-580.
Terwiesch, T., C. Loch, A. De Meyer. 2002. Exchanging preliminary information in concurrent engineering. Organization Science. 13(4), 402-419.
Thatcher, M.E., D. Pingry, 2004. An economic model of product quality and IT value. Information Systems Research. 15(3), 268-286.
Thomke, S., D. Reinertsen. 1998. Agile product development: Managing development flexibility in uncertain environments. California Management Review. 41(1), 8-30.
Tushman, M.L. 1977, Special boundary roles in the innovation process. Administrative Science Quarterly, 22, 587-605.
Ulrich, K. 1995. The role of product architecture in the manufacturing firm. Research Policy. 24, 419-440.
Vickery, S., C. Droge, T.P. Stank, T.J. Goldsby, R.E. Markland. 2004. The performance implications of media richness in a business-to-business service environment: Direct versus indirect effects. Management Science. 50(8), 1106-1119.
Welty, B., I. Becerra-Fernandez. 2001. Managing trust and commitment in collaborative supply chain relationships. Communications of the ACM. 44(6), 67-73.
Werts, C, R. Linn, K. Joreskog. 1974. Interclass reliability estimates: Testing structural assumptions. Educational and Psychological Measurement. 34(1), 25-33.
Yassine, A., K.C. Kim, T. Roemer, M. Holweg. 2004. Investigating the role of IT in customized product design. Production Planning and Control. 15(4), 422-434.
Zirger, B.J., J.L. Hartley. 1996. The effect of acceleration techniques on product development time. IEEE Transactions on Engineering Management. 43(2), 143-152.

33
Table 1: Product Design and Development Process
Phase 0 Phase 1 Phase 2 Phase 3 Phase 4 Phase 5
Product Concept & Initiation
Product Development Proposal
Research & Development
Product Development & Manufacturing Design
Product Design Verification & Manufacturing Development
Pilot Production & Product Introduction
Concept Document
Project Plan
Concept Review
Prototype Verification Tests
Design Outputs
Marketing Plan Implementation
Product Requirements
Design Inputs
Preliminary Bill of Materials (BOM)
Customer Approval of Prototype
Design Verification Testing
Quality Control System Evaluation
Product Strategy
Preliminary Supplier Selection
Certified Design
Production Material on Order
Preliminary Process Capability Study
Preliminary. Product Specifications
Prelim. Manufacturing Process Plan
Final BOM
Operator Instruction
End of Line Audit
Preliminary Test Plan
Final Engineering Test Plan
Manufacturing Plans
Pilot Run Production Process
Preventive Maintenance Plan
Prototype Control Plan
Manufacturing Process Plans
Production Verification & Validation Testing
Customer Approval of Pilot Samples
Tasks / Activities
Final Product Specification
Capital Approval

34
Figure 1: Conceptual Research Model
Table 2: Profile of Study Participants by Industry and Firm Characteristics
Panel A (Study sample)
Industrial Category Number of Respondents % of Respondents
Industrial Products 29 40.2%
Automotive 20 27.8%
Aerospace and Defense 7 9.7%
Hi-tech / Electronics 9 12.5%
Other (Medical, Retail) 7 9.7%
Total 72
Panel B (Characteristics of publicly-traded firms in our survey)
Variable N Mean Std Dev Median
Sales ($, MM) 36 18,972 28,983 8,930
Margin (%) 35 33.80 17.47 28.71
Assets ($, MM) 36 35,613 96,190 10,081
R&D Spend ($, MM) 32 678.59 951.90 285.00
Product Quality
Product Design Cycle Time
CPC(+)
ProductDevelopment
Cost
• Product Design Maturity
• Process Maturity
(-)
(+)
(-)
Product Size
Product Size
Product SizeCollaborationH1
H2
H3
H4
Product Quality
Product Design Cycle Time
CPC(+)
ProductDevelopment
Cost
• Product Design Maturity
• Process Maturity
(-)
(+)
(-)
Product Size
Product Size
Product SizeCollaborationH1
H2
H3
H4

35
Table 3: Descriptive Statistics and Correlations
Construct ∆(Product Quality)
∆(Product Dev. Cost)
∆(Product Design cycle time)
∆(Collabor-ation)
∆(Design Maturity)
∆(Process Maturity)
∆(Product Size)
∆(Product Quality)
1.00
∆(Product Dev. Cost)
-0.594 (< 0.0001)
1.00
∆(Product Design cycle time)
-0.521 (< 0.0001)
0.649 (< 0.0001)
1.00
∆(Collaboration) 0.525 (< 0.0001)
-0.459 (< 0.0001)
-0.524 (< 0.0001)
1.00
∆(Design Maturity)
0.533 (< 0.0001)
-0.365 ( 0.002)
-0.544 (< 0.0001)
0.343 (0.003)
1.00
∆(Process Maturity)
0.494 (< 0.0001)
-0.582 (< 0.0001)
-0.529 (< 0.0001)
0.437 (< 0.0001)
0.399 (0.0006)
1.00
∆(Product Size) -0.128 (0.28)
-0.041 (0.74)
0.044 (0.72)
-0.181 (0.13)
0.183 (0.13)
-0.016 (0.90)
1.00
Mean 0.89 -1.04 -1.54 1.34 0.75 1.11 0.22
Median 0.50 -1.00 -1.50 1.00 0.67 0.75 0
Std. Deviation 1.12 1.14 1.45 1.22 1.05 1.20 1.17
p-values are shown in parentheses
Table 4: Confirmatory Factor Analyses Construct Indicator Standardized
Loading t-statistic Composite Reliability
Avg. Variance Extracted (AVE)
Q1 0.898 8.77 ∆(Quality)
Q2 0.780 7.30 0.83 0.84
Q3 0.747 6.89 ∆(Cost)
Q4 0.841 7.99 0.77 0.80
Q5 0.801 7.37 ∆(Cycle Time)
Q6 0.771 7.05 0.76 0.79
Q7 0.736 6.27 Q8 0.812 6.98 ∆(Collaboration) Q9 0.428 2.83
0.69 0.66
Q11 0.694 5.73 Q12 0.672 5.52 ∆(Design
Maturity) Q13 0.558 4.45
0.68 0.64
Q14 0.672 6.16 Q15 0.707 6.59
Q16 0.920 9.74 ∆(Process Maturity)
Q17 0.862 8.78
0.87 0.80
CFA Fit Statistics: AGFI = 0.88; CFI = 0.94; RMSEA = 0.06; Chi-square/df = 1.278. All indicator loadings are statistically significant at p < 0.01.

36
Table 5: Estimation Model Results
Dependent Variables
Independent Variable ∆(Collaboration)
(1)
∆(Product Quality)
(2)
∆(Product Design Cycle Time)
(3)
∆(Product Development Cost)
(4)
Intercept 2.04*** (<.0001)
2.31*** (<.0001)
3.75*** (<.0001)
2.71*** (<.0001)
Pre-CPC score -0.59*** (<.0001)
-0.55*** (<.0001)
-0.85*** (<.0001)
-0.56*** (<.0001)
CPC 1.16*** (0.0004)
0.10 (0.6787)
-0.60** (0.0168)
-0.56** (0.0212)
∆(Process Maturity) 0.21* (0.0512)
0.02 (0.8148)
-0.18** (0.0312)
-0.23*** (0.0049)
∆(Collaboration) - 0.31*** (0.0002)
-0.11 (0.1887)
-
∆(Design Maturity) 0.16 (0.2446)
0.32** (0.0112)
-0.38*** (0.0033)
0.14 (0.2886)
∆(Product Quality) - - - -0.34*** (0.0005)
∆(Product Size) - -0.16* (0.0604)
0.15* (0.0921)
-0.17** (0.0429)
∆( Product Design Cycle Time)
- - - 0.06 (0.4125)
System weighted R2 0.71
*** significance at the p < 0.01, ** significance at the p < 0.05, * significance at the p < 0.10. (p-values are shown in parentheses for two-tailed tests). Note: The “Pre-CPC” score represents the estimated coefficient of the corresponding dependent variable prior to CPC implementation. Hence, the coefficient of -0.59 in column (1) corresponds to the coefficient φ1 in equation (1) of our SUR estimation model, page 19.

37
Table 6. Impact of CPC on Product Development Outcomes
Dependent Variable Direct Impact Coefficient
(I)
Impact through Overall Impact
(VI) Collaboration
(II) Product Quality
(III) Product Design
Cycle Time (IV)
Product Development Cost
(V)
A ∆(Collaboration) 1.099*** (0.0006)
1.099*** (0.0006)
B ∆(Product Quality) 0.103 (0.674)
0.345*** (0.0001)
0.448* (0.052)
C ∆( Product Design Cycle Time)
-0.602** (0.016)
-0.122 (0.175)
-0.724*** (0.003)
D ∆(Product Development Cost)
-0.564** (0.021)
-0.150*** (0.0002)
-0.046 (0.403)
-0.760*** (0.0004)
*** denotes significance at p < 0.01, ** p < 0.05, * p < 0.10. All reported p-values are for two-tailed F-tests and are shown in parentheses. Table 7. Impact of CPC on Product Development Performance: An Illustrative Example of Four Firms
Firm/Industry Number of Product Errors
Average Cost per Product Error
Number of Reworks Number of ECOs
Before CPC After CPC Before CPC After CPC Before CPC After CPC Before CPC After CPC
Telecom Equipment Manufacturer
250 120 $600 $300 320 150 1000 600
Industrial Machinery 3% 2% $10,000 $5,000 1500 1300 1500 1200
Automotive OEM Supplier
10 3 $50,000 $45,000 3 0 20 10
High-tech Electronic Manufacturing Services
50 50 $500 $400 50 30 250 250

38
APPENDIX A1: SURVEY QUESTIONNAIRE Collaborative Product Commerce (CPC) is a class of collaboration software and tools that use internet technologies to permit individuals to collaboratively share intellectual data for the design, development, and management of product data throughout the product design and development lifecycle. CPC includes workflow tools that enable real-time exchange of product design data using structured business processes. Firm Name: _________ Number of employees: _________ Has your organization implemented a CPC solution for product design and development? a. If yes, when was it implemented? _____ . Month _____ Year. Please identify two typical products that your company designed and brought to market. Of these two products, please identify (i) one product that was designed before the CPC solution was implemented, and (ii) one product that was designed using the CPC solution. b. If No, please identify two typical products – one that was designed a couple of years ago and another
that was designed more recently. Please provide your responses to the questions below based on these two products.
Please comment on the following product-related statements as they relate to your product development organization. Provide a rating for each question based on the following scale. Very Low – Moderate – Very High (1 – 7 point Likert scale) PRODUCT QUALITY Q1. Evaluate product quality based on the number of product design errors or defects:
a. before the CPC solution was deployed b. after the CPC solution was deployed
Q2. Evaluate product quality based on the number of engineering change orders (ECOs):
a. before the CPC solution was deployed b. after the CPC solution was deployed
PRODUCT DEVELOPMENT COST Q3. Evaluate the cost of product design and prototyping:
a. before the CPC solution was deployed b. after the CPC solution was deployed
Q4. Evaluate the cost of overall product development a. before the CPC solution was deployed b. after the CPC solution was deployed
PRODUCT DESIGN CYCLE TIME Q5. Evaluate the length of the product design cycle time
a. before the CPC solution was deployed b. after the CPC solution was deployed
Q6. Evaluate the average time it takes to communicate design changes related to product development
a. before the CPC solution was deployed b. after the CPC solution was deployed
COLLABORATION Q7. Evaluate the frequency of collaborative interactions related to product design and development:
a. before the CPC solution was deployed b. after the CPC solution was deployed

39
Q8. Evaluate the extent (content) of detailed design information exchanged during collaborative interactions related to product development:
a. before the CPC solution was deployed b. after the CPC solution was deployed
Q9. Evaluate the openness to share product design information during collaborative interactions related to product development:
a. before the CPC solution was deployed b. after the CPC solution was deployed
PRODUCT SIZE Q10. Evaluate the number of components used in a typical product designed:
a. before the CPC solution was deployed b. after the CPC solution was deployed
DESIGN MATURITY Q11. Evaluate the typical degree of inter-connectedness between product components:
a. before the CPC solution was deployed b. after the CPC solution was deployed
Q12. Evaluate the typical number of new product design features : a. before the CPC solution was deployed b. after the CPC solution was deployed
Q13. Evaluate the typical extent of reuse of existing design features in the products designed: a. before the CPC solution was deployed b. after the CPC solution was deployed
Provide a rating for each question based on the following scale: Strongly Disagree – Neither Agree nor Disagree – Strongly Agree (1 – 7 point Likert scale) PROCESS MATURITY Q14. Integrated processes exist to ensure that product life-cycle processes are identified and planned
concurrently with design: a. before the CPC solution was deployed b. after the CPC solution was deployed
Q15. Quantitative targets are used to manage projects, manage suppliers, support risk management, coordinate training, and coordinate among project stakeholders:
a. before the CPC solution was deployed b. after the CPC solution was deployed
Q16. The organization has standard practices to support its product integration strategy for developing, and integrating components, and delivering the product to the customer:
a. before the CPC solution was deployed b. after the CPC solution was deployed
Q17. Work products, processes and services are objectively evaluated against the applicable requirements to ensure that issues arising from these reviews are addressed:
a. before the CPC solution was deployed b. after the CPC solution was deployed
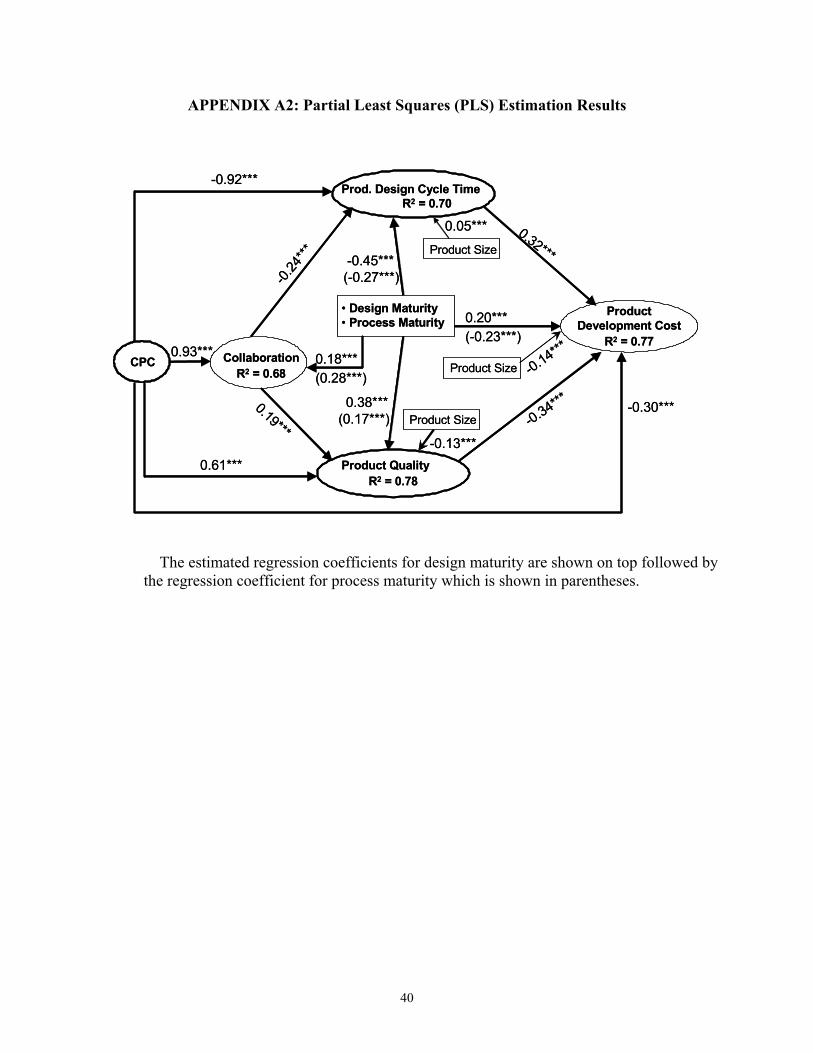
40
APPENDIX A2: Partial Least Squares (PLS) Estimation Results
The estimated regression coefficients for design maturity are shown on top followed by the regression coefficient for process maturity which is shown in parentheses.
Product QualityR2 = 0.78
Prod. Design Cycle TimeR2 = 0.70
CPC
ProductDevelopment Cost
R2 = 0.77
• Design Maturity• Process Maturity
Product Size
Product Size
Product SizeCollaboration
R2 = 0.680.93***
0.61***
-0.92***
-0.30***0.19***
-0.24
***
-0.34***
0.32***
-0.13***
0.05***
-0.14***0.18***(0.28***)
-0.45***(-0.27***)
0.38***(0.17***)
0.20***(-0.23***)