understanding the non- metropolitan–metropolitan digital divide · 2005. 10. 14. ·...
TRANSCRIPT
Understanding the Non-Metropolitan–Metropolitan Digital Divide
BRADFORD F. MILLS AND BRIAN E. WHITACRE
ABSTRACT A consistent gap exists between home Internet use in metropolitan areas and in
non-metropolitan areas in the U.S. This digital divide may stem from technology differences in
home Internet connectivity. Alternatively, differences in education, income, and other household
attributes may explain differences in metropolitan and non-metropolitan area home Internet
access. Effective programs to reduce the metropolitan–non-metropolitan digital divide must be
based on an understanding of the relative roles that technology and household characteristics play
in determining differential Internet usage. The household Internet adoption decision is modeled
using a logit estimation approach with data from the 2001 U.S. Current Population Survey
Internet and Computer Use Supplement. A decomposition of separate metropolitan and non-
metropolitan area estimates shows that differences in household attributes, particularly education
and income, account for 63 percent of the current metropolitan–non-metropolitan digital divide.
The result raises significant doubts that policies which focus solely on infrastructure and tech-
nology access will mitigate the current metropolitan–non-metropolitan digital divide.
Introduction
D uring the 1990s more and more households in the U.S. became “digitally connected”to the vast amount of information available on the Internet. Between December
1998 and September 2001 alone, the percentage of all households with Internet connec-tions is estimated to have increased dramatically from 18.6 percent to 50.5 percent (NTIA2002). Access to the Internet provides households with an array of previously unavailableopportunities for commerce, education, and entertainment. At the same time, disparitiesin access to, and use of, the Internet emerged among various segments of the population.Recent survey results show that whites have greater access to and use of the Internet thanblacks (Compaine 2001; NTIA 2002). Non-Hispanics show greater use than Hispanics.More educated and higher income individuals also show greater Internet use (NTIA 2002).A gap has also been found to exist between metropolitan area and non-metropolitan areahome use, with metropolitan area home use being about 12 percentage points higher in
Growth and ChangeVol. 34 No. 2 (Spring 2003), pp. 219-243
Bradford F. Mills is an associate professor, and Brian Whitacre is a graduate research assistant
in agricultural and applied economics at Virginia Polytechnic Institute and State University,
Blacksburg, Virginia. The authors acknowledge the helpful comments and suggestions of three anony-
mous reviewers.
Submitted Apr. 2002; revised Oct. 2002.© 2003 Gatton College of Business and Economics, University of Kentucky.Published by Blackwell Publishing, 350 Main Street, Malden MA 02148 US and 9600 Garsington Road, Oxford OX4 2DQ, UK.
2000 (Newburger 2001).1 These inequalities in Internet use are generically referred to as the “digital divide.” Concerns exist that the digital divide may exacerbate existing inequalities in household economic well-being (Drabenstott 2001).
Both the impact of the digital divide on future differences in economic well-being inmetropolitan and non-metropolitan areas and appropriate policies to address the digitaldivide will depend on its underlying causes. If the divide stems from differences in theavailability and quality of household Internet connectivity in metropolitan and non-metropolitan areas, it is unclear that market forces will act to reduce the divide. Evidencesuggests that attempts to increase industry competition through the TelecommunicationsAct of 1996 have seen limited success in terms of creating incentives to expand infra-structure investments in lower density regions (Cooper and Kimmelman 1999; Warf 2001).Public policies, like infrastructure subsidies, may be necessary to ameliorate some spatialdiscrepancies in metropolitan–non-metropolitan area infrastructure (Parker 2000). Anumber of federal, state, and local initiatives have been developed to support infrastruc-ture investments in low density regions. For example, the Rural Access Authority in NorthCarolina was created to provide local dial-up Internet access from every telephoneexchange in the state. Other states like Washington and Virginia have also provided grantsto rural areas to increase high-speed Internet access.
Alternatively, technology differences may not be the underlying source of the currentmetropolitan–non-metropolitan area digital divide.2 Rather, differences in education,income, and other household attributes may drive differences in metropolitan and non-metropolitan region use. Income-based differences stem, in part, from the fact that Internet use is not an essential household good (Moss and Mitra 1998). But income andeducational differences may be further intensified by the predominance of content targetedto high income and well educated groups. Available evidence suggests that there is lesscontent on the Internet catering to the “underserved” population—those without householdaccess (Children’s Partnership Report 2000; Greenman 2000). For example, informationon entry level jobs, low rent housing, and neighborhood assistance programs that is of par-ticular use to low-income households is less likely to be posted on the Internet. As a result,the benefits from home Internet use of low-income households are low relative to the benefits derived by higher income households. Inequalities stemming from householdattribute differences may also be intensified by the fact that the use of a local networkincreases the available benefits to all area network users (Graham and Aurigi 1997). Lowincome households tend to be geographically clustered. A household in a low income areais therefore likely to receive fewer benefits from home Internet use because a lower pro-portion of other households in the same geographic cluster are using the Internet.
If lower rates of household Internet use in non-metropolitan areas stem from lowerincome and education levels, efforts to close the divide may need to be linked to broaderefforts to increase education and income levels in non-metropolitan areas. Ensuring children equal access to digital technology through schools also becomes essential in orderto prevent the digital knowledge gaps from being passed on to the next generation. Asmentioned, network externalities may also be particularly important in determining homeInternet use. Lower propensities for households to use the Internet in non-metropolitan
220 GROWTH AND CHANGE, SPRING 2003
areas, given similar household characteristics and costs of access to the technology, mayarise from lower aggregate use among peer groups. In this case concerted efforts topromote widespread use in specific areas thorough digital-villages or subsidized area usergroups may be warranted.
The effective design of federal, state, and local programs to reduce the metropolitan–non-metropolitan area digital divide must be based on a sound understanding of the factorsbehind differential Internet access. While many studies have identified the general impor-tance of attributes such as education and income in determining metropolitan and non-metropolitan household Internet use (e.g., McConnaughey et al. 1995; McConnaughey andLader 1998; Cooper and Kimmelman 1999; NTIA 2000), research to date has not identi-fied the relative roles that differences in attributes of households and place-based con-straints play in explaining the metropolitan–non-metropolitan digital divide. This paperestimates a model of household Internet use and employs the results to test the relativeimportance of household attributes versus place-based differences in explaining the metropolitan–non-metropolitan digital divide. The results suggest that 63 percent of thecurrent metropolitan–non-metropolitan digital divide stems from area differences in house-hold attributes (particularly education and income), while 37 percent is associated withplace-based differences in household behavior or regional attributes.
These results and the associated policy implications for reducing the metropolitan–non-metropolitan digital divide are developed in the remainder of the paper as follows. The nextsection describes the data used in the analysis. Descriptive statistics on household infor-mation technology use, characteristics, and economic conditions are provided for metro-politan and non-metropolitan area households, as well as for Internet users and non-usersin metropolitan and non-metropolitan areas. The fourth section then develops a statisticalmodel of the household Internet use decision. The fifth section presents model estimationresults. The paper concludes with a discussion of the results and policy implications.
DataData on Internet use among metropolitan and non-metropolitan area households is
obtained from the Current Population Survey (CPS), September 2001 Internet and Computer Use Supplement (U.S. Department of Commerce, Bureau of Census 2001).3
The CPS is a sample of metropolitan and non-metropolitan households, and it is nation-ally representative when survey sample household weights are applied.4 After dropping households with missing data there are 47,084 households included in the sample.
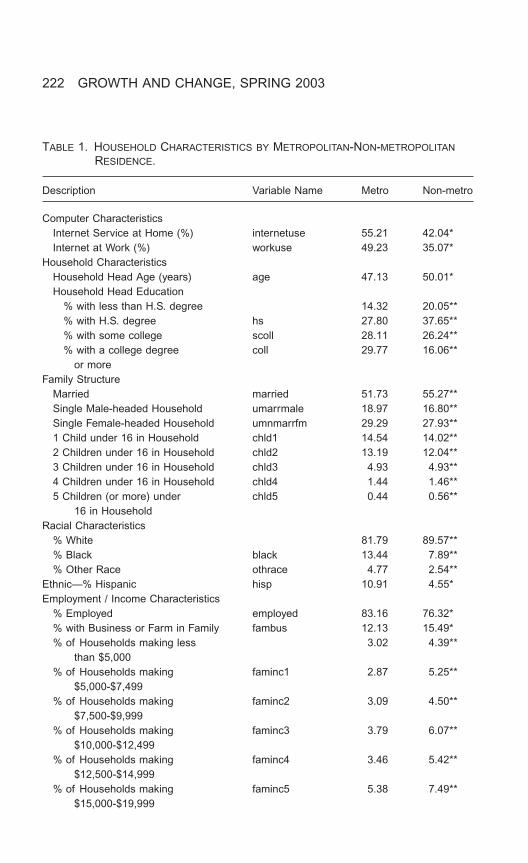
Home Internet use by a household is defined as a positive response to the Internet andComputer Use Supplement question “does anyone in the household connect to the Internetfrom home?” Descriptive statistics on rates of home use and household characteristics are pro-vided in Table 1. Consistent with the results of previous studies like Newburger (2001) thathave examined metropolitan–non-metropolitan differences in Internet access, a significantlyhigher share of metropolitan households (55 percent) use the Internet at home than non-metropolitan households (42 percent).5 A similar percentage point gap in Internet use at workprevails (WORKUSE): 49 percent of metropolitan households have at least one adult memberwho uses the Internet at work versus 35 percent of non-metropolitan households.
NON-METROPOLITAN–METROPOLITAN DIGITAL DIVIDE 221
222 GROWTH AND CHANGE, SPRING 2003
TABLE 1. HOUSEHOLD CHARACTERISTICS BY METROPOLITAN-NON-METROPOLITAN
RESIDENCE.
Description Variable Name Metro Non-metro
Computer CharacteristicsInternet Service at Home (%) internetuse 55.21 42.04*Internet at Work (%) workuse 49.23 35.07*
Household CharacteristicsHousehold Head Age (years) age 47.13 50.01*Household Head Education
% with less than H.S. degree 14.32 20.05**% with H.S. degree hs 27.80 37.65**% with some college scoll 28.11 26.24**% with a college degree coll 29.77 16.06**
or moreFamily Structure
Married married 51.73 55.27**Single Male-headed Household umarrmale 18.97 16.80**Single Female-headed Household umnmarrfm 29.29 27.93**1 Child under 16 in Household chld1 14.54 14.02**2 Children under 16 in Household chld2 13.19 12.04**3 Children under 16 in Household chld3 4.93 4.93**4 Children under 16 in Household chld4 1.44 1.46**5 Children (or more) under chld5 0.44 0.56**
16 in HouseholdRacial Characteristics
% White 81.79 89.57**% Black black 13.44 7.89**% Other Race othrace 4.77 2.54**
Ethnic—% Hispanic hisp 10.91 4.55*Employment / Income Characteristics
% Employed employed 83.16 76.32*% with Business or Farm in Family fambus 12.13 15.49*% of Households making less 3.02 4.39**
than $5,000% of Households making faminc1 2.87 5.25**
$5,000-$7,499% of Households making faminc2 3.09 4.50**
$7,500-$9,999% of Households making faminc3 3.79 6.07**
$10,000-$12,499% of Households making faminc4 3.46 5.42**
$12,500-$14,999% of Households making faminc5 5.38 7.49**
$15,000-$19,999
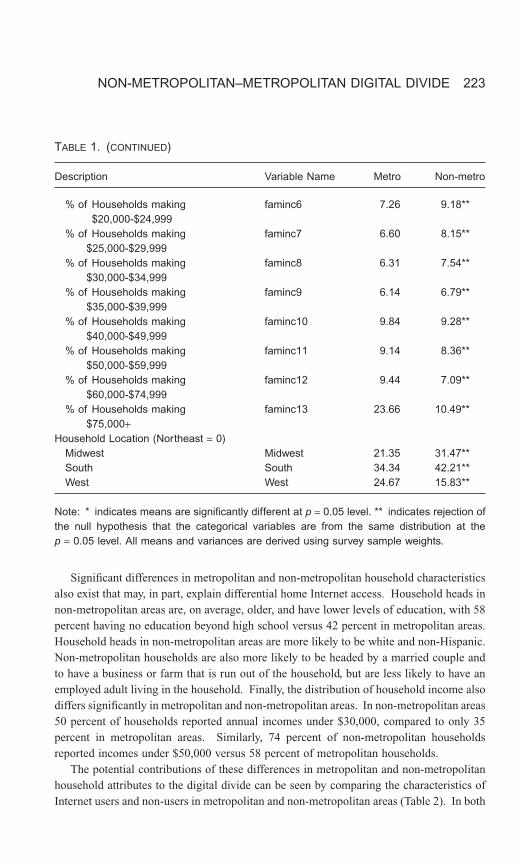
Significant differences in metropolitan and non-metropolitan household characteristicsalso exist that may, in part, explain differential home Internet access. Household heads innon-metropolitan areas are, on average, older, and have lower levels of education, with 58percent having no education beyond high school versus 42 percent in metropolitan areas.Household heads in non-metropolitan areas are more likely to be white and non-Hispanic.Non-metropolitan households are also more likely to be headed by a married couple andto have a business or farm that is run out of the household, but are less likely to have anemployed adult living in the household. Finally, the distribution of household income alsodiffers significantly in metropolitan and non-metropolitan areas. In non-metropolitan areas50 percent of households reported annual incomes under $30,000, compared to only 35percent in metropolitan areas. Similarly, 74 percent of non-metropolitan householdsreported incomes under $50,000 versus 58 percent of metropolitan households.
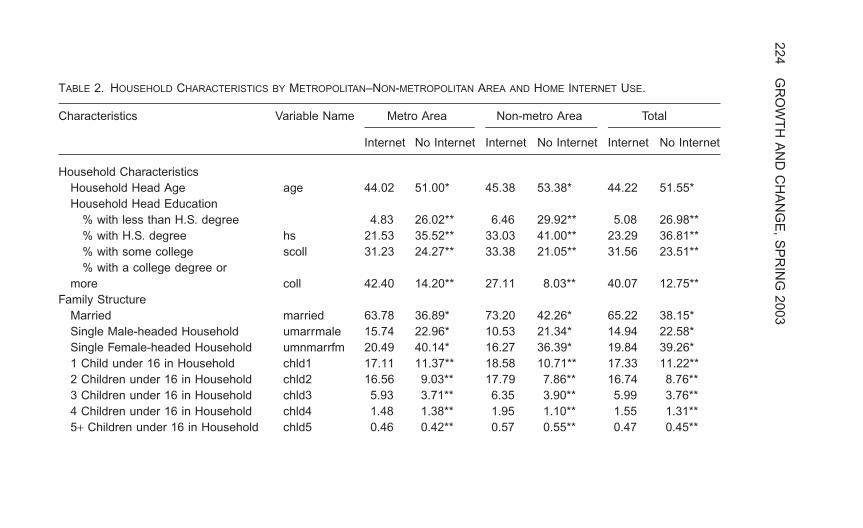
The potential contributions of these differences in metropolitan and non-metropolitanhousehold attributes to the digital divide can be seen by comparing the characteristics ofInternet users and non-users in metropolitan and non-metropolitan areas (Table 2). In both
NON-METROPOLITAN–METROPOLITAN DIGITAL DIVIDE 223
TABLE 1. (CONTINUED)
Description Variable Name Metro Non-metro
% of Households making faminc6 7.26 9.18**$20,000-$24,999
% of Households making faminc7 6.60 8.15**$25,000-$29,999
% of Households making faminc8 6.31 7.54**$30,000-$34,999
% of Households making faminc9 6.14 6.79**$35,000-$39,999
% of Households making faminc10 9.84 9.28**$40,000-$49,999
% of Households making faminc11 9.14 8.36**$50,000-$59,999
% of Households making faminc12 9.44 7.09**$60,000-$74,999
% of Households making faminc13 23.66 10.49**$75,000+
Household Location (Northeast = 0)Midwest Midwest 21.35 31.47**South South 34.34 42.21**West West 24.67 15.83**
Note: * indicates means are significantly different at p = 0.05 level. ** indicates rejection ofthe null hypothesis that the categorical variables are from the same distribution at the p = 0.05 level. All means and variances are derived using survey sample weights.
224G
RO
WT
H A
ND
CH
AN
GE
,S
PR
ING
2003TABLE 2. HOUSEHOLD CHARACTERISTICS BY METROPOLITAN–NON-METROPOLITAN AREA AND HOME INTERNET USE.
Characteristics Variable Name Metro Area Non-metro Area Total
Internet No Internet Internet No Internet Internet No Internet
Household CharacteristicsHousehold Head Age age 44.02 51.00* 45.38 53.38* 44.22 51.55*Household Head Education
% with less than H.S. degree 4.83 26.02** 6.46 29.92** 5.08 26.98**% with H.S. degree hs 21.53 35.52** 33.03 41.00** 23.29 36.81**% with some college scoll 31.23 24.27** 33.38 21.05** 31.56 23.51**% with a college degree or
more coll 42.40 14.20** 27.11 8.03** 40.07 12.75**Family Structure
Married married 63.78 36.89* 73.20 42.26* 65.22 38.15*Single Male-headed Household umarrmale 15.74 22.96* 10.53 21.34* 14.94 22.58*Single Female-headed Household umnmarrfm 20.49 40.14* 16.27 36.39* 19.84 39.26*1 Child under 16 in Household chld1 17.11 11.37** 18.58 10.71** 17.33 11.22**2 Children under 16 in Household chld2 16.56 9.03** 17.79 7.86** 16.74 8.76**3 Children under 16 in Household chld3 5.93 3.71** 6.35 3.90** 5.99 3.76**4 Children under 16 in Household chld4 1.48 1.38** 1.95 1.10** 1.55 1.31**5+ Children under 16 in Household chld5 0.46 0.42** 0.57 0.55** 0.47 0.45**
NO
N-M
ET
RO
PO
LITAN
–ME
TR
OP
OLITA
N D
IGITA
L DIV
IDE
225
TABLE 2. (CONTINUED)
Characteristics Variable Name Metro Area Non-metro Area Total
Internet No Internet Internet No Internet Internet No Internet
Racial Characteristics% White 85.80 76.85** 94.04 86.33** 87.07 79.08**% Black black 8.42 19.63* 3.75 10.89* 7.70 17.58*% Other Race othrace 5.78 3.52* 2.21 2.78* 5.23 3.34*
Ethnic Characteristics% Hispanic hisp 6.77 16.01* 2.25 6.23* 6.08 13.71*
Household LocationNortheast 19.99 19.23** 12.77 8.82** 18.88 16.79**Midwest midwest 20.92 21.87** 34.02 29.62** 22.92 23.69**South south 32.90 36.11** 35.81 46.86** 33.34 38.64**West west 26.20 22.78** 17.39 14.70** 24.85 20.88**
Note: * Indicates that the means are significantly different from each other at the p = 0.05 level. ** Indicates rejection of thenull hypothesis that the categorical variables are from the same distribution at the p = 0.05 level.
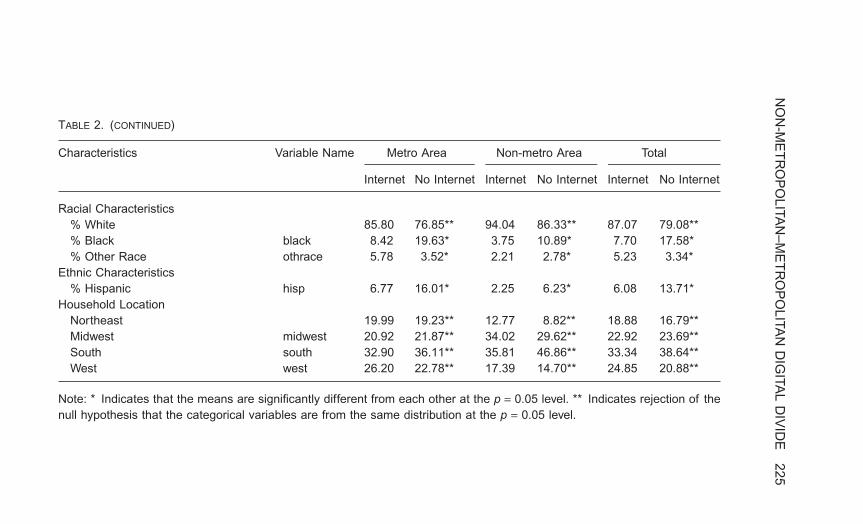
areas, heads in households that use the Internet at home are younger, have higher levelsof education, and are more likely to be married than are heads of households that do notuse the Internet, while single female headed households are disproportionately representedamong households that do not use the Internet at home. Households using the Internet athome in both areas are also more likely to have children at home and to have heads whoare white and non-Hispanic.
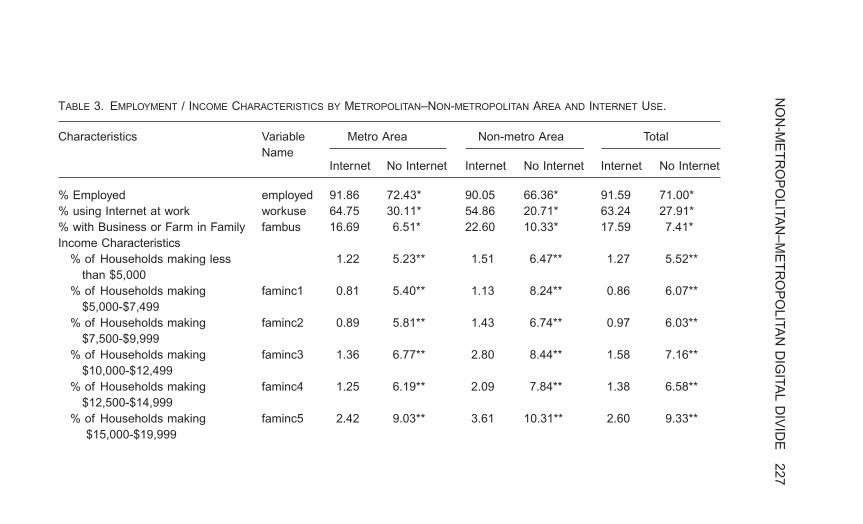
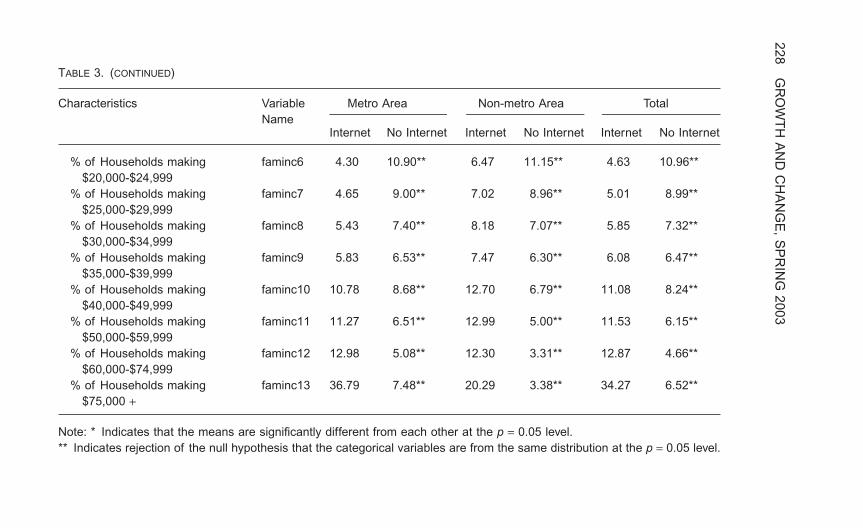
The influence of household income and the employment of an adult member on homeInternet use can be seen in Table 3. In both metropolitan and non-metropolitan areas,Internet using households are more likely to have an employed adult member and havehigher incomes than are households that do not use the Internet. For example, in non-metropolitan areas over 68 percent of households that did not use the Internet at home hadannual incomes below $30,000, compared to 26 percent of households that used the Internet at home. In both non-metropolitan and metropolitan areas, households that usethe Internet at home are also more likely to have a member who uses the Internet at work.The next section develops a statistical model that identifies the contributions that theseobserved differences in the characteristics of metropolitan and non-metropolitan house-holds make to the metropolitan–non-metropolitan digital divide.
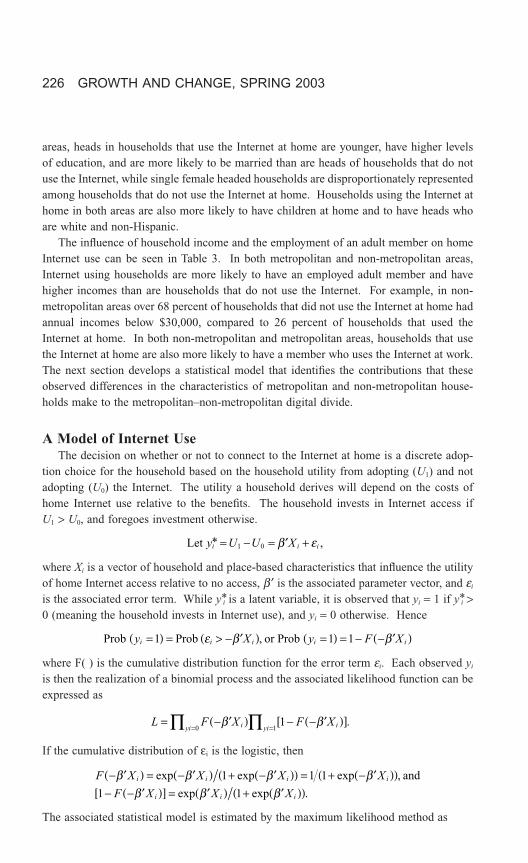
A Model of Internet UseThe decision on whether or not to connect to the Internet at home is a discrete adop-
tion choice for the household based on the household utility from adopting (U1) and notadopting (U0) the Internet. The utility a household derives will depend on the costs ofhome Internet use relative to the benefits. The household invests in Internet access if U1 > U0, and foregoes investment otherwise.
where Xi is a vector of household and place-based characteristics that influence the utilityof home Internet access relative to no access, b ¢ is the associated parameter vector, and ei
is the associated error term. While y*i is a latent variable, it is observed that yi = 1 if y*i >0 (meaning the household invests in Internet use), and yi = 0 otherwise. Hence
where F( ) is the cumulative distribution function for the error term ei. Each observed yi
is then the realization of a binomial process and the associated likelihood function can beexpressed as
If the cumulative distribution of ei is the logistic, then
The associated statistical model is estimated by the maximum likelihood method as
F X X X X
F X X Xi i i i
i i i
- ¢( ) = - ¢( ) + - ¢( )( ) = + - ¢( )( )- - ¢( )[ ] = ¢( ) + ¢( )( )
b b b bb b b
exp exp exp ,
exp exp .
1 1 1
1 1
and
L F X F Xi iyiyi= - ¢( ) - - ¢( )[ ]
== ’’ b b110
.
Prob Prob or Prob y X y F Xi i i i i=( ) = > - ¢( ) =( ) = - - ¢( )1 1 1e b b,
Let y U U Xi i i* ,= - = ¢ +1 0 b e
226 GROWTH AND CHANGE, SPRING 2003
NO
N-M
ET
RO
PO
LITAN
–ME
TR
OP
OLITA
N D
IGITA
L DIV
IDE
227
TABLE 3. EMPLOYMENT / INCOME CHARACTERISTICS BY METROPOLITAN–NON-METROPOLITAN AREA AND INTERNET USE.
Characteristics Variable Metro Area Non-metro Area TotalName
Internet No Internet Internet No Internet Internet No Internet
% Employed employed 91.86 72.43* 90.05 66.36* 91.59 71.00*% using Internet at work workuse 64.75 30.11* 54.86 20.71* 63.24 27.91*% with Business or Farm in Family fambus 16.69 6.51* 22.60 10.33* 17.59 7.41*Income Characteristics
% of Households making less 1.22 5.23** 1.51 6.47** 1.27 5.52**than $5,000
% of Households making faminc1 0.81 5.40** 1.13 8.24** 0.86 6.07**$5,000-$7,499
% of Households making faminc2 0.89 5.81** 1.43 6.74** 0.97 6.03**$7,500-$9,999
% of Households making faminc3 1.36 6.77** 2.80 8.44** 1.58 7.16**$10,000-$12,499
% of Households making faminc4 1.25 6.19** 2.09 7.84** 1.38 6.58**$12,500-$14,999
% of Households making faminc5 2.42 9.03** 3.61 10.31** 2.60 9.33**$15,000-$19,999
228G
RO
WT
H A
ND
CH
AN
GE
,S
PR
ING
2003TABLE 3. (CONTINUED)
Characteristics Variable Metro Area Non-metro Area TotalName
Internet No Internet Internet No Internet Internet No Internet
% of Households making faminc6 4.30 10.90** 6.47 11.15** 4.63 10.96**$20,000-$24,999
% of Households making faminc7 4.65 9.00** 7.02 8.96** 5.01 8.99**$25,000-$29,999
% of Households making faminc8 5.43 7.40** 8.18 7.07** 5.85 7.32**$30,000-$34,999
% of Households making faminc9 5.83 6.53** 7.47 6.30** 6.08 6.47**$35,000-$39,999
% of Households making faminc10 10.78 8.68** 12.70 6.79** 11.08 8.24**$40,000-$49,999
% of Households making faminc11 11.27 6.51** 12.99 5.00** 11.53 6.15**$50,000-$59,999
% of Households making faminc12 12.98 5.08** 12.30 3.31** 12.87 4.66**$60,000-$74,999
% of Households making faminc13 36.79 7.48** 20.29 3.38** 34.27 6.52**$75,000 +
Note: * Indicates that the means are significantly different from each other at the p = 0.05 level.** Indicates rejection of the null hypothesis that the categorical variables are from the same distribution at the p = 0.05 level.
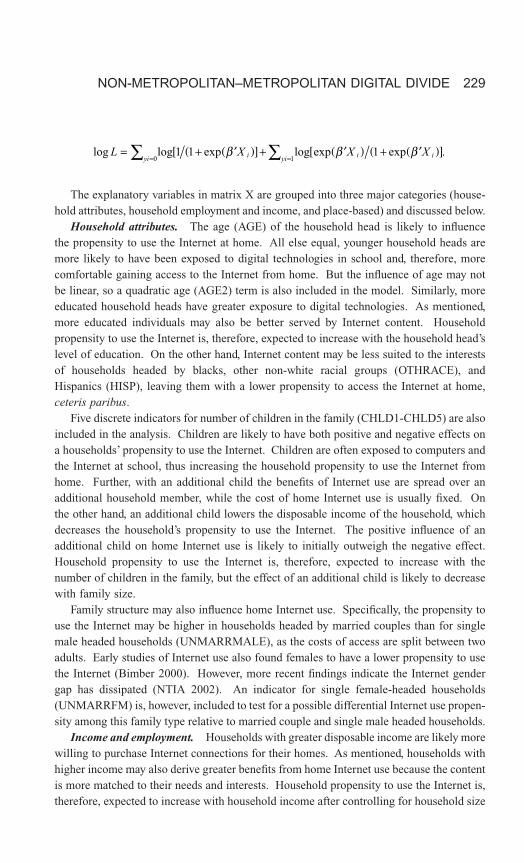
The explanatory variables in matrix X are grouped into three major categories (house-hold attributes, household employment and income, and place-based) and discussed below.
Household attributes. The age (AGE) of the household head is likely to influencethe propensity to use the Internet at home. All else equal, younger household heads aremore likely to have been exposed to digital technologies in school and, therefore, morecomfortable gaining access to the Internet from home. But the influence of age may notbe linear, so a quadratic age (AGE2) term is also included in the model. Similarly, moreeducated household heads have greater exposure to digital technologies. As mentioned,more educated individuals may also be better served by Internet content. Householdpropensity to use the Internet is, therefore, expected to increase with the household head’slevel of education. On the other hand, Internet content may be less suited to the interestsof households headed by blacks, other non-white racial groups (OTHRACE), and Hispanics (HISP), leaving them with a lower propensity to access the Internet at home,ceteris paribus.
Five discrete indicators for number of children in the family (CHLD1-CHLD5) are alsoincluded in the analysis. Children are likely to have both positive and negative effects ona households’ propensity to use the Internet. Children are often exposed to computers andthe Internet at school, thus increasing the household propensity to use the Internet fromhome. Further, with an additional child the benefits of Internet use are spread over anadditional household member, while the cost of home Internet use is usually fixed. Onthe other hand, an additional child lowers the disposable income of the household, whichdecreases the household’s propensity to use the Internet. The positive influence of an additional child on home Internet use is likely to initially outweigh the negative effect.Household propensity to use the Internet is, therefore, expected to increase with thenumber of children in the family, but the effect of an additional child is likely to decreasewith family size.
Family structure may also influence home Internet use. Specifically, the propensity touse the Internet may be higher in households headed by married couples than for singlemale headed households (UNMARRMALE), as the costs of access are split between twoadults. Early studies of Internet use also found females to have a lower propensity to usethe Internet (Bimber 2000). However, more recent findings indicate the Internet gendergap has dissipated (NTIA 2002). An indicator for single female-headed households(UNMARRFM) is, however, included to test for a possible differential Internet use propen-sity among this family type relative to married couple and single male headed households.
Income and employment. Households with greater disposable income are likely morewilling to purchase Internet connections for their homes. As mentioned, households withhigher income may also derive greater benefits from home Internet use because the contentis more matched to their needs and interests. Household propensity to use the Internet is,therefore, expected to increase with household income after controlling for household size
log log exp log exp exp .L X X Xyi i yi i i= + ¢( )([ ]+ ¢( ) + ¢( )([ ]
= =Â Â0 11 1 1b b b
NON-METROPOLITAN–METROPOLITAN DIGITAL DIVIDE 229
through indicators for marriage and number of children. However the influence of income may not be linear, so thirteen discrete indicators of household income are employed (FAMINC1-FAMINC13) to demarcate increasing levels of household income.Households with an employed member may also be more likely to use the Internet at home.But the effect of employment on Internet use is likely much greater if an employed memberof the household uses the Internet at work (WORKUSE) or if a family business is runfrom within the household (FAMBUS).
Place-based characteristics. A non-metropolitan area indicator variable (NONMET)is included in the model to test if a household’s base propensity to use the Internet differsin metropolitan and non-metropolitan areas. As mentioned, propensities may differ acrossgeographic areas for three reasons. First, metropolitan–non-metropolitan differences inpropensities to use the Internet at home may stem from differences in the costs or qualityof home Internet access. Second, differences in propensities may stem from differencesin perceived benefits of home Internet use. For example, more information on local storesand businesses may be available in metropolitan areas. Alternatively, online shopping may be of greater value to non-metropolitan home users, given more limited selections ofmany goods in their immediate vicinity. Third, positive externalities from Internet use byother households in the area may increase Internet propensities for individual householdsin high use areas relative to low use areas.
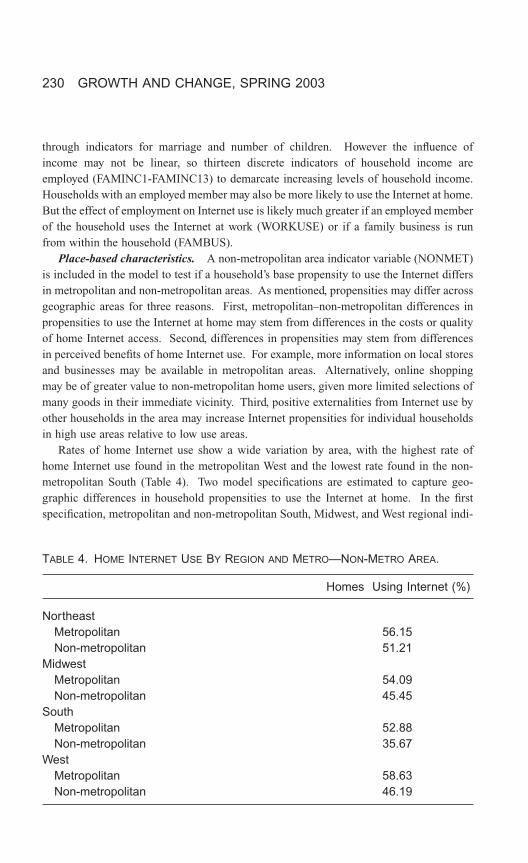
Rates of home Internet use show a wide variation by area, with the highest rate of home Internet use found in the metropolitan West and the lowest rate found in the non-metropolitan South (Table 4). Two model specifications are estimated to capture geo-graphic differences in household propensities to use the Internet at home. In the firstspecification, metropolitan and non-metropolitan South, Midwest, and West regional indi-
230 GROWTH AND CHANGE, SPRING 2003
TABLE 4. HOME INTERNET USE BY REGION AND METRO—NON-METRO AREA.
Homes Using Internet (%)
NortheastMetropolitan 56.15Non-metropolitan 51.21
MidwestMetropolitan 54.09Non-metropolitan 45.45
SouthMetropolitan 52.88Non-metropolitan 35.67
WestMetropolitan 58.63Non-metropolitan 46.19
cators and a non-metropolitan Northeast indicator are included to allow propensities to usethe Internet to fluctuate across region—metropolitan-non-metropolitan groupings relativeto the Northeast metropolitan region. The strength of the relationship between regionalrates of home Internet use and individual household propensities is later explicitly testedin a second model specification, where the percent of households using the Internet in eachmetropolitan–non-metropolitan region is included as an explanatory variable in place ofthe regional indicators.
In both model specifications parameter estimates for all household attributes, employ-ment, and economic characteristics are also allowed to differ in metropolitan and non-metropolitan areas by including a non-metropolitan interaction term for each variable. Thenature and magnitude of these non-metropolitan parameter shifts is left as an empiricalquestion.
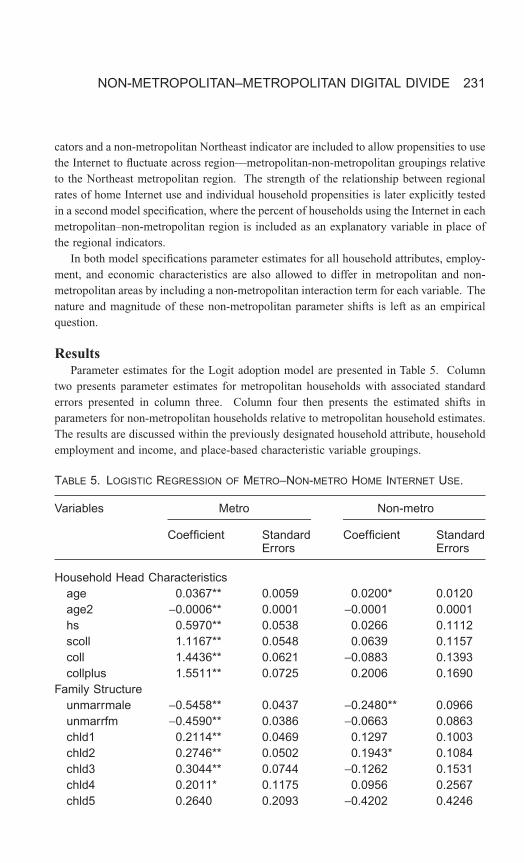
ResultsParameter estimates for the Logit adoption model are presented in Table 5. Column
two presents parameter estimates for metropolitan households with associated standarderrors presented in column three. Column four then presents the estimated shifts in parameters for non-metropolitan households relative to metropolitan household estimates.The results are discussed within the previously designated household attribute, householdemployment and income, and place-based characteristic variable groupings.
NON-METROPOLITAN–METROPOLITAN DIGITAL DIVIDE 231
TABLE 5. LOGISTIC REGRESSION OF METRO–NON-METRO HOME INTERNET USE.
Variables Metro Non-metro
Coefficient Standard Coefficient StandardErrors Errors
Household Head Characteristicsage 0.0367** 0.0059 0.0200* 0.0120age2 -0.0006** 0.0001 -0.0001 0.0001hs 0.5970** 0.0538 0.0266 0.1112scoll 1.1167** 0.0548 0.0639 0.1157coll 1.4436** 0.0621 -0.0883 0.1393collplus 1.5511** 0.0725 0.2006 0.1690
Family Structureunmarrmale -0.5458** 0.0437 -0.2480** 0.0966unmarrfm -0.4590** 0.0386 -0.0663 0.0863chld1 0.2114** 0.0469 0.1297 0.1003chld2 0.2746** 0.0502 0.1943* 0.1084chld3 0.3044** 0.0744 -0.1262 0.1531chld4 0.2011* 0.1175 0.0956 0.2567chld5 0.2640 0.2093 -0.4202 0.4246
232 GROWTH AND CHANGE, SPRING 2003
TABLE 5. (CONTINUED)
Variables Metro Non-metro
Coefficient Standard Coefficient StandardErrors Errors
Racial Characteristicsblack -0.7736** 0.0466 0.2308 0.1462othrace 0.1053 0.0758 -0.4573** 0.1888
Ethnic Characteristicshisp -0.7197** 0.0546 0.0796 0.1743
Employment / Income Characteristicsemployed -0.1113** 0.0507 0.0040 0.1081workuse 0.5342** 0.0342 0.0377 0.0729fambus 0.3158** 0.0497 -0.0698 0.0909faminc1 -0.1423 0.1345 -0.1086 0.2605faminc2 -0.1822 0.1332 0.2442 0.2707faminc3 0.0068 0.1191 0.4077* 0.2350faminc4 -0.0355 0.1228 0.0500 0.2476faminc5 0.1275 0.1088 0.0136 0.2209faminc6 0.3554** 0.1023 0.1594 0.2111faminc7 0.5021** 0.1029 0.1117 0.2120faminc8 0.7375** 0.1034 0.1066 0.2131faminc9 0.8224** 0.1041 -0.0650 0.2171faminc10 1.0014** 0.1004 0.1305 0.2103faminc11 1.1974** 0.1017 0.0513 0.2147faminc12 1.4347** 0.1040 0.0120 0.2213faminc13 1.8000** 0.1006 -0.0183 0.2213
Household Locationmidwest -0.2174** 0.0436 -0.0351 0.1058south -0.0471 0.0419 -0.3706** 0.1051west -0.0056 0.0459 -0.1406 0.1121
Intercept -1.6228** 0.1666 -0.7693** 0.3645
Log-likelihood -23,343.0
Note: ** and * indicate statistically significant differences from zero at the p =0.05 and p = 0.10 levels, respectively. Non-metropolitan coefficients representshifts on metropolitan coefficients.
Household attributes. A household’s propensity to use the Internet at home is foundinitially to be positively related to age in metropolitan areas. But the quadratic term isnegative and the propensity reaches a maximum at thirty-one years of age and thendeclines. Non-metropolitan areas show a significantly different relationship betweenhead’s age and Internet use, as the propensity increases much more rapidly with age. Asexpected, a household’s propensity to use the Internet at home also rises with the educa-tion level of the household head. But no significant difference in the influence of educa-tion on Internet use is found between metropolitan and non-metropolitan areas.
Family structure also influences home Internet use. In metropolitan areas, familiesheaded by single males and single females show a lower propensity to use the Internet at home than families headed by married couples. It is also worth noting that single male headed families show a greater estimated negative association with Internet use thansingle female headed households and that the negative association with home Internet useis even stronger in non-metropolitan areas for single male headed households. The pres-ence of children in the household is found to increase the propensity to use the Internetat home, but the positive influence appears to peak at three children. The positive influ-ence of the first and second child on home Internet use is also found to be slightly strongerin non-metropolitan areas.
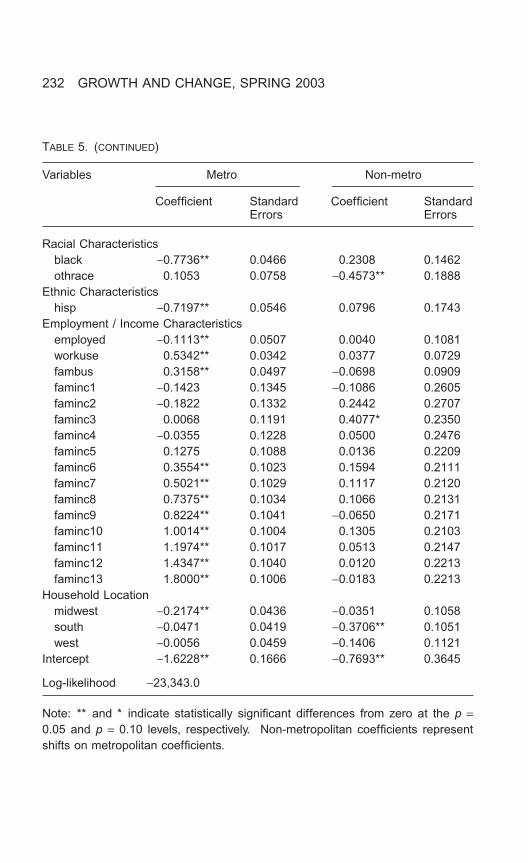
As in previous studies, metropolitan and non-metropolitan households headed byblacks and Hispanics show sharply lower propensities to use the Internet from home relative to whites and non-Hispanics, respectively. Households headed by other non-whiteracial groups do not show a significantly different propensity to use the Internet in metropolitan areas, but show a lower propensity to use the Internet at home in non-metropolitan areas.
Household employment and income. Internet access at work (WORKUSE) andhaving a family business (FAMBUS) increase the likelihood of using the Internet at homein both metropolitan and non-metropolitan areas. As expected, the propensity to use theInternet at home also increases with household income levels above $20,000 per year(FAMINC5). However, no significant metropolitan–non-metropolitan differences in theinfluence of income on home Internet use are identified. Contrary to expectations, theprobability of home Internet use is found to decrease if an adult member of the householdis employed. The negative association between household head employment and homeInternet use, after controlling for household income and other factors, may stem from thegenerally lower socio-economic status of households who do not have a member withaccess to the Internet at work, rather than a mitigating influence of employment on thepropensity of households to use the Internet at home.
Place-based characteristics. The base propensity to use the Internet at home alsovaries between metropolitan and non-metropolitan areas. The non-metropolitan area intercept term is negative, indicating that the base propensity to use the Internet is lowerin non-metropolitan areas than metropolitan areas after controlling for household personaland economic characteristics. There is also a significant variation in home Internet usewithin metropolitan and non-metropolitan areas by region. In metropolitan areas, house-
NON-METROPOLITAN–METROPOLITAN DIGITAL DIVIDE 233
holds in the Midwest show a significantly lower propensity to use the Internet than dohouseholds in the Northeast after controlling for differences in household characteristics.In non-metropolitan areas, households in the South show a significantly lower propensityto use the Internet at home than in the Northeast, ceteris paribus.
DiscussionOnly a handful of the estimated non-metropolitan area parameter shifts are statistically
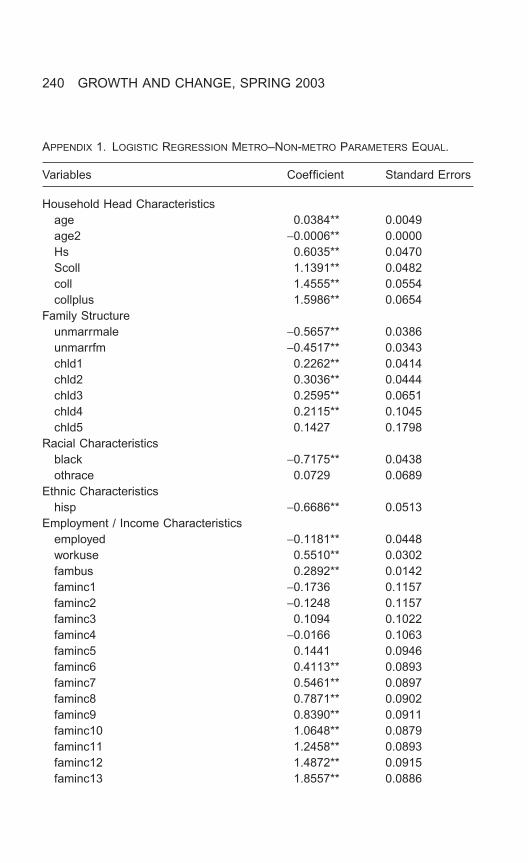
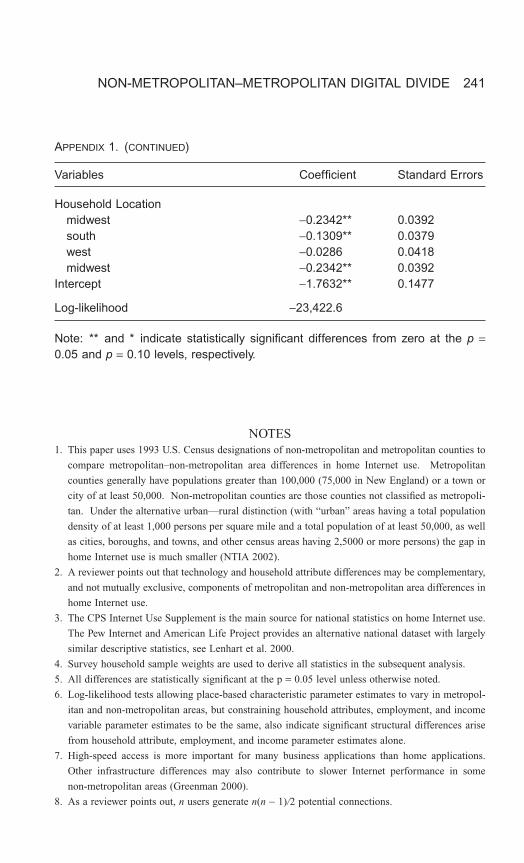
significant. This suggests that metropolitan–non-metropolitan area difference in specifichousehold attribute influences on propensities to use the Internet at home may not bedriving the observed gap in home use. On the other hand, a comparison of the log-likelihood of the model against an alternative model where metropolitan and non-metropolitan parameters on each variable are constrained to be equal suggests that, whenthe parameters are taken as a group, differences in metropolitan and non-metropolitanInternet adoption behavior are statistically significant at the p = 0.05 level (for results see Appendix 1).6 The importance of these structural differences in metropolitan–non-metropolitan Internet adoption behavior is further explored by decomposing the metro-politan–non-metropolitan gap in home Internet use into the component associated withmetropolitan–non-metropolitan parameter differences and the component associated withdifferences in underlying household attribute, employment, and income variables.
Since the Logit estimator is non-linear, the standard Oaxaca-Blinder decompositionmethod cannot be used (Oaxaca 1973). Instead, Nielsen (1998) is followed in imple-menting a generalized decomposition made up of three simulated probabilities
where and are the average probabilities of Internet use among metropolitan and non-metropolitan households, respectively. Nu is the sample size for metropolitan householdsand Nr is the sample size for non-metropolitan households. is the estimated parametervector for metropolitan households and is the estimated shift for non-metropolitan house-hold parameters relative to metropolitan household parameters. is calculated for eachnon-metropolitan household as the probability of Internet adoption with metropolitanparameter estimates.
The metropolitan–non-metropolitan household Internet use gap is thendivided into the component associated with metropolitan–non-metropolitan householdattribute difference differences and the component associated with difference in underlying parameters, or behavioral differences including differences inregional propensities. The results of the decomposition are shown in Table 6. Consistent
ˆ ˆ ,P Pr r0 -( )
ˆ ˆP Pu r-( )0
ˆ ˆP Pu r-( )
P̂r0
d̂B̂
P̂rP̂u
ˆ ˆ
ˆ ˆ ˆ
ˆ ˆ
P F X B N
P F X B N
P F X B N
u ui ui
N
r ri ri
N
r ri ri
N
u
r
r
= [ ]
= +( )[ ]
= [ ]
=
=
=
Â
Â
Â
1
1
0
1
d
234 GROWTH AND CHANGE, SPRING 2003
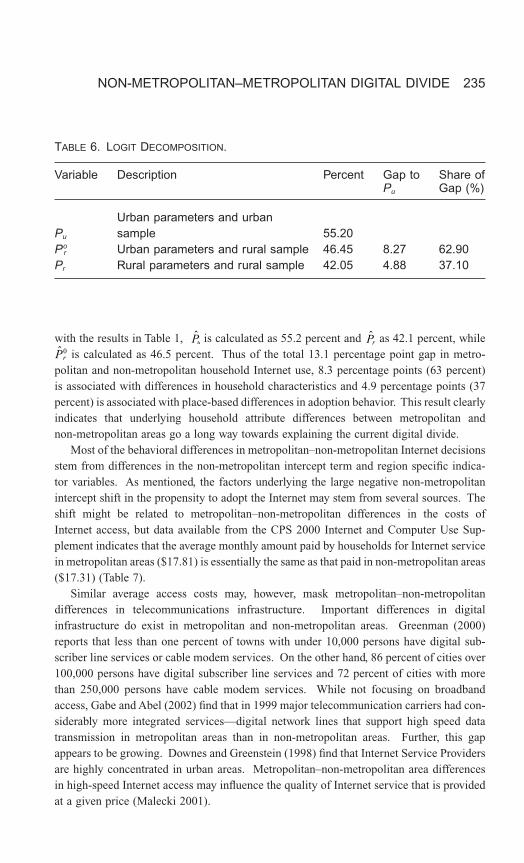
with the results in Table 1, is calculated as 55.2 percent and as 42.1 percent, whileis calculated as 46.5 percent. Thus of the total 13.1 percentage point gap in metro-
politan and non-metropolitan household Internet use, 8.3 percentage points (63 percent)is associated with differences in household characteristics and 4.9 percentage points (37percent) is associated with place-based differences in adoption behavior. This result clearlyindicates that underlying household attribute differences between metropolitan and non-metropolitan areas go a long way towards explaining the current digital divide.
Most of the behavioral differences in metropolitan–non-metropolitan Internet decisionsstem from differences in the non-metropolitan intercept term and region specific indica-tor variables. As mentioned, the factors underlying the large negative non-metropolitanintercept shift in the propensity to adopt the Internet may stem from several sources. Theshift might be related to metropolitan–non-metropolitan differences in the costs of Internet access, but data available from the CPS 2000 Internet and Computer Use Sup-plement indicates that the average monthly amount paid by households for Internet servicein metropolitan areas ($17.81) is essentially the same as that paid in non-metropolitan areas($17.31) (Table 7).
Similar average access costs may, however, mask metropolitan–non-metropolitan differences in telecommunications infrastructure. Important differences in digital infrastructure do exist in metropolitan and non-metropolitan areas. Greenman (2000)reports that less than one percent of towns with under 10,000 persons have digital sub-scriber line services or cable modem services. On the other hand, 86 percent of cities over100,000 persons have digital subscriber line services and 72 percent of cities with morethan 250,000 persons have cable modem services. While not focusing on broadbandaccess, Gabe and Abel (2002) find that in 1999 major telecommunication carriers had con-siderably more integrated services—digital network lines that support high speed datatransmission in metropolitan areas than in non-metropolitan areas. Further, this gapappears to be growing. Downes and Greenstein (1998) find that Internet Service Providersare highly concentrated in urban areas. Metropolitan–non-metropolitan area differencesin high-speed Internet access may influence the quality of Internet service that is providedat a given price (Malecki 2001).
P̂r0
P̂rP̂u
NON-METROPOLITAN–METROPOLITAN DIGITAL DIVIDE 235
TABLE 6. LOGIT DECOMPOSITION.
Variable Description Percent Gap to Share ofPu Gap (%)
Urban parameters and urbanPu sample 55.20Pr
o Urban parameters and rural sample 46.45 8.27 62.90Pr Rural parameters and rural sample 42.05 4.88 37.10
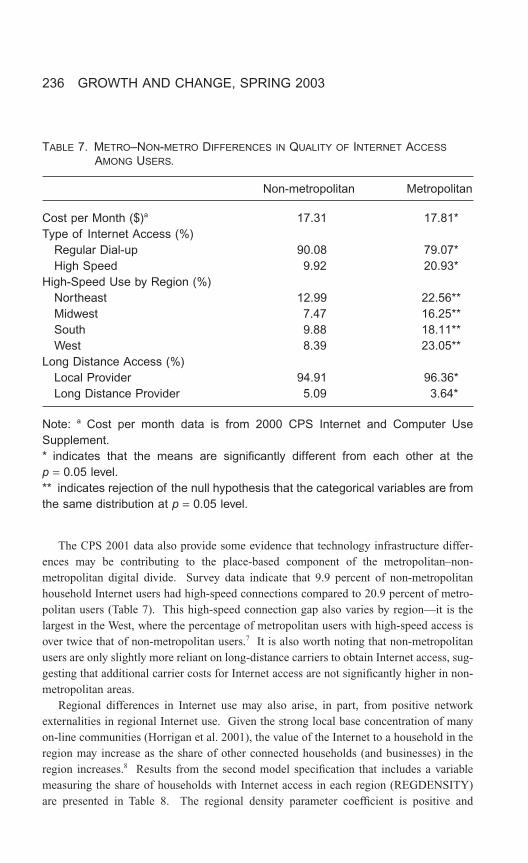
The CPS 2001 data also provide some evidence that technology infrastructure differ-ences may be contributing to the place-based component of the metropolitan–non-metropolitan digital divide. Survey data indicate that 9.9 percent of non-metropolitanhousehold Internet users had high-speed connections compared to 20.9 percent of metro-politan users (Table 7). This high-speed connection gap also varies by region—it is thelargest in the West, where the percentage of metropolitan users with high-speed access isover twice that of non-metropolitan users.7 It is also worth noting that non-metropolitanusers are only slightly more reliant on long-distance carriers to obtain Internet access, sug-gesting that additional carrier costs for Internet access are not significantly higher in non-metropolitan areas.
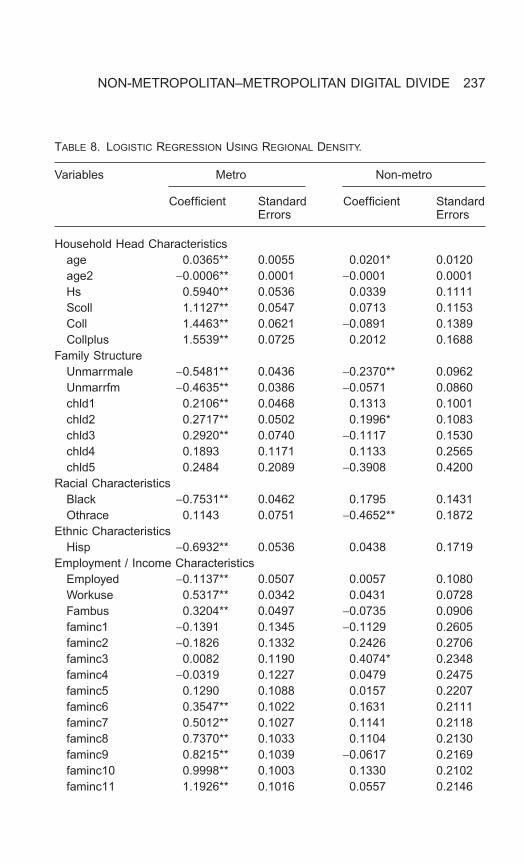
Regional differences in Internet use may also arise, in part, from positive network externalities in regional Internet use. Given the strong local base concentration of manyon-line communities (Horrigan et al. 2001), the value of the Internet to a household in theregion may increase as the share of other connected households (and businesses) in theregion increases.8 Results from the second model specification that includes a variablemeasuring the share of households with Internet access in each region (REGDENSITY)are presented in Table 8. The regional density parameter coefficient is positive and
236 GROWTH AND CHANGE, SPRING 2003
TABLE 7. METRO–NON-METRO DIFFERENCES IN QUALITY OF INTERNET ACCESS
AMONG USERS.
Non-metropolitan Metropolitan
Cost per Month ($)a 17.31 17.81*Type of Internet Access (%)
Regular Dial-up 90.08 79.07*High Speed 9.92 20.93*
High-Speed Use by Region (%)Northeast 12.99 22.56**Midwest 7.47 16.25**South 9.88 18.11**West 8.39 23.05**
Long Distance Access (%)Local Provider 94.91 96.36*Long Distance Provider 5.09 3.64*
Note: a Cost per month data is from 2000 CPS Internet and Computer Use Supplement.* indicates that the means are significantly different from each other at the p = 0.05 level.** indicates rejection of the null hypothesis that the categorical variables are fromthe same distribution at p = 0.05 level.
NON-METROPOLITAN–METROPOLITAN DIGITAL DIVIDE 237
TABLE 8. LOGISTIC REGRESSION USING REGIONAL DENSITY.
Variables Metro Non-metro
Coefficient Standard Coefficient StandardErrors Errors
Household Head Characteristicsage 0.0365** 0.0055 0.0201* 0.0120age2 -0.0006** 0.0001 -0.0001 0.0001Hs 0.5940** 0.0536 0.0339 0.1111Scoll 1.1127** 0.0547 0.0713 0.1153Coll 1.4463** 0.0621 -0.0891 0.1389Collplus 1.5539** 0.0725 0.2012 0.1688
Family StructureUnmarrmale -0.5481** 0.0436 -0.2370** 0.0962Unmarrfm -0.4635** 0.0386 -0.0571 0.0860chld1 0.2106** 0.0468 0.1313 0.1001chld2 0.2717** 0.0502 0.1996* 0.1083chld3 0.2920** 0.0740 -0.1117 0.1530chld4 0.1893 0.1171 0.1133 0.2565chld5 0.2484 0.2089 -0.3908 0.4200
Racial CharacteristicsBlack -0.7531** 0.0462 0.1795 0.1431Othrace 0.1143 0.0751 -0.4652** 0.1872
Ethnic CharacteristicsHisp -0.6932** 0.0536 0.0438 0.1719
Employment / Income CharacteristicsEmployed -0.1137** 0.0507 0.0057 0.1080Workuse 0.5317** 0.0342 0.0431 0.0728Fambus 0.3204** 0.0497 -0.0735 0.0906faminc1 -0.1391 0.1345 -0.1129 0.2605faminc2 -0.1826 0.1332 0.2426 0.2706faminc3 0.0082 0.1190 0.4074* 0.2348faminc4 -0.0319 0.1227 0.0479 0.2475faminc5 0.1290 0.1088 0.0157 0.2207faminc6 0.3547** 0.1022 0.1631 0.2111faminc7 0.5012** 0.1027 0.1141 0.2118faminc8 0.7370** 0.1033 0.1104 0.2130faminc9 0.8215** 0.1039 -0.0617 0.2169faminc10 0.9998** 0.1003 0.1330 0.2102faminc11 1.1926** 0.1016 0.0557 0.2146
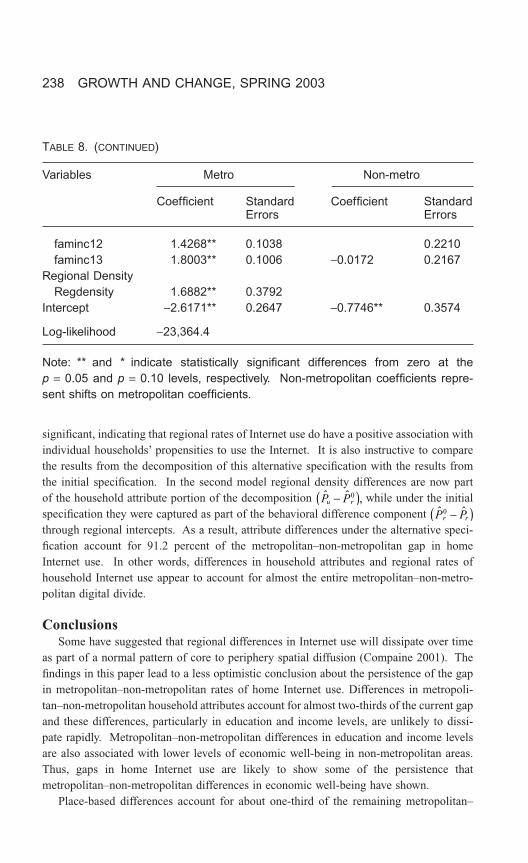
significant, indicating that regional rates of Internet use do have a positive association withindividual households’ propensities to use the Internet. It is also instructive to comparethe results from the decomposition of this alternative specification with the results fromthe initial specification. In the second model regional density differences are now part of the household attribute portion of the decomposition while under the initialspecification they were captured as part of the behavioral difference component through regional intercepts. As a result, attribute differences under the alternative speci-fication account for 91.2 percent of the metropolitan–non-metropolitan gap in home Internet use. In other words, differences in household attributes and regional rates ofhousehold Internet use appear to account for almost the entire metropolitan–non-metro-politan digital divide.
ConclusionsSome have suggested that regional differences in Internet use will dissipate over time
as part of a normal pattern of core to periphery spatial diffusion (Compaine 2001). Thefindings in this paper lead to a less optimistic conclusion about the persistence of the gapin metropolitan–non-metropolitan rates of home Internet use. Differences in metropoli-tan–non-metropolitan household attributes account for almost two-thirds of the current gapand these differences, particularly in education and income levels, are unlikely to dissi-pate rapidly. Metropolitan–non-metropolitan differences in education and income levelsare also associated with lower levels of economic well-being in non-metropolitan areas.Thus, gaps in home Internet use are likely to show some of the persistence that metropolitan–non-metropolitan differences in economic well-being have shown.
Place-based differences account for about one-third of the remaining metropolitan–
ˆ ˆP Pr r0 -( )
ˆ ˆ ,P Pu r-( )0
238 GROWTH AND CHANGE, SPRING 2003
TABLE 8. (CONTINUED)
Variables Metro Non-metro
Coefficient Standard Coefficient StandardErrors Errors
faminc12 1.4268** 0.1038 0.2210faminc13 1.8003** 0.1006 -0.0172 0.2167
Regional DensityRegdensity 1.6882** 0.3792
Intercept -2.6171** 0.2647 -0.7746** 0.3574
Log-likelihood -23,364.4
Note: ** and * indicate statistically significant differences from zero at the p = 0.05 and p = 0.10 levels, respectively. Non-metropolitan coefficients repre-sent shifts on metropolitan coefficients.
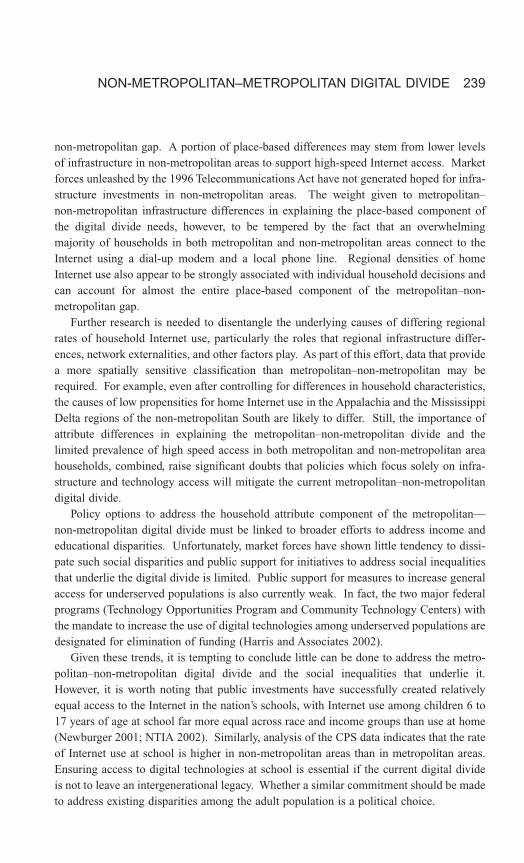
non-metropolitan gap. A portion of place-based differences may stem from lower levelsof infrastructure in non-metropolitan areas to support high-speed Internet access. Marketforces unleashed by the 1996 Telecommunications Act have not generated hoped for infra-structure investments in non-metropolitan areas. The weight given to metropolitan–non-metropolitan infrastructure differences in explaining the place-based component ofthe digital divide needs, however, to be tempered by the fact that an overwhelming majority of households in both metropolitan and non-metropolitan areas connect to theInternet using a dial-up modem and a local phone line. Regional densities of home Internet use also appear to be strongly associated with individual household decisions andcan account for almost the entire place-based component of the metropolitan–non-metropolitan gap.
Further research is needed to disentangle the underlying causes of differing regionalrates of household Internet use, particularly the roles that regional infrastructure differ-ences, network externalities, and other factors play. As part of this effort, data that providea more spatially sensitive classification than metropolitan–non-metropolitan may berequired. For example, even after controlling for differences in household characteristics,the causes of low propensities for home Internet use in the Appalachia and the MississippiDelta regions of the non-metropolitan South are likely to differ. Still, the importance ofattribute differences in explaining the metropolitan–non-metropolitan divide and thelimited prevalence of high speed access in both metropolitan and non-metropolitan areahouseholds, combined, raise significant doubts that policies which focus solely on infra-structure and technology access will mitigate the current metropolitan–non-metropolitandigital divide.
Policy options to address the household attribute component of the metropolitan—non-metropolitan digital divide must be linked to broader efforts to address income andeducational disparities. Unfortunately, market forces have shown little tendency to dissi-pate such social disparities and public support for initiatives to address social inequalitiesthat underlie the digital divide is limited. Public support for measures to increase generalaccess for underserved populations is also currently weak. In fact, the two major federalprograms (Technology Opportunities Program and Community Technology Centers) withthe mandate to increase the use of digital technologies among underserved populations aredesignated for elimination of funding (Harris and Associates 2002).
Given these trends, it is tempting to conclude little can be done to address the metro-politan–non-metropolitan digital divide and the social inequalities that underlie it.However, it is worth noting that public investments have successfully created relativelyequal access to the Internet in the nation’s schools, with Internet use among children 6 to17 years of age at school far more equal across race and income groups than use at home(Newburger 2001; NTIA 2002). Similarly, analysis of the CPS data indicates that the rateof Internet use at school is higher in non-metropolitan areas than in metropolitan areas.Ensuring access to digital technologies at school is essential if the current digital divideis not to leave an intergenerational legacy. Whether a similar commitment should be madeto address existing disparities among the adult population is a political choice.
NON-METROPOLITAN–METROPOLITAN DIGITAL DIVIDE 239
240 GROWTH AND CHANGE, SPRING 2003
APPENDIX 1. LOGISTIC REGRESSION METRO–NON-METRO PARAMETERS EQUAL.
Variables Coefficient Standard Errors
Household Head Characteristicsage 0.0384** 0.0049age2 -0.0006** 0.0000Hs 0.6035** 0.0470Scoll 1.1391** 0.0482coll 1.4555** 0.0554collplus 1.5986** 0.0654
Family Structureunmarrmale -0.5657** 0.0386unmarrfm -0.4517** 0.0343chld1 0.2262** 0.0414chld2 0.3036** 0.0444chld3 0.2595** 0.0651chld4 0.2115** 0.1045chld5 0.1427 0.1798
Racial Characteristicsblack -0.7175** 0.0438othrace 0.0729 0.0689
Ethnic Characteristicshisp -0.6686** 0.0513
Employment / Income Characteristicsemployed -0.1181** 0.0448workuse 0.5510** 0.0302fambus 0.2892** 0.0142faminc1 -0.1736 0.1157faminc2 -0.1248 0.1157faminc3 0.1094 0.1022faminc4 -0.0166 0.1063faminc5 0.1441 0.0946faminc6 0.4113** 0.0893faminc7 0.5461** 0.0897faminc8 0.7871** 0.0902faminc9 0.8390** 0.0911faminc10 1.0648** 0.0879faminc11 1.2458** 0.0893faminc12 1.4872** 0.0915faminc13 1.8557** 0.0886
NOTES1. This paper uses 1993 U.S. Census designations of non-metropolitan and metropolitan counties to
compare metropolitan–non-metropolitan area differences in home Internet use. Metropolitan
counties generally have populations greater than 100,000 (75,000 in New England) or a town or
city of at least 50,000. Non-metropolitan counties are those counties not classified as metropoli-
tan. Under the alternative urban—rural distinction (with “urban” areas having a total population
density of at least 1,000 persons per square mile and a total population of at least 50,000, as well
as cities, boroughs, and towns, and other census areas having 2,5000 or more persons) the gap in
home Internet use is much smaller (NTIA 2002).
2. A reviewer points out that technology and household attribute differences may be complementary,
and not mutually exclusive, components of metropolitan and non-metropolitan area differences in
home Internet use.
3. The CPS Internet Use Supplement is the main source for national statistics on home Internet use.
The Pew Internet and American Life Project provides an alternative national dataset with largely
similar descriptive statistics, see Lenhart et al. 2000.
4. Survey household sample weights are used to derive all statistics in the subsequent analysis.
5. All differences are statistically significant at the p = 0.05 level unless otherwise noted.
6. Log-likelihood tests allowing place-based characteristic parameter estimates to vary in metropol-
itan and non-metropolitan areas, but constraining household attributes, employment, and income
variable parameter estimates to be the same, also indicate significant structural differences arise
from household attribute, employment, and income parameter estimates alone.
7. High-speed access is more important for many business applications than home applications.
Other infrastructure differences may also contribute to slower Internet performance in some
non-metropolitan areas (Greenman 2000).
8. As a reviewer points out, n users generate n(n - 1)/2 potential connections.
NON-METROPOLITAN–METROPOLITAN DIGITAL DIVIDE 241
APPENDIX 1. (CONTINUED)
Variables Coefficient Standard Errors
Household Locationmidwest -0.2342** 0.0392south -0.1309** 0.0379west -0.0286 0.0418midwest -0.2342** 0.0392
Intercept -1.7632** 0.1477
Log-likelihood -23,422.6
Note: ** and * indicate statistically significant differences from zero at the p =0.05 and p = 0.10 levels, respectively.
REFERENCESBimber, B. 2000. Measuring the gender gap on the Internet. Social Science Quarterly 81: 868-875.
Children’s Partnership. 2000. Online content for low income and underserved Americans: The digital
divide’s new frontiers. The children’s partership: http://www.childrenspartnership.org.
Compaine, B.M., ed. 2001. The digital divide: Facing a crisis or creating a myth? London: MIT
Press.
Cooper, M., and G. Kimmelman. 1999. The digital divide confronts the Telecommunications Act of
1996. Washington DC: Consumer Federation of America.
Downes, T.A., and S.M. Greenstein. 1998. Do commercial ISPs provide universal access? Mimeo.
Department of Economics, Tufts University.
Drabenstott, M. 2001. New policies for a new rural America. International Regional Science Review
24: 1:3-15.
Gabe, T., and J. Abel. 2002. Deployment of advanced telecommunications infrastructure in
rural America: Measuring the digital divide. Department of Resource Economics and Policy:
University of Maine.
Graham, S., and A. Aurigi. 1997. Virtual cities, social polarization, and the crisis in urban public
space. Journal of Urban Technology 4:19-52.
Greenman, C. 2000. Life in the slow lane: Rural residents are frustrated by sluggish web access and
a scarcity of local information online. New York Times. May 18, p. D1.
Harris, L., and Associaties. 2002. Bringing a nation online: The Importance of federal leadership.
Washington, DC: Leslie Harris and Associates.
Horrigan, J.B. 2001. Online communities: Networks that nuture long-distance relationships and local
ties. Washington DC: Pew Internet & American Life Project. http://pewinternet.org/.
Lenhart, A. 2000. Who’s not online: 57% of those without internet access say they do not plan to
log on. Pew Internet & American Life Project. http://pewinternet.org/.
Malecki, E.J. 2001. Going digital in rural America. In Exploring policy options for a new rural
America. Edited by M. Drabenstott. Kansas City KS: Center for the Study of Rural America,
Federal Reserve Bank of Kansas City, 49-68.
McConnaughey, J., C. Nila, and T. Sloan. 1995. Falling through the net: A survey of the ‘have nots’
in rural and urban America. National Telecommunications and Information Administration,
http://www.ntia.doc.gov/ntiahome/fallingthru.html.
McConnaughey, J., and W. Lader. 1998. Falling through the net II: New data on
the digital divide. National Telecommunications and Information Administration,
http://www.ntia.doc.gov/ntiahome/net2/falling.html.
Moss, M., and S. Mitra. 1998. Net equity: A report on income and internet access. Journal of Urban
Technology 5: 23-32.
National Telecommunications and Information Administration and Economics Statistics
Administration. 2000. Falling through the net: Towards digital inclusion. Washington DC: U.S.
Department of Commerce.
National Telecommunications and Information Administration and Economics Statistics
Administration. 2002. How Americans are expanding their use of the internet. Washington DC:
U.S. Department of Commerce.
Newberger, E.C. 2001. Home computers and internet use in the United States. Special Study
P23-207. Washington DC: U.S. Department of Commerce.
242 GROWTH AND CHANGE, SPRING 2003
Nielson, H.S. 1998. Discrimination and detailed decomposition in a logit model. Economic Letters
61: 115-120.
Oaxaca, R. 1973. Male-female differentials in urban labor markets. International Economic Review
14: 693-709.
Parker, E.B. 2000. Closing the digital divide in rural America. Telecommunications Policy
24: 281-290.
U.S. Department of Commerce, Bureau of Census. 2001. Current population survey, Sep. 2001:
Internet and computer use supplement [Computer file]. Washington DC: U.S. Department of
Commerce.
Warf, B. 2001. Segueways into cyberspace, Multiple geographies of the digital divide. Environment
and Planning B, Planning and Design 28: 3-19.
NON-METROPOLITAN–METROPOLITAN DIGITAL DIVIDE 243