union gaming analytics (michael greene)
TRANSCRIPT

Union Gaming Analytics
Financial Suitability – Southeast Kansas Zone
Presentation to the Kansas Lottery Gaming Facility Review Board
June 10, 2015

2
Scope of Work
• Analyze the applicants for the Southeastern Kansas gaming license from a
financial suitability perspective
• Review of the applicants ability to finance the proposed casino development
projects
• Review of the applicants ability to meet their debt obligations and ability to
reinvest in the projects
• Equity and debt commitments, liquidity, cash flow, leverage, and other
metrics

3
Frontenac Development, LLC Camptown Casino
4
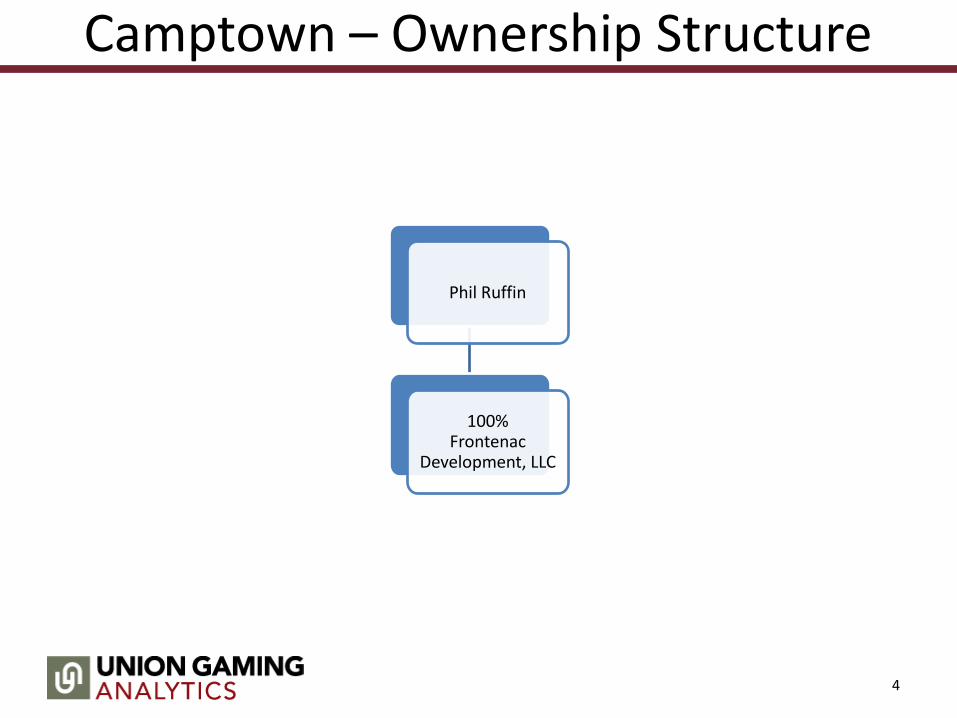
Camptown – Ownership Structure
Phil Ruffin
100% Frontenac
Development, LLC

5
Camptown – Project Budget
Owner Ratio
Frontenac Development, LLC 100%
Project budget: Total
Existing Land & Building 25,000
New Land and Improvements 2,466
New Buildings 15,288
Design, development and construction 799
Furniture, fixture and equipment 26,853
Pre-opening and Contingencies 8,125
License fee 5,500
Funds needed for development 84,031

6
Camptown – Financing Sources
• Frontenac intends to finance Camptown Casino via 100% cash equity
Financing sources Ratio
Cash equity 100.0%
Financing amounts Total
Cash equity 59,031
Total Frontenac 59,031
7
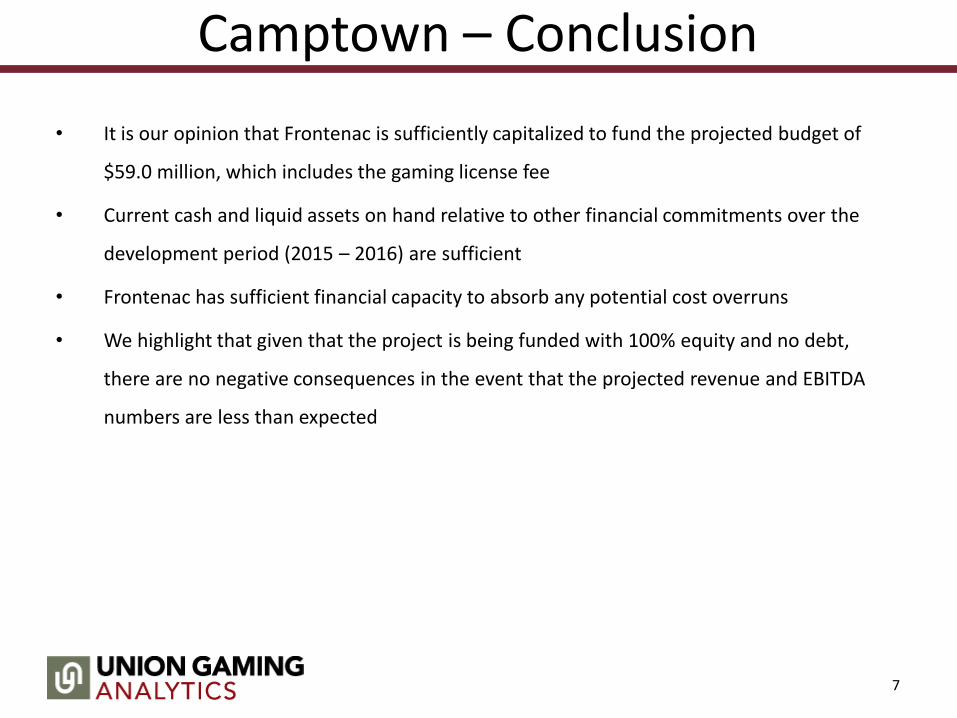
Camptown – Conclusion
• It is our opinion that Frontenac is sufficiently capitalized to fund the projected budget of
$59.0 million, which includes the gaming license fee
• Current cash and liquid assets on hand relative to other financial commitments over the
development period (2015 – 2016) are sufficient
• Frontenac has sufficient financial capacity to absorb any potential cost overruns
• We highlight that given that the project is being funded with 100% equity and no debt,
there are no negative consequences in the event that the projected revenue and EBITDA
numbers are less than expected

8
Castle Rock Casino Resort, LLC Castle Rock Casino Resort

9
Castle Rock – Ownership Structure
Class A Members
29.4%
SK, LLC - 4.90%
JCB, LLC - 4.90%
Michael Steven - 4.90%
Robert Rudd - 2.94%
Crystal River Investments LLC - 1.90%
Jolly Boys Partners LLC - 1.47%
Joplin Holdings LLC - 1.47%
SE Kansas LLC - 1.23%
MOECR LLC - 0.98%
Murfin, Inc. - 0.98%
SEK Investments LLC - 0.74%
Johnny Steven - 0.54%
Rucker Properties LLC - 0.50%
Roll It LLC - 0.49%
Transcontinental Holding Company LLC - 0.49%
David Becker - 0.49%
Gregory Schmidt - 0.49%
Class B Members
Air Capital Gaming LLC
70.2%
Rodney Steven
35.1%
Brandon Steven
35.1%
Class C Members
0.4%
Gregory Ferris
0.4%
American Casino & Entertainment
Properties

10
Castle Rock – Project Budget Owner Ratio
Class A Members 29.4%
Class B Members 70.2%
Class C Members 0.4%
Project budget: Total
Land 30,000
Land & Improvements 5,340
Buildings 32,511
Hotel 29,846
Design, development and construction 11,216
Public Sector Infrastructure 1,450
Financing Costs 3,996
Furniture, fixture and equipment 21,064
Pre-opening and Contingencies 4,076
License fee 5,500
Funds needed for development 144,998

11
Castle Rock – Financing Sources
• CRCR intends to finance Castle Rock Casino via a mix of equity (34.5%) and debt (65.5%)
• Based on the estimated budgets, this implies:
• $50.0mm equity; $95.0mm debt
Financing sources Ratio
Equity 34.5%
Debt 65.5%
Financing amounts
Equity 50,000
Debt 94,998
Total Castle Rock 144,998

12
Castle Rock – Conclusion • It is our opinion CRCR’s equity members have sufficient available liquid assets to fund their
cash equity commitments and absorb cost overruns
• However, we call into question CRCR’s ability to raise the required debt
• Current capital structure includes significant value associated with contributed land
with no independent land appraisal; we were unable to validate the $30.0mm value
• The 65% loan-to-cost ratio is highly correlated to the land value and therefore the
ability to obtain the required debt financing is also dependent on the land value
• No firm debt commitments for the required amount
• Given projected EBITDA, the size of the project budget, the related 65% loan-to-cost ratio,
and high leverage ratio, the project is not feasible because it will not be able to service its
debt
• Based on our projections, the leverage ratio (total debt outstanding divided by
EBITDA) of 10.0x in 2019 is far too high for a stand-alone greenfield casino
development project

13
Kansas Crossing Casino, L.C. Kansas Crossing Casino & Hotel
14
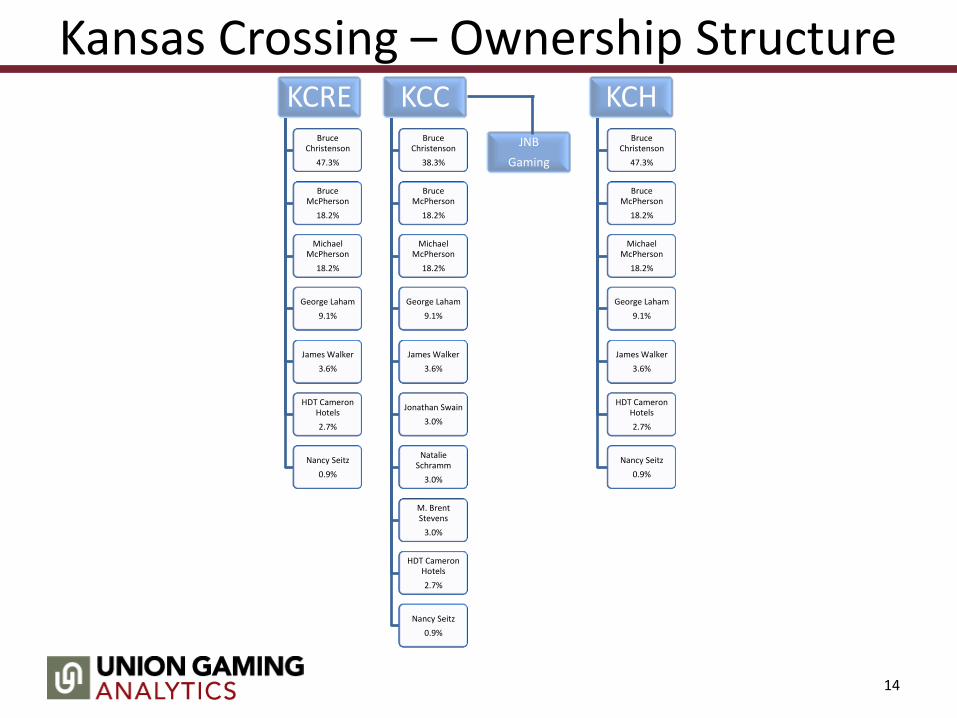
Kansas Crossing – Ownership Structure KCRE
Bruce Christenson
47.3%
Bruce McPherson
18.2%
Michael McPherson
18.2%
George Laham
9.1%
James Walker
3.6%
HDT Cameron Hotels
2.7%
Nancy Seitz
0.9%
KCC Bruce
Christenson
38.3%
Bruce McPherson
18.2%
Michael McPherson
18.2%
George Laham
9.1%
James Walker
3.6%
Jonathan Swain
3.0%
Natalie Schramm
3.0%
M. Brent Stevens
3.0%
HDT Cameron Hotels
2.7%
Nancy Seitz
0.9%
KCH Bruce
Christenson
47.3%
Bruce McPherson
18.2%
Michael McPherson
18.2%
George Laham
9.1%
James Walker
3.6%
HDT Cameron Hotels
2.7%
Nancy Seitz
0.9%
JNB
Gaming
15
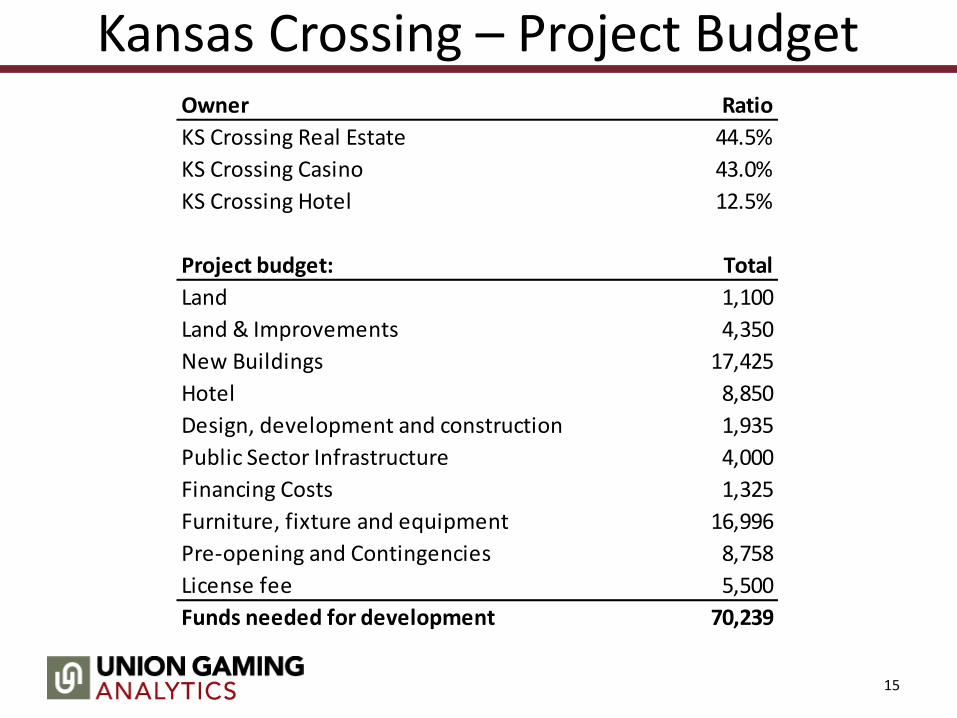
Kansas Crossing – Project Budget Owner Ratio
KS Crossing Real Estate 44.5%
KS Crossing Casino 43.0%
KS Crossing Hotel 12.5%
Project budget: Total
Land 1,100
Land & Improvements 4,350
New Buildings 17,425
Hotel 8,850
Design, development and construction 1,935
Public Sector Infrastructure 4,000
Financing Costs 1,325
Furniture, fixture and equipment 16,996
Pre-opening and Contingencies 8,758
License fee 5,500
Funds needed for development 70,239

16
Kansas Crossing – Financing Sources
• KC intends to finance Kansas Crossing Casino via a mix of cash equity (36.9%) and debt
(63.1%)
• Based on the estimated budgets, this implies:
• $25.9mm cash equity; $44.3mm debt
Financing sources Ratio
Equity 36.9%
Debt 63.1%
Financing amounts
Equity 25,909
Debt 44,330
Total Kansas Crossing 70,239
17
Kansas Crossing – Conclusion
• It is our opinion KC’s equity members have sufficient available liquid assets to fund their
cash equity commitments and absorb cost overruns
• Based on our financial projections, the leverage ratio of 5.2x in 2019 is towards the high end
of the tolerable range for a greenfield casino development project
• However, firm commitment letters with indicative pricing and terms have been
secured for both the KCRE and KCH debt components
• Furthermore, based on our financial projections, there is minimal excess free cash flow
after accounting for the required annual debt service payments (principal and interest), the
preferred return to the equity investors of KCRE and annual maintenance capital
expenditures
• Therefore, it is possible that some of these annual obligations may not be able to be
paid in the event that the projected revenue and EBITDA numbers are less than
expected

www.uniongaminggroup.com