united states department of the interior geological survey · (waples, 1980), requires a detailed...
TRANSCRIPT

UNITED STATES DEPARTMENT OF THE INTERIOR
GEOLOGICAL SURVEY
Vitrinite Reflectance and Paleotemperature within
Franciscan Terranes of Coastal Northern California:
38°45 T N to 40°00'N
12 2 Michael B. Underwood * and John D. 0 ? Leary, Jr.
Open-File Report 85-663
This report is preliminary and has not been reviewed for conformity with U.S. Geological Survey editorial standards and stratigraphic nomenclature. Opinions and conclusions expressed herein do not necessarily represent those of the USGS. Any use of trade names is for descriptive purposes only and does not imply endorsement by the USGS.
Branch of Pacific-Marine Geology Menlo Park, CA
Department of Geology University of Missouri Columbia, MO
1985

Preface
This report summarizes the initial results from a study of paleotemper- ature within the Franciscan Complex of California. Data were derived from measurements of vitrinite reflectance. The study area is located in the northern Coast Ranges of California between latitudes 38 45'N and 40 00'N. Analyses have been completed on surface samples from the following terranes: Franciscan Central belt, Franciscan Coastal belt, and the Yager complex. The data provided in this report are complimentary to on-going studies of Franciscan strata located between latitudes 40 00'N and 40 30'N.
Acknowledgments
This study was supported by the U.S. Department of Energy, with funds administered to the University of Missouri through USGS Purchase Order 94214. We thank David Houseknecht and Joe Wood for their expert advice in matters of sample preparation and organic petrography. Chris Gillett assisted in the laboratory. Reviews by Bob McLaughlin and Neely Bostick were also helpful and appreciated.

TABLE OF CONTENTSPage
Introduction ............................. 1Techniques .............................. 5Results ............................... 9
Coastal belt .......................... 9Yager complex .......................... 16Central belt .......................... 19
Summary ............................... 20Appendix A. Techniques of sample preparation and data collection . . 21Appendix B. Tabulation of results .................. 29Appendix C. Comparison of vitrinite reflectance values ....... 35References .............................. 36
LIST OF FIGURES Fig. 1. Locality of study area. ................... 2Fig. 2. Map of Franciscan terranes in coastal northern
California. ......................... 4Fig. 3. Example of histogram showing reflectance data ........ 7Fig. 4. Mean Ro and paleotemperature for the Coastal belt ...... 10Fig. 5. Distribution of Ro values for southern half of
study area. ......................... 11Fig. 6. Distribution of Ro values for northern half of
study area. ......................... 12Fig. 7. Contour map of reflectance values for the southern
half of the study area ................... 14Fig. 8. Contour map of reflectance values for the northern
half of the study area ................... 15Fig. 9. Mean Ro and paleotemperature for the Yager Complex ..... 17

INTRODUCTION
The Franciscan Complex of California contains a number of tectono- stratigraphic terranes, each of which is characterized by general lithologic content, depositional age, structural style, metamorphic grade, and sandstone petrography. Boundaries between terranes are either clearly-defined faults or diffuse structural transitions. Most workers agree that Franciscan strata were accreted to North America as a consequence of late Mesozoic to middle Tertiary interaction with subducting oceanic plates (e.g., Jones et. al., 1978; Bachman, 1982). In detail, however, the structural history of the Franciscan Complex remains poorly understood.
The overall metamorphic history of the Franciscan Complex is fairly well known (e.g., Bailey et al., 1964; Blake et al., 1967; Ernst et al., 1970). Past studies have also provided some information on the temperatures of Franciscan metamorphism, but few details. Bachman (1979), for example, estimated the minimum depth of burial near Ft. Bragg to be roughly 4700 meters, based upon four measurements of thermal-alteration-index. X-ray diffraction data demonstrated that strata within the Central belt reached temperatures of 100 -250 C and pressures between 3 and 10 kilobars (Cloos, 1983). Several measurements of vitrinite reflectance have also been completed in the Diablo Range of central California (Bostick, 1971,1974) and between Garberville and Scotia (Fig. 1; Underwood, 1985).
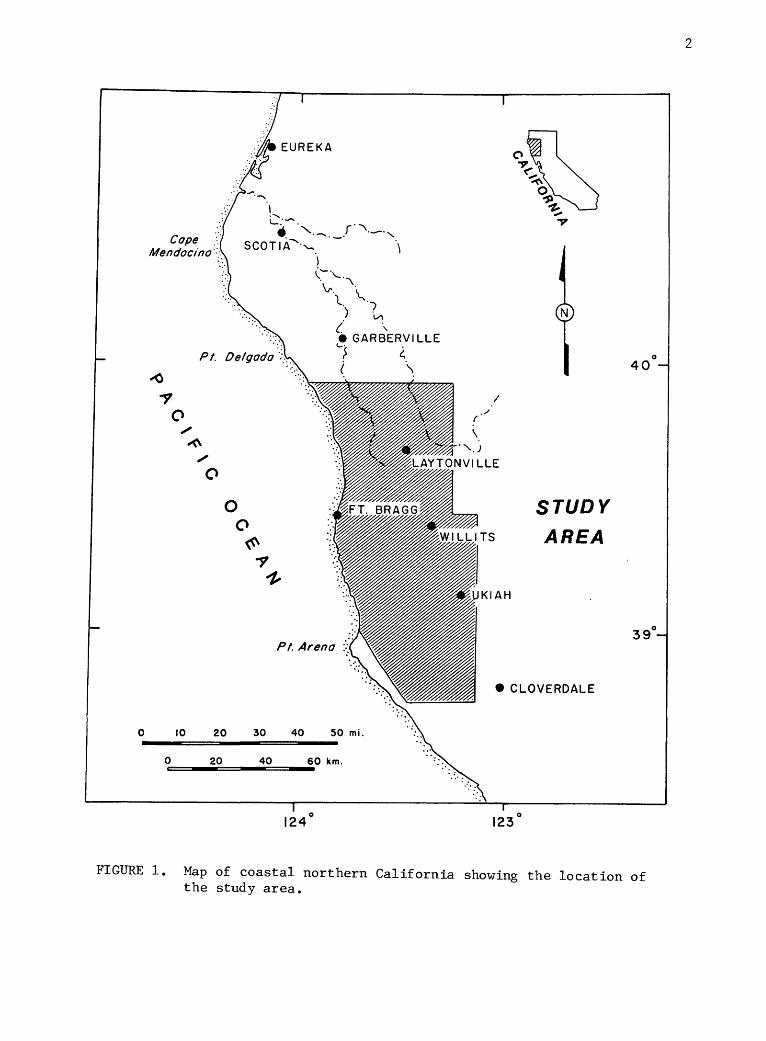
The study area discussed in this report is located in the northern Coast Ranges of California between latitudes 38 45'N and 40 00'N (Fig. 1). Previous geologic investigations within this region include those by Irwin (I960), Kleist (1974a, 1974b), Gucwa (1975), Maxwell (1974), O'Day (1974), Evitt and Pierce (1975), Kramer (1976), Bachman (1978, 1979, 1982), and Orchard (1979). The three principal tectonostratigraphic terranes (defined by Bachman and others, 1984) are the Franciscan Central belt (upper Mesozoic), the Franciscan Coastal belt (Upper Cretaceous to Oligocene), and the Yager complex (Paleocene to Oligocene) (Fig. 2).
The boundary between folded turbidites of the Yager complex and older melange of the Central belt is marked by a prominent thrust. This terrane boundary has been given several names, including the Garberville thrust (Underwood, 1982) and the Coastal belt thrust (Jones et al., 1978). Recent mapping has allowed regional differentiation of Coastal belt and Yager strata (e.g., Bachman et al., 1984; Underwood, 1985). Because the so-called Coastal belt thrust is no longer a contact which involves Coastal belt rocks, renaming of the boundary seemed appropriate, thus its new designation as the Eel River fault (Bachman et al., 1984). To the west, the Yager complex is separated from broadly coeval rocks of the Coastal belt by a diffuse structural zone called the Coastal belt transition (Underwood, 1983). This boundary is defined by a gradual change in structural style; Coastal belt turbidites display typical melange fabrics (scaly argillite, pinch-and-swell, etc.), but penetrative and pervasive strata! disruption is absent in beds of the Yager complex. Several high-angle faults are also evident within the study area, especially in the vicinity of Ukiah and Cloverdale (Irwin, 1960; Herd, 1978; Pampeyar and others, 1981; McLaughlin and Nil sen, 1982). These faults are probably strike-slip in nature, but little detailed mapping has been completed to document how such faults have affected structural relationships within the Franciscan.
EUREKA
Cape :'( Mendocino
-0 -7
A
">
Pt. Del gad a >>
GARBERVILLE 1 <i \
Pt. Arena
10 20 30 40 SO mi.
20 40 60 km.
KIAH
40 -
AREA
39-
CLOVERDALE
124 123
FIGURE 1. Map of coastal northern California showing the location of the study area.

The purpose of our study is to document levels of thermal maturity within the Franciscan terranes using the technique of vitrinite reflectance. All samples were obtained from surface exposures. Three specific goals have been identified: (1) to establish a range of thermal-maturity values for each Franciscan terrane, (2) to identify surface anomalies and/or gradients in those values, especially as related to terrane boundaries, and (3) to integrate thermal-maturity data with existing structural and stratigraphic information in order to reconstruct the history of burial.
TECHNIQUES
Vitrinite is derived from the woody tissue of vascular plants. The technique of vitrinite reflectance is based upon the empirical observation that reflectance values (Ro) in both coals and shales increase exponentially with burial depth (e.g., Dow, 1977; Bostick et. al., 1978). Ro values are probably dependent on several parameters, but maximum temperature is the most important (Price, 1983). Because geothermal gradients and sedimentation rates vary in both space and time, profiles of Ro versus depth differ for virtually every sedimentary basin.
There are several problems inherent to the technique of vitrinite reflectance. First, individual vitrinite particles are generally anisotropic in their reflectance, and this anisotropy increases exponentially with increasing Ro (Dow and 0'Connor, 1982). The effects of anisotropy are negligible below a mean Ro value of 1.0%, however, and most of the data reported here fall below this threshold. Moreover our analyses were performed on 50 randomly-oriented particles, from which a mean value was calculated. Past studies have demonstrated that this technique is both statistically sound and effective in addressing the anisotropy problem (e.g., Dow and 0'Connor, 1982; Houseknecht and Matthews, 1985).
A second problem is that mean Ro values are dependent upon the type of organic matter present. Hydrogen-rich type I organic matter, formed under anaerobic conditions, can yield mean Ro values that are significantly lower than those obtained from oxygen-rich type III kerogens (Hutton and Cook, 1980; Newman and Newman, 1982; Bostick and others, 1984; Price and Barker, 1985). Visual evaluation of kerogen type (Underwood, 1985), together with unpublished geochemical analyses, show that type III organic matter predominates in Franciscan shales. Therefore, our data are apparently not affected by this "type I suppression" of reflectance.
Because of the resistance of vitrinite to weathering, grains can be recycled from older sedimentary strata. Second cycle particles can be reset as they reach equilibrium with a subsequent burial regime, but only if peak temperatures exceed those of earlier phases of burial. Commonly, recycled material is derived from a rock unit which experienced peak temperatures higher than the present host rock. Under these circumstances, resetting will not occur, and failure to identify the recycled population will lead to calculations of mean Ro that are erroneously high. In most instances recycled grains can be recognized and eliminated during petrographic examination using morphologic criteria (see Appendix A). Recognition is also possible when data are plotted on histograms, although such techniques are somewhat subjective. According to our convention, data are eliminated from calculations of mean

124123°
COASTAL BELT TRANSITION
39-
3B-
FIGURE 2. Map of Franciscan terranes in coastal northern California, modified from Bachman et al. (1984). High-angle faults are from Herd (1978) and McLaughlin and Nilsen (1982). Fm = Franciscan Central belt, Ty = Yager complex, and Fcb = Franciscan Coastal belt.

reflectance only if the upper histogram tail is separated from the main body of data by more than 0.1% Ro (Fig. 3).
Other varieties of dispersed organic matter can sometimes be difficult to distinguish from true vitrinite, although in most instances morphologic criteria are adequate for proper identification (see Appendix A). The reflectance of vitrinite can also be modified by recent weathering at or near the ground surface (Marchioni, 1983). This problem is reduced by selecting the freshest possible samples from outcrops; moreover, most weathered grains display oxidation halos, cracks, pits, or other obvious morphologic anomalies. Once identified, these grains are simply removed from the data population. It should also be noted that actual measurements from oxidation halos yielded lower reflectance values than similar measurements made on the unaltered cores.
A final problem is related to the relatively low content of organic matter in many Franciscan samples. Organic matter was extracted and concen trated following the methods outlined in Appendix A. In several cases, however, samples proved to be virtually barren of vitrinite. Unfortunately, this problem remains unsolved, but we were able to obtain statistically reliable data from roughly 80% of the samples originally collected.
As discussed in Appendix A, we believe variations in mean reflectance of more than 0.15% are geologically significant, but there are several techniques available to model variations in thermal maturation. For example, Hood and others (1975) proposed a time-temperature model based upon the concepts of maximum temperature and effective heating time (i.e., the amount of time a given rock unit remains within 15 C of T-max). Recent studies, however, have challenged the validity of this method, especially at low levels of thermal maturation (Suggate, 1982). A second technique, termed the Lopatin method (Waples, 1980), requires a detailed reconstruction of burial-depth versus geologic age, usually for a series of stratigraphic horizons. Because there are many uncertainties related to Franciscan burial history, Lopatin reconstructions seem inappropriate for our study. Moreover, Barker (1983) and Price (1983) provided convincing evidence that equilibration of reflectance occurs within 10 to 10 years and that additional time has little or no effect on reflectance valves. Correlations between vitrinite reflectance and maximum temperature (e.g., Price, 1983) allow the technique to used as an absolute paleogeothermometer.
It should be noted that the primary intent of our study is to focus on relative differences in thermal maturity rather than absolute values of either paleotemperature or burial depth. Nevertheless, burial depths can also be calculated once a selection is made for the past geothermal gradient. The choice of a proper temperature gradient is problematic. Most measurements of present-day surface heat-flow within the study area range from 1.2 to 1.8 HFU, where 1 HFU = 10 cal/cm -sec (Lachenbruch and Sass, 1980). Using the standard heat flow equation (q = K dT/dx) and a thermal conductivity of 610" cal/cm-s- C, the present-day geothermal gradient is thus between 20 C/km
and 30 C/km. Changes in the geothermal gradient through Cenozoic time are difficult to assess. However, assuming that subduction-accretion models for the Franciscan Complex (e.g., Bachman, 1982; Underwood, 1985) are basically correct, modern accretionary margins such as Oregon-Washington and the Aleutian forearc can also serve as effective analogs. Temperature gradients

en oz
to-
Q
LU 5
02 0.4 0.6 0.8
Ro (%)1.0 1.2
en 10o
0
UJ 5o: -
r
_
|MHMB
M
Re eye
! 0.2 04 0.6 OB 1.0 1.2 1.4
Ro (%)
FIGURE 3. Histograms showing the distribution of reflectance valuesfor two samples from the Franciscan Coastal belt. Sample A displays a normal (Gaussian) distribution; recycled grains are not evident. Sample B contains particles with distinctly higher Ro values; such particles are probably recycled and are therefore removed from calculations of mean reflectance.

for these localities range from 8.3 C to 22.7 C/km (Blackwell and others, 1982; McCarthy and others, 1984). Consequently, we believe a gradient of 22.5 C/km is geologically reasonable for the Franciscan, especially for the purpose of calculating relative changes in burial depth.
RESULTS
Coastal beltForty-one samples collected from the Franciscan Coastal belt contain
sufficient vitrinite for reflectance measurements (Appendix B). Mean reflectance ranges from 0.40% to 1.07%, and the average mean reflectance is 0.63% (Fig. 4). According to the Price (1983) model, these values correspond to paleotemperatures of 68 C to 195 C and an average temperature of 125 C (Fig, 4).
There are several spatial trends in thermal maturity within the Coastal belt. The highest values occur east of the towns of Fort Bragg and Mendocino (Fig. 5, Fig. 6), where three prominent anomalies are evident. Contour plots of mean Ro show that three highs are discontinuously distributed along a N-NW trend and clearly separated by intervening lows (Fig. 7, Fig. 8). There is also a general pattern of increasing reflectance from east to west, although this trend is broken along the coast immediately south of Mendocino (Fig. 7, Fig. 8). There are no systematic variations in thermal maturity from south to north, as most iso-reflectance contours are at least subparallel to the structural grain. Consequently, most of the variations in reflectance appear to be controlled by the structural architecture.
If the documented levels of thermal maturation are a consequence of structural and/or stratigraphic burial (but not shear heating), the depths of burial for the Coastal belt range from 2577 meters to 8220 meters (assuming a surface temperature of 10 C and a geothermal gradient of 2.25 C/100 m). The average burial depth is 5111 meters. It is possible, however, that some additional heat was generated locally by friction along fault surfaces. The anomaly located east of Mendocino is particularly suspicious (Fig. 7), because the mean reflectance apparently changes from 0.53% to 1.07% over a distance of roughly one kilometer; west of the high the mean reflectance decreases again to 0.75%. The maximum variation in paleotemperature is thus 90 C (Fig. 4). If this anomaly is due to variations in burial depth alone, then approximately 4000 meters of differential uplift and erosion is seemingly required. Moreover, because the high value is bound on both sides by relative lows, the uplift would have to involve either complex fault geometries or a diapiric rise. As an alternative hypothesis, the localized elevation of temperature could be due to shear heating along a previously unrecognized fault surface (e.g., Scholz, 1980; Bustin, 1983).
Yager ComplexThirty samples from the Yager complex were measured for vitrinite
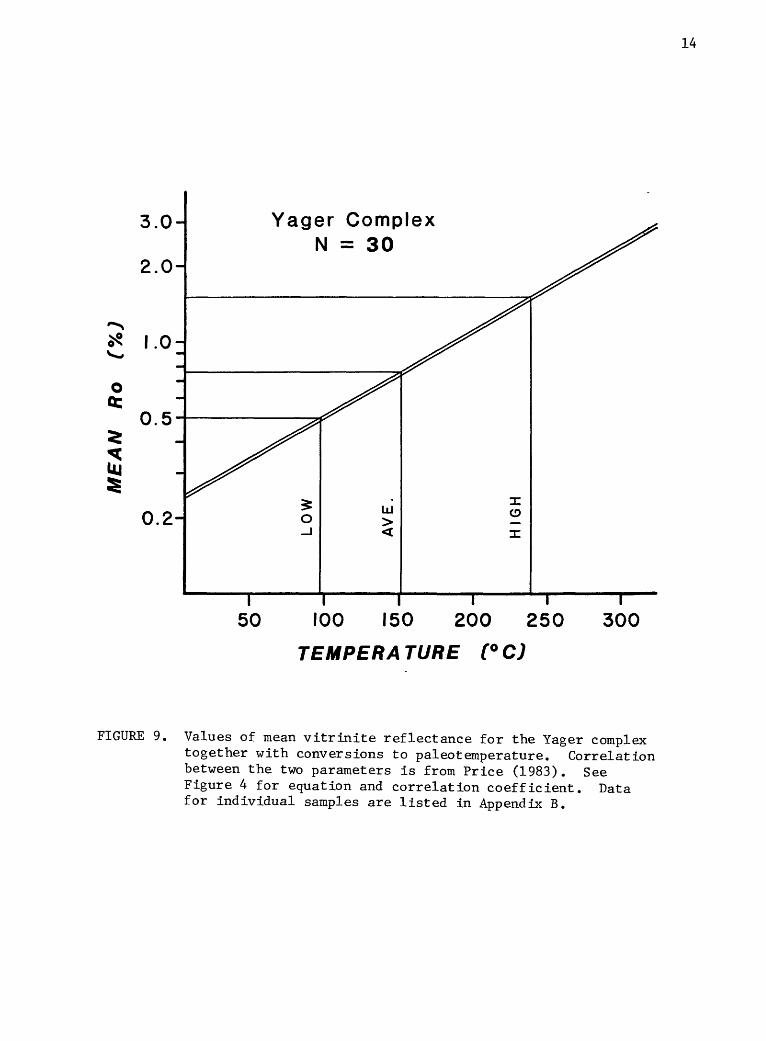
reflectance (Appendix B). The mean values range from 0.50% to 1.50%, and the average mean reflectance is 0.76% (Fig. 9), The estimates of maximum paleotemperature vary between 97 C and 238 C, and the average paleotemperature is 150 C (Fig. 9). Again assuming that organic metamorphism is simply related to depth of burial, the minimum and maximum depths are 3866 meters and 10,133 meters, respectively, and the average depth is 6222 meters.

3.0-
2.0-
o Qc
uj §
0.5-
0.2-
Coastal Belt N = 41
IOO ISO 200 250
TEMPERA TURE (° CJ
300
FIGURE 4. Range in values of mean vitrinite reflectance for the Franciscan Coastal belt. Conversion of the Ro values to paleotemperatures follows the relationship established by Price (1983). Equation for the line isT = 302.971og10Ro + 187.33, and the correlation coefficient is r = 0.97. Data for individual samples are listed in Appendix B.

I23°45'i
1-0.83 V~°
MENDOCINO
0.66,0.54,0.77
0.45 075 *°.53
0.52,* .0.54 \ Ty n *;«; \
\ \D BOONVILLE
FIGURE 5. Map of the southern half of the study area showing sample localities and corresponding values of mean vitrinite reflectance. Fm = Franciscan Central belt, Ty = Yager complex, and Fcb = Franciscan Coastal belt. Terrane boundaries are based upon data from Irwin (1960), Bachman (1982), Orchard (1979), and reconnaissance mapping by Underwood.
10
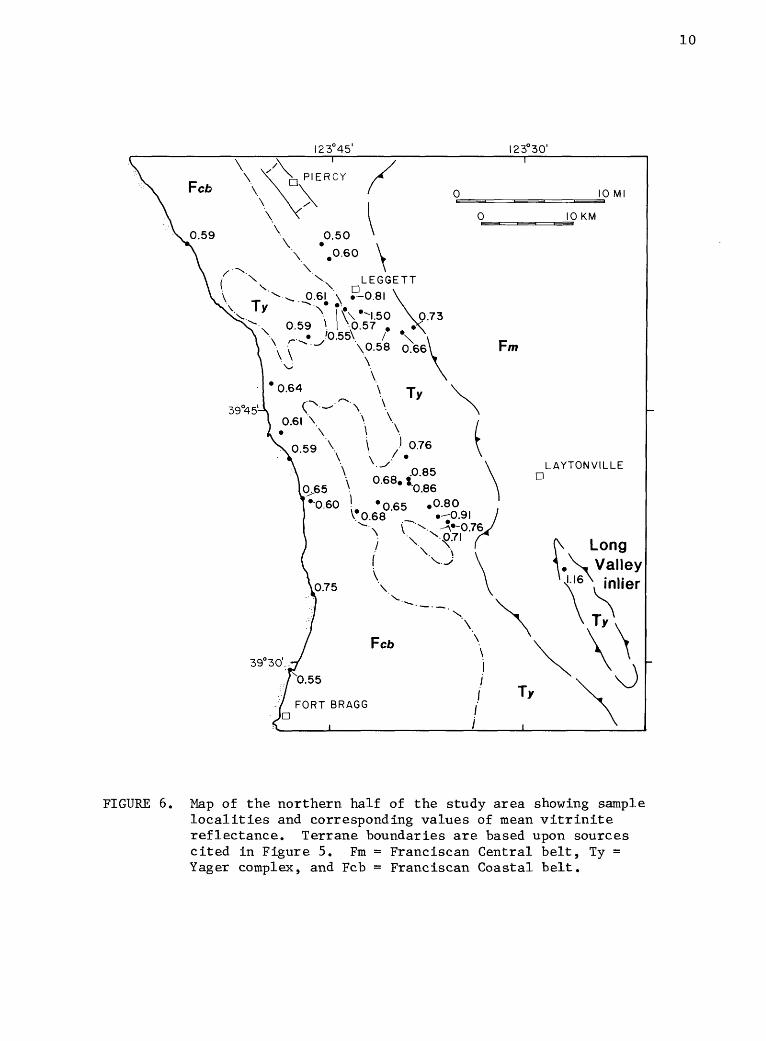
FIGURE 6. Map of the northern half of the study area showing sample localities and corresponding values of mean vitrinite reflectance. Terrane boundaries are based upon sources cited in Figure 5. Fm = Franciscan Central belt, Ty = Yager complex, and Fcb = Franciscan Coastal belt.

11
FIGURE /. Contour map of mean vitrinite reflectance for the southern half of the study area. See Figure 5 for actual Ro values and sources of geologic data. High-angle faults are taken from McLaughlin and Nilsen (1982) and Pampeyan et al. (1981) Interval for iso-reflectance lines is 0.1%Ro.

12
\ \ \ / o. \ \
FIGURE 8. Contour map of mean vitrinite reflectance for the northern half of the study area. See Figure 6 for actual Ro values and sources of geologic data. High-angle faults are from Pampeyan et al. (1981) and McLaughlin and Nilsen (1982). Interval for iso-reflectance lines is 0.1%Ro.
13
The spatial variations in thermal maturity within the Yager complex are rather complicated. South of Will its the values tend to increase from east to west (Fig. 7). This pattern is interrupted immediately southwest of Willits where iso-reflectance contours trend east-west, at a high angle to the regional structural grain within the Yager. North of this zone the contours are again sub-parallel to the structural grain, but between Will its and Piercy the reflectance systematically decreases from east to west (Fig. 8). This trend is anomalous because the level of maturation increases up stratigraphic section (see Bachman 1982 for structural data). The observed decrease in mean Ro from east to west has also been documented north of 40 N, where burial of the Yager section has been attributed to underthrusting along the Eel River fault (O'Leary et. al., 1984; Underwood, 1985). This model is favored because the younger Neogene section (Wildcat Group) is not thick enough to produce the observed reflectance values using any reasonable geothermal gradient (Underwood, 1985). The same arguments can be applied to the section between Piercy and Willits, and the systematic east-to-west reduction in maturity is probably due to a wedging out of the hanging wall of the Eel River fault. Obviously, the pattern established south of Will its cannot be explained in this manner. We believe additional structural mapping and reflectance measurements are required in that region before a definitive interpretation can be made.
Two isolated anomalies are also evident within the Willits-Piercy corridor. The first is associated with the Long Valley inlier south of Laytonville, where the mean vitrinite reflectance reaches a high of 1.16%; an even more impressive anomaly is found near Leggett, where the mean Ro is 1.50% (Fig. 6). Frictional heating is likely in the case of the Long Valley anomaly, because the sample locality is immediately adjacent to the Eel River fault. Similar anomalies have been documented along the same terrane boundary farther north in Humboldt County (Underwood, 1985). The locality at Long Valley also lies within Maacama fault zone, a zone of Quaternary right-lateral strike-slip movement (Herd, 1978; Pampeyan et al., 1981; McLaughlin and Nilsen, 1982).
The Leggett anomaly is not immediately adjacent to a mapped thrust, but because of its magnitude (1.50% Ro to 0.57% Ro over a distance of about 1.7 km), it appears unrealistic to attribute the anomaly to a simple change in burial depth. The temperature variation is 123 C (according to the Price method), which would require differential burial of 5466 meters. Strike-slip faulting may have caused this anomaly. Perhaps a fault sliver containing more mature strata has been emplaced along the Maacama fault zone. However, it seems unlikely that temperatures of such magnitude could be produced by shear heating near the surface of a Quaternary strike-slip fault. The Leggett anomaly certainly deserves additional attention to better define its spatial extent and its genetic relationship to all faults mapped within the vicinity.
Central beltDnly three samples from the Central belt melange have been analyzed
(Appendix B). The mean reflectance for the sample collected south of Boonville (Fig. 5) is 0.55%; this value is slightly lower than for the Coastal belt samples which surround it (0.62% and 0.65%). West of Willits, a scaly argillite was collected immediately east of the Eel River fault (Fig. 5); this sample yielded a mean Ro value of 0.79%, which is nearly the same as the Yager
14
3.0
2.0
Yager Complex N = 30
i 50 100 150 200 250
TEMPERA TURE (° C)
300
FIGURE 9. Values of mean vitrinite reflectance for the Yager complex together with conversions to paleotemperature. Correlation between the two parameters is from Price (1983). See Figure 4 for equation and correlation coefficient. Data for individual samples are listed in Appendix B.

15
shale collected just west of the terrane boundary (mean Ro = 0.76%). A third sample from east of Long Valley produced a mean Ro of 1.21%.
These data are obviously insufficient for characterizing the entire Central belt terrane. Nevertheless, they do demonstrate that temperatures within the terrane were at least locally depressed. According to the Price method, the reflectance values correspond to temperatures of 110 C to 212 C.
The temperature estimates are not unexpected, considering the melange matrix locally contains lower blueschist-facies mineral assemblages, with temperature stabilities of 100 C to 250 C (Cloos, 1983). These data tend to confirm the hypothesis which attributes melange genesis to tectonic mixing within an accretionary prism (Cowan, 1985). It has long been postulated that isotherms are significantly depressed within accretionary complexes because of the underthrusting of cold oceanic crust (e.g., Ernst, 1970). Moreover, the circulation of pore fluids through an accretionary wedge probably also acts to depress temperatures (e.g., von Huene and Lee, 1982; Cloos, 1984). Our vitrinite data simply add credence to these views.
SUMMARY
Estimates of paleotemperature within the Franciscan Coastal belt range from 68 C to 195 C, and the average temperature was 125 C. Temperature estimates for the Yager complex are slightly higher; the range is 97 C to 238 C, and the average is 150 C. Several prominent anomalies are evident within both terranes. In the Coastal belt these anomalies could be due to either melange diapirs or frictional heating along unrecognized faults. The anomalies within the Yager complex were probably caused by shear heating along the Eel River fault or along one of the several high-angle faults present in the area. The typical Yager trend of decreasing thermal maturity from east to west can be explained by wedging of the hanging wall of the Eel River fault, and the high burial depths required for the Yager complex are attributed to underthrusting along this same terrane boundary. Although data are sparse, temperatures within the Central belt melange were apparently subdued, ranging between 110 C and 212 C; these data support the contention that temperatures are significantly depressed during the genesis of blueschist-facies melange terranes.
16
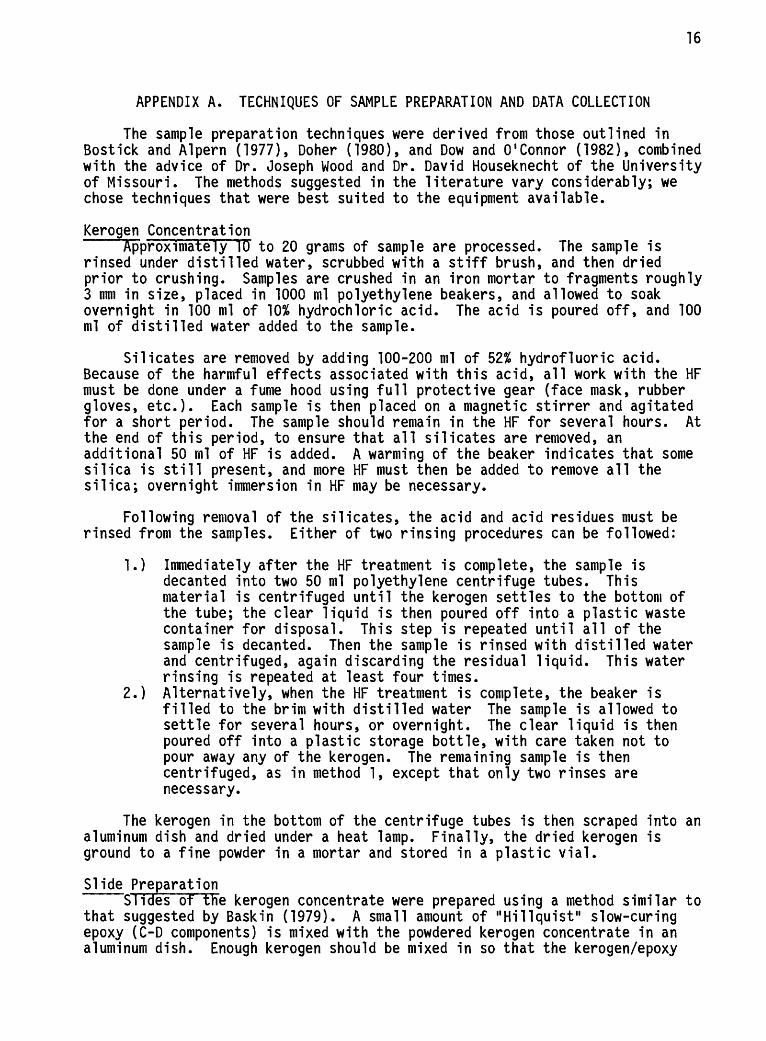
APPENDIX A. TECHNIQUES OF SAMPLE PREPARATION AND DATA COLLECTION
The sample preparation techniques were derived from those outlined in Bostick and Alpern (1977), Doher (1980), and Dow and O'Connor (1982), combined with the advice of Dr. Joseph Wood and Dr. David Houseknecht of the University of Missouri. The methods suggested in the literature vary considerably; we chose techniques that were best suited to the equipment available.
Kerogen Concentration'Approximately 10 to 20 grams of sample are processed. The sample is
rinsed under distilled water, scrubbed with a stiff brush, and then dried prior to crushing. Samples are crushed in an iron mortar to fragments roughly 3 mm in size, placed in 1000 ml polyethylene beakers, and allowed to soak overnight in 100 ml of 10% hydrochloric acid. The acid is poured off, and 100 ml of distilled water added to the sample.
Silicates are removed by adding 100-200 ml of 52% hydrofluoric acid. Because of the harmful effects associated with this acid, all work with the HF must be done under a fume hood using full protective gear (face mask, rubber gloves, etc.). Each sample is then placed on a magnetic stirrer and agitated for a short period. The sample should remain in the HF for several hours. At the end of this period, to ensure that all silicates are removed, an additional 50 ml of HF is added. A warming of the beaker indicates that some silica is still present, and more HF must then be added to remove all the silica; overnight immersion in HF may be necessary.
Following removal of the silicates, the acid and acid residues must be rinsed from the samples. Either of two rinsing procedures can be followed:
1.) Immediately after the HF treatment is complete, the sample is decanted into two 50 ml polyethylene centrifuge tubes. This material is centrifuged until the kerogen settles to the bottom of the tube; the clear liquid is then poured off into a plastic waste container for disposal. This step is repeated until all of the sample is decanted. Then the sample is rinsed with distilled water and centrifuged, again discarding the residual liquid. This water rinsing is repeated at least four times.
2.) Alternatively, when the HF treatment is complete, the beaker is filled to the brim with distilled water The sample is allowed to settle for several hours, or overnight. The clear liquid is then poured off into a plastic storage bottle, with care taken not to pour away any of the kerogen. The remaining sample is then centrifuged, as in method 1, except that only two rinses are necessary.
The kerogen in the bottom of the centrifuge tubes is then scraped into an aluminum dish and dried under a heat lamp. Finally, the dried kerogen is ground to a fine powder in a mortar and stored in a plastic vial.
Slide PreparationSlides of the kerogen concentrate were prepared using a method similar to
that suggested by Bask in (1979). A small amount of "Hillquist" slow-curing epoxy (C-D components) is mixed with the powdered kerogen concentrate in an aluminum dish. Enough kerogen should be mixed in so that the kerogen/epoxy

17
mixture becomes very viscous but retains a smooth texture. This mixture is allowed to set for 15 minutes.
While the epoxy is setting, one side of a petrographic slide is frosted (using a coarse grit) and thoroughly dried to ensure that the epoxy will adhere to the slide. Also, an additional batch of epoxy, without kerogen added, is prepared and set aside. Small drops of this epoxy are placed on the corners of each slide as a last step, before the slides are cured. These drops prevent the kerogen/epoxy pellet from being pulled off during polishing.
Following the drying of the slide, a two-centimeter diameter pellet of the partially-set kerogen/epoxy mixture is applied to the center of the frosted slide. This must cure for an additional 30 minutes at room temperature on a perfectly horizontal surface. The finished slide is then placed on a warming tray and cured at between 30 to 40 degrees Celsius for an additional 24 to 48 hours. The recommended curing temperature for the epoxy is 82 degrees Celsius; but we found that many of the slides cracked at that temperature because of rapid curing. Heating at such temperatures could conceivably alter reflectance values as well.
Slide PolishingThe first step in polishing the slides is to cut a flat, even surface on
the epoxy pellet. We found this was best accomplished using a thin-section grinding wheel, slowly and evenly grinding the pellet down to a thickness of 1 mm. The resulting surface is then polished on a standard lap using a Buehler "Petrothin" attachment and Buehler "Texmet" lap cloths. The succession of grit sizes used is as follows: 3-micron diamond paste for approximately 10 minutes, 0.3-micron alumina slurry for 20 minutes, 0.05-micron alumina slurry for up to 20 minutes. The slides must be cleaned between each step using an ultrasonic cleaner and soap, and then quickly dried (to avoid "swelling" of some organic matter, which can ruin the polish). At the end of the polishing sequence, the epoxy pellet should have a uniform glassy surface, and the vitrinite should have very few scratches when viewed at high magnification. The slides must be stored in a dessicator for at least 1 hour prior to observation in order to remove any remaining moisture. This drying step is important because moisture content can affect Ro values (Suggate and Lowery, 1982).
Data CollectionObservations in reflected light were made using a 50x oil-immersion lens
and a 16x ocular mounted on a Leitz Ortholux research microscope set up in the reflected light mode. A Keithly 244 high-voltage power supply and a Hewlett- Packard direct-current power supply were used to provide stable power to the photometer and the light source, respectively. Reflected light was directed from a 70-micron diameter measuring spot to a Leitz MPV-1 photometer, and the Ro value was read on a Keithly 177 Microvolt digital voltmeter.
It is important to properly select vitrinite particles in order to obtain correct mean Ro values. The first step is to distinguish vitrinite from the other material present. Liptinite (pollen grains and waxy plant material) and inertinite (pre-altered plant-material) can resemble vitrinite and are the only materials likely to be confused with it. Liptinite has a lower reflectance than associated vitrinite, a darker color, and distinctive morphology. Inertinite usually is much more reflective than associated

18
vitrinite, and often has a distinctive shape. However, some forms of inertinite closely resemble vitrinite and have reflectance values that vary continuously from the vitrinite into the inertinite range.
In coal petrography, distinguishing vitrinite from liptinite and inertinite is straightforward, because all types are visible in the same microscope field; this allows direct comparisons of reflectance and structure. In organic concentrates from detrital rocks, however this cannot always be accomplished. Especially in rocks with low contents of organic matter (such as the Franciscan shales), the organic particles are small and widely- dispersed across the prepared slide. It is possible to reliably distinguish most of the liptinite and inertinite and eliminate them from the sample population; nevertheless the remaining population includes "first-cycle" vitrinite (from which the "real" mean Ro value should be calculated), "pre- altered" vitrinite (e.g., weathered, oxidized , or recycled from a more mature source terrane), and some types of inertinite (Bostick, 1971). Any particles that have rounded edges were eliminated from the data because of the likelihood of recycling. In addition, particles that display numerous pits, cracks, or mineralization were regarded as weathered or oxidized and eliminated from the data.
The usual method of choosing particles for measurement is to select the "least-altered" or "low-gray" particles within the assumed vitrinite population (e.g. Bostick, 1971). When many particles are within the microscope field, this is a straightforward procedure, but it is more difficult and uncertain with widely-dispersed fragments. Moreover, a bias towards an expected Ro value could cause the microscopist to favor particles nearest to that expected value. (To prevent any possible bias in this study, the microscopist (O'Leary) did not know the location or significance of any sample until after the mean Ro was reported.)
Our identification of "first-cycle" vitrinite relied upon several characteristics. By examining coals of know rank, we found the following parameters to be useful in selecting vitrinite within the range of Ro values encountered in this study: (1) little or no relief (the various types of inertinite have slight to strong positive relief), (2) high susceptibility to scratching (inertinite is often much more resistant to scratching), (3) somewhat rough-look ing surface with many fine cracks (inertinite usually has a smooth surface), (4) distinctive gray color (liptinites appear blacker, inertinites are more white, or even yellowish), (5) botanical structures (though sometimes seen in inertinites, these were regarded as confirming vitrinite selection if they fell within the selected population).
In some of our samples, many vitrinite particles contain pyrite mineralization, easily identified by its high reflectance and brass color. Believing that such vitrinite was altered, reflectance measurements from such vitrinite were not included in the data presented here. However, Bostick (1985, written communication) stated that vitrinite containing pyrite is an excellent indicator of first-cycle, least-altered vitrinite. By re-checking samples, we have confirmed that vitrinite containing pyrite falls within the first-cycle population as determined using morphologic criteria.
19
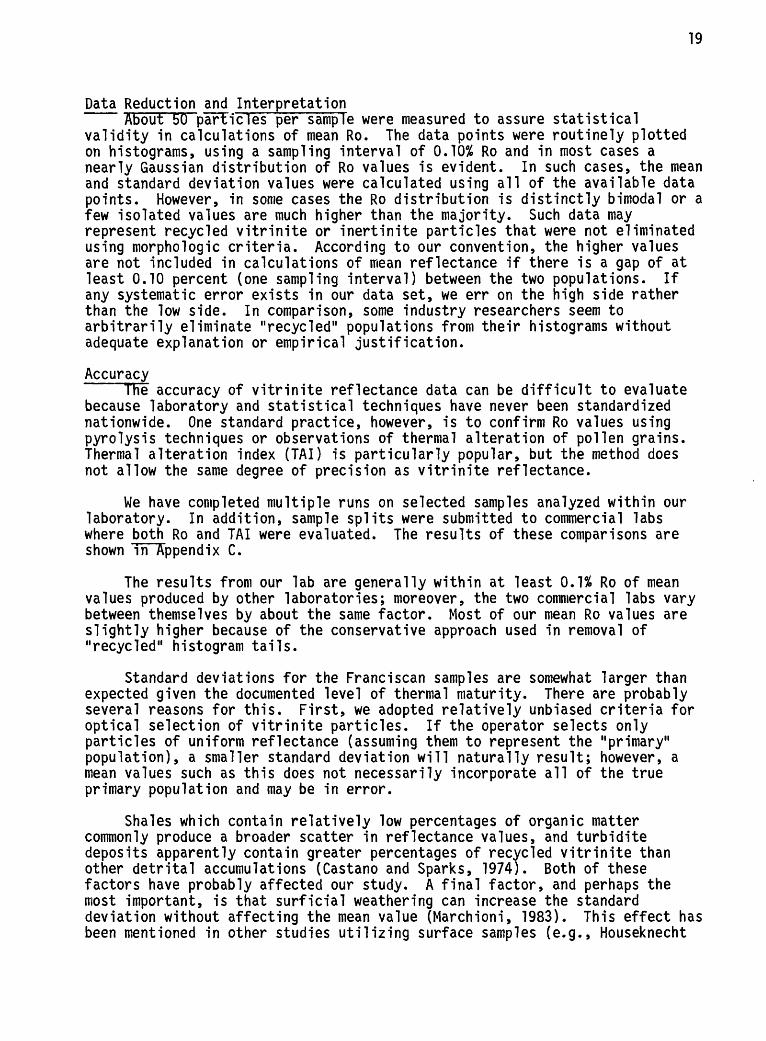
Data Reduction and InterpretationAbout 50 particles per sample were measured to assure statistical
validity in calculations of mean Ro. The data points were routinely plotted on histograms, using a sampling interval of 0.10% Ro and in most cases a nearly Gaussian distribution of Ro values is evident. In such cases, the mean and standard deviation values were calculated using all of the available data points. However, in some cases the Ro distribution is distinctly bimodal or a few isolated values are much higher than the majority. Such data may represent recycled vitrinite or inertinite particles that were not eliminated using morphologic criteria. According to our convention, the higher values are not included in calculations of mean reflectance if there is a gap of at least 0.10 percent (one sampling interval) between the two populations. If any systematic error exists in our data set, we err on the high side rather than the low side. In comparison, some industry researchers seem to arbitrarily eliminate "recycled" populations from their histograms without adequate explanation or empirical justification.
AccuracyTFve accuracy of vitrinite reflectance data can be difficult to evaluate
because laboratory and statistical techniques have never been standardized nationwide. One standard practice, however, is to confirm Ro values using pyrolysis techniques or observations of thermal alteration of pollen grains. Thermal alteration index (TAI) is particularly popular, but the method does not allow the same degree of precision as vitrinite reflectance.
We have completed multiple runs on selected samples analyzed within our laboratory. In addition, sample splits were submitted to commercial labs where both Ro and TAI were evaluated. The results of these comparisons are shown in Appendix C.
The results from our lab are generally within at least O.U Ro of mean values produced by other laboratories; moreover, the two commercial labs vary between themselves by about the same factor. Most of our mean Ro values are slightly higher because of the conservative approach used in removal of "recycled" histogram tails.
Standard deviations for the Franciscan samples are somewhat larger than expected given the documented level of thermal maturity. There are probably several reasons for this. First, we adopted relatively unbiased criteria for optical selection of vitrinite particles. If the operator selects only particles of uniform reflectance (assuming them to represent the "primary" population), a smaller standard deviation will naturally result; however, a mean values such as this does not necessarily incorporate all of the true primary population and may be in error.
Shales which contain relatively low percentages of organic matter commonly produce a broader scatter in reflectance values, and turbidite deposits apparently contain greater percentages of recycled vitrinite than other detrital accumulations (Castano and Sparks, 1974). Both of these factors have probably affected our study. A final factor, and perhaps the most important, is that surficial weathering can increase the standard deviation without affecting the mean value (Marchioni, 1983). This effect has been mentioned in other studies utilizing surface samples (e.g., Houseknecht

20
and Matthews, 1985), but would remain insignificant in studies of subsurface samples (i.e., cores and well cuttings).
In conclusion, even though there are several inherent problems involving selection criteria and statistical treatment of vitrinite-reflectance data, our results are reproducible to at least +_ 0.10% Ro. Furthermore, we believe any change in mean reflectance of more than 0.15% Ro is geologically significant.

21
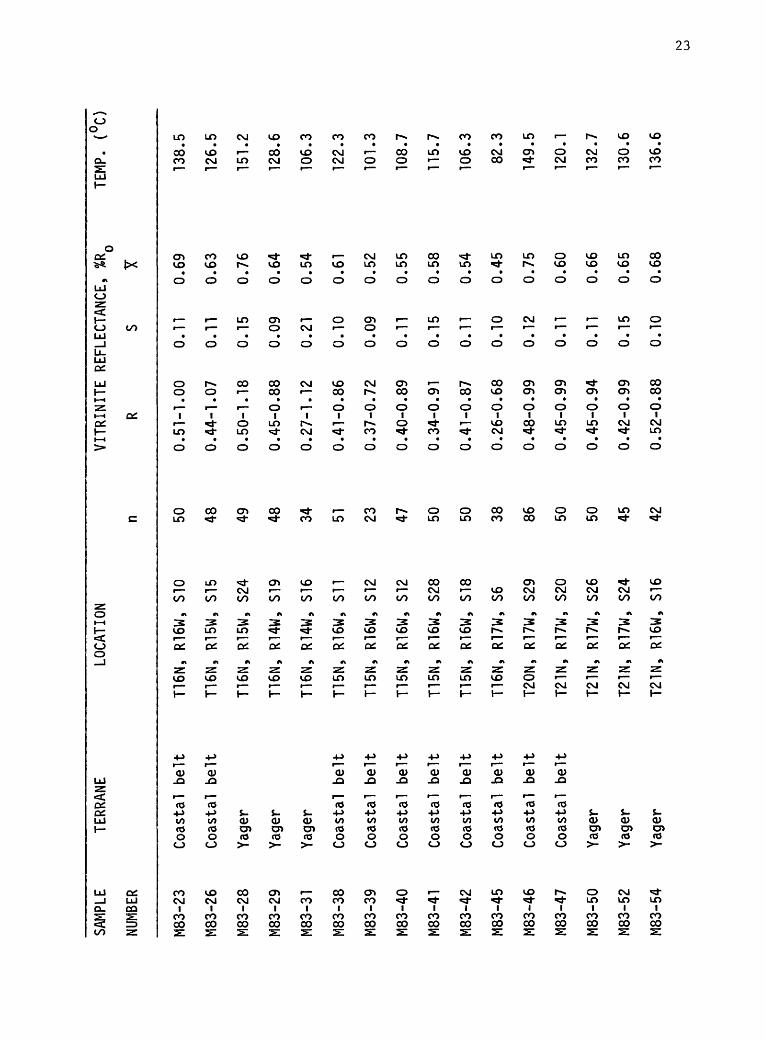
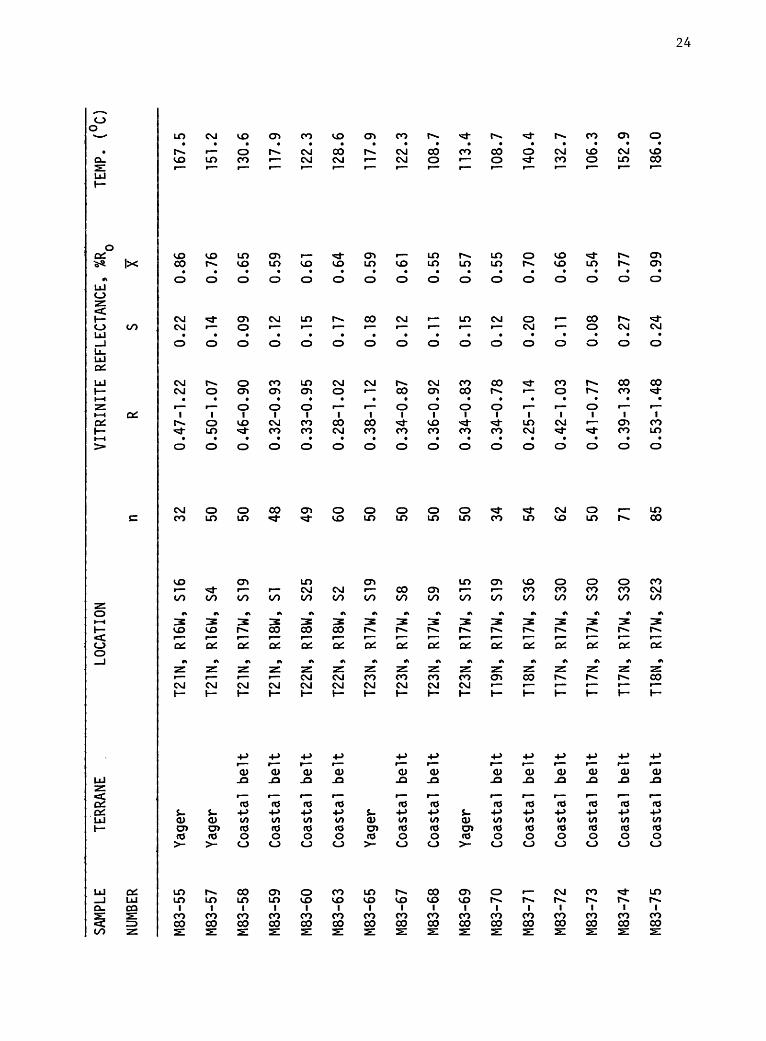
APPENDIX B. TABULATION OF VITRINITE REFLECTANCE DATA
Key
Location - given in coordinates of township, range, section.
n = number of measurements in data population associated with a particular sample
R = range in random reflectance readings for a particular sample
S = standard deviation
Y = arithmetic mean
Temp = estimated paleotemperature in °C, based upon the correlation between vitrinite reflectance and temperature established by Price (1983)

SAMPLE
NUMB
ER
M83-2
M83-3
M83-4
M83-6
M83-
8
M83-9
M83-
10
M83-12
M83-
13
M83-14
M83-15
M83-16
M83-18
M83-
20
M83-
21
M83-22
TERR
ANE
Coastal
Cent
ral
Coas
tal
Coas
tal
Coas
tal
Coas
tal
Coas
tal
Coas
tal
Coas
tal
Coas
tal
Coas
tal
Coas
tal
Coas
tal
Coas
tal
Coas
tal
Coas
tal
belt
belt
belt
belt
belt
belt
belt
belt
belt
belt
belt
belt
belt
belt
belt
belt
LOCATION
T12N,
T12N,
T12N,
T12N,
T13N,
T13N,
T13N,
T13N,
T13N,
T14N,
T14N,
T15N,
T15N,
T16N,
T17N,
T16N,
R13W,
R13W,
R13W,
R13W,
R15W,
R15W,
R15W,
R15W,
R14W,
R15W,
R15W,
R16W,
R17W,
R16W,
R16W,
R16W,
S8 S7 S18
S18
S3!
S26
S25
S13
S8 sn S7 S35
S4 S6 S33
S4
n 49 78 37 46 49 22 100 58 50 49 53 40 50 51 50 39
VITR
INIT
E RE
FLEC
TANC
E, %R
Q
R S
Y
0.46-0
0.31-0
0.48
-0
0.27-0
0.55-1
0.43
-0
0.32
-1
0.29
-0
0.33
-0
0.22
-0
0.27
-0
0.37-1
0.33-0
0.49-0
0.73
-1
0.34
-0
.82
.86
.90
.62
.17
.87
.30
.94
.66
.72
.79
.00
.98
.93
.51
.88
0.09
0.10
0.12
0.09
0.16
0.11
0.21
0.16
0.08
0.10
0.15
0.18
0.13
0.10
0.20
0.11
0.62
0.55
0.66
0.46
0.83
0.69
0.69
0.56
0.52
0.40
0.52
0.69
0.54
0.75
1.07
0.53
TEMP
. (u
)
124.
4
108.
7
132.7
85.2
162.
8
138.5
138.5
m.o
101.3
66.8
101.
3
138.5
106.3
149.5
196.2
103.
8
SAMP
LE
NUMB
ER
M83-
23
M83-
26
M83-
28
M83-
29
M83-
31
M83-
38
M83-
39
M83-40
M83-
41
M83-42
M83-
45
M83-
46
M83-
47
M83-
50
M83-52
M83-
54
TERRANE
Coas
tal
Coas
tal
Yager
Yager
Yager
Coas
tal
Coas
tal
Coas
tal
Coas
tal
Coas
tal
Coas
tal
Coas
tal
Coas
tal
Yager
Yager
Yager
belt
belt
belt
belt
belt
belt
belt
belt
belt
belt
LOCA
TION
T16N,
T16N,
T16N,
T16N,
T16N,
T15N,
T15N,
T15N,
T15N,
T15N,
T16N,
T20N,
T21N,
T21N,
T21N,
T21N,
R16W,
R15W,
R15W,
R14W,
R14W,
R16W,
R16W,
R16W,
R16W,
R16W,
R17W,
R17W,
R17W,
R17W,
R17W,
R16W,
S10
S15
S24
S19
S16
sn S12
S12
S28
S18
S6 S29
S20
S26
S24
S16
n 50 48 49 48 34 51 23 47 50 50 38 86 50 50 45 42
VITR
INIT
E REFLECTANCE, %R
Q
R Si
0. 0. 0. 0. 0. 0. 0. 0. 0. 0. 0. 0. 0. 0. 0. 0.
51-1
.00
44-1.07
50-1
.18
45-0.88
27-1
.12
41-0.86
37-0
.72
40-0.89
34-0.91
41-0
.87
26-0
.68
48-0.99
45-0
.99
45-0
.94
42-0.99
52-0
.88
0.11
0.11
0.15
0.09
0.21
0.10
0.09
0.11
0.15
0.11
0.10
0.12
0.11
0.11
0.15
0.10
0.69
0.63
0.76
0.64
0.54
0.61
0.52
0.55
0.58
0.54
0.45
0.75
0.60
0.66
0.65
0.68
TEMP.
(°C)
138.5
126.5
151.2
128.6
106.3
122.3
101.3
108.7
115.7
106.3
82.3
149.5
120.1
132.7
130.6
136.6
SAMP
LE
NUMB
ER
M83-55
M83-57
M83-58
M83-59
M83-60
M83-
63
M83-
65
M83-67
M83-
68
M83-
69
M83-
70
M83-71
M83-
72
M83-
73
M83-
74
M83-
75
TERRANE
Yager
Yager
Coas
tal
Coastal
Coas
tal
Coas
tal
Yager
Coas
tal
Coas
tal
Yager
Coas
tal
Coas
tal
Coastal
Coas
tal
Coas
tal
Coas
tal
belt
belt
belt
belt
belt
belt
belt
belt
belt
belt
belt
belt
LOCATION
T21N,
T21N,
T21N,
T21N,
T22N,
T22N,
T23N,
T23N,
T23N,
T23N,
T19N,
T18N,
TUN,
T17N,
TUN,
T18N,
R16W,
R16W,
R17W,
R18W,
R18W,
R18W,
R17W,
R17W,
R17W,
R17W,
R17W,
R17W,
R17W,
R17W,
R17W,
R17W,
S16
S4 S19
SI S25
S2 S19
S8 S9 S15
S19
S36
S30
S30
S30
S23
n 32 50 50 48 49 60 50 50 50 50 34 54 62 50 71 85
YITR
INIT
E RE
FLEC
TANC
E, %R
Q
R S
X"
0.47-1
0.50-1
0.46
-0
0.32
-0
0.33
-0
0.28-1
0.38-1
0.34
-0
0.36-0
0.34
-0
0.34
-0
0.25-1
0.42-1
0.41
-0
0.39-1
0.53-1
.22
.07
.90
.93
.95
.02
.12
.87
.92
.83
.78
.14
.03
.77
.38
.48
0.22
0.14
0.09
0.12
0.15
0.17
0.18
0.12
0.11
0.15
0.12
0.20
0.11
0.08
0.27
0.24
0.86
0.76
0.65
0.59
0.61
0.64
0.59
0.61
0.55
0.57
0.55
0.70
0.66
0.54
0.77
0.99
TEMP.
(°C)
167.5
151.2
130.6
117.9
122.3
128.6
117.9
122.3
108.7
113.4
108.7
140.4
132.7
106.3
152.9
186.0
ro

SAMP
LE
NUMB
ER
M83-76
M83-77
M83-
78
M83-79
M83-80
M83-
81
M83-82
M83-83
M83-84
M83-85
M83-
86
M83-87
M83-88
M83-89
M83-
90
M83-91
TERR
ANE
Coas
tal
belt
Coas
tal
belt
Coas
tal
belt
Yager
Yager
Yager
Yager
Yager
Yager
Yager
Cent
ral
belt
Yager
Yager
Yager
Yager
Yager
LOCATION
T18N,
TUN,
T17N,
TUN,
TUN,
TUN,
TUN,
T18N,
T18N,
T18N,
T18N,
T20N,
T21N
,
T21N,
T21N,
T21N,
RUN,
R16W,
R16W,
R15W,
R15W,
R15W,
R15W,
R15W,
R15W,
R14W,
R14W,
R14W,
R16W,
R16W,
R16W,
R16W,
S25
S5 S4 S7 S9 S10
sn S35
S25
S19
S19
S18
S36
S25
S23
S9
n 50 49 49 70 48 50 50 60 25 58 48 67 48 50 50 50
VITR
INIT
E REFLECTANCE, %R
Q
R SI
0.42
-0
0.28
-0
0.57
-1
0.46
-1
0.39-0
0.46
-0
0.43
-0
0.59
-1
0.34
-0
0.4
-1
0.45-1
0.74-1
0.41-1
0.49-1
0.53-1
0.44
-1
.82
.97
.46
.29
.85
.88
.95
.00
.90
.22
.09
.68
.05
.03
.17
.39
0.09
0.14
0.21
0.20
0.10
0.09
0.11
0.10
0.11
0.24
0.15
0.23
0.18
0.15
0.18
0.19
0.56
0.57
0.89
0.83
0.61
0.64
0.59
0.82
0.58
0.76
0.79
1.16
0.76
0.71
0.80
0.85
TEMP
.
Ill
113
172
162
122
128
117
161
115
151
156
206
187
142
158
165
(°C)
.0 .4 .0 .8 .3 .6 .9 .2 .7 .1 .3 .9 .2 .3 .0 .9ho U
l

SAMPLE
NUMBER
M83-
92
M83-
93
M83-94
M83-95
M83-96
M83-97
M83-99
M83-
100
M83-108
84-MJ-1C
TERR
ANE
Yager
Yager
Yage
r
Yage
r
Yager
Yage
r
Yage
r
Yage
r
Coas
tal
belt
Cent
ral
belt
LOCATION
T21N,
T23N,
T23N,
T23N,
T23N,
T23N,
T24N,
T24N,
T24N,
T24N,
R16W
R16W
R16W
R16W
R17W
R17W
R17W
R17W
R19W
R8E,
, S26
, S20
, S20
, S19
, S14
, S10
, S28
, S20
, S26
24
n 24 24 50 49 66 60 53 50 50 118
YITR
INIT
E
R
0.59-1
0.29-1
0.43-0
0.37-1
0.92
-1
0.48-1
0.32-0
0.31-0
0.37
-0
0.90
-1
.28
.29
.96
.09
.90
.17
.99
.72
.81
.48
REFLECTANCE, %R
Q
S I
0.23
0.27
0.13
0.14
0.23
0.18
0.13
0.08
0.10
0.15
0.91
0.73
0.66
0.58
1.50
0.81
0.60
0.50
0.59
1.21
TEMP
.
174
145
132
115
240
159
120 96 117
212
(°C)
.9 .9 .7 .7 .7 .6 .1 .1 .9 .0
ho

27
APPENDIX C. COMPARISON OF VITRINITE REFLECTANCE VALUES*
Sample Number
1
2
3
4
5
6
7
8
9
10
11
12
13
14
GeoChem** LABS
0.68
0.73
0.66
0.63
1.08
0.59
0.71
0.73
0.51
Clark*** University Geological Services of Missouri
0.59
0.64
0.47 0.46
0.59 0.53
1.31 1.45
0.51 0.61/0.59
0.64 0.67/0.67
0.53 0.63
1.02
0.69
0.69
0.78
0.47
0.63/0.63
*Multiple runs either performed on the same sample or multiple samples collected from the same outcrop.
**GeoChem Laboratories, Inc., Houston, Texas
***Clark Geological Services, Fremont, California

28
REFERENCES CITED
Bachman, S.B., 1978, A Cretaceous and early Tertiary subduction complex,Mendocino coast, northern California, in D.G. Howell and K.A. McDougall, eds., Mesozoic paleogeography of the western United States: Society of Economic Paleontologists and Mineralogists, Pacific Section, p. 419-430.
, 1979, Sedimentation and margin tectonics of the Coastal belt Franciscan, Mendocino Coast, northern California, (unpublished Ph.D. dissertation): Davis, University of California, 166 pp.
_____, 1982, The Coastal belt of the Franciscan: youngest phase of northern California subduction, in J.K. Legget, ed., Trench-forearc geology: Geological Society of London Special Publication 10, p. 401-418.
Bachman, S.B., Underwood, M.B., and Menach, J.S., 1984, Cenozoic evolution of coastal northern California, in J.K. Crouch and S.B. Bachman, eds., Tectonics and sedimentation aTong the California margin: Society of Economic Paleontologists and Mineralogists, Pacific Section, v. 38, p. 55-66.
Bailey, E.H., Irwin, W.P., and Jones, D.L., 1964, Franciscan and related rocks and their significance in the geology of western California: California Division Mines and Geological Bulletin 183, 177 p.
Barker, C.E., 1983, Influence of time on metamorphism of sedimentary organic matter in liquid-dominated geothermal systems, western North America: Geology, v. 11, p. 384-388.
Baskin, O.K., 1979, A method of preparing phytoclasts for vitrinite reflect ance analysis: Journal of Sedimentary Petrology, v. 49, p. 633-635.
Blackwell, D.D., Bower, R.G., Hull, D.A., Riccio, J., and Steele, J.L., 1982, Heat flow, arc volcanism, and subduction in northern Oregon: Journal of Geophysical Research, v. 87, p. 8735-8754.
Blake, M.C., Jr., Irwin, W.P., and Coleman, R.G., 1967, Upside-downmetamorphic zonation, blueschist facies, along a regional thrust in California and Oregon: U.S. Geological Survey Professional Paper 575-C, p. 1-9.
Blake, M.C., Jr., Irwin, W.P., Howell, D.G., and Jones, D.L., 1982, Preliminary tectonostratigraphic terrane map of California: U.S. Geological Survey Open-file Report 82-593, scale 1:750,000.
Bostick, N.H., 1971, Thermal alteration of clastic organic particles as an indicator of contact and burial metamorphism in sedimentary rocks: Geoscience and Man, v. Ill, p. 83-93.
Bostick, N.H., 1974, Phytoclasts as indicators of thermal metamorphism, Franciscan Assemblage and Great Valley Sequence (Upper Mesozoic), California: Geological Society of America Special Paper 153, p. 1-17.
29
Bostick, N.H. and Alpern, B., 1977, Principles of sampling, preparation, and constituent selection for microphotometry in measurement of maturation of sedimentary organic matter: Journal of Microscopy, v. 109, pt. 1, pp. 41-47.
Bostick, N.H., Cashman, S.M., McCulloch, T.M., and Waddell, C.T., 1978, Gradients of vitrinite reflectance and present temperature in the Los Angeles and Ventura Basins, California, in D.F. Oltz, ed., Low temperature metamorphism of kerogen and FTay minerals: Society of Economic Paleontologists and Mineralogists, Pacific Section, p. 65-96.
Bostick, N.H., Love, A.H., and Dows, T.A., 1984, Vitrinite reflectance, H-C-N, and microscopic analysis of coals and shales of the Eocene Yermillion Creek Sequence (abs.): Geological Society of America Abstracts with Programs, v. 16, p. 450-451.
Bustin, R.M., 1983, Heating during thrust faulting in the Rocky Mountains: friction or fiction?: Tectonophysics, v. 95, p. 309-328.
Castano, J.R., and Sparks, D.M., 1974, Interpretation of vitrinite reflectance measurements in sedimentary rocks and determination of burial history using vitrinite reflectance and authigenie minerals: Geological Society of America Special Paper 153, p. 31-52.
Cloos, M., 1983, Comparative study of melange matrix and metashales from the Franciscan subduction complex with the basal Great Valley Sequence, California: Journal of Geology, v. 91, p. 291-306.
1984, Landward-dipping reflectors in accretionary wedges: activedewatering conduits?: Geology, v. 12, p. 519-522.
Cowan, D.S., 1985, Structural styles in Mesozoic and Cenozoic melanges in the western Cordillera of North America: Geological Society of America Bulletin, v. 96, p. 451-462.
Doher, L.I., 1980, Palynomorph preparation procedures currently used in the paleontology and stratigraphy laboratories, U.S. Geological Survey: U.S.G.S. Circular 830, 29 pp.
Dow, W.G., 1977, Kerogen studies and geological interpretations: Journal of Geochemical Exploration, v. 7, p. 79-99.
Dow, W.G. and O 1 Connor, D.I., 1982, Kerogen maturity and type by reflected light microscopy applied to petroleum generation, in How to assess maturation and paleotemperatures: Society of Economic Paleontologists and Mineralogists, Short Course, p. 133-157.
Ernst, W.G., 1970, Tectonic contact between the Franciscan melange and theGreat Valley Sequence - crustal expression of a Late Mesozoic Benioffzone: Journal of Geophysical Research, v. 75, p. 886-901.

30
Ernst, W.G., Seki, Y., Onuki, H., and Gilbert, M.C., 1970, Comparative study of low-grade metamorphism in the California Coast Ranges and outer metamorphic belt of Japan: Geological Society of America Memoir 124, 276 pp.
Evitt, W.R, and Pierce, S.T., 1975, Early Teritary ages from the Coastal belt of the Franciscan Complex, northern California: Geology, v. 3, p. 433-436.
Gucwa, P.R., 1975, Middle to Late Cretaceous sedimentary melange, Franciscan Complex, northern California: Geology, v. 3, p. 105-108.
Herd, D.G., 1978, Intracontinental plate boundary east of Cape Mendocino, California: Geology, V. 6, p. 721-725.
Hood, A., Gutjahr, C.C.M., and Heacock, R.L., 1975, Organic metamorphism and the generation of petroleum: American Association of Petroleum Geologists Bulletin, v. 59, p. 986-996.
Houseknecht, D.W., and Matthews, S.M., 1985, Thermal maturity of Carboniferous strata, Ouachita Mountains: American Association of Petroleum Geologists Bulletin, v. 69, p. 335-345.
Hutton, A.C., and Cook, A.C., 1980, Influence of alginite on the reflectance of vitrinite from Joadja, New South Wales, and some other coals and oil shales containing alginite: Fuel, v. 59, p. 711-714
Irwin, W.P., 1960, Geologic reconnaissance of the northern Coast Ranges and Klamath Mountains, California, with a summary of the mineral resources: California Division Mines and Geological Bulletin 179, 80 p.
Jones, D.L., Blake, M.C., Bailey, E.H., and McLaughlin, R.J., 1978,Distribution and character of upper Mesozoic subduction complexes along the west coast of North America: Tectonophysics, v. 47, p. 207-222.
Kleist, J.R., 1974a, Geology of the Coastal belt, Franciscan Complex, near Ft. Bratt, California (unpubl. Ph.D. dissertation): Austin, University of Texas, 133 p.
, 1974b, Deformation by soft-sediment extension in the Coastal belt, Franciscan Complex: Geology, v. 2, p. 501-504
Kramer, J.C., 1976, The geology and tectonic implications of the Coastal belt Franciscan, Fort Bragg-Willits area, northern California (unpubl. Ph.D. dissertation): Davis, University of California, 128 p.
Lachenbruch, A.H., and Sass, J.H., -1980, Heat flow and energetics of the San Andreas fault zone: Journal of Geophysical Research, v. 85, p. 6185-6222.
Marchioni, D.L., 1983, The detection of weathering in coal by petrographic, rheologic, and chemical methods: International Journal Coal Geology, v. 2, p. 231-259.

31
Maxwell, J.C., 1974, Anatomy of an orogen: Geological Society of America Bulletin, v. 85, p. 1195-1204.
McCarthy, J., Stevenson, A.J., Scholl, D.W., and Vallier, T.L., 1984, Speculations on the petroleum geology of the accretionary body: an example from the central Aleutians: Marine and Petroleum Geology, v. 1, p. 151-167.
McLaughlin, R.J., and Nilsen, T.H., 1982, Neogene non-marine sedimentation and tectonics in small pull-apart basins of the San Andreas fault system, Sonoma County, California: Sedimentology, v. 29, p. 865-876.
Newman, J., and Newman, N.A., 1982, Reflectance anomalies in Pike River coals: evidence of variability in vitrinite type, with implications for maturation studies and "Suggate rank": New Zealand Journal Geology and Geophysics, v. 25, p. 233-243.
O'Day, M.S., 1974, The structure and petrology of the Mesozoic and Genozoic rocks of the Franciscan Complex, Leggett-Piercy area, northern California (unpubl. Ph.D. dissertation): Davis, University of California, 152 p.
O'Leary, J.D., Underwood, M.B., and Strong, R.H., 1984, Tectonic burial of Franciscan strata within northern California: Geological Society of America Abstracts with Programs, v. 16, p. 613.
Orchard, D.M., 1979, Geology of the Robinson Creek - Ukiah area, northern Coast Ranges, California (unpubl. M.S. thesis): Austin, University of Texas, 88 p.
Pampeyan, E.H., Harsh, P.W., and Coakley, J.M., 1981, Preliminary map showing recently active breaks along the Maacama fault zone between Hopeland and Laytonville, Mendocino County, California: U.S. Geological Survey Miscellaneous Field Studies Map MF-1217, scale 1:24,000.
Price, L.C., 1983, Geologic time as a parameter in organic metamorphism and vitrinite reflectance as an absolute paleogeothermometer: Journal of Petroleum Geology, v. 6, p. 5-38.
Price, L.C., and Barker, C.E., 1985, Suppression of vitrinite reflectance in amorphous-rich kerogen - a major unrecognized problem: Journal of Petroleum Geology, v. 8, p. 59-84.
Scholz, C.H., 1980, Shear heating and the state of stress on faults: Journal of Geophysical Research, v. 85, p. 6174-6184.
Suggate, R.P., 1982, Low-rank sequences and scales of organic metamorphism: Journal of Petroleum Geology, v. 4, p. 377-392.
Suggate, R.P.» and Lowery, J.H., 1982, The influence of moisture content on vitrinite reflectance and the assessment of maturation of coal: New Zealand Journal of Geology and Geophysics, v. 25, p. 227-231.

32
Underwood, M.B., 1982, The Garberville thrust a contact of probably Miocene age within the Franciscan complex, northern California: Geological Society of America Abstracts with Programs, v. 14, p. 635-636.
_____, 1983, Depositional setting of the Paleogene Yager formation,northern Coast Ranges of California, in O.K. Larue and R.J. Steel, eds., Cenozoic marine sedimentation. Pacific margin, USA: Society of Economic Paleontologists and Mineralogists, Pacific Section, p. 81-101.
Underwood, M.B., 1985, Sedimentology and hydrocarbon potential of the Yager complex, possible Paleogene source rocks in the Eel River basin of northern California: American Association of Petroleum Geologists Bulletin, v. 69, p. 1088-1100.
von Huene, R., and Lee, H., 1982, The possible significance of pore fluid pressures in subduction zones, jm J.S. Watkins and C.L. Drake, eds., Studies in continental margin geology: American Association of Petroleum Geologists Memoir 34, p. 781-791.
Waples, D.W., 1980, Time and temperature in petroleum formation: application of Lopatin's method to petroleum exploration: American Association of Petroleum Geologists Bulletin, v. 64, p. 916-926.