united states environmental protection agency region 7 total maximum daily load for total suspended...
TRANSCRIPT

lrector
United States Environmental Protection Agency
Region 7
Total Maximum Daily Load
For Total Suspended Solids and Dissolved Iron
Sandy Creek (MO _ 0652)
Putnam County, Missouri
Water, Wetlands and Pesticides Division
Sandy Creek TMDL

ii Sandy Creek TMDL
(This page intentionally left blank)

iii Sandy Creek TMDL
Total Maximum Daily Load (TMDL) For Sandy Creek
303(d) Listed Pollutant: Unknown
Name: Sandy Creek Location: Putnam County near Unionville,
Missouri Hydrologic Unit Code (HUC): 10280201-0304 Water Body Identification (WBID): 0652 Missouri Stream Classification: C1 Designated Beneficial Uses:2
Protection of Warm Water Aquatic Life Whole Body Contact Recreation – Category B Livestock and Wildlife Watering Human Health Protection (Fish Consumption)
Impaired Beneficial Use: Protection of Warm Water Aquatic Life (General Criteria, 1G) Size of Classified Segment: 3.0 miles Location of Classified Segment: Segment begins at the mouth of the creek at its confluence with Shoal Creek and ends at Township 66 North, Range 17 West, Section 19 Size of Impaired Segment: 3.0 miles3 Identified Pollutant on 303(d) List: Unknown Identified Source on 303(d) List: Unknown TMDL Priority Ranking: Medium
1 Class C streams may cease flow in dry periods but maintain permanent pools which support aquatic life. See Missouri Water Quality Standards (WQS) 10 Code of State Regulations (CSR) 20-7.031 (1)(F). The WQS can be found at the following uniform resource locator (URL): http://www.sos.mo.gov/adrules/csr/current/10csr/10c20-7.pdf 2 According to Missouri WQS Table H (CSR, 2009) 3 The stream length listed corresponds to the EPA approved 303(d) List and Missouri WQS Table H. Due to the increased accuracy of GIS data layers for analysis over previous methods of stream length measurements, the stream length used in the TMDL analysis may not correspond exactly to Table H. The descriptive start and end point of each segment remains the same and this TMDL addresses the impaired segment in its entirety.

iv Sandy Creek TMDL
TABLE OF CONTENTS 1 INTRODUCTION .............................................................................................................. 1
2 BACKGROUND ................................................................................................................ 2
2.1 THE SETTING ....................................................................................................... 2
2.2 PHYSIOGRAPHIC LOCATION, GEOLOGY AND SOILS ................................ 3
2.3 RAINFALL AND CLIMATE ................................................................................ 5
2.4 POPULATION ....................................................................................................... 7
2.5 LAND USE AND LAND COVER ......................................................................... 8
2.6 DEFINING THE PROBLEM ............................................................................... 10
3 SOURCE INVENTORY .................................................................................................. 18
3.1 POINT SOURCES ................................................................................................ 18
3.1.1 Concentrated Animal Feeding Operations .................................................. 19
3.1.2 Abandoned Mine Lands .............................................................................. 20
3.1.3 Illicit Straight Pipe Discharges .................................................................. 20
3.1.4 Runoff from MS4 Urban Areas ................................................................. 21
3.2 NONPOINT SOURCES ....................................................................................... 25
3.2.1 Runoff from Agriculture Areas .................................................................. 25
3.2.2 Runoff from Non-MS4 Urban Areas ......................................................... 26
3.2.3 Onsite Wastewater Treatment Systems ..................................................... 26
3.2.4 Riparian Corridor Conditions .................................................................... 27
4 APPLICABLE WATER QUALITY STANDARDS AND NUMERIC WATER QUALITY TARGETS .......................................................................................... 28
4.1 DESIGNATED BENEFICIAL USES .................................................................. 28
4.2 CRITERIA ............................................................................................................ 29
4.3 ANTIDEGRADATION POLICY ........................................................................ 29
5 MODELING APPROACH ............................................................................................... 30
5.1 CRITERION TO SUPPORT THE TMDL ........................................................... 31
6 CALCULATION OF LOADING CAPACITY ................................................................ 32
7 WASTELOAD ALLOCATION (POINT SOURCE LOADS) ........................................ 34
8 LOAD ALLOCATION (NONPOINT SOURCE LOADS) ............................................. 36
9 MARGIN OF SAFETY .................................................................................................... 36
10 CRITICAL CONDITIONS AND SEASONAL VARIATION ........................................ 36
11 MONITORING PLANS ................................................................................................... 37
12 REASONABLE ASSURANCES ..................................................................................... 37
13 PUBLIC PARTICIPATION ............................................................................................. 37
14 ADMINISTRATIVE RECORD AND SUPPORTING DOCUMENTATION ................ 38
APPENDICES .............................................................................................................................. 38
REFERENCES ............................................................................................................................. 39

v Sandy Creek TMDL
LIST OF TABLES Table 1. Sandy Creek Watershed Soils Summary (NRCS, 2009) ................................................. 5 Table 2. Land Use and Land Cover in the Sandy Creek Watershed (MoRAP, 2005) ................... 8 Table 3. Sandy Creek Water Quality Data (MDNR, 2009b) ....................................................... 12 Table 4. Sandy Creek Water Quality Data (URS, 2010)1 ............................................................ 16 Table 5. Permitted Facilities in the Sandy Creek Watershed ....................................................... 22 Table 6. Coal Mining Locations in the Sandy Creek Watershed (MDNR, 2008c) ..................... 23 Table 7. Percentage Land Use/Land Cover Within Riparian Buffer, 30-Meter .......................... 27 Table 8. Stream Flow Stations Used to Estimate Flows in Sandy Creek .................................... 31 Table 9. TSS TMDL Under a Range of Flow Conditions in Sandy Creek ................................. 34 Table 10. Dissolved Iron TMDL Under a Range of Flow Conditions in Sandy Creek ............... 34 Table 11. TSS and Iron WLAs for Permitted Facilities in the Sandy Creek Watershed ........... 35
LIST OF FIGURES Figure 1. Sandy Creek Watershed Soil Types ............................................................................... 4 Figure 2. Location of Sandy Creek Watershed with Weather Station ........................................... 6 Figure 3. Thirty Year Monthly Temperature and Precipitation Averages for Unionville Station
(Station ID 238523) ........................................................................................................ 7 Figure 4. Land Use/Land Cover in the Sandy Creek Watershed ................................................... 9 Figure 5. Sampling Locations in Sandy Creek ............................................................................ 17 Figure 6. Location of Permitted and Unpermitted Facilities in the Sandy Creek Watershed ...... 24 Figure 7. TSS LDC for Sandy Creek ........................................................................................... 33 Figure 8. Dissolved Iron LDC for Sandy Creek .......................................................................... 33
APPENDICES Appendix A – MDNR Sandy Creek Water Quality Data Appendix B – Development of TSS Targets Using Reference LDCs Appendix C – Stream Flow and Water Quality Stations Used to Develop TMDLs in Sandy
Creek Appendix D – Supplemental Implementation Plan

vi Sandy Creek TMDL
ACRONYMS AND ABBREVIATIONS
µg/L Micrograms per Liter 1G General Criteria Pertaining to Protection of Aquatic Life AFO Animal Feeding Operation AML Abandoned Mine Lands BMP Best Management Practice BOD Biochemical Oxygen Demand CAFO Concentrated Animal Feeding Operation CFR Code of Federal Regulations cfs Cubic Feet per Second Ck Creek Cl Chloride CSR Code of State Regulations CWA Clean Water Act DO Dissolved Oxygen e.g. For Example EDU Ecological Drainage Unit EPA United States Environmental Protection Agency Gal/year Gallons per Year GIS Geographic Information System HUC Hydrologic Unit Code LA Load Allocation LC Loading Capacity LDC Load Duration Curve LRP Land Reclamation Program MDC Missouri Department of Conservation MDNR Missouri Department of Natural Resources mg/L Milligrams per Liter MGD Million Gallons per Day MoRAP Missouri Resource Assessment Partnership MOS Margin of Safety MS4 Municipal Separate Storm Sewer System MSDIS Missouri Spatial Data Information Service MSOP Missouri State Operating Permit MSWDC Missouri Soil and Water Districts Commission N North NA Not Applicable NASS National Agricultural Statistics Service NFR Non-Filterable Residue NH3 Ammonia NO2 Nitrite NO3 Nitrate NOAA National Oceanic and Atmospheric Administration NPDES National Pollutant Discharge Elimination System NRCS Natural Resources Conservation Service
vii Sandy Creek TMDL
ACRONYMS AND ABBREVIATIONS cont. PCS Permit Compliance System PSF Premium Standard Farms RAM Resource Assessment and Monitoring SWPPP Storm Water Pollution Prevention Plan TBELs Technology Based Effluent Limitations TKN Total Kjeldahl Nitrogen Temp Temperature TMDL Total Maximum Daily Load TN Total Nitrogen TP Total Phosphorus TSS Total Suspended Solids URS URS Group U.S. United States USDA United States Department of Agriculture USDI United States Department of Interior USGS United States Geological Survey WBID Water Body Identification WLA Wasteload Allocation WQBELs Water Quality Based Effluent Limitations WQS Water Quality Standards WWTP Wastewater Treatment Plant

1 Sandy Creek TMDL
1 INTRODUCTION The Sandy Creek Total Maximum Daily Load (TMDL) is being established in
accordance with Section 303(d) of the Clean Water Act (CWA). The water quality limited segment is included on the United States (U.S.) Environmental Protection Agency (EPA) approved 2008 Missouri 303(d) List and is identified as impaired due to unknown pollutants and sources. Data analyses and field investigations conducted to support the listing and TMDL development have identified total suspended solids (TSS) and dissolved iron concentrations in Sandy Creek as contributors to the impairment. These pollutants have been shown to be present at elevated levels and can be linked to the impaired beneficial use of the water body. This report addresses the Sandy Creek impairment by establishing a TSS TMDL and a dissolved iron TMDL in accordance with Section 303(d) of the CWA.
Section 303(d) of the CWA and Chapter 40 of the Code of Federal Regulations (CFR)
Part 130 requires states to develop TMDLs for waters not meeting designated beneficial uses. The TMDL process quantitatively assesses the impairment factors so that states can establish water quality based controls to reduce pollutants and restore and protect the quality of their water resources. The purpose of a TMDL is to determine the maximum amount of a pollutant (the load) that a water body can assimilate without exceeding the water quality standards (WQS) for that pollutant. WQS are benchmarks used to assess the quality of rivers and lakes. The TMDL also establishes the pollutant loading capacity (LC) necessary to meet the Missouri WQS established for each water body based on the relationship between pollutant sources and instream water quality conditions. The TMDL consists of a wasteload allocation (WLA), a load allocation (LA) and a margin of safety (MOS). The WLA is the portion of the allowable load that is allocated to regulated (point) sources. The LA is the portion of the allowable load that is allocated to nonregulated (nonpoint) sources. The MOS accounts for the uncertainty associated with linking pollutant load to the water quality impairment. This is often associated with model assumptions and data limitations.
The goal of the TMDL program is to restore designated beneficial uses to water bodies.
Thus, reduction strategies for point and nonpoint sources and implementation of source controls throughout the watershed will be necessary to restore the protection of warm water aquatic life use in Sandy Creek. In addition to establishing a TMDL for Sandy Creek, this report provides a summary of information, results and recommendations related to the impairment based on a broad analysis of watershed information and detailed analysis of water quality data, sediment data, toxicity data, flow data and comparison to a reference stream condition in the same ecological drainage unit (EDU) in which Sandy Creek is located.
Section 2 of this report provides background information on the Sandy Creek watershed
and Section 3 describes potential sources of concern. Section 4 presents the applicable WQS and Section 5 describes the modeling that was done to support the TMDL. Sections 6 to 10 present the required TMDL elements (LC, WLA, LA, MOS, seasonal variation) and Sections 11 to 13 summarize the follow-up monitoring plan, reasonable assurances and public participation. A summary of the administrative record is presented in Section 14.
2 Sandy Creek TMDL
2 BACKGROUND This section of the report provides information on Sandy Creek and its watershed.
2.1 THE SETTING
Sandy Creek is an 8.1-mile intermittent stream (classified, 3 miles; unclassified, 5.1 miles)4 located in the Grand River/Chariton EDU. Sandy Creek originates in Putnam County (T66N R18W Section 3) and flows southeast to its confluence with Shoal Creek, a tributary of the Chariton River. The Sandy Creek watershed covers an area of approximately 17.43 square miles with the total river distance of 8.1 miles of Sandy Creek. The topographic relief along the impaired segment is generally 20 to 40 feet along the valley bottom and adjoining gently sloping upland ridges. The elevation of the impaired segment ranges from 860 feet (upstream) to 820 feet (downstream). The watershed was defined using the ten digit watershed hydrologic unit code (HUC) labeled Sandy Creek-Shoal Creek and further specified for Sandy Creek in particular using contours based on the United States Geological Survey (USGS) topographic maps and National Hydrography Dataset.
Sandy Creek was placed on the 2002 Missouri 303(d) List for unknown pollutants. EPA based these listings on the Missouri Department of Natural Resources’ (MDNR) revised “Monitoring Report on 26 Waters” and Visual/Benthic Low Flow Surveys. Specific reasons cited included indications of daily oxygen sag; anoxic sediments; overall reduced biodiversity; and high specific conductance (indicating excessive dissolved minerals) (MDNR, 2006a).
All classified waters of the state, as per Missouri WQS, must protect aquatic life. A combination of natural geology and land use in the prairie portions of the state where Sandy Creek is located is believed to have reduced the amount and impaired the quality of habitat for aquatic life. The major water quality problems are increased rates of sediment deposition due to stream bank erosion and sheet erosion from agricultural lands, loss of stream length and stream channel heterogeneity due to channelization and changes in basin hydrology that have increased flood flows and prolonged low flow conditions. The number one pollutant entering Missouri’s waters is sediment, with about 59 million tons of soil eroding from Missouri’s land each year (MSWDC, 2003). Sedimentation occurs when wind or water runoff carries soil particles from an area and transports them to a stream or lake. Total suspended solids (TSS) can contribute to the impairment of aquatic life at elevated levels. Excessive sedimentation affects the aquatic plant community by clouding the water and reducing the amount of sunlight reaching aquatic plants. Sedimentation impacts aquatic invertebrates and fish by covering spawning areas, foraging habitat and food supplies rendering them useless, while also clogging the gills of fish. Another impact of excessive sedimentation is the loss of habitat and species diversity. Streams affected by sedimentation lose the hard-bottomed, erosional areas used by several species of benthic invertebrates and small foraging fish. These erosional areas are replaced by uniform soft-bottomed, sedimentary habitat, normally occurring only near the stream banks. Consequently,
4 The stream length listed in Table H is the length of classified stream. The calculation of TMDL loads is based on the outlet of the watershed that includes all of its unclassified segments located upstream.
3 Sandy Creek TMDL
entire species of invertebrates and fish can be extirpated5 from the stream. In addition, other pollutants like nitrogen, phosphorus, pathogens and heavy metals are often attached to soil particles and move into streams with the sediment (MDNR, 2009a). TMDLs are not written to address habitat, but are written to correct water quality conditions. To address the unknown pollutants, this TMDL targets dissolved iron concentrations and TSS. There are many quantitative indicators of sediment, such as TSS, turbidity and bedload sediment, which are appropriate to describe sediment in rivers and streams. TSS was selected as the numeric target for sediment in this TMDL because it enables the use of the highest quality data available, including permit conditions and monitoring data.
Additionally, a TMDL for dissolved iron will also be developed using high quality field data and Missouri’s WQS numeric criterion. Elevated levels of heavy metals like iron can be toxic to fish and aquatic invertebrates. Iron can change the pH of a stream with widespread consequences and can precipitate out in several forms, which can smother fish eggs, clog fish gills and cover the stream substrate making it unsuitable for benthic invertebrates.
2.2 PHYSIOGRAPHIC LOCATION, GEOLOGY AND SOILS
Sandy Creek is located within the Northern Plains; a region within the Dissected Till Plains. The Dissected Till Plains are a physiographic region of the Central Lowlands Province, which are in turn part of the Interior Plains physiographic division of the United States (MDC, 2010). The Dissected Till Plains are characterized by moderately dissected, glaciated, flat-to-rolling terrain that slopes gently toward the Missouri and Mississippi River Valleys. Sandy Creek is a tributary to Shoal Creek in the Chariton River Watershed. The Sandy Creek watershed is located in the Marmaton and Cherokee geologic groups of the Middle Pennsylvanian Middle Series-Desmonian Stage. Predominant rock types include shale, limestone and sandstone (USDI, 2005).
The soils hydrologic group relates to the rate at which water enters the soil profile, which in turn affect the amount of water that enters the stream as direct runoff. Figure 1 and Table 1 provide details of soil types within the impaired Sandy Creek watershed. The dominant soil type, Group C, covers approximately 67.2 percent of the watershed. Group C includes sandy clay loam soils that have a moderately fine to fine structure. These soils have low infiltration rates when thoroughly wetted and consist chiefly of soils with a layer that impedes downward movement of water. Approximately 28.1 percent of soils in the impaired watershed are categorized as Group D. Group D soils include clay loam, silty clay loam, sandy clay, silty clay or clay. This hydrologic soil group has the highest runoff potential. They have very low infiltration rates when thoroughly wetted and consist chiefly of clay soils, soils with a permanent high water table and soils with a claypan or clay layer at or near the surface and shallow soils over nearly impervious material (Purdue Research Foundation, 2009). Group B includes silt loam and loam which have moderate infiltration rates. These soils consist of well drained soils with moderately fine to moderately coarse textures. Approximately 3.9 percent of the soils are categorized as Group B.
5 Local extinction is the condition of a species which ceases to exist in the chosen area of study, but still exists elsewhere. This phenomenon is also known as extirpation.

4 Sandy Creek TMDL
Figure 1. Sandy Creek Watershed Soil Types (NRCS, 2009)

5 Sandy Creek TMDL
Table 1. Sandy Creek Watershed Soils Summary (NRCS, 2009)
Soil Type Hydrologic Soil Group Acres Percent (%)
Nodaway Silt Loam B 434.6 3.9
Subtotal B 434.6 3.9
Adair Loam C 296.4 2.7
Armstrong Clay Loam C 1,075.9 9.6
Gara Loam C 616.6 5.5
Gorin Silt Loam C 309 2.8
Keswick Loam C 1,551.4 13.9
Lamoni Clay Loam C 28.6 0.3
Schuline Clay Loam C 1,339.4 12
Shelby Loam C 175.7 1.6
Vigar Silt Loam C 7.8 0.1
Vigar-Zook-Nodaway Complex C 261.7 2.3
Winnegan Loam C 1,833.3 16.4
Subtotal C 7,495.8 67.2
Clarinda Silty Clay Loam D 570.3 5.1
Edina Silt Loam D 228.3 2
Pershing Silty Clay Loam D 595.1 5.3
Rinda Silty Clay Loam D 195.6 1.8
Seymour Silty Clay Loam D 635.6 5.7
Vanmeter Silt Clay Loam D 911.7 8.2
Subtotal D 3,136.6 28.1
Zook Silty Clay Loam C/D 54.3 0.48
Subtotal C/D 54.3 0.48
Water 36.3 0.3
Subtotal 36.3 0.3
2.3 RAINFALL AND CLIMATE
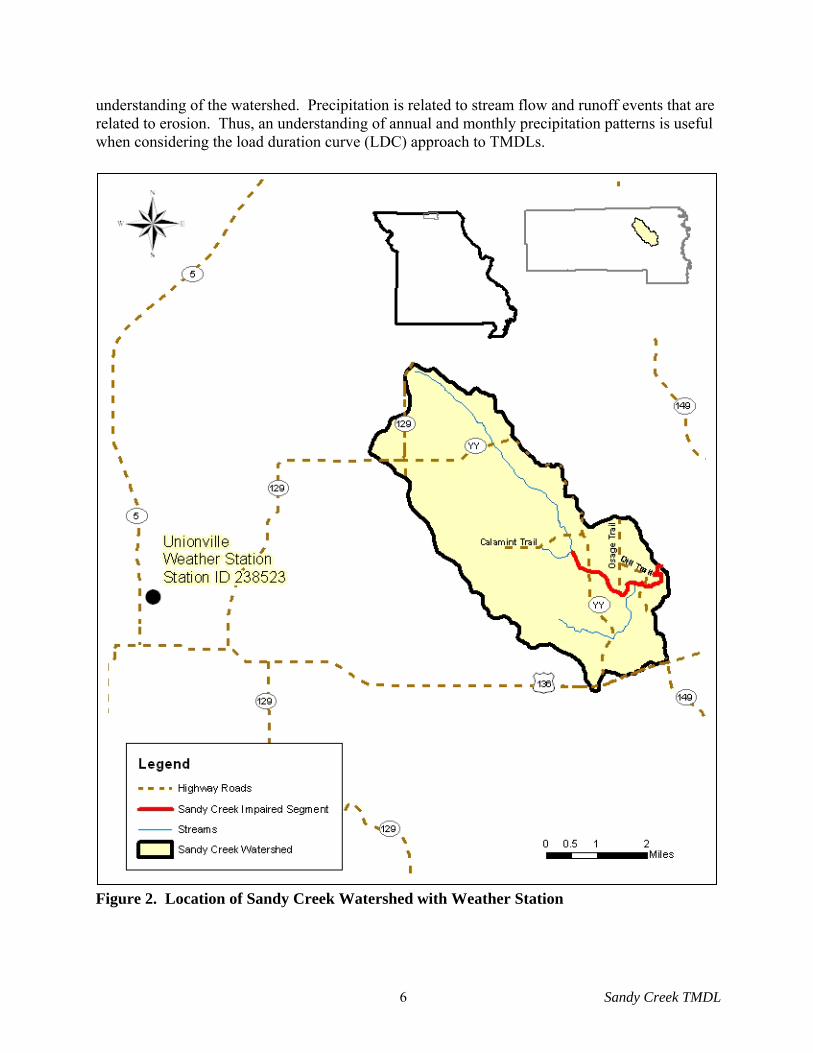
The Unionville Weather Station is the closest source of recent and available weather and climate data. It is located in Putnam County, approximately 8.5 miles west of the Sandy Creek watershed (Figure 2). It records daily precipitation, maximum and minimum temperature, snowfall and snow depth. Figure 3 provides a summary of rainfall and climate data for the Unionville Station based on 30 years of data (1971 – 2000) (NOAA, 2010). The annual average precipitation and temperature over the 30 year period is 37.5 inches and 49.8 degrees Fahrenheit, respectively. Weather stations provide useful information for developing a general
6 Sandy Creek TMDL
understanding of the watershed. Precipitation is related to stream flow and runoff events that are related to erosion. Thus, an understanding of annual and monthly precipitation patterns is useful when considering the load duration curve (LDC) approach to TMDLs.
Figure 2. Location of Sandy Creek Watershed with Weather Station

7 Sandy Creek TMDL
0
10
20
30
40
50
60
70
80
Jan Feb Mar Apr May Jun Jul Aug Sep Oct Nov Dec
Month (1971-2000)
Ave
rage
Tem
per
atu
re (
deg
Fah
ren
hei
t)
0
1
2
3
4
5
6
Ave
rage
Pre
cip
itat
ion
(in
ches
)
Temperature Precipitation
Figure 3. Thirty Year Monthly Temperature and Precipitation Averages for
Unionville Station (Station ID 238523)
2.4 POPULATION
The census reports that the 2000 population (in Putnam County) for all areas was 24,977 (U.S. Census Bureau, 2000). The population of the Sandy Creek watershed is not directly available. However, the population of the watershed can be estimated based on the total number of people per census block points located within the watershed. The points represent the centroids of census blocks, the smallest division for which the census provides population data. The Sandy Creek watershed population was estimated to be 105 persons; calculated using a Geographic Information System (GIS) by selecting the census block points located within the watershed area (17.43 square miles). An overall population density for the Sandy Creek watershed was calculated to be 6 persons per square mile (105 persons divided by 17.43 square miles).

8 Sandy Creek TMDL
2.5 LAND USE AND LAND COVER
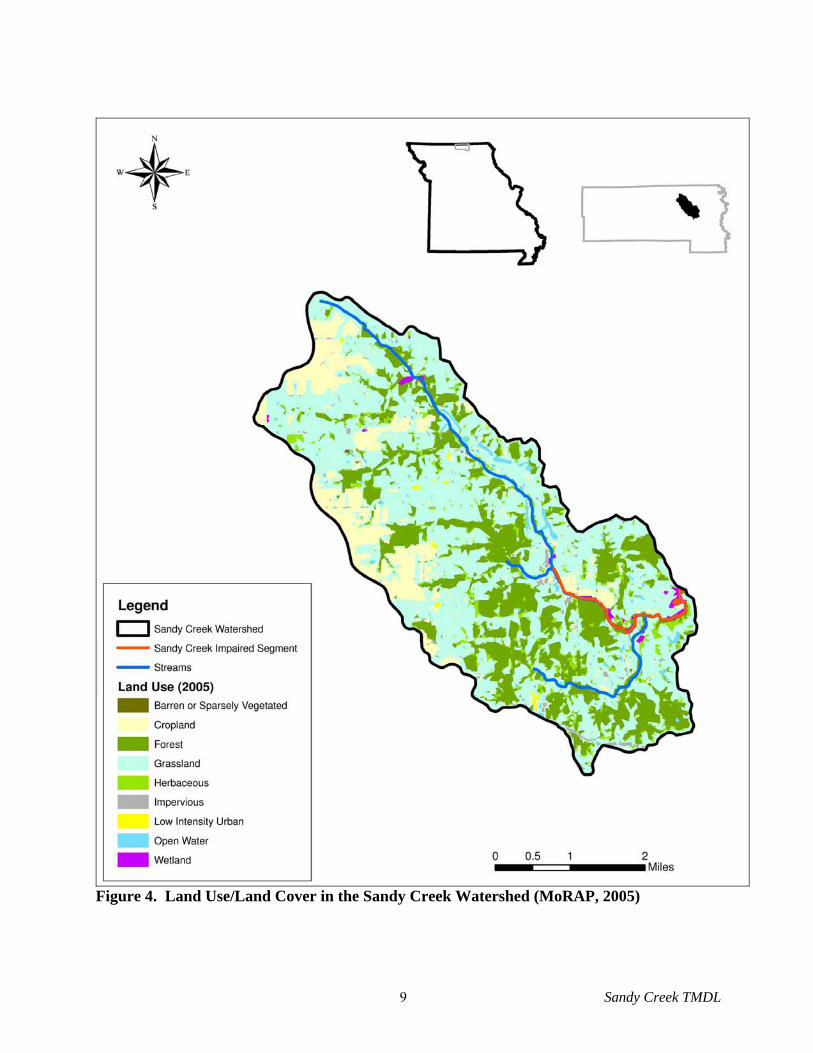
The land use and land cover of the Sandy Creek watershed is shown in Figure 4 and summarized in Table 2 (MoRAP, 2005). The primary land uses and land covers are grassland (54.2 percent), forest (23.2 percent) and cropland (12.8 percent). Herbaceous, wetlands, impervious, low intensity urban, barren and water occupy the remaining 9.8 percent of the watershed area.
Table 2. Land Use and Land Cover in the Sandy Creek Watershed (MoRAP, 2005)
Land Use/Land Cover
Watershed Area
Percent (%) Acres Square Miles
Impervious1 135.46 0.21 1.21
Low Intensity Urban2 28.75 0.04 0.26
Barren or Sparsely Vegetated 2.00 0.003 0.02
Cropland 1,429.96 2.23 12.82
Grassland 6,052.41 9.46 54.24
Forest 2,585.65 4.04 23.17
Herbaceous3 676.70 1.10 6.10
Wetland 94.69 0.15 0.85
Open Water 152.10 0.24 1.40
Total 11,157.72 17.47 100 1 Impervious land use includes non-vegetated, impervious surfaces including areas dominated by streets, parking lots and buildings (MoRAP, 2005) 2 Low intensity urban is defined as vegetated urban environments with a low density of buildings (MoRAP, 2005) 3 Herbaceous land uses include open and young woodlands with less than 60 percent cover of deciduous trees (MoRAP, 2005)
9 Sandy Creek TMDL
Figure 4. Land Use/Land Cover in the Sandy Creek Watershed (MoRAP, 2005)

10 Sandy Creek TMDL
2.6 DEFINING THE PROBLEM
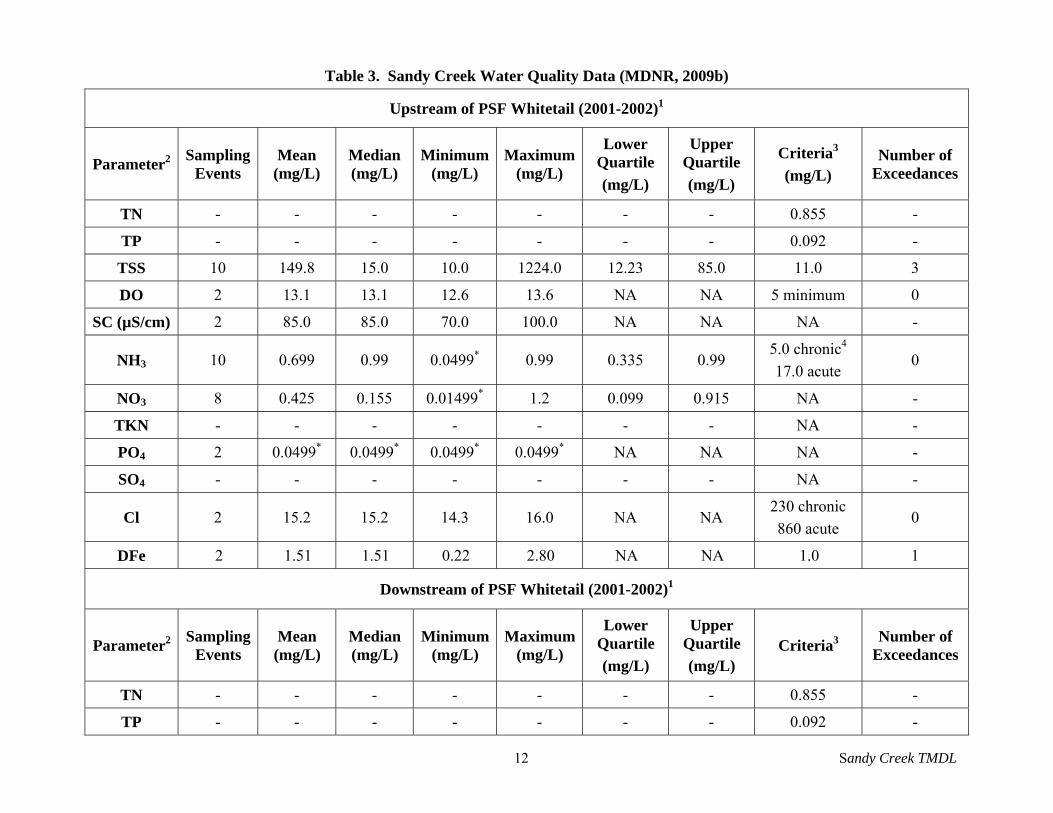
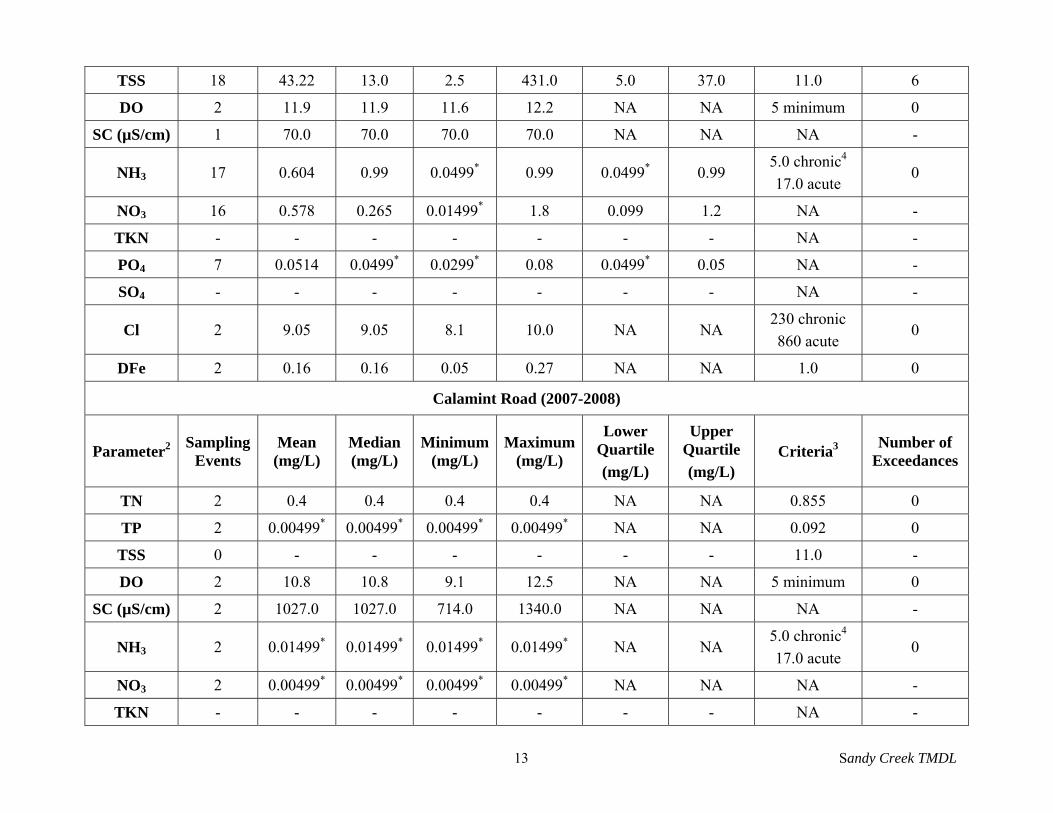
Sandy Creek is identified as impaired due to unknown pollutants and sources. Recent water quality data has shown high levels of iron that exceeds the WQS criterion of 1,000 micrograms per liter (µg/L) (see Figure 5 for the locations of all sampling points within Sandy Creek). Additionally, water quality monitoring has revealed elevated levels of TSS in Sandy Creek. In the absence of Missouri numeric standards for TSS, a target derived from the Grand/Chariton EDU is used (see Appendix C for a list of sites and data). The TSS target is 11.0 milligrams per liter (mg/L) and is derived by targeting the 25th percentile base load concentration of TSS measurements collected by the USGS in the Grand/Chariton EDU (12) where Sandy Creek is located (see Appendix B for full description). Water quality monitoring data provided by MDNR has shown that TSS and dissolved iron have been present at elevated levels and are linked to the impaired beneficial use of the water body. Table 3 summarizes water quality data collected from Sandy Creek by MDNR from 2001-2009. Eleven of 33 measurements of TSS were elevated with a majority of the measurements being taken downstream of the Premium Standard Farms’ (PSF) Whitetail finishing facility. Additionally, one of four dissolved iron samples taken in the water column was above the numeric target.
Sandy Creek was sampled in September 2009 and April 2010 to assess the impairment due to unknown pollutants. Surface water chemistry parameters, interstitial water chemistry parameters, in-situ water quality parameters and stream physical characteristics were collected. Three locations in Sandy Creek established by MDNR were monitored; see Figure 5 for sampling locations. Results from the September 2009 Sandy Creek assessment (Table 4) identified that dissolved iron was noticeably high in interstitial6 water at upstream location #3 (3,600 µg/L) as compared to all remaining interstitial and surface water samples (32 µg/L to 110 µg/L). Sample location #3 is located directly upstream of the Calamint Trail crossing of Sandy Creek. Dissolved manganese concentrations were also consistently higher in interstitial water, when compared to surface water. The highest concentrations of manganese also occurred at upstream location #3 (interstitial water #3 = 10,000 µg/L and surface water #3 = 2,200 µg/L) in September 2009.
The majority of Missouri’s numeric criteria can be found in Tables A and B in the Code of State Regulations (CSR), Title 10 – Department of Natural Resources, Division 20 – Clean Water Commission, Chapter 7 - Water Quality (10 CSR 20-7.031). The state of Missouri no longer has instream numeric criteria for manganese. The applicable water quality criterion for the protection of aquatic life for iron is 1,000 µg /L. The higher levels of these heavy metals may be due to past discharges to Sandy Creek from nearby mining facilities. Consequently, a TMDL for dissolved iron will be developed.
A Biological Assessment and Habitat Study Report, performed by MDNR in 2007 - 2008, concluded that Sandy Creek is biologically impaired by unknown sources. The water quality parameters tested were under Missouri’s water quality criteria and the study concluded that limited habitat and small stream size are a likely source of biological impairment. Unfortunately, heavy metals were not sampled during the MDNR assessment. The report does 6 Interstitial water is water found between sediment particles in the stream bottom.

11 Sandy Creek TMDL
suggest that historic coal mining activity may still affect the watershed in Sandy Creek. Although now ceased, the most recent mining activities occurred in the Sandy Creek watershed in the early to mid 1990s. The formerly mined land has either been reclaimed or is in the final stages of reclamation. According to MDNR, mining in the Sandy Creek watershed was extensive. It was conducted up to and along the stream bank for a considerable distance, starting at approximately Calamint Road and continuing upstream along the northeast bank. Coal mining can not only disturb stream banks, but can also be a source of acid mine drainage, metals and sulfates (MDNR 2008). These historic point sources are likely contributors to elevated iron concentrations in the surface water of Sandy Creek.
12 Sandy Creek TMDL
Table 3. Sandy Creek Water Quality Data (MDNR, 2009b)
Upstream of PSF Whitetail (2001-2002)1
Parameter2 Sampling
Events Mean (mg/L)
Median (mg/L)
Minimum (mg/L)
Maximum (mg/L)
Lower Quartile
(mg/L)
Upper Quartile
(mg/L)
Criteria3
(mg/L) Number of
Exceedances
TN - - - - - - - 0.855 -
TP - - - - - - - 0.092 -
TSS 10 149.8 15.0 10.0 1224.0 12.23 85.0 11.0 3
DO 2 13.1 13.1 12.6 13.6 NA NA 5 minimum 0
SC (µS/cm) 2 85.0 85.0 70.0 100.0 NA NA NA -
NH3 10 0.699 0.99 0.0499* 0.99 0.335 0.99 5.0 chronic4
17.0 acute 0
NO3 8 0.425 0.155 0.01499* 1.2 0.099 0.915 NA -
TKN - - - - - - - NA -
PO4 2 0.0499* 0.0499* 0.0499* 0.0499* NA NA NA -
SO4 - - - - - - - NA -
Cl 2 15.2 15.2 14.3 16.0 NA NA 230 chronic
860 acute 0
DFe 2 1.51 1.51 0.22 2.80 NA NA 1.0 1
Downstream of PSF Whitetail (2001-2002)1
Parameter2 Sampling
Events Mean (mg/L)
Median (mg/L)
Minimum (mg/L)
Maximum (mg/L)
Lower Quartile
(mg/L)
Upper Quartile
(mg/L) Criteria3
Number of Exceedances
TN - - - - - - - 0.855 -
TP - - - - - - - 0.092 -
13 Sandy Creek TMDL
TSS 18 43.22 13.0 2.5 431.0 5.0 37.0 11.0 6
DO 2 11.9 11.9 11.6 12.2 NA NA 5 minimum 0
SC (µS/cm) 1 70.0 70.0 70.0 70.0 NA NA NA -
NH3 17 0.604 0.99 0.0499* 0.99 0.0499* 0.99 5.0 chronic4
17.0 acute 0
NO3 16 0.578 0.265 0.01499* 1.8 0.099 1.2 NA -
TKN - - - - - - - NA -
PO4 7 0.0514 0.0499* 0.0299* 0.08 0.0499* 0.05 NA -
SO4 - - - - - - - NA -
Cl 2 9.05 9.05 8.1 10.0 NA NA 230 chronic
860 acute 0
DFe 2 0.16 0.16 0.05 0.27 NA NA 1.0 0
Calamint Road (2007-2008)
Parameter2 Sampling
Events Mean (mg/L)
Median (mg/L)
Minimum (mg/L)
Maximum (mg/L)
Lower Quartile
(mg/L)
Upper Quartile
(mg/L) Criteria3
Number of Exceedances
TN 2 0.4 0.4 0.4 0.4 NA NA 0.855 0
TP 2 0.00499* 0.00499* 0.00499* 0.00499* NA NA 0.092 0
TSS 0 - - - - - - 11.0 -
DO 2 10.8 10.8 9.1 12.5 NA NA 5 minimum 0
SC (µS/cm) 2 1027.0 1027.0 714.0 1340.0 NA NA NA -
NH3 2 0.01499* 0.01499* 0.01499* 0.01499* NA NA 5.0 chronic4
17.0 acute 0
NO3 2 0.00499* 0.00499* 0.00499* 0.00499* NA NA NA -
TKN - - - - - - - NA -

14 Sandy Creek TMDL
PO4 - - - - - - - NA -
SO4 2 348.0 348.0 202.0 494.0 NA NA NA -
Cl 2 8.85 8.85 6.0 11.7 NA NA 230 chronic
860 acute 0
DFe - - - - - - - 1.0 -
Highway YY (2005-2009)
Parameter2 Sampling
Events Mean
(mg/L) Median (mg/L)
Minimum (mg/L)
Maximum (mg/L)
Lower Quartile
(mg/L)
Upper Quartile
(mg/L) Criteria3
Number of Exceedances
TN 6 0.565 0.445 0.32 1.06 0.335 0.85 0.855 1
TP 6 0.0292 0.0225 0.00499* 0.07 0.00499* 0.055 0.092 0
TSS 5 62.7 13.0 2.5 206.0 4.25 146.0 11.0 2
DO 11 8.74 8.6 6.1 11.2 7.3 11.1 5 minimum 0
SC (µS/cm) 11 1004.9 860.0 360.0 2200.0 703.0 1260.0 NA -
NH3 6 0.0542 0.0325 0.01499* 0.17 0.01499* 0.0875 5.0 chronic4
17.0 acute 0
NO3 6 0.967 0.02 0.00499* 0.33 0.00499* 0.233 NA -
TKN 4 0.545 0.485 0.35 0.86 0.375 0.775 NA -
PO4 - - - - - - - NA -
SO4 6 466.8 447.5 205.5 756.0 349.8 599.3 NA -
Cl 6 8.45 7.36 7.0 12.0 7.0 10.5 230 chronic
860 acute 0
DFe - - - - - - - 1.0 -

15 Sandy Creek TMDL
All Sites (2001-2009)
Parameter2 Sampling
Events Mean
(mg/L) Median (mg/L)
Minimum (mg/L)
Maximum (mg/L)
Lower Quartile
(mg/L)
Upper Quartile
(mg/L) Criteria3
Number of Exceedances
TN 8 0.524 0.4 0.32 1.06 0.343 0.72 0.855 1
TP 8 0.0231 0.00499* 0.00499* 0.07 0.00499* 0.048 0.092 0
TSS 33 78.5 13.0 2.50 1224.0 8.5 25.5 11.0 11
DO 17 9.86 10.6 6.1 13.6 7.5 11.9 5 minimum 0
SC (µS/cm) 16 834.3 757.0 70.0 2200.0 380.8 1250.0 NA -
NH3 35 0.503 0.43 0.01499* 0.99 0.0499* 0.99 5.0 chronic4
17.0 acute 0
NO3 32 0.414 0.125 0.00499* 1.8 0.02 0.613 NA -
TKN 4 0.545 0.485 0.35 0.86 0.375 0.775 NA -
PO4 9 0.051 0.0499* 0.0299* 0.08 0.0499* 0.04995 NA -
SO4 8 437.1 447.5 202.0 756.0 253.3 533.8 NA -
Cl 12 9.73 9.05 6.0 16.0 7.0 11.9 230 chronic
860 acute 0
DFe 4 0.84 0.25 0.05 2.80 0.09 2.18 1.0 1 1 PSF = Premium Standard Farms, NA = Not applicable 2 DO = Dissolved Oxygen, NH3 = Ammonia, Cl = Chloride, TKN= Total Kjeldahl Nitrogen, TP = Total Phosphorus, NO3 = Nitrate, TSS = Total Suspended Solids, SC = Specific Conductance, PO4 = Phosphate, SO4 = Sulfate, DFe = Dissolved Iron 3 Criteria based on reference conditions for TN and TP in Level III Ecoregion 40 streams and the measured TSS concentrations adjusted so that their median is equal to the 25th percentile base load concentration of TSS measurements in the Grand/Chariton EDU. This is accomplished by adjusting the measured data using the ratio between the 25th percentile target and the median from the measured data. 4 Criteria based on average pH and temperatures at the stream during sampling events * Value is a reportable detection limit or method detection limit - Parameter not recorded

16 Sandy Creek TMDL
Table 4. Sandy Creek Water Quality Data (URS, 2010)1
Location2 DO (mg/L) SC
(µS/cm)
Cl
(mg/L)
DAl
(µg/L)
DCa
(µg/L)
DFe
(µg/L)
DMg
(µg/L)
SO4
(mg/L)
September 2009
1 SW 6.36 0.941 5.62 <50 150,000 32 930 320
2 SW 5.51 1.10 5.78 <50 160,000 32 1,200 380
3 SW 5.96 1.19 6.09 <50 160,000 41 2,200 440
1 IW 9.45 0.627 6.18 <50 130,000 110 6,700 230
2 IW 9.76 0.677 6.16 <50 93,000 75 6,800 140
3 IW 10.02 0.887 4.60 <50 140,000 3,600 10,000 170
April 2010
1 SW 10.79 0.643 5.8 <50 130,000 61 620 270
2 SW 7.45 0.671 5.7 <50 140,000 43 810 310
3 SW 8.39 0.725 6.2 <50 140,000 46 1,600 350
1 IW 6.50 0.598 5.7 <50 130,000 <10 1,600 240
2 IW 4.51 0.583 5.1 <50 120,000 <10 790 230
3 IW 5.28 0.614 5.0 <50 140,000 <10 8,800 230
Missouri WQS
Criteria 5 minimum NA 230 chronic
860 acute 750 acute NA 1,000 NA NA
1 All sampling was performed on September 8-9, 2009, and April 19-20, 2010. DO = Dissolved Oxygen, NH3 = Ammonia Nitrogen, Cl = Chloride, TP = Total Phosphorus, TSS = Total Suspended Solids, SC = Specific Conductance, SO4 = Sulfate, DFe = Dissolved Iron, DMg = Dissolved Manganese, DAl = Dissolved Aluminum, DCa = Dissolved Calcium 2 SW = Surface Water, IW = Interstitial Water, Location 1 =Dill Trail crossing, Location 2 = Downstream of Highway YY, Location 3 = Calamint Trail crossing, NA = Not applicable

17 Sandy Creek TMDL
Figure 5. Sampling Locations in Sandy Creek (MDNR, 2009b and URS, 2010)
18 Sandy Creek TMDL
3 SOURCE INVENTORY
A source assessment is used to identify and characterize the known and suspected sources contributing to impairment in Sandy Creek. For the purpose of this report, sources have been divided into two broad categories; point sources and nonpoint sources. Point sources can be defined as sources, either constant or time transient, which occur at a fixed location in a watershed. Nonpoint sources are generally accepted to be diffuse sources not entering a water body at a specific location. Sediment and dissolved iron are considered to be the primary contributors to impairment of the aquatic communities in Sandy Creek. 3.1 POINT SOURCES
The term “point source” refers to any discernible, confined and discrete conveyance, such as a pipe, ditch, channel, tunnel or conduit, by which pollutants are transported to a water body. For the purposes of TMDL development, point sources are defined as sources regulated through the National Pollutant Discharge Elimination System (NPDES) program. Missouri has its own program for administering the NPDES program, referred to as the Missouri State Operating Permit (MSOP) system. The NPDES and MSOP programs are the same and for the purposes of this document the term “NPDES” will be used. The following NPDES-regulated entities are included in this source category:
Municipal and industrial wastewater treatment plants (WWTP); Concentrated animal feeding operations (CAFOs); Storm water runoff from Municipal Separate Storm Sewer Systems (MS4s); General permitted facilities (e.g., including storm water runoff from construction and
industrial sites); Abandoned mine lands (AML); and Illicit straight pipe discharges. General permits (as opposed to site specific permits) are issued to activities that are
similar enough to be covered by a single set of requirements. Storm water permits are issued to activities that discharge only in response to precipitation events. Point sources in the Sandy Creek watershed were identified by consulting EPA’s Permit Compliance System (PCS) website7 (EPA, 2009) and MDNR’s GIS inventory8 of NPDES permitted facilities covered under storm water or general permits.
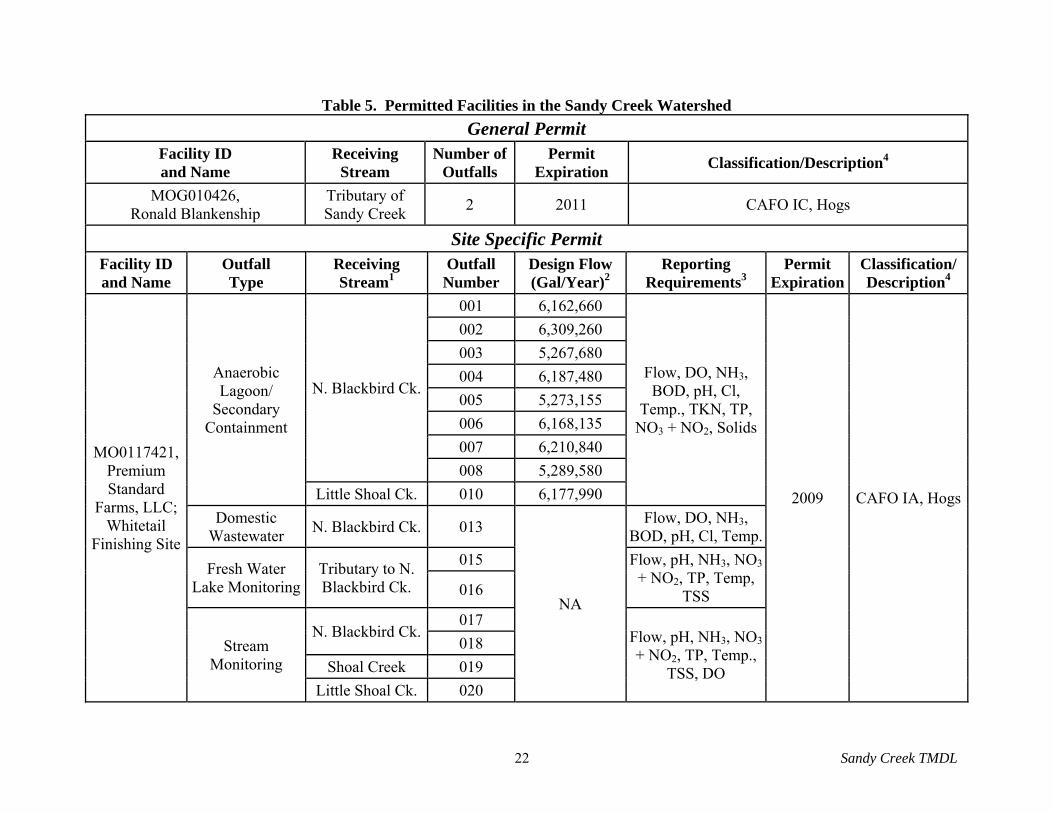
Point sources in Sandy Creek watershed are listed in Table 5 and shown in Figure 6. Of the two permit numbers listed, one is a general permit and the other is a site specific permit. The NPDES permits in Sandy Creek watershed reflect the rural nature of the area. Both the general permit and the site specific permit are related to agricultural activities.
7 www.epa.gov/enviro/html/pcs/index.html 8 http://msdis.missouri.edu/datasearch/ThemeList.jsp; GIS layers updated May 2009 and June 2009 (MSDIS, 2009)

19 Sandy Creek TMDL
3.1.1 Concentrated Animal Feeding Operations
Both point source sites in Table 5 are certified CAFOs. Ronald Blankenship
(MOG010426) operates small CAFOs that are covered by a general NPDES permit. A CAFO can be covered by the general permit if they have a design capacity of less than 7,000 animal units (7,000 beef, 17,500 swine, 4,900 dairy or 210,000 laying hens). Requirements of the general permit include no point source discharge except for storm events that exceed the system design capacity, required monitoring of flow estimates during any discharges to waters of the state and operational monitoring of land application systems (MDNR, 2006b). The other CAFO in the watershed holds a site specific permit - PSF, LLC; Whitetail Finishing Site (PSF Whitetail, MO0117421). PSF Whitetail includes a combined design flow of 0.145 million gallons per day (MGD). This is a hog finishing facility and is designed for finishing 79,488 hogs per year. It is a "no discharge" permit (e.g., effluent is land applied) and would only discharge in the event of an extreme storm event. Wastewater is stored in lagoons and land applied based on the available nitrogen approach. This facility has a waste management system designed to minimize runoff entering the facility and detain runoff emanating from the operation. In addition, it is designed to retain a 25-year, 24-hour rainfall/runoff event as well as an anticipated two weeks of normal wastewater from their operations. Typically, this rainfall event coincides with stream flow that occurs less than 1 to 5 percent of the time. Although the potential number of animals associated with the site specific CAFO is 79,488 head in the watershed, the actual number of animals at the operation is typically less than the number allowed by the facility's permit. Since these CAFOs are no discharge facilities, they are unlikely to impact water quality during critical low flow periods. The watershed has a significant amount of grassland and pasture, therefore the number of smaller animal feeding operations (AFO) that are not permitted is presumably high, particularly during seasonal feeding months in the winter.
Countywide data from the National Agricultural Statistics Service (NASS) (USDA, 2007) were combined with the land cover data for the Sandy Creek watershed to estimate approximately 1,220 cattle in the watershed.9 The cattle are most likely located on the approximately 9.46 square miles of grassland/pastureland in the watershed. The density of cattle in the Sandy Creek watershed (129 cattle per square mile) suggests they are a potential source of TSS and nutrients to the stream. NASS also reports there were 964 sheep and lambs and 374 chickens (layers) in Putnam County in 2007. There was no county level data available for hogs and pigs in Putnam County; however, the large percentage of grassland and pasture in the watershed may serve as ideal seasonal grazing lands for livestock during the winter months, which may account for highly variable livestock populations within the watershed from one year to the next. In summary, animal feeding operations within the watershed have the potential to be a significant source of TSS to Sandy Creek. However, they are not considered to be a contributor of iron to the stream.
9 According to the NASS there are approximately 46,700 head of cattle in Putnam County (USDA, 2007). According to the 2005 MoRAP there are 361 square miles of grasslands in Putnam County (MoRAP, 2005). These values result in a cattle density of approximately 129 cattle per square mile of grasslands in Putnam County. This density was multiplied by the number of grassland square miles in the Sandy Creek watershed to estimate the number of cattle in the watershed.

20 Sandy Creek TMDL
3.1.2 Abandoned Mine Lands
Active and abandoned mine land (AML) areas can be classified as point sources due to
the nature of mining and milling activities, regardless if they are currently covered by a discharge permit (EPA 1993). Within the Sandy Creek watershed, there are two producing and two past producing coal mines (Table 6). All four mines are located near the impaired section of Sandy Creek. Two of the mines’ area are situated along Sandy Creek and two along Little Sandy Creek, a tributary that flows into Sandy Creek within the impaired segment. Neither of the two producing mines listed in MDNR’s database have an active NPDES permit associated with it; however, existing, historic and abandoned coal mines are a known source of pollutants. Other abandoned coal mines in Missouri have been identified by the USGS (Christensen, 2005) as contributing to increased conductivity, iron, manganese, aluminum and sulfate.
Both of the producing mines listed are associated with Missouri Mining, Inc. According to MDNR (Larsen, 2010), Missouri Mining, Inc. had a complex of mines in Putnam County that were active in the late 1970s through the 1980s and perhaps into the very early 1990s. These mines are no longer actively producing coal and have been reclaimed. No open pits remain. MDNR’s Land Reclamation Program (LRP) is involved with these mines since the reclamation of some of these mines is not 100 percent completed. When Missouri Mining, Inc. declared bankruptcy in the early 1990s, the LRP ordered the reclamation bonds forfeited over to the MDNR so the money collected from the bonds could be used to complete the reclamation. Because this mining complex encompassed several thousands of acres, the project is still not 100 percent completed. Consequently, the mines are no longer under permit. Those mining permits were ordered revoked at the same time the reclamation bonds were ordered forfeit.
Historic mining activity has left abandoned mine workings and tailings piles throughout Missouri’s primary mining areas and some likely exist in the Sandy Creek watershed based on its history of mining activity. These AMLs constitute discrete areas of point source delivery of iron, manganese and other heavy metals to the impaired segments. Seepage of dissolved metals from abandoned tailing piles represents another potential secondary source of metals contamination to the impaired water bodies. As precipitation infiltrates tailing piles and moves through the subsurface, metals may become dissolved and enter gaining streams within the watershed via the groundwater recharge pathway. At present the amount and extent of seepage as a secondary source of metals contamination is unknown.
The active and abandoned coal mines in the Sandy Creek watershed are a potential source of these pollutants, but is not a contributor of TSS. According to property owner information, Sampling Location #1 of the URS water quality sampling program was located on reclaimed mining land. Approximate locations of the coal mines are included in Figure 6. 3.1.3 Illicit Straight Pipe Discharges
Illicit straight pipe discharges of household waste have the potential to contribute suspended sediment and nutrients to streams. Illicit discharges drain directly or indirectly to streams and are different than illicitly connected sewers. There is no specific information on the number of illicit straight pipe discharges of households wastes in the Sandy Creek watershed; however, illicit straight pipe discharges are not known or expected to be a significant source of

21 Sandy Creek TMDL
suspended sediment or iron in Sandy Creek compared to other sources in the watershed. Critical periods for impacts from illicit straight pipe connections would be low flow periods, not wet weather conditions
3.1.4 Runoff from MS4 Urban Areas There are no Phase I or Phase II regulated communities within the Sandy Creek watershed at this time.
22 Sandy Creek TMDL
Table 5. Permitted Facilities in the Sandy Creek Watershed
General Permit Facility ID and Name
Receiving Stream
Number of Outfalls
Permit Expiration
Classification/Description4
MOG010426, Ronald Blankenship
Tributary of Sandy Creek
2 2011 CAFO IC, Hogs
Site Specific Permit Facility ID and Name
Outfall Type
Receiving Stream1
Outfall Number
Design Flow (Gal/Year)2
Reporting Requirements3
Permit Expiration
Classification/ Description4
MO0117421, Premium Standard
Farms, LLC; Whitetail
Finishing Site
Anaerobic Lagoon/
Secondary Containment
N. Blackbird Ck.
001 6,162,660
Flow, DO, NH3, BOD, pH, Cl,
Temp., TKN, TP, NO3 + NO2, Solids
2009 CAFO IA, Hogs
002 6,309,260
003 5,267,680
004 6,187,480
005 5,273,155
006 6,168,135
007 6,210,840
008 5,289,580
Little Shoal Ck. 010 6,177,990
Domestic Wastewater
N. Blackbird Ck. 013
NA
Flow, DO, NH3, BOD, pH, Cl, Temp.
Fresh Water Lake Monitoring
Tributary to N. Blackbird Ck.
015 Flow, pH, NH3, NO3
+ NO2, TP, Temp, TSS 016
Stream Monitoring
N. Blackbird Ck.017
Flow, pH, NH3, NO3
+ NO2, TP, Temp., TSS, DO
018
Shoal Creek 019
Little Shoal Ck. 020

23 Sandy Creek TMDL
Storm water Sandy Ck. 021 pH, NH3, NO2+NO3,
TP, Cl, Temp. Storm water Little Shoal Ck. 022
Storm water Little Shoal Ck. 023 1 Permit number MO0117421 lists multiple receiving streams, N = North, Ck. = Creek 2 Gal/Year = Gallons per year. Total permitted flow = 53,046,780 gallons per year or 0.145 MGD. NA = Not Applicable (no design flow). 3 DO = Dissolved Oxygen, NH3 = Ammonia Nitrogen, BOD = Biochemical Oxygen Demand, Cl = Chloride, Temp = Temperature, TKN= Total Kjeldahl Nitrogen, TP = Total Phosphorus, NO3 = Nitrate Nitrogen, NO2 = Nitrite Nitrogen, TSS = Total Suspended Solids. 4 CAFO IA is a concentrated animal feeding operation with 7,000 animal unit equivalents, CAFO IC has 1,000 to 2,999 animal unit equivalents and CAFO II has 300 to 999 animal unit equivalents (MDNR, 2010).
Table 6. Coal Mining Locations in the Sandy Creek Watershed (MDNR, 2008c)
Location in Putnam County Name/ Owner/ Operator
Type of Operation
Status TWP RNG SEC Quarter
66N 17W 31 C N2S2 Eva Maria Mine; Gillum Mine #2
Strip; Gillum Mine #70; Eva Maria Strip / Missouri Mining Inc.
Surface Producer
66N 17W 20 SESW Loren Rowland Mine Underground Past Producer 66N 17W 31 C No Data Surface Past Producer
66N 17W 30 NESENE Missouri Mining Co. No Data Producer

Sandy Creek TMDL 24
Figure 6. Location of Permitted and Unpermitted Facilities in the Sandy Creek Watershed
(Note: MOG010426 is shown twice due to multiple outfalls)

Sandy Creek TMDL 25
3.2 NONPOINT SOURCES
Nonpoint sources are diffuse sources of pollutant loading that typically cannot be identified as entering a water body at a single location and they include all other categories not classified as point sources.
Based on the information before us, the decision to apply discharges associated with
unpermitted sources to the LA, as opposed to the WLA for purposes of this TMDL, is acceptable. The decision to allocate these sources to the LA does not reflect any determination by EPA as to whether these discharges are, in fact, unpermitted point source discharges within this watershed. In addition, by approving these TMDLs with some sources treated as LAs, EPA is not determining that these discharges are exempt from NPDES permitting requirements. If sources of the allocated pollutant in this TMDL are found to be, or become, NPDES-regulated discharges, their loads must be considered as part of the calculated sum of the WLA in this TMDL. WLA in addition to that allocated here is not available.
One exception is AMLs for the dissolved iron TMDL. AMLs are considered to be point sources regardless of their NPDES permit status and are applied to the WLA category. Potential nonpoint sources contributing to the impairment in Sandy Creek include runoff from agricultural areas, such as cropland and pasture, non-regulated animal feeding areas and onsite wastewater treatment systems. Each of these is discussed further in the following sections.
3.2.1 Runoff from Agriculture Areas
The 2005 land use and land cover data (MoRAP, 2005) indicates there are 1,430 cropland acres in the watershed, which comprises 12.8 percent of the entire watershed and 6,052 (54.2 percent) grassland acres in the watershed (Table 2). Additionally, cropland comprises approximately two percent of the riparian buffer, while 34.1 percent is classified as grassland (discussed in Section 3.2.4 and shown in Table 5). Lands used for agricultural purposes can be a source of sediment. Sediment can be dislodged from the soil matrix by agricultural animals in confined spaces and pastures and stream bank erosion can occur when cattle access streams for drinking water. Runoff from these areas can be potential sources of sediment. Animals grazing in pasture areas deposit manure directly upon the land surface and even though a pasture may be relatively large and animal densities low, the manure will often be concentrated near the feeding and watering areas in the field. These areas can quickly become barren of plant cover, increasing the possibility of erosion and contaminated runoff during a storm event. In addition, when pasture land is not fenced off from the stream, cattle or other livestock may contribute sediment to the stream while walking in or adjacent to the water body. In summary, agricultural activities and runoff from these areas have the potential to be significant sources of TSS to Sandy Creek. Agricultural lands in the watershed are not expected to be a significant source of iron to Sandy Creek.
Permitted CAFOs identified in this TMDL are part of the assigned WLA. At this time, AFOs and unpermitted CAFOs are considered under the LA because there is currently not enough detailed information to know whether these facilities are required to obtain NPDES

Sandy Creek TMDL 26
permits. This TMDL does not reflect a determination by EPA that such facility does not meet the definition of a CAFO nor that the facility does not need to obtain a permit. To the contrary, a CAFO that discharges or proposes to discharge has a duty to obtain a permit. If it is determined that any such operation is an AFO or CAFO that discharges, any future WLA assigned to the facility must not result in an exceedance of the sum of the WLAs in this TMDL as approved.
Any CAFO that does not obtain an NPDES permit must operate as a no discharge operation. Any discharge from an unpermitted CAFO is a violation of Section 301. It is EPA’s position that all CAFOs should obtain an NPDES permit because it provides clarity of compliance requirements, authorization to discharge when the discharges are the result of large precipitation events (e.g., in excess of 25-year and 24-hour frequency/duration) or are from a man-made conveyance.
3.2.2 Runoff from Non-MS4 Urban Areas
Only a small portion (0.26 percent) of the Sandy Creek watershed is classified as low
intensity urban and only 1.2 percent of the watershed is identified as impervious. It is unlikely that runoff from urban areas is a significant source of pollutants in the watershed. However, storm water runoff from impervious and urban areas can contribute pollutants during precipitation events. A general description of potential impacts from urban runoff is provided below.
Storm water runoff from urban areas can be a significant source of sediment, bacteria,
nutrients and oxygen consuming substances, such as organic material and chemicals (pesticides and fertilizers). Lawn fertilization can lead to high nutrient loads and pet wastes can contribute both nutrient loads and organic material. For example, phosphorus loads from residential areas can be comparable to or higher than loading rates from agricultural areas (Reckhow et al., 1980; Athayde et al., 1983). Leaking or illicitly connected sewers can also be a significant source of pollutant loads within urban areas. Storm runoff from urban areas such as parking lots and buildings is also warmer than runoff from grassy and woodland areas, which can lead to higher temperatures that lower the dissolved oxygen saturation capacity of the stream. Excessive discharge of suspended solids from urban areas can also lead to streambed siltation problems. Since there are very little impervious or urban areas in the watershed, it is unlikely that runoff from these sources is a significant contributor of TSS or iron to Sandy Creek. 3.2.3 Onsite Wastewater Treatment Systems
Onsite wastewater treatment systems (e.g., septic systems) that are properly designed and
maintained should not serve as a source of contamination to surface waters. However, onsite systems do fail for a variety of reasons. When these septic systems fail hydraulically (surface breakouts) or hydrogeologically (inadequate soil filtration) there can be adverse effects to surface waters (Horsley and Witten, 1996). Failing septic systems are sources of nutrients and pathogens that can reach nearby streams through both runoff and groundwater flows.

Sandy Creek TMDL 27
The exact number of onsite wastewater treatment systems in the Sandy Creek watershed is unknown. However, the EPA’s Spreadsheet Tool for Estimating Pollutant Load (STEPL)10 reports there are 4,747 septic systems within the Upper Chariton Watershed, which is the eight digit HUC watershed that contains the Sandy Creek watershed. The Upper Chariton Watershed has an average population per septic system of 2.23. As discussed in Section 2.4, the estimated rural population of the Sandy Creek watershed is approximately 105 persons. Based on this population and an average density of 2.23 persons per septic system an estimate of approximately 47 systems in the watershed is obtained. An EPA study reports that the estimated failure rate of onsite wastewater systems in Missouri is 30 percent to 50 percent (EPA, 2010). At this failure rate there would be approximately 14 to 24 failing systems in the watershed. No information was identified that would suggest failing onsite wastewater systems are a significant problem in the Sandy Creek watershed. Based on the small numbers of onsite systems they are not considered a significant source of TSS or iron.
3.2.4 Riparian Corridor Conditions
Riparian11 (streamside) corridor conditions can have a strong influence on instream water quality and habitat. Wooded riparian buffers are a vital functional component of stream ecosystems and are instrumental in the detention, removal and assimilation of pollutants from runoff. Therefore, a stream with good riparian cover is better able to moderate the impacts of high pollutant loads than a stream with poor riparian cover. Wooded riparian buffers can also provide shading that reduces stream temperatures and increases the dissolved oxygen saturation capacity of the stream.
As indicated in Table 7, 10.9 percent of the land in the Sandy Creek riparian corridor (defined as 30-meter buffer on either side of Sandy Creek) is classified as herbaceous, 30.3 percent is forested, 20.5 percent is wetlands and 34.1 percent is grassland (MoRAP, 2005). Compared to wooded areas or wetlands, grasslands (which may include pasture areas) generally provide less shading and higher pollutant loads due to livestock and related agricultural activity. Approximately, 34.1 percent of the riparian areas around Sandy Creek are grassland habitat. Consequently, the main land use in the riparian corridor is grassland, which comprises over a third of the riparian area. Agricultural activities within the riparian buffer of Sandy Creek could be a potential source of TSS, but not iron to the impaired segment.
Table 7. Percentage Land Use/Land Cover Within Riparian Buffer, 30-Meter
Land Use/Land Cover1 Acres Square Miles Percent (%) Cropland 3.9 0.006 2.0
Forest 58.8 0.09 30.3 Herbaceous2 21.2 0.03 10.9
Grassland 66.2 0.10 34.1 Open Water 3.9 0.006 2.0
Wetlands 39.8 0.06 20.5 Impervious3 0.5 0.0007 0.2
10 http://bering.tetratech-ffx.com/website/stepl/viewer.htm 11 A riparian corridor (or zone or area) is the linear strip of land running adjacent to a stream bank.

Sandy Creek TMDL 28
Land Use/Land Cover1 Acres Square Miles Percent (%) Total 194.3 0.29 100
1 MoRAP, 2005 2 Herbaceous land uses include open and young woodlands with less than 60 percent cover of deciduous trees (MoRAP, 2005) 3 Impervious land uses includes non-vegetated, impervious surfaces including areas dominated by streets, parking lots and buildings (MoRAP, 2005)
4 APPLICABLE WATER QUALITY STANDARDS AND NUMERIC WATER QUALITY TARGETS
Section 303(d) of the CWA and Chapter 40 of the CFR Part 130 require states to develop
TMDLs for waters not meeting applicable WQS. The purpose of developing a TMDL is to identify the maximum amount of a pollutant load that a water body can receive and still achieve WQS. The TMDL process quantitatively assesses the impairment factors so that states can establish water quality based controls to reduce pollutants of concern from both point and nonpoint sources and work to restore and protect the quality of their water resources. The water quality based approach allows the pollutants entering the water body to be set at a level protective of its designated beneficial uses.
Under the CWA, every state must adopt WQS to protect, maintain and improve the quality of the nation’s surface waters (US Code Title 33, Chapter 26, Subchapter III [US Code, 2008]). These standards represent a level of water quality that will support the CWA’s goal of “fishable/swimmable” waters. Missouri’s WQS (10 Code of State Regulation [CSR, 2009] 20-7.031) consist of three components: designated beneficial uses, criteria (i.e., general and numeric) and an antidegradation policy.
Beneficial or designated uses for Missouri streams are found in the WQS at 10 CSR 20-7.031(1)(C), (1)(F) and Table H (CSR, 2009). Criteria for designated beneficial uses are found at 10 CSR 20-7.031, Tables A and B (CSR, 2009)). Missouri’s antidegradation policy is outlined at 10 CSR 20-7.031(2) (CSR, 2009).
4.1 DESIGNATED BENEFICIAL USES
The impaired Sandy Creek segment (WBID 0652) is three miles in length and is classified as an intermittent stream (C). Designated beneficial uses include12:
Protection of Warm Water Aquatic Life Whole Body Contact Recreation – Category B Livestock and Wildlife Watering Protection of Human Health (Fish Consumption).
The designated beneficial use that is impaired is the Protection of Warm Water Aquatic Life. 12 According to Missouri WQS Table H (CSR, 2009)

Sandy Creek TMDL 29
4.2 CRITERIA
In the 2008 Missouri 303(d) List, Sandy Creek is listed as impaired due to unknown pollutants. Water quality monitoring has revealed an exceedance of the dissolved iron numeric criterion of 1,000 µg /L and elevated levels of TSS in Sandy Creek.
The TMDL for iron is based on attainment of the Missouri aquatic life standard for dissolved iron of 1,000 µg /L under all flow conditions, as stated in 10 CSR 20-7.031, Table A (CSR, 2009).
There are many quantitative indicators of sediment, such as TSS, turbidity and bedload sediment, which are appropriate to describe sediment in rivers and streams (EPA, 2006). A concentration of TSS was selected to represent the numeric target for this TMDL because it enables the use of the highest quality available data and is included in monitoring data. In the absence of Missouri numeric standards for TSS, a reference approach was used. The TSS target is 11.0 mg/L and is derived by targeting the 25th percentile base load concentration of TSS measurements collected by the USGS in Grand/Chariton EDU (12) where Sandy Creek is located.
All water bodies in Missouri are protected by the general criteria (standards) contained in Missouri’s WQS, 10 CSR20-7.031(3). These criteria are also called narrative criteria, since they do not contain specific numeric limits. The narrative criteria not being met in Sandy Creek are (3)(A), (D) and (G):
Waters shall be free from substances in sufficient amounts to cause the formation of putrescent, unsightly or harmful bottom deposits or prevent full maintenance of beneficial uses.
Waters shall be free from substances or conditions in sufficient amounts to result in toxicity to human, animal or aquatic life.
Waters shall be free from physical, chemical or hydrologic changes that would impair the natural biological community.
4.3 ANTIDEGRADATION POLICY
Missouri’s WQS include EPA’s “three-tiered” approach to antidegradation, which may
be found at 10 CSR 20-7.031(2) (CSR, 2009).
Tier 1 – Protects existing uses and a level of water quality necessary to maintain and protect those uses. Tier 1 provides the absolute floor of water quality for all waters of the United States. Existing instream water uses are those uses that were attained on or after November 28, 1975, the date of EPA’s first WQS Regulation. Tier 2 – Protects and maintains the existing level of water quality where it is better than applicable water quality criteria. Before water quality in Tier 2 waters can be lowered, there must be an antidegradation review consisting of: 1) a finding that it is necessary to accommodate important economic and social development in the area where the waters

Sandy Creek TMDL 30
are located; 2) full satisfaction of all intergovernmental coordination and public participation provisions; and 3) assurance that the highest statutory and regulatory requirements for point sources and best management practices (BMPs) for nonpoint sources are achieved. Furthermore, water quality may not be lowered to less than the level necessary to fully protect the “fishable/swimmable” uses and other existing designated beneficial uses.
Tier 3 – Protects the quality of outstanding national and state resource waters, such as waters of national and state parks, wildlife refuges and waters of exceptional recreational or ecological significance. There may be no new or increased discharges to these waters and no new or increased discharges to tributaries of these waters that would result in lower water quality.
5 MODELING APPROACH When stream flow gage information is available, a LDC is useful in identifying and
differentiating between storm-driven and steady-input sources (Cleland, 2002 and Cleland, 2003). For Sandy Creek, the LDC approach was used to: 1) provide a visual representation of stream flow conditions under which elevated levels of TSS and dissolved iron criteria exceedances have occurred, 2) assess critical conditions and 3) quantify the LC of the stream to meet the surface water quality targets for TSS and dissolved iron.
A limited amount of flow data is available in the Sandy Creek watershed (Appendix A),
which was inadequate for developing a LDC. To address this issue, a synthetic flow analysis was used. To develop a synthetic flow based duration curve for Sandy Creek, flow records from seven USGS gaging stations (Table 8) in the same ecological region were used to establish a daily flow per square-mile estimate. Average daily flow per square-mile from the seven stations was calculated for each day of record and multiplied by the impaired watershed area (17.43 square miles). In the Sandy Creek watershed, no continuously discharging permitted wastewater facilities or separate storm water sewer systems (MS4) are present. To construct a LDC, the synthetic flow was estimated for the period from July 20, 1978 to July 14, 2010. A detailed discussion of methods used to develop the TSS and dissolved iron LDCs is presented in Appendix B and Appendix C.

Sandy Creek TMDL 31
Table 8. Stream Flow Stations Used to Estimate Flows in Sandy Creek
River/Station Name Data
Source Station Number
Drainage Area (mi2)
Discharge Record
Latitude/ Longitude
Medicine Creek near Laredo, MO
USGS 06900050 355 2000–2010 40°01'35.8", 93°26'10.4"
East Fork Little Chariton River near Huntsville, MO
USGS 06906300 220 1962-2010 39°27'17.7", 92°34'06.6"
East Fork Big Creek near Bethany, MO
USGS 06897000 95 1934–2010 40°17'50.0", 94°01'34.4"
Medicine Creek near Galt, MO
USGS 06900000 225 1918–2010 40°07'47.1", 93°21'45.2"
Mussel Fork near Mussel Fork, MO
USGS 06906000 267 1948–2010 39°31'24.7", 92°56'58.7"
South Fork Chariton River near Promise City, IA
USGS 06903700 168 1967-2010 40°48'02", 93°11'32"
Chariton River near Chariton, IA
USGS 06903400 182 1967-2010 40°57'06.8", 93°15'34.7"
5.1 CRITERION TO SUPPORT THE TMDL In Sandy Creek, where narrative standards for TSS are targeted for the impaired segment,
a reference stream approach was used to define the TSS TMDL target. The TSS target was developed to protect the aquatic life designated use of the stream. Missouri does not have a numeric criterion for TSS; therefore a statistical approach was used to develop a target for TSS. The dissolved iron target is 1,000 µg /L based on the Missouri WQS numeric criterion to protect aquatic life, as stated in 10 CSR 20-7.031, Table A (CSR, 2009). The methods used to establish the TSS target differ from the method used to establish the dissolved iron target and are described below.
The TSS target is 11.0 mg/L and was based on a reference approach by targeting the 25th percentile of TSS base load concentration data (USGS, non-filterable residue) available within the Grand/Chariton EDU (12) where Sandy Creek is located (see Appendix C for a list of sites and data). To develop the LDC for TSS, measured TSS concentrations are adjusted so that their median is equal to the 25th percentile base load concentration of TSS measurements collected by the USGS in the EDU. This is accomplished by adjusting the measured data using the ratio between the 25th percentile target and the median from the measured data and results in the data retaining most of its variability while having a median that meets the 25th percentile target. This adjusted data was then regressed as yield (pounds/day) versus instantaneous flow (cfs). The resultant regression equation was used to develop the load duration curve. A detailed discussion of the method used to develop the TSS target is provided in Appendix B.

Sandy Creek TMDL 32
6 CALCULATION OF LOADING CAPACITY
LC is defined as the maximum amount of a pollutant that a water body can assimilate without exceeding WQS. This load is then divided among the point source (WLA) and nonpoint source (LA) pollutant contributions to the stream, with an allowance for an explicit MOS. The MOS accounts for uncertainty in the relationship between pollutant loads and the quality of the receiving water body. Conceptually, this definition is represented by the equation:
LC = Σ WLA + Σ LA + MOS Equation 1
Where:
LC = Loading Capacity
WLA = Wasteload Allocation (point source)
LA = Load Allocation (nonpoint source)
MOS = Margin of Safety (may be implicit and factored into a conservative WLA or LA or explicit)
The objective of the TMDL is to estimate allowable pollutant loads and to allocate these loads to known pollutant sources within the watershed so appropriate control measures can be implemented and achieve WQS. The CFR (40 CFR § 130.2 (1)) states that TMDLs can be expressed in terms of mass per time, toxicity or other appropriate measures. For Sandy Creek, TSS and dissolved iron TMDLs are expressed as pound per day (lb/day) using a LDC (Figure 7, Figure 8, Table 9 and Table 10). The LDC represents the LC as a solid red line over the range of flow conditions present in the creek. Water quality measurements, shown as points, are loads calculated from TSS and dissolved iron concentrations collected in Sandy Creek.
As presented in Figure 7, excursions to the TSS TMDL occurred under all flow conditions. A minimal amount of data is available for dissolved iron (Figure 8); however, of the data available, one of ten water column measurements and one of six interstitial water measurements were found to be above the numeric criterion of 1,000 µg /L.

Sandy Creek TMDL 33
1
100
10,000
1,000,000
0% 20% 40% 60% 80% 100%Percentile Exceedance
TS
S (
lbs/
day
)
TMDL Sample Data
Figure 7. TSS LDC for Sandy Creek
Figure 8. Dissolved Iron LDC for Sandy Creek
Sandy Creek TMDL 34
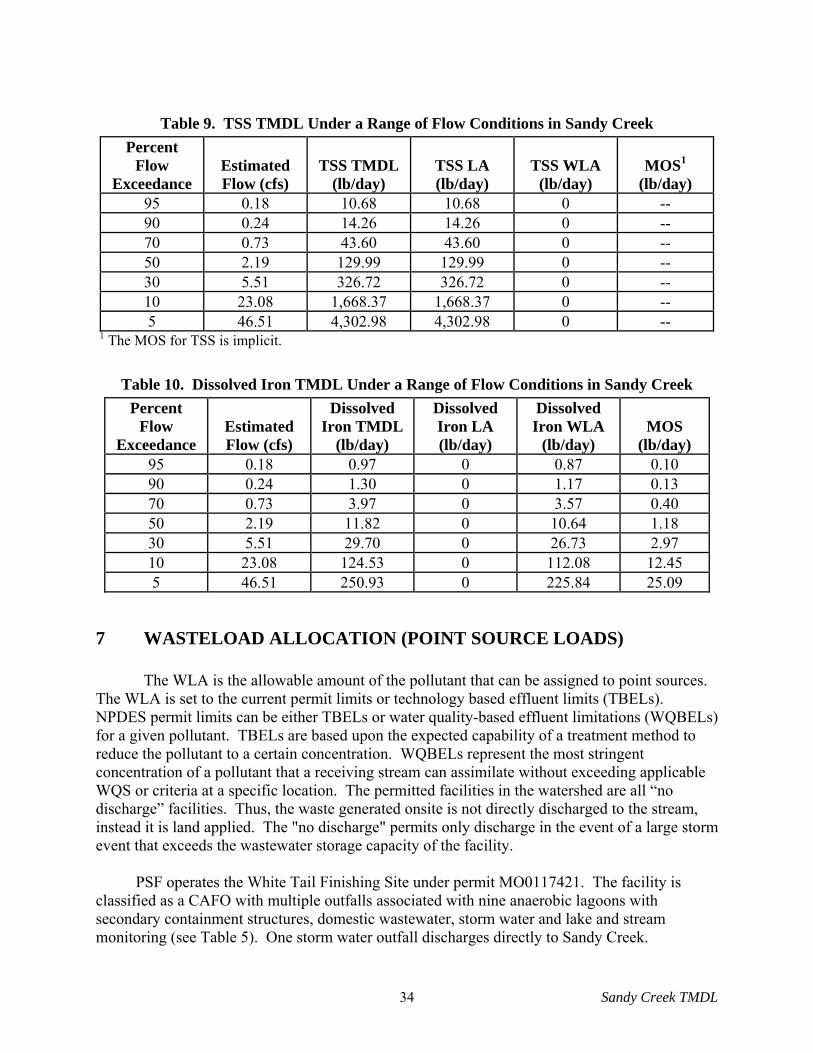
Table 9. TSS TMDL Under a Range of Flow Conditions in Sandy Creek
Percent Flow
Exceedance Estimated Flow (cfs)
TSS TMDL (lb/day)
TSS LA (lb/day)
TSS WLA (lb/day)
MOS1 (lb/day)
95 0.18 10.68 10.68 0 -- 90 0.24 14.26 14.26 0 -- 70 0.73 43.60 43.60 0 -- 50 2.19 129.99 129.99 0 -- 30 5.51 326.72 326.72 0 -- 10 23.08 1,668.37 1,668.37 0 -- 5 46.51 4,302.98 4,302.98 0 --
1 The MOS for TSS is implicit.
Table 10. Dissolved Iron TMDL Under a Range of Flow Conditions in Sandy Creek
Percent Flow
Exceedance Estimated Flow (cfs)
Dissolved Iron TMDL
(lb/day)
Dissolved Iron LA (lb/day)
Dissolved Iron WLA
(lb/day) MOS
(lb/day) 95 0.18 0.97 0 0.87 0.10 90 0.24 1.30 0 1.17 0.13 70 0.73 3.97 0 3.57 0.40 50 2.19 11.82 0 10.64 1.18 30 5.51 29.70 0 26.73 2.97 10 23.08 124.53 0 112.08 12.45 5 46.51 250.93 0 225.84 25.09
7 WASTELOAD ALLOCATION (POINT SOURCE LOADS)
The WLA is the allowable amount of the pollutant that can be assigned to point sources. The WLA is set to the current permit limits or technology based effluent limits (TBELs). NPDES permit limits can be either TBELs or water quality-based effluent limitations (WQBELs) for a given pollutant. TBELs are based upon the expected capability of a treatment method to reduce the pollutant to a certain concentration. WQBELs represent the most stringent concentration of a pollutant that a receiving stream can assimilate without exceeding applicable WQS or criteria at a specific location. The permitted facilities in the watershed are all “no discharge” facilities. Thus, the waste generated onsite is not directly discharged to the stream, instead it is land applied. The "no discharge" permits only discharge in the event of a large storm event that exceeds the wastewater storage capacity of the facility.
PSF operates the White Tail Finishing Site under permit MO0117421. The facility is
classified as a CAFO with multiple outfalls associated with nine anaerobic lagoons with secondary containment structures, domestic wastewater, storm water and lake and stream monitoring (see Table 5). One storm water outfall discharges directly to Sandy Creek.
Sandy Creek TMDL 35
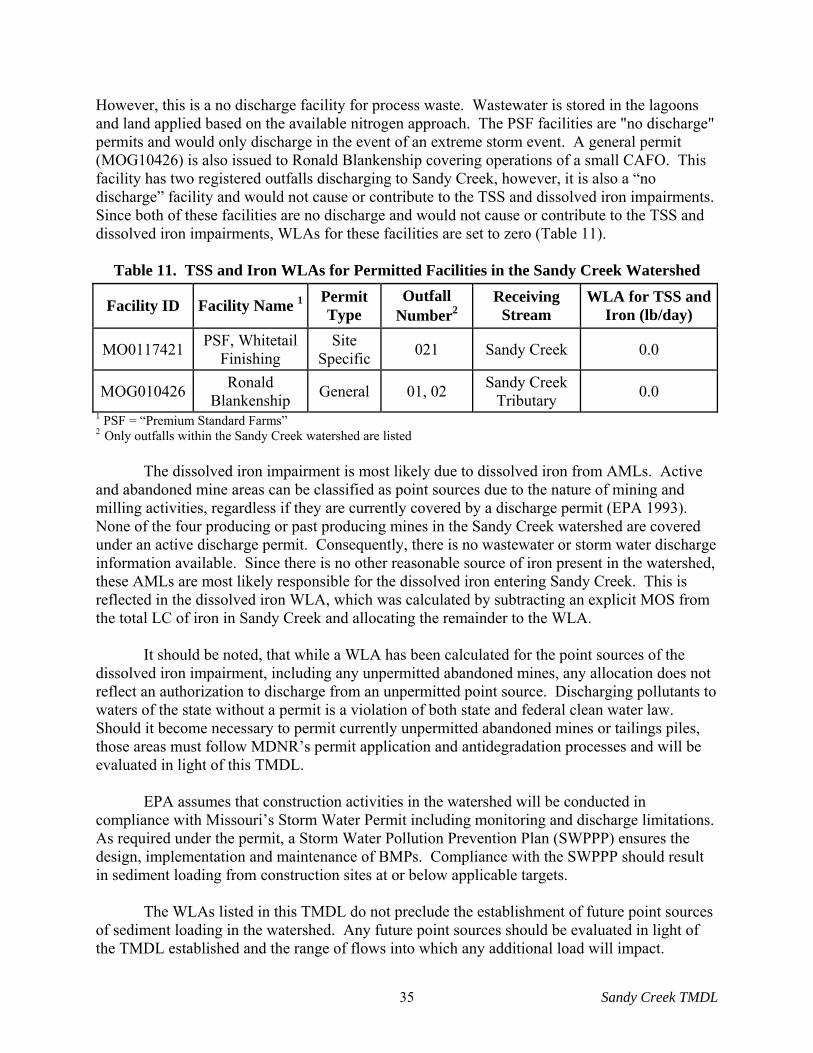
However, this is a no discharge facility for process waste. Wastewater is stored in the lagoons and land applied based on the available nitrogen approach. The PSF facilities are "no discharge" permits and would only discharge in the event of an extreme storm event. A general permit (MOG10426) is also issued to Ronald Blankenship covering operations of a small CAFO. This facility has two registered outfalls discharging to Sandy Creek, however, it is also a “no discharge” facility and would not cause or contribute to the TSS and dissolved iron impairments. Since both of these facilities are no discharge and would not cause or contribute to the TSS and dissolved iron impairments, WLAs for these facilities are set to zero (Table 11).
Table 11. TSS and Iron WLAs for Permitted Facilities in the Sandy Creek Watershed
Facility ID Facility Name 1 Permit Type
Outfall Number2
Receiving Stream
WLA for TSS and Iron (lb/day)
MO0117421 PSF, Whitetail
Finishing Site
Specific 021 Sandy Creek 0.0
MOG010426 Ronald
Blankenship General 01, 02
Sandy Creek Tributary
0.0
1 PSF = “Premium Standard Farms” 2 Only outfalls within the Sandy Creek watershed are listed
The dissolved iron impairment is most likely due to dissolved iron from AMLs. Active and abandoned mine areas can be classified as point sources due to the nature of mining and milling activities, regardless if they are currently covered by a discharge permit (EPA 1993). None of the four producing or past producing mines in the Sandy Creek watershed are covered under an active discharge permit. Consequently, there is no wastewater or storm water discharge information available. Since there is no other reasonable source of iron present in the watershed, these AMLs are most likely responsible for the dissolved iron entering Sandy Creek. This is reflected in the dissolved iron WLA, which was calculated by subtracting an explicit MOS from the total LC of iron in Sandy Creek and allocating the remainder to the WLA.
It should be noted, that while a WLA has been calculated for the point sources of the
dissolved iron impairment, including any unpermitted abandoned mines, any allocation does not reflect an authorization to discharge from an unpermitted point source. Discharging pollutants to waters of the state without a permit is a violation of both state and federal clean water law. Should it become necessary to permit currently unpermitted abandoned mines or tailings piles, those areas must follow MDNR’s permit application and antidegradation processes and will be evaluated in light of this TMDL.
EPA assumes that construction activities in the watershed will be conducted in
compliance with Missouri’s Storm Water Permit including monitoring and discharge limitations. As required under the permit, a Storm Water Pollution Prevention Plan (SWPPP) ensures the design, implementation and maintenance of BMPs. Compliance with the SWPPP should result in sediment loading from construction sites at or below applicable targets.
The WLAs listed in this TMDL do not preclude the establishment of future point sources
of sediment loading in the watershed. Any future point sources should be evaluated in light of the TMDL established and the range of flows into which any additional load will impact.

Sandy Creek TMDL 36
8 LOAD ALLOCATION (NONPOINT SOURCE LOADS) The LA includes all existing and future nonpoint sources and natural background
contributions (40 CFR § 130.2(g)) of the pollutants of concern. LA is the allowable amount of the pollutant that can be assigned to nonpoint sources. The LA is set at the remainder for the TMDL loading curve after removing allowances for the point source WLA and MOS. Because all point sources for TSS in the watershed received a zero WLA and the MOS is implicit, the total LC is allocated to nonpoint sources as LA. For dissolved iron, the total LC is allocated to the WLA and the explicit MOS because the LA is set to zero. TSS and dissolved iron LAs are provided in Tables 9 and 10.
9 MARGIN OF SAFETY
A MOS is required in the TMDL calculation to account for uncertainties in scientific and technical understanding of water quality in natural systems. The MOS is intended to account for such uncertainties in a conservative manner. Based on EPA guidance, the MOS can be achieved through one of two approaches:
1) Explicit – Reserve a numeric portion of the LC as a separate term in the TMDL 2) Implicit – Incorporate the MOS as part of the critical conditions for the WLA and the
LA calculations by making conservative assumptions in the analysis.
An implicit MOS was incorporated into the TSS TMDL based on conservative assumptions used in the development of the TSS LDC. In the case of TSS, a reference approach used was to target the 25th percentile of all concentration data available in the EDU in which Sandy Creek is located (see Appendix B and C). The use of this EDU specific data ensures that all local geologic and landscape conditions are addressed in this TMDL. An explicit MOS of 10 percent was incorporated into the dissolved iron TMDL.
10 CRITICAL CONDITIONS AND SEASONAL VARIATION
Although there were insufficient water quality data to determine any seasonal pattern that may be occurring in the Sandy Creek watershed, exceedances to the water quality criteria were present under both low and high flow conditions (Figure 7 and Figure 8). The TMDL LDC for TSS represents flow under all conditions. Because the WLA, LA and TMDL are applicable at all flow conditions, they are also applicable and protective over all seasons. One advantage of the LDC approach is that all flow conditions are considered and the constraints associated with using a single-flow critical condition are avoided.
Sandy Creek TMDL 37
11 MONITORING PLANS A stressor study was conducted on Sandy Creek in 2009 - 2010 by Versar, Inc.
(published 2010). No future monitoring has been scheduled for Sandy Creek at this time. In general, future stream monitoring is scheduled and conducted by MDNR approximately three years after the approval of a TMDL or in a reasonable time frame following the completion of permit compliance schedules and/or the application of new effluent limits. MDNR will routinely examine physical habitat, water quality, invertebrate and fish community data collected by the Missouri Department of Conservation under its Resource Assessment and Monitoring (RAM) Program. This program randomly samples streams across Missouri on a five- to six- year rotating schedule.
12 REASONABLE ASSURANCES MDNR has the authority to issue and enforce state operating permits. Inclusion of
effluent limits into a state operating permit and requiring that effluent and instream monitoring be reported to MDNR should provide reasonable assurance that instream WQS will be met. Section 301(b)(1)(C) requires that point source permits have effluent limits as stringent as necessary to meet WQS. However, for WLAs to serve that purpose, they must themselves be stringent enough so that (in conjunction with the water body’s other loadings) they meet WQS. This generally occurs when the TMDL’s combined nonpoint source LAs and point source WLAs do not exceed the WQS-based LC and there is reasonable assurance that the TMDL's allocations can be achieved. Discussion of reduction efforts relating to nonpoint sources can be found in the implementation section of the TMDL.
13 PUBLIC PARTICIPATION EPA regulations require that TMDLs be subject to public review (40 CFR 130.7). EPA
is providing public notice of this draft TMDL for Sandy Creek on the EPA, Region 7, TMDL Website: http://www.epa.gov/region07/water/tmdl_public_notice.htm. The response to comments and final TMDL will be available at: http://www.epa.gov/region07/water/apprtmdl.htm#Missouri.
This water quality limited segment of Sandy Creek in Putnam County, Missouri, is included on the EPA-approved 2008 Missouri 303(d) List. This TMDL is being established by EPA to meet the requirements of the 2001 Consent Decree, American Canoe Association, et al. v. EPA, No. 98-1195-CV-W in consolidation with No. 98-4282-CV-W, February 27, 2001. EPA is developing this TMDL in cooperation with the state of Missouri and EPA is establishing this TMDL at this time to meet the American Canoe consent decree milestones. Missouri may submit and EPA may approve a revised or modified TMDL for this water at any time.
Before finalizing EPA established TMDLs (such as this TMDL), the public is notified that a comment period is open on the EPA Region 7 website for at least 30 days. EPA’s public notices to comment on draft TMDLs are also distributed via mail and electronic mail to major

Sandy Creek TMDL 38
stakeholders in the watershed or other potentially impacted parties. After the comment period closes, EPA reviews all comments, edits the TMDL as is appropriate, writes a Summary of Response to Comments and establishes the TMDL. For Missouri TMDLs, groups receiving the public notice announcement include a distribution list provided by MDNR, the Missouri Clean Water Commission, the Missouri Water Quality Coordinating Committee, stream team volunteers, state legislators, county commissioners, the County Soil and Water Conservation District and potentially impacted cities, towns and facilities. EPA followed this public notice process for this TMDL. Links to active public notices for draft TMDLs, final (approved and established) TMDLs and Summary of Response to Comments are posted on the EPA Website: http://www.epa.gov/region07/water/tmdl.htm.
14 ADMINISTRATIVE RECORD AND SUPPORTING DOCUMENTATION An administrative record on the Sandy Creek TMDL has been assembled and is being
kept on file with EPA. APPENDICES Appendix A – Sandy Creek Water Quality Data Appendix B – Development of TSS Targets Using Reference LDCs Appendix C – Stream Flow and Water Quality Stations Used to Develop TMDLs in Sandy
Creek Appendix D – Supplemental Implementation Plan
Sandy Creek TMDL 39
REFERENCES
Athayde, D., P. Shelley, E. Driscoll, D. Gaboury and G. Boyd, 1983. Results of the Nationwide Urban Runoff Program, Volume I – Final Report. Water Planning Division, EPA, Washington D.C.
Christensen, E.D., 2005. Assessment, water-quality trends and options for remediation of acidic drainage from abandoned coal mines near Huntsville, Missouri, 2003–2004: U.S. Geological Survey Scientific Investigations Report 2005 – 5202. USGS, Reston, VA.
Cleland, B.R., 2002. TMDL Development From the “Bottom Up” – Part II: Using Load Duration Curves to Connect the Pieces. Proceedings from the WEF National TMDL Science and Policy 2002 Conference. America’s Clean Water Foundation, Washington, D.C.
Cleland, B.R., 2003. TMDL Development From the “Bottom Up” – Part III: Duration Curves and Wet-Weather Assessments. America’s Clean Water Foundation, Washington, D.C.
CSR (Code of State Regulations), 2009. Missouri Secretary of State Web page. Title 10 -Department of Natural Resources, Division 20 – Clean Water Commission, Chapter 7 – Water Quality. 10 CSR 20-7.031 - Water Quality Standards. Jefferson City, MO. http://www.sos.mo.gov/adrules/csr/current/10csr/10c20-7.pdf
EPA (United States Environmental Protection Agency), 1993. Memo: NPDES Permit Issues and Hard Rock Mines. EPA Region VIII, Denver, CO.
EPA, 2000. Ambient Water Quality Criteria Recommendations. Information Supporting the Development of State and Tribal Nutrient Criteria. Rivers and Streams in Nutrient Ecoregion IX. EPA 822-B-00-019. Washington, D.C.
EPA, 2006. Framework for Developing Suspended and Bedded Sediments (SABS) Water Quality Criteria. EPA-822-R-06-001. Washington, D.C.
EPA, 2009. Water Discharge Permits (PCS). Accessed July 17, 2009. http://www.epa.gov/enviro/html/pcs/index.html
EPA, 2010. Region 5 STEPL Online Database. 2003. Accessed March 29, 2010. http://bering.tetratech-ffx.com/website/stepl/viewer.htm
Horsley & Witten, Inc., 1996. Identification and Evaluation of Nutrient and Bacterial Loadings to Maquoit Bay, Brunswick and Freeport, Maine. Casco Bay Estuary Project. Portland, ME.
Larsen, Michael, 2010. Personal Correspondence. Missouri Department of Natural Resources – Land Reclamation Program. May 2010.
MDC (Missouri Department of Conservation), 2010. Chariton River Watershed – Geology/Geomorphology, Physiographic Region/Geology/Soils. Accessed February 16, 2010. http://mdc.mo.gov/fish/watershed/chariton/geology/

Sandy Creek TMDL 40
MSWDC (Missouri Soil and Water Districts Commission), 2003. Needs Assessment, Plan to Address Identified Needs & A Summary to Date, Accessed February 16, 2010. http://www.dnr.mo.gov/env/swcp/2003%20needs%20assessment.pdf
MDNR (Missouri Department of Natural Resources), 2006a. Total Maximum Daily Load Information Sheet For Streams Where the Pollutant is Unknown. Accessed April 16, 2010. http://www.dnr.mo.gov/env/wpp/tmdl/info/unknowns-info.pdf
MDNR, 2006b. Missouri State Operating Permit – General Permit (MOG010000). Jefferson City, MO. http://www.dnr.mo.gov/env/wpp/permits/issued/G010000.pdf
MDNR, 2008a. Final Consolidated 2008 Missouri 303(d). Jefferson City, MO. http://www.dnr.mo.gov/env/wpp/waterquality/303d/2008/2008-303d-final.pdf
MDNR, 2008b. Biological Assessment and Habitat Study Report – Sandy Creek, Putnam County. Jefferson City, MO.
MDNR, 2008c. Inventory of Mines, Occurrences and Prospects in Missouri. Prepared by Missouri Department of Natural Resources, Division of Geology and Land Survey (DGLS), Geological Survey Program (GSP). Prepared on January 10, 2008. ftp://msdis.missouri.edu/pub/state/st_imop.zip
MDNR, 2009a. Agricultural Nonpoint Source, Special Area Land Treatment Program, NPS Problems. http://www.dnr.mo.gov/env/swcp/service/Salt/nps_problems.htm#improper %20animal%20waste%20management
MDNR, 2009b. Sandy Creek Water Quality Data 2000-2009.
MDNR, 2010. How to Obtain a Concentrated Animal Feeding Operations Permit in Missouri. Jefferson City, MO. http://www.dnr.mo.gov/pubs/pub2351.pdf
MoRAP (Missouri Resource Assessment Partnership), 2005. Land Use/Land Cover Data. Accessed April 26, 2007. http://www.msdis.missouri.edu
MSDIS (Missouri Spatial Data Information Service), 2009. GIS Layers Downloaded May 2009. http://msdis.missouri.edu/datasearch/ThemeList.jsp
NOAA (National Oceanic and Atmospheric Administration). NNDC Climate Data Online. Accessed March 29, 2010. http://cdo.ncdc.noaa.gov/climatenormals/clim20/mo/234544.pdf
NRCS (Natural Resources Conservation Service), 2009 Soil Data Mart. Accessed July 17, 2009. http://soildatamart.nrcs.usda.gov/Survey.aspx?County=MO001
Purdue Research Foundation, 2009. Hydrologic Soil Groups. Accessed July 17, 2009. http://www.ecn.purdue.edu/runoff/documentation/hsg.html
Reckhow, K. H., M. N. Beaulac and J. R. Simpson, 1980. Modeling Phosphorous Loading and Lake Response Under Uncertainty: A Manual and Compilation of Export Coefficients. EPA-440/5-8-011, U.S. Environmental Protection Agency, Washington, D.C.
United States Census Bureau, 2000. 2000 Population Estimates. Accessed November 6, 2008, http://www.census.gov/
URS Corporation, 2010. Sampling Collection and Data Report. Sampling for Consent Decree Waters in Missouri – Sandy Creek.

Sandy Creek TMDL 41
USDA (United States Department of Agriculture), 2007. National Agriculture Statistics Service. Accessed February 19, 2009. http://www.nass.usda.gov/
USDI (United States Department of the Interior) - US Geological Survey, 1997. Standards for Digital Raster Graphics. Reston, VA.
USDI - US Geological Survey, 2005. Mineral Resources On-line Spatial Data. Accessed April 16, 2010. http://mrdata.usgs.gov/sgmc/mo.html

Sandy Creek TMDL 42
Appendix A
MDNR Sandy Creek Water Quality Data
Project Name
Agency Site Site Name Year Month Day Flow (cfs)
Iron (µg/L)
TSS (mg/L)
TSS Method
Sandy Cr. MDNR 652/2.4 Sandy Cr. @ Hwy YY 2005 11 9 0.2499
Sandy Cr. MDNR 652/2.4 Sandy Cr. @ Hwy YY 2007 9 1
Sandy Cr. MDNR 652/2.4 Sandy Cr. @ Hwy YY 2009 2 27 5 206 SM 2540D
Sandy Cr. MDNR 652/2.4 Sandy Cr. @ Hwy YY 2009 5 26 3 2.499 SM 2540D
Sandy Cr. MDNR 652/2.4 Sandy Cr. @ Hwy YY 2006 2 17 0.05
Sandy Cr. MDNR 652/2.4 Sandy Cr. @ Hwy YY 2008 3 27 2.2
Sandy Cr. MDNR 652/2.4 Sandy Cr. @ Hwy YY 2009 3 11 10 86 SM 2540D
Sandy Cr. MDNR 652/2.4 Sandy Cr. @ Hwy YY 2006 5 26 0.2
Sandy Cr. MDNR 652/2.4 Sandy Cr. @ Hwy YY 2005 7 14 0.1
Sandy Cr. MDNR 652/2.4 Sandy Cr. @ Hwy YY 2009 5 6 1.5 13 SM 2540D
Sandy Cr. MDNR 652/2.4 Sandy Cr. @ Hwy YY 2009 4 20 2 6 SM 2540D
Sandy Cr. MDNR 652/3.1/0.4 Sandy Cr. @Calamint Rd. 2008 4 1 0.77
Sandy Cr. MDNR 652/3.1/0.4 Sandy Cr. @Calamint Rd. 2007 9 1
PSF 652/3.0/3.9 Sandy Cr. DS of PSF Whitetail (Site 35) 2002 5 23 50 431
PSF 652/3.0/3.9 Sandy Cr. DS of PSF Whitetail (Site 35) 2002 1 23 0.02 37
PSF 652/3.0/3.9 Sandy Cr. DS of PSF Whitetail (Site 35) 2002 6 26 18
PSF 652/3.0/3.9 Sandy Cr. DS of PSF Whitetail (Site 35) 2002 9 25 76
PSF 652/3.0/3.9 Sandy Cr. DS of PSF Whitetail (Site 35) 2002 3 18 0.07 5
PSF 652/3.0/3.9 Sandy Cr. DS of PSF Whitetail (Site 35) 2001 4 25 0.62 8
PSF 652/3.0/3.9 Sandy Cr. DS of PSF Whitetail (Site 35) 2001 2 7 1.01 13
PSF 652/3.0/3.9 Sandy Cr. DS of PSF Whitetail (Site 35) 2001 3 27 3.01 34
PSF 652/3.0/3.9 Sandy Cr. DS of PSF Whitetail (Site 35) 2002 2 26 0.03 12
PSF 652/3.0/3.9 Sandy Cr. DS of PSF Whitetail (Site 35) 2001 10 29 0.31 2.499
PSF 652/3.0/3.9 Sandy Cr. DS of PSF Whitetail (Site 35) 2002 4 23 0.11 5
PSF 652/3.0/3.9 Sandy Cr. DS of PSF Whitetail (Site 35) 2001 11 28 0.11 5
PSF 652/3.0/3.9 Sandy Cr. DS of PSF Whitetail (Site 35) 2001 1 31 0.02 3.499
PSF 652/3.0/3.9 Sandy Cr. DS of PSF Whitetail (Site 35) 2002 5 30 0.14 23
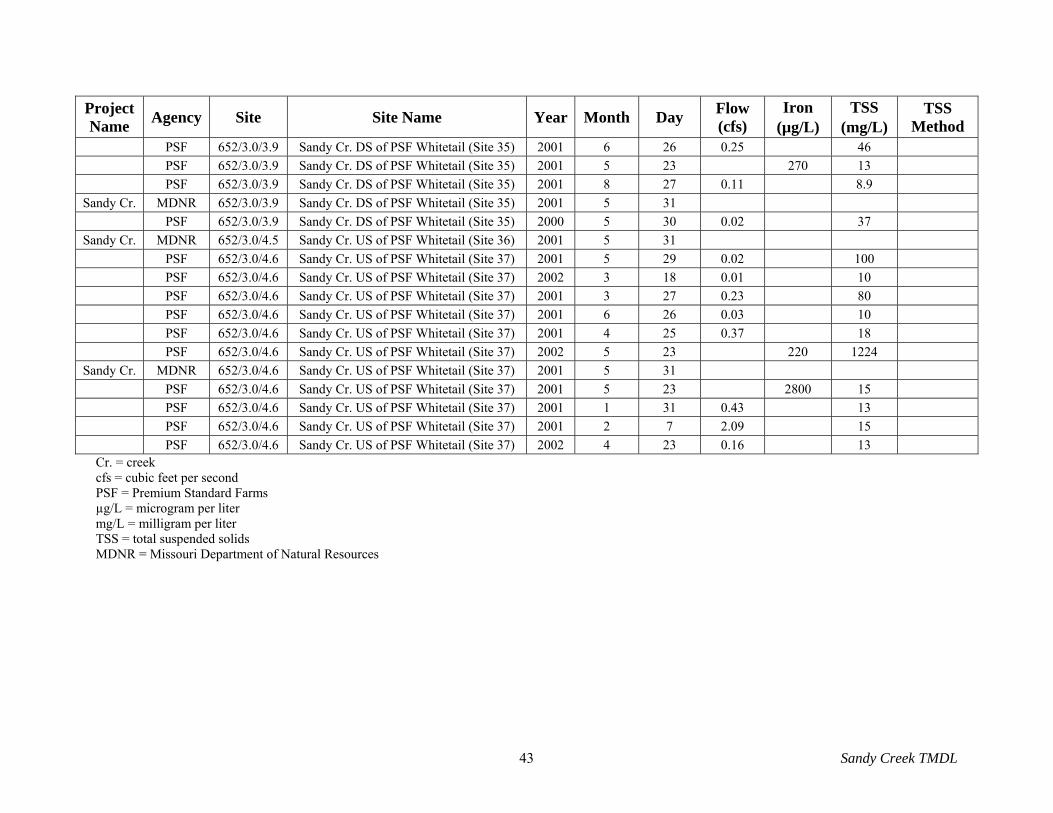
Sandy Creek TMDL 43
Project Name
Agency Site Site Name Year Month Day Flow (cfs)
Iron (µg/L)
TSS (mg/L)
TSS Method
PSF 652/3.0/3.9 Sandy Cr. DS of PSF Whitetail (Site 35) 2001 6 26 0.25 46
PSF 652/3.0/3.9 Sandy Cr. DS of PSF Whitetail (Site 35) 2001 5 23 270 13
PSF 652/3.0/3.9 Sandy Cr. DS of PSF Whitetail (Site 35) 2001 8 27 0.11 8.9
Sandy Cr. MDNR 652/3.0/3.9 Sandy Cr. DS of PSF Whitetail (Site 35) 2001 5 31
PSF 652/3.0/3.9 Sandy Cr. DS of PSF Whitetail (Site 35) 2000 5 30 0.02 37
Sandy Cr. MDNR 652/3.0/4.5 Sandy Cr. US of PSF Whitetail (Site 36) 2001 5 31
PSF 652/3.0/4.6 Sandy Cr. US of PSF Whitetail (Site 37) 2001 5 29 0.02 100
PSF 652/3.0/4.6 Sandy Cr. US of PSF Whitetail (Site 37) 2002 3 18 0.01 10
PSF 652/3.0/4.6 Sandy Cr. US of PSF Whitetail (Site 37) 2001 3 27 0.23 80
PSF 652/3.0/4.6 Sandy Cr. US of PSF Whitetail (Site 37) 2001 6 26 0.03 10
PSF 652/3.0/4.6 Sandy Cr. US of PSF Whitetail (Site 37) 2001 4 25 0.37 18
PSF 652/3.0/4.6 Sandy Cr. US of PSF Whitetail (Site 37) 2002 5 23 220 1224
Sandy Cr. MDNR 652/3.0/4.6 Sandy Cr. US of PSF Whitetail (Site 37) 2001 5 31
PSF 652/3.0/4.6 Sandy Cr. US of PSF Whitetail (Site 37) 2001 5 23 2800 15
PSF 652/3.0/4.6 Sandy Cr. US of PSF Whitetail (Site 37) 2001 1 31 0.43 13
PSF 652/3.0/4.6 Sandy Cr. US of PSF Whitetail (Site 37) 2001 2 7 2.09 15
PSF 652/3.0/4.6 Sandy Cr. US of PSF Whitetail (Site 37) 2002 4 23 0.16 13 Cr. = creek cfs = cubic feet per second PSF = Premium Standard Farms µg/L = microgram per liter mg/L = milligram per liter TSS = total suspended solids MDNR = Missouri Department of Natural Resources

Sandy Creek TMDL 44
Appendix B
Development of TSS Targets Using Reference LDCs Overview
This procedure is used when a lotic13 system is placed on the 303(d) List for a pollutant
and the designated use being addressed is aquatic life. In cases where pollutant data for the impaired stream is not available a reference approach is used. For sediment, the target was derived by targeting the 25th percentile base load concentration of TSS measurements collected by the USGS in the EDU in which the water body is located.
If a flow record for the impaired stream is not available a synthetic flow record is needed.
To develop a synthetic flow record, calculate an average of the log discharge per square mile of USGS gaged rivers for which the drainage area is entirely contained within the EDU (Table B-1). Selection of these gages is based on location, land use/soil/topography similarities to the Sandy Creek watershed and the availability of flow data of sufficient age and duration. From this synthetic record develop flow duration from which to build a LDC for the pollutant within the EDU.
Methodology
The first step in this procedure is to locate available TSS data within the EDU of interest
(Appendix C). These data, along with the instantaneous flow measurement taken at the time of sample collection for the specific date, are recorded to create the population from which to develop the load duration curve. Both the date and TSS concentration are needed in order to match the measured data to the synthetic EDU flow record.
Secondly, collect average daily flow data for gages with a variety of drainage areas for a
period of time to cover the pollutant record. From these flow records normalize the flow to a per square mile basis. Average the daily discharge for each day in the period of record. For each gage record used to build this synthetic flow record calculate the Nash-Sutcliffe statistic to determine if the relationship is valid for each record. This relationship must be valid in order to use this methodology. This new synthetic record of flow per square mile is used to develop the load duration for the EDU. The flow record should be of sufficient length to be able to calculate percentiles of flow (typically 20 years or more). Figure B-1 shows the application of the approach in the Sandy Creek EDU (Grand River/Chariton EDU). Watershed-size normalized data for the individual gages in the EDU were calculated and compared to a pooled data set of all the gages (Figure B-1, Table B-1).
13 Lotic = pertaining to moving water

Sandy Creek TMDL 45
Figure B-1. Synthetic Flow Development in the Grand River/Chariton EDU
Table B-1. Stream Flow Stations Used to Estimate Flows in Sandy Creek
River/Station Name Data
SourceStation Number
Drainage Area (mi2)
Lognormal Nash-Sutcliffe
Medicine Creek near Laredo, MO USGS 06900050 355 79% East Fork Little Chariton River near Huntsville, MO
USGS 06906300 220 98%
East Fork Big Creek near Bethany, MO USGS 06897000 95 89%
Medicine Creek near Galt, MO USGS 06900000 225 99%
Mussel Fork near Musselfork, MO USGS 06906000 267 70%
South Fork Chariton River near Promise City, IA
USGS 06903700 168 25%
Chariton River near Chariton, IA USGS 06903400 182 38% mi2 = square miles
0.0001
0.001
0.01
0.1
1
10
100
1000
0 0.2 0.4 0.6 0.8 1Percentile flow
Are
a C
orre
cted
F
low
(cf
s)
EDU Flow DurationMedicine Creek near Laredo, MO (06900050) East Fork Little Chariton at Huntsville, MO (06906300) East Fork Big Creek near Bethany, MO (06897000)Medicine Creek near Galt, MO (06900000)Mussel Fork near Mussel Fork, MO (06906000)South Fork Chariton River near Promise City, IA (06903700)Chariton River near Chariton, IA (06903400)

Sandy Creek TMDL 46
Table B-1 demonstrates the pooled data set can confidently be used as a surrogate for the EDU analyses.
The next step was to collect previously measured water quality data from within the EDU.
Measured TSS concentrations are adjusted so that their median is equal to the 25th percentile base load concentration of total suspended solids measurements collected by the USGS in the EDU. This is accomplished by adjusting the measured data using the ratio between the 25th percentile target and the median from the measured data and results in the data retaining most of its variability while having a median that meets the 25th percentile target. Figure B-2 shows an example of this process where the solid line is the measured distribution of the natural log TSS concentration with the natural log flow and the dashed line represents a data distribution (the adjusted data) which would comply with the 25th percentile TSS target.
0.100
1.000
10.000
-10 -5 0 5 10 15
ln flow (cfs)
ln T
SS c
once
ntra
tion
(m
g/L
)
Ecoregion Data Adjusted Data
Linear (Adjusted Data) Linear (Ecoregion Data)
Figure B-2. Graphic Representation of Data Adjustment in the Grand River/Chariton EDU
The next step was to calculate the TSS-discharge relationship for the EDU using the adjusted data; this is natural log transformed data for the TSS yield (pound/day) and the instantaneous flow (cfs). Figure B-3 shows this relationship for this TMDL.

Sandy Creek TMDL 47
Figure B-3. Load / Flow Relationship Used to Set LDC TMDL
This relationship was used to develop a LDC for which the relationship between flow and TSS distribution is taken into account. In this LDC the targeted concentration is allowed to change at different percentiles of flow exceedance. However, meeting the LDC will result in a water body in which the median concentration is equal to the 25th percentile of data collected in the EDU.
To apply this process to a specific watershed entails using the individual watershed data
compared to the TMDL curve that has been multiplied by the watershed area (mi2). Data from the impaired segment is then plotted as a load (pounds/day) for the y-axis and as the percentile of flow for the EDU on the day the sample was taken for the x-axis. These data points do not have to be collected at the segment outlet. The spreadsheet applies an outlet flow (percentile exceedance) to the concentration based on the synthetic flow estimate for the specific date the sample was taken (Figure B-4).
y = 1.3523x + 3.1747
R2 = 0.8994 -10
-5 0 5
10152025
-10 -5 0 5 10 15
ln Flow (cfs)
ln TSS Load (lbs/day)

Sandy Creek TMDL 48
1
100
10,000
1,000,000
0% 20% 40% 60% 80% 100%Percentile Exceedance
TS
S (
lbs/
day
)
TMDL Sample Data
Figure B-4. Example of TMDL LDC Using This Method
The resulting LDC with plotted site specific measured data can now be used to target implementation by identifying flows in which TSS concentrations are higher than would be expected in a stream meeting the 25th percentile target value. For more information contact: United States Environmental Protection Agency, Region 7 Water, Wetlands and Pesticides Division Total Maximum Daily Load Program 901 North 5th Street Kansas City, Kansas 66101 Website: http://www.epa.gov/region07/water/tmdl.htm

Sandy Creek TMDL 49
Appendix C
Stream Flow and Water Quality Stations Used to Develop TMDLs in Sandy Creek
Table C-1. Stream Flow Stations Used to Estimate Flows in Sandy Creek
River/Station Name Data
Source Station Number
Drainage Area (mi2)
Medicine Creek near Laredo, MO USGS 06900050 355 East Fork Little Chariton River near Huntsville, MO USGS 06906300 220 East Fork Big Creek near Bethany, MO USGS 06897000 95 Medicine Creek near Galt, MO USGS 06900000 225 Mussel Fork near Musselfork, MO USGS 06906000 267 South Fork Chariton River near Promise City, IA USGS 06903700 168 Chariton River near Chariton, IA USGS 06903400 182
mi2 = square miles
Table C-2. Stations Used to Develop Water Quality Data Targets in Sandy Creek USGS Gage
Number Station Name
Drainage Area (mi2)
06898100 Thompson River at Mount Moriah, MO 891 06898800 Weldon River near Princeton, MO 452 06899580 No Creek near Dunlap, MO 34 06899585 No Creek at Farmersville, MO 67.4 06899950 Medicine Creek near Harris, MO 192 06900100 Little Medicine Creek near Harris, MO 66.5 06901500 Locust Creek near Linneus, MO 550 06902000 Grand River near Sumner, MO 6880 06905725 Mussel Fork near Mystic, MO 24 06898000 Thompson River at Davis City, IA 701 06896187 Middle Fork Grand River near Grant City, MO 82.4 06900900 Locust Creek near Unionville, MO 77.5
640/IOWAa Chariton River at Centerville, IA 7081 06904000 Chariton River near Centerville, IA 708 06906300 East Fork Little Chariton River at Huntsville, MO 220
1 Specific drainage area was unavailable, value estimated using drainage area of nearby USGS Gage (06904000). mi2 = square miles

Sandy Creek TMDL 50
Table C-3. Water Quality Data Used in TMDL Development
USGS Gage Number Sample Date Flow (cfs)
Total Suspended Solids (mg/L)1
06898100 - Thompson River at Mount Moriah, MO
06898100 11/9/1999 22 527
06898100 1/13/2000 8.6
06898100 3/23/2000 33
06898100 5/18/2000 19 27
06898100 7/13/2000 49
06898100 9/6/2000 10
06898100 11/28/2000 15 < 10
06898100 1/3/2001 7.5
06898100 3/15/2001 4860
06898100 5/2/2001 276 156
06898100 7/13/2001 126
06898100 9/20/2001 53
06898100 11/8/2001 41 14
06898100 1/17/2002 14 < 10
06898100 3/14/2002 91 43
06898100 5/9/2002 223 347
06898100 8/1/2002 26 30
06898100 9/3/2002 17 176
06898100 11/7/2002 18 < 10
06898100 1/15/2003 15 < 10
06898100 3/28/2003 50 11
06898100 5/22/2003 196 107
06898100 7/15/2003 76 66
06898100 8/29/2003 6.1 < 10
06898100 9/4/2003 10 146
06898100 11/4/2003 325 644
06898100 1/23/2004 23 < 10
06898100 3/25/2004 268 186
06898100 5/20/2004 E 837 593
06898100 7/9/2004 118 17
06898100 9/10/2004 259 82
06898100 11/8/2004 70 132
06898100 1/21/2005 31 < 10
06898100 3/3/2005 144 42

Sandy Creek TMDL 51
USGS Gage Number Sample Date Flow (cfs)
Total Suspended Solids (mg/L)1
06898100 5/25/2005 342 292
06898100 7/8/2005 96 67
06898100 9/16/2005 23 < 10
06898100 11/10/2005 12 < 10
06898100 1/20/2006 23 < 10
06898100 3/31/2006 23 < 10
06898100 5/25/2006 81 100
06898100 7/27/2006 15 23
06898100 9/8/2006 44 28
06898100 11/9/2006 23 < 10
06898100 1/4/2007 381 333
06898100 2/14/2007 24 < 10
06898100 3/21/2007 291 218
06898100 4/6/2007 394 192
06898100 5/23/2007 298 63
06898100 6/20/2007 133 82
06898100 7/25/2007 54 17
06898100 9/19/2007 132 26
06898100 11/16/2007 137 48
06898100 1/24/2008 200 20
06898100 3/12/2008 682 328
06898100 5/29/2008 481 196
06898100 7/10/2008 1280 1440
06898100 9/17/2008 569 300
06898100 10/22/2008 1380 2930
06898100 1/14/2009 235 74
06898100 3/5/2009 264 254
06898100 5/7/2009 614 336
06898100 7/16/2009 1220 718
06898100 9/3/2009 288 109
06898800 - Weldon River near Princeton, MO
06898800 11/9/1999 5.3
06898800 1/11/2000 10
06898800 3/21/2000 13
06898800 5/16/2000 2.4 < 10
06898800 7/11/2000 9.4
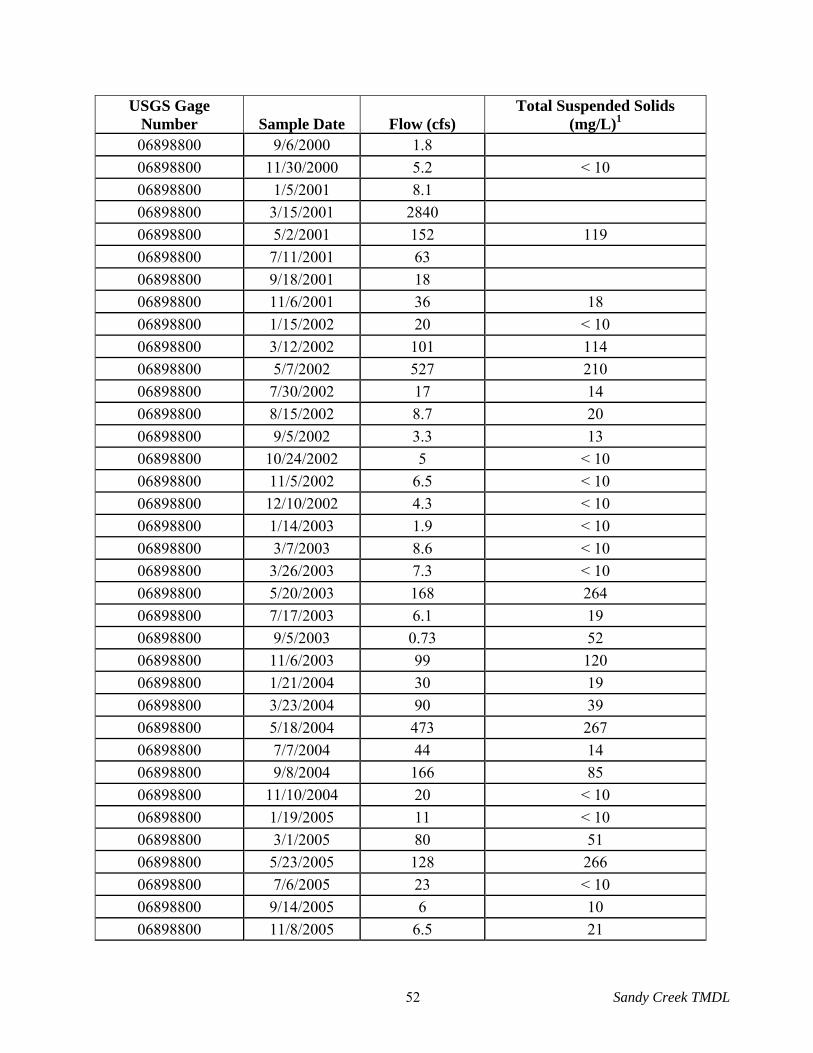
Sandy Creek TMDL 52
USGS Gage Number Sample Date Flow (cfs)
Total Suspended Solids (mg/L)1
06898800 9/6/2000 1.8
06898800 11/30/2000 5.2 < 10
06898800 1/5/2001 8.1
06898800 3/15/2001 2840
06898800 5/2/2001 152 119
06898800 7/11/2001 63
06898800 9/18/2001 18
06898800 11/6/2001 36 18
06898800 1/15/2002 20 < 10
06898800 3/12/2002 101 114
06898800 5/7/2002 527 210
06898800 7/30/2002 17 14
06898800 8/15/2002 8.7 20
06898800 9/5/2002 3.3 13
06898800 10/24/2002 5 < 10
06898800 11/5/2002 6.5 < 10
06898800 12/10/2002 4.3 < 10
06898800 1/14/2003 1.9 < 10
06898800 3/7/2003 8.6 < 10
06898800 3/26/2003 7.3 < 10
06898800 5/20/2003 168 264
06898800 7/17/2003 6.1 19
06898800 9/5/2003 0.73 52
06898800 11/6/2003 99 120
06898800 1/21/2004 30 19
06898800 3/23/2004 90 39
06898800 5/18/2004 473 267
06898800 7/7/2004 44 14
06898800 9/8/2004 166 85
06898800 11/10/2004 20 < 10
06898800 1/19/2005 11 < 10
06898800 3/1/2005 80 51
06898800 5/23/2005 128 266
06898800 7/6/2005 23 < 10
06898800 9/14/2005 6 10
06898800 11/8/2005 6.5 21

Sandy Creek TMDL 53
USGS Gage Number Sample Date Flow (cfs)
Total Suspended Solids (mg/L)1
06898800 1/18/2006 9.4 < 10
06898800 3/31/2006 117 750
06898800 5/23/2006 6.1 12
06898800 7/25/2006 1.5 60
06898800 9/6/2006 9.2 42
06898800 11/7/2006 5.5 < 10
06898800 1/4/2007 82 44
06898800 2/16/2007 7.2 < 10
06898800 3/23/2007 625 1250
06898800 4/6/2007 174 86
06898800 5/23/2007 97 28
06898800 6/20/2007 35 31
06898800 7/25/2007 19 15
06898800 9/19/2007 42 24
06898800 11/14/2007 24 13
06898800 1/24/2008 60 140
06898800 3/12/2008 615 472
06898800 5/29/2008 166 79
06898800 7/10/2008 307 426
06898800 9/17/2008 325 364
06898800 10/22/2008 6480 1850
06898800 1/14/2009 78 < 15
06898800 3/6/2009 121 112
06898800 5/7/2009 260 126
06898800 7/16/2009 98 54
06898800 9/3/2009 274 145
06899580 - No Creek near Dunlap, MO
06899580 1/22/1998 3.7 1
06899580 6/2/1998 3.2 51
06899580 3/30/1999 4.4
06899580 4/22/1999 14
06899580 6/21/1999 0.25 70
06899580 10/25/1999 0.01
06899580 11/29/1999 0.01 73
06899580 12/20/1999 0.1
06899580 1/24/2000 0.1 28

Sandy Creek TMDL 54
USGS Gage Number Sample Date Flow (cfs)
Total Suspended Solids (mg/L)1
06899580 2/23/2000 0.06
06899580 4/20/2000 0.81
06899580 5/9/2000 0.17 54
06899580 6/14/2000 6.4
06899580 6/22/2000 0.4
06899580 7/25/2000 0.11 45
06899580 10/24/2000 0.37
06899580 11/15/2000 0.68 21
06899580 12/19/2000 0.08
06899580 1/24/2001 1.6 18
06899580 2/15/2001 40
06899580 3/27/2001 10
06899580 4/24/2001 19
06899580 5/22/2001 9.9 41
06899580 6/19/2001 2.7
06899580 6/25/2001 5.2
06899580 7/26/2001 59 290
06899580 8/9/2001 0.47
06899580 9/13/2001 0.1
06899580 10/23/2001 38 386
06899580 11/29/2001 0.28 78
06899580 12/13/2001 1 20
06899580 2/28/2002 1.7 22
06899580 3/21/2002 2.1 < 10
06899580 4/18/2002 4.3 36
06899580 5/23/2002 2.4 < 10
06899580 6/13/2002 0.53 20
06899580 6/28/2002 0.07 40
06899580 7/23/2002 0.01 < 10
06899580 8/22/2002 1 44
06899580 12/19/2002 0.01 37
06899580 3/13/2003 0.41 < 10
06899580 3/20/2003 0.34 12
06899580 4/25/2003 2.1 82
06899580 4/30/2003 0.62 12
06899580 5/6/2003 6.4 164

Sandy Creek TMDL 55
USGS Gage Number Sample Date Flow (cfs)
Total Suspended Solids (mg/L)1
06899580 6/12/2003 3 68
06899580 7/9/2003 0.01 43
06899580 9/19/2003 0.26 144
06899580 10/23/2003 0.03 70
06899580 11/18/2003 0.1 23
06899580 12/11/2003 22 120
06899580 1/8/2004 1 17
06899580 2/27/2004 5.8 14
06899580 3/18/2004 52 117
06899580 4/20/2004 2.7 33
06899580 5/11/2004 1.3 < 10
06899580 6/22/2004 9.1 49
06899580 7/16/2004 0.41 23
06899580 8/23/2004 0.72 67
06899580 9/14/2004 0.76 520
06899580 10/26/2004 1 < 10
06899580 11/16/2004 3.7 < 10
06899580 12/14/2004 6.2 18
06899580 1/25/2005 0.08 18
06899580 2/10/2005 21 138
06899580 3/17/2005 2.9 < 10
06899580 4/5/2005 3.6 < 10
06899580 5/12/2005 2 52
06899580 6/30/2005 0.86 24
06899580 7/13/2005 0.03 < 10
06899580 8/19/2005 0.02 33
06899580 9/21/2005 0.05 53
06899580 10/5/2005 0.08 380
06899580 11/3/2005 0.01 1510
06899580 12/14/2005 0.1 44
06899580 1/25/2006 0.03 43
06899580 2/14/2006 0.01 22
06899580 3/9/2006 0.2 < 10
06899580 4/12/2006 2.1 72
06899580 5/9/2006 2.8 44
06899580 6/15/2006 0.23 24
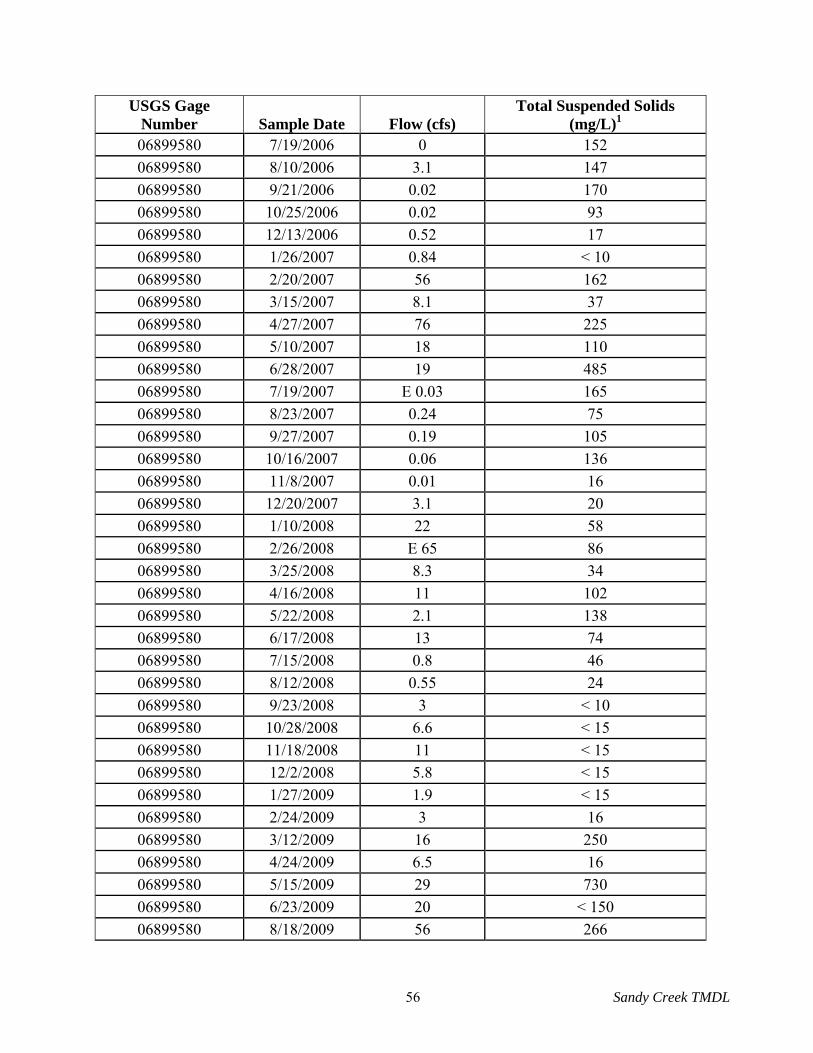
Sandy Creek TMDL 56
USGS Gage Number Sample Date Flow (cfs)
Total Suspended Solids (mg/L)1
06899580 7/19/2006 0 152
06899580 8/10/2006 3.1 147
06899580 9/21/2006 0.02 170
06899580 10/25/2006 0.02 93
06899580 12/13/2006 0.52 17
06899580 1/26/2007 0.84 < 10
06899580 2/20/2007 56 162
06899580 3/15/2007 8.1 37
06899580 4/27/2007 76 225
06899580 5/10/2007 18 110
06899580 6/28/2007 19 485
06899580 7/19/2007 E 0.03 165
06899580 8/23/2007 0.24 75
06899580 9/27/2007 0.19 105
06899580 10/16/2007 0.06 136
06899580 11/8/2007 0.01 16
06899580 12/20/2007 3.1 20
06899580 1/10/2008 22 58
06899580 2/26/2008 E 65 86
06899580 3/25/2008 8.3 34
06899580 4/16/2008 11 102
06899580 5/22/2008 2.1 138
06899580 6/17/2008 13 74
06899580 7/15/2008 0.8 46
06899580 8/12/2008 0.55 24
06899580 9/23/2008 3 < 10
06899580 10/28/2008 6.6 < 15
06899580 11/18/2008 11 < 15
06899580 12/2/2008 5.8 < 15
06899580 1/27/2009 1.9 < 15
06899580 2/24/2009 3 16
06899580 3/12/2009 16 250
06899580 4/24/2009 6.5 16
06899580 5/15/2009 29 730
06899580 6/23/2009 20 < 150
06899580 8/18/2009 56 266

Sandy Creek TMDL 57
USGS Gage Number Sample Date Flow (cfs)
Total Suspended Solids (mg/L)1
06899585 - No Creek at Farmersville, MO
06899585 11/16/2006 0.13 < 10
06899950 - Medicine Creek near Harris, MO
06899950 10/26/1999 2.3
06899950 11/30/1999 3 6
06899950 12/21/1999 0.1
06899950 1/25/2000 0.5 3
06899950 2/22/2000 15
06899950 3/27/2000 8.7
06899950 4/18/2000 4
06899950 5/10/2000 10 < 10
06899950 6/21/2000 6
06899950 7/26/2000 6.6 37
06899950 9/20/2000 3.4
06899950 10/26/2000 6.1
06899950 11/14/2000 5.8 < 10
06899950 12/18/2000 3.1
06899950 1/25/2001 12 < 10
06899950 2/13/2001 131
06899950 3/29/2001 100
06899950 4/26/2001 76
06899950 5/24/2001 52 68
06899950 6/19/2001 79
06899950 6/26/2001 60
06899950 7/25/2001 353 1610
06899950 8/8/2001 13
06899950 9/12/2001 7.4
06899950 10/25/2001 33 118
06899950 11/28/2001 3.4 12
06899950 12/12/2001 6.2
06899950 1/3/2002 4.6 < 10
06899950 1/8/2002 5 < 10
06899950 2/27/2002 9.9 12
06899950 3/19/2002 18 < 10
06899950 4/17/2002 68 130
06899950 5/21/2002 38 38

Sandy Creek TMDL 58
USGS Gage Number Sample Date Flow (cfs)
Total Suspended Solids (mg/L)1
06899950 6/28/2002 5.6 13
06899950 7/24/2002 3.6 < 10
06899950 8/21/2002 17 41
06899950 9/10/2002 1.4 < 10
06899950 10/17/2002 1.4 < 10
06899950 11/19/2002 2 < 10
06899950 12/18/2002 2.8 < 10
06899950 1/30/2003 0.9 < 10
06899950 2/20/2003 3.4 < 10
06899950 3/12/2003 3.9 < 10
06899950 4/23/2003 14 12
06899950 5/8/2003 27 104
06899950 6/11/2003 51 282
06899950 7/10/2003 65 161
06899950 8/25/2003 0.61 < 10
06899950 9/17/2003 4.5 49
06899950 10/22/2003 1.3 < 10
06899950 11/20/2003 3 < 10
06899950 12/10/2003 368 E 692
06899950 1/7/2004 6.2 < 10
06899950 2/26/2004 55 66
06899950 3/16/2004 71 53
06899950 4/22/2004 21 12
06899950 5/13/2004 11 < 10
06899950 6/23/2004 42 49
06899950 7/14/2004 32 76
06899950 8/25/2004 378 1700
06899950 9/16/2004 25 15
06899950 10/27/2004 50 131
06899950 11/18/2004 16 < 10
06899950 12/16/2004 26 < 10
06899950 1/27/2005 169 280
06899950 2/9/2005 105 165
06899950 3/16/2005 28 < 10
06899950 4/8/2005 77 79
06899950 5/11/2005 24 15
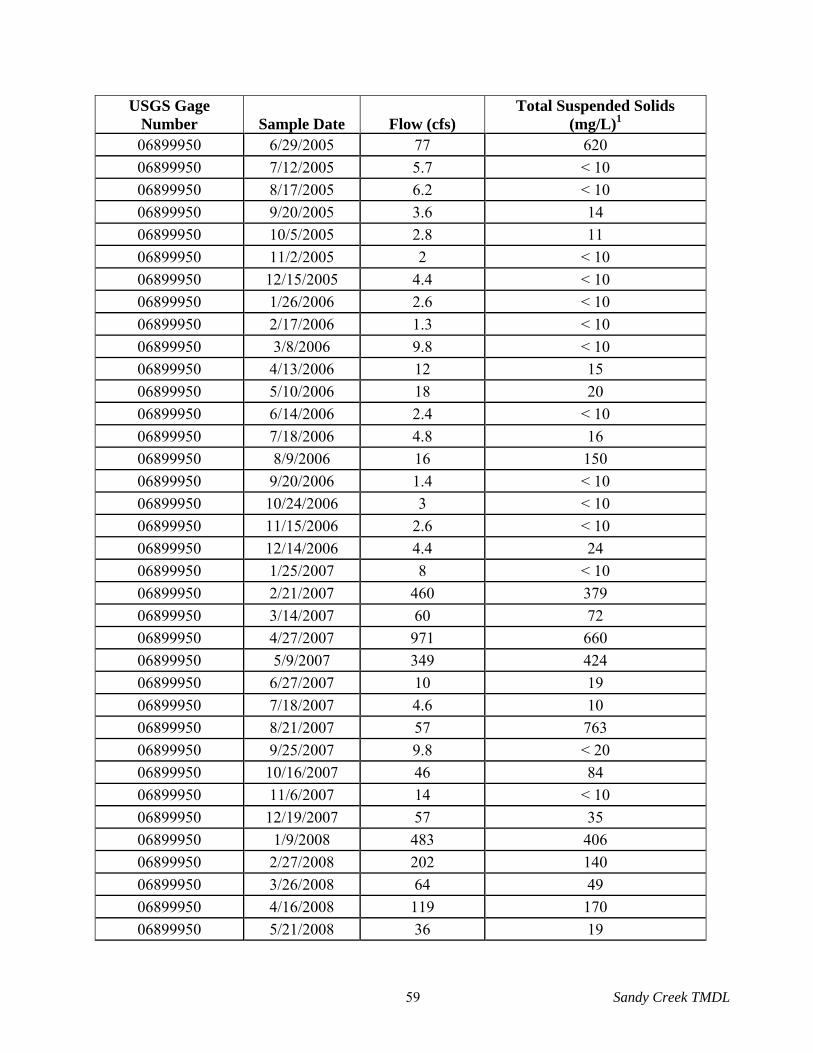
Sandy Creek TMDL 59
USGS Gage Number Sample Date Flow (cfs)
Total Suspended Solids (mg/L)1
06899950 6/29/2005 77 620
06899950 7/12/2005 5.7 < 10
06899950 8/17/2005 6.2 < 10
06899950 9/20/2005 3.6 14
06899950 10/5/2005 2.8 11
06899950 11/2/2005 2 < 10
06899950 12/15/2005 4.4 < 10
06899950 1/26/2006 2.6 < 10
06899950 2/17/2006 1.3 < 10
06899950 3/8/2006 9.8 < 10
06899950 4/13/2006 12 15
06899950 5/10/2006 18 20
06899950 6/14/2006 2.4 < 10
06899950 7/18/2006 4.8 16
06899950 8/9/2006 16 150
06899950 9/20/2006 1.4 < 10
06899950 10/24/2006 3 < 10
06899950 11/15/2006 2.6 < 10
06899950 12/14/2006 4.4 24
06899950 1/25/2007 8 < 10
06899950 2/21/2007 460 379
06899950 3/14/2007 60 72
06899950 4/27/2007 971 660
06899950 5/9/2007 349 424
06899950 6/27/2007 10 19
06899950 7/18/2007 4.6 10
06899950 8/21/2007 57 763
06899950 9/25/2007 9.8 < 20
06899950 10/16/2007 46 84
06899950 11/6/2007 14 < 10
06899950 12/19/2007 57 35
06899950 1/9/2008 483 406
06899950 2/27/2008 202 140
06899950 3/26/2008 64 49
06899950 4/16/2008 119 170
06899950 5/21/2008 36 19
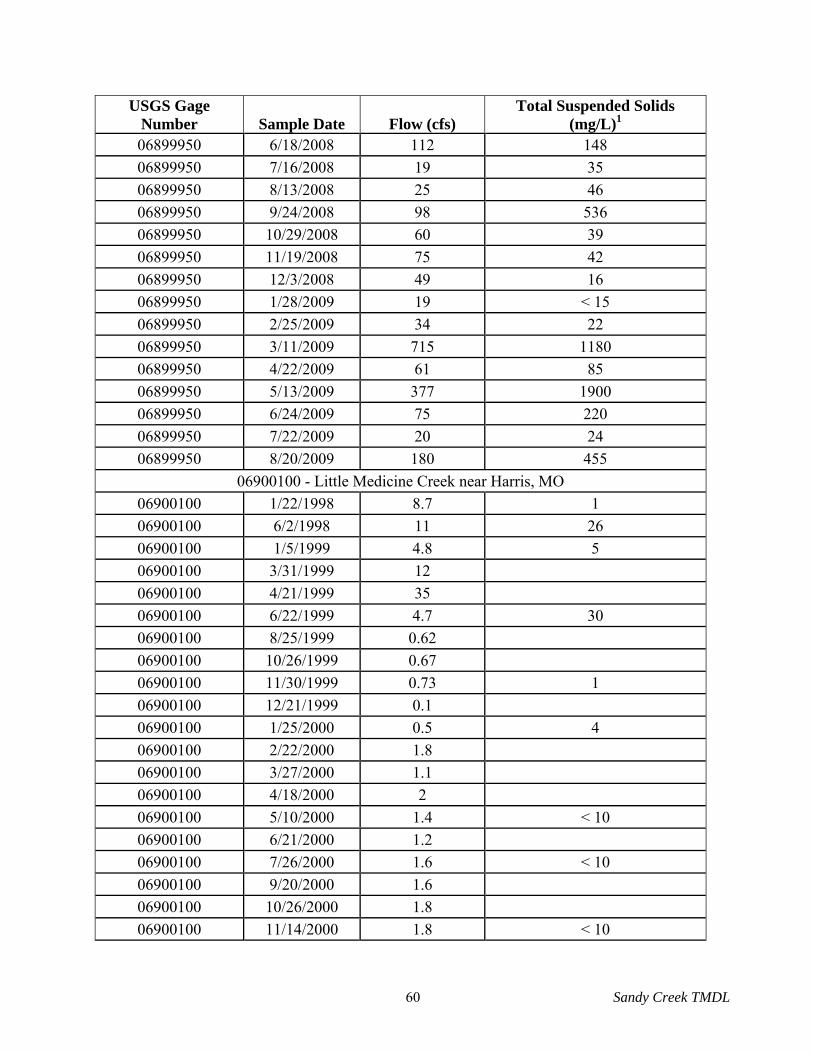
Sandy Creek TMDL 60
USGS Gage Number Sample Date Flow (cfs)
Total Suspended Solids (mg/L)1
06899950 6/18/2008 112 148
06899950 7/16/2008 19 35
06899950 8/13/2008 25 46
06899950 9/24/2008 98 536
06899950 10/29/2008 60 39
06899950 11/19/2008 75 42
06899950 12/3/2008 49 16
06899950 1/28/2009 19 < 15
06899950 2/25/2009 34 22
06899950 3/11/2009 715 1180
06899950 4/22/2009 61 85
06899950 5/13/2009 377 1900
06899950 6/24/2009 75 220
06899950 7/22/2009 20 24
06899950 8/20/2009 180 455
06900100 - Little Medicine Creek near Harris, MO
06900100 1/22/1998 8.7 1
06900100 6/2/1998 11 26
06900100 1/5/1999 4.8 5
06900100 3/31/1999 12
06900100 4/21/1999 35
06900100 6/22/1999 4.7 30
06900100 8/25/1999 0.62
06900100 10/26/1999 0.67
06900100 11/30/1999 0.73 1
06900100 12/21/1999 0.1
06900100 1/25/2000 0.5 4
06900100 2/22/2000 1.8
06900100 3/27/2000 1.1
06900100 4/18/2000 2
06900100 5/10/2000 1.4 < 10
06900100 6/21/2000 1.2
06900100 7/26/2000 1.6 < 10
06900100 9/20/2000 1.6
06900100 10/26/2000 1.8
06900100 11/14/2000 1.8 < 10

Sandy Creek TMDL 61
USGS Gage Number Sample Date Flow (cfs)
Total Suspended Solids (mg/L)1
06900100 12/19/2000 0.91
06900100 1/25/2001 3.2 < 10
06900100 2/13/2001 46
06900100 3/29/2001 35
06900100 4/26/2001 18
06900100 5/24/2001 16 31
06900100 6/19/2001 17
06900100 6/26/2001 13
06900100 7/25/2001 11 444
06900100 8/8/2001 1.4
06900100 9/12/2001 1.2
06900100 10/25/2001 7.5 54
06900100 11/28/2001 1.5 < 10
06900100 12/12/2001 1.7 < 10
06900100 1/8/2002 0.38 < 10
06900100 2/27/2002 1.8 < 10
06900100 3/19/2002 2 < 10
06900100 4/17/2002 13 66
06900100 5/21/2002 9.1 14
06900100 6/28/2002 2 < 10
06900100 7/24/2002 0.59 < 10
06900100 8/21/2002 3.1 < 10
06900100 9/10/2002 0.15 < 10
06900100 10/17/2002 0.31 < 10
06900100 11/19/2002 0.41 < 10
06900100 12/18/2002 0.64 < 10
06900100 1/29/2003 0.11 < 10
06900100 2/20/2003 0.64 < 10
06900100 3/12/2003 1.4 < 10
06900100 4/23/2003 0.47 < 10
06900100 5/8/2003 3.5 127
06900100 6/11/2003 30 344
06900100 7/10/2003 138 E 2060
06900100 8/25/2003 0.08 13
06900100 9/18/2003 0.48 20
06900100 10/22/2003 0.3 < 10

Sandy Creek TMDL 62
USGS Gage Number Sample Date Flow (cfs)
Total Suspended Solids (mg/L)1
06900100 11/20/2003 0.52 < 10
06900100 12/10/2003 98 470
06900100 1/7/2004 0.73 16
06900100 2/26/2004 10 36
06900100 3/16/2004 25 56
06900100 4/22/2004 4.6 < 10
06900100 5/13/2004 8.9 102
06900100 6/23/2004 12 33
06900100 7/14/2004 6 37
06900100 8/25/2004 2150 1400
06900100 9/16/2004 5.8 64
06900100 10/27/2004 16 146
06900100 11/18/2004 5.2 < 10
06900100 12/17/2004 4.6 < 10
06900100 1/27/2005 24 51
06900100 2/10/2005 7 48
06900100 3/16/2005 7.6 < 10
06900100 4/8/2005 15 18
06900100 5/12/2005 8.6 38
06900100 6/30/2005 6 20
06900100 7/12/2005 1.4 < 10
06900100 8/17/2005 0.42 < 10
06900100 9/20/2005 0.64 < 10
06900100 10/5/2005 0.22 < 10
06900100 11/2/2005 0.15 < 10
06900100 12/15/2005 1.6 < 10
06900100 1/26/2006 0.73 < 10
06900100 2/17/2006 0.37 < 10
06900100 3/8/2006 2.2 < 10
06900100 4/13/2006 1.5 15
06900100 5/10/2006 2.3 19
06900100 6/14/2006 0.43 < 10
06900100 7/19/2006 0.22 < 10
06900100 8/9/2006 3 122
06900100 9/20/2006 0.16 < 10
06900100 10/24/2006 0.35 < 10

Sandy Creek TMDL 63
USGS Gage Number Sample Date Flow (cfs)
Total Suspended Solids (mg/L)1
06900100 11/16/2006 0.45 < 10
06900100 12/14/2006 1.1 13
06900100 1/25/2007 2.2 < 10
06900100 2/21/2007 E 130 59
06900100 3/15/2007 14 64
06900100 4/25/2007 1830 1070
06900100 5/10/2007 52 184
06900100 6/27/2007 1.4 10
06900100 7/18/2007 0.53 13
06900100 8/21/2007 14 663
06900100 9/25/2007 1.5 < 20
06900100 10/17/2007 13 424
06900100 11/8/2007 1 < 10
06900100 12/19/2007 13 31
06900100 1/10/2008 68 88
06900100 2/27/2008 58 82
06900100 3/26/2008 21 43
06900100 4/16/2008 33 88
06900100 5/21/2008 7.3 < 10
06900100 6/18/2008 20 74
06900100 7/16/2008 3 10
06900100 8/13/2008 3.3 13
06900100 9/24/2008 300 2200
06900100 10/29/2008 18 23
06900100 11/19/2008 30 33
06900100 12/3/2008 17 < 15
06900100 1/28/2009 4.5 < 15
06900100 2/25/2009 12 18
06900100 3/11/2009 118 490
06900100 4/22/2009 15 15
06900100 5/13/2009 352 1760
06900100 6/24/2009 26 160
06900100 7/22/2009 2.5 < 15
06900100 8/20/2009 176 1290
06901500 - Locust Creek near Linneus, MO
06901500 8/26/2003 0.8 <10

Sandy Creek TMDL 64
USGS Gage Number Sample Date Flow (cfs)
Total Suspended Solids (mg/L)1
06902000 - Grand River near Sumner, MO
06902000 11/8/1989 373
06902000 1/18/1990 851
06902000 5/9/1990 5480
06902000 7/11/1990 1430
06902000 11/7/1990 1310
06902000 1/9/1991 452
06902000 5/17/1991 14200
06902000 7/16/1991 2510
06902000 11/6/1991 470
06902000 1/15/1992 2720
06902000 7/8/1992 340
06902000 11/12/1992 7780
06902000 12/2/1992 4980
06902000 1/6/1993 8980
06902000 2/17/1993 2510
06902000 3/17/1993 3220
06902000 4/8/1993 29800
06902000 5/12/1993 33700
06902000 6/16/1993 18400
06902000 7/27/1993 128000
06902000 8/25/1993 2820
06902000 9/16/1993 23600
06902000 10/27/1993 1700
06902000 11/16/1993 3300
06902000 12/8/1993 1140
06902000 1/5/1994 755
06902000 2/3/1994 1200
06902000 3/16/1994 1750
06902000 3/30/1994 750
06902000 4/27/1994 900
06902000 5/10/1994 3700
06902000 6/14/1994 4500
06902000 8/23/1994 250
06902000 9/14/1994 270
06902000 10/26/1994 136

Sandy Creek TMDL 65
USGS Gage Number Sample Date Flow (cfs)
Total Suspended Solids (mg/L)1
06902000 11/30/1994 1200
06902000 12/14/1994 1140
06902000 1/5/1995 350
06902000 2/8/1995 2060
06902000 3/30/1995 2720
06902000 4/18/1995 5660
06902000 5/24/1995 51600
06902000 6/14/1995 4450
06902000 7/12/1995 6100
06902000 8/2/1995 2030
06902000 9/5/1995 496
06902000 10/24/1995 235
06902000 11/6/1995 595
06902000 12/13/1995 216
06902000 1/22/1996 430
06902000 2/14/1996 3050
06902000 3/26/1996 1480
06902000 4/16/1996 520
06902000 5/20/1996 4660
06902000 6/19/1996 14500
06902000 7/17/1996 1050
06902000 8/14/1996 906
06902000 9/11/1996 1170
06902000 10/9/1996 527
06902000 11/20/1996 4930
06902000 1/22/1997 466
06902000 2/12/1997 1620
06902000 3/17/1997 2510
06902000 4/23/1997 29800
06902000 5/27/1997 2130
06902000 6/17/1997 15100
06902000 7/29/1997 395
06902000 8/19/1997 511
06902000 9/9/1997 286
06902000 11/17/1997 415 6
06902000 1/15/1998 1590 16

Sandy Creek TMDL 66
USGS Gage Number Sample Date Flow (cfs)
Total Suspended Solids (mg/L)1
06902000 6/9/1998 4290 452
06902000 8/18/1998 587 60
06902000 11/16/1998 4640 264
06902000 12/1/1998 6620
06902000 1/25/1999 4150 231
06902000 2/23/1999 3040
06902000 3/23/1999 2740
06902000 4/13/1999 3460
06902000 5/19/1999 31900
06902000 6/15/1999 6840 1800
06902000 7/27/1999 429
06902000 8/10/1999 639 80
06902000 9/13/1999 365
06902000 10/26/1999 130
06902000 11/30/1999 240 10
06902000 12/21/1999 157
06902000 1/4/2000 198 16
06902000 2/1/2000 123
06902000 3/7/2000 565
06902000 4/3/2000 301
06902000 5/2/2000 308 95
06902000 6/12/2000 217
06902000 7/11/2000 924 180
06902000 8/2/2000 465
06902000 9/12/2000 129
06902000 10/2/2000 341
06902000 11/21/2000 220 12
06902000 12/5/2000 207
06902000 1/3/2001 E 203 < 10
06902000 2/14/2001 5880
06902000 3/6/2001 8040
06902000 4/17/2001 7800
06902000 5/1/2001 1740 90
06902000 6/19/2001 6690
06902000 7/10/2001 1830 174
06902000 8/13/2001 572

Sandy Creek TMDL 67
USGS Gage Number Sample Date Flow (cfs)
Total Suspended Solids (mg/L)1
06902000 9/5/2001 404
06902000 10/17/2001 3210 555
06902000 11/6/2001 416 18
06902000 12/4/2001 323 16
06902000 1/8/2002 179 < 10
06902000 2/5/2002 347 12
06902000 3/6/2002 573 12
06902000 4/10/2002 4220 1440
06902000 5/7/2002 43700 2420
06902000 6/10/2002 841
06902000 7/16/2002 393 145
06902000 8/13/2002 175 < 10
06902000 9/4/2002 145 65
06902000 10/22/2002 97 39
06902000 11/27/2002 115 10
06902000 12/12/2002 102 < 10
06902000 2/12/2003 121 < 10
06902000 2/25/2003 E 130 < 10
06902000 3/21/2003 354 29
06902000 4/11/2003 163 46
06902000 5/2/2003 1940 524
06902000 6/20/2003 516 114
06902000 7/29/2003 130 19
06902000 8/21/2003 66 81
06902000 9/9/2003 85 58
06902000 10/21/2003 96 44
06902000 11/5/2003 75 26
06902000 12/15/2003 888 89
06902000 1/7/2004 E 275 < 10
06902000 2/3/2004 E 165 < 10
06902000 3/2/2004 997 112
06902000 4/6/2004 2040 136
06902000 5/19/2004 21000 1070
06902000 6/28/2004 1910 158
06902000 7/15/2004 7510 475
06902000 8/16/2004 715 49

Sandy Creek TMDL 68
USGS Gage Number Sample Date Flow (cfs)
Total Suspended Solids (mg/L)1
06902000 9/2/2004 E 125000 543
06902000 10/12/2004 900 132
06902000 11/9/2004 1410 56
06902000 12/1/2004 813 22
06902000 1/24/2005 1530 90
06902000 2/14/2005 55000 2160
06902000 3/8/2005 1460 43
06902000 4/4/2005 992 55
06902000 5/3/2005 1530 117
06902000 6/22/2005 1600 203
06902000 7/12/2005 513 135
06902000 8/22/2005 909 252
06902000 9/7/2005 301 55
06902000 10/12/2005 315 34
06902000 11/2/2005 220 < 10
06902000 12/19/2005 272 < 10
06902000 1/4/2006 459 14
06902000 2/7/2006 357 < 10
06902000 3/7/2006 267 12
06902000 4/10/2006 1010 415
06902000 5/3/2006 12500 1180
06902000 6/21/2006 386 154
06902000 7/6/2006 259 41
06902000 8/2/2006 131 138
06902000 9/6/2006 432 170
06902000 10/10/2006 121 51
06902000 11/6/2006 289 43
06902000 12/5/2006 546 76
06902000 1/4/2007 3400 767
06902000 2/14/2007 272 < 10
06902000 3/7/2007 3450 258
06902000 4/3/2007 7510 1120
06902000 5/2/2007 4620 360
06902000 6/6/2007 4600 200
06902000 7/10/2007 447 104
06902000 8/14/2007 1230 242

Sandy Creek TMDL 69
USGS Gage Number Sample Date Flow (cfs)
Total Suspended Solids (mg/L)1
06902000 9/11/2007 736 52
06902000 10/23/2007 3100 340
06902000 11/6/2007 569 27
06902000 12/4/2007 702 45
06902000 1/9/2008 16000 850
06902000 2/14/2008 1900 100
06902000 3/5/2008 50600 1180
06902000 4/16/2008 7050 144
06902000 6/2/2008 10700 1120
06902000 7/9/2008 4230 384
06902000 8/4/2008 8200 452
06902000 9/2/2008 803 80
06902000 10/21/2008 1940 106
06902000 11/24/2008 2600 75
06902000 12/9/2008 1500 48
06902000 2/2/2009 1080 < 15
06902000 3/10/2009 57300 1300
06902000 4/1/2009 10900 418
06902000 5/5/2009 8690 780
06902000 6/2/2009 3960 312
06902000 7/28/2009 986 62
06902000 8/17/2009 46900 1790
06902000 9/1/2009 6300 454
06905725 - Mussel Fork near Mystic, MO
06905725 1/23/1998 1.6 12
06905725 6/3/1998 1.2 22
06905725 1/6/1999 1.9 4
06905725 3/31/1999 2.4
06905725 4/21/1999 8.4
06905725 6/23/1999 0.54 47
06905725 10/25/1999 0.01
06905725 11/30/1999 0.01 11
06905725 12/20/1999 0.1
06905725 1/24/2000 0.1 24
06905725 4/20/2000 0.16
06905725 5/11/2000 0.07 < 10

Sandy Creek TMDL 70
USGS Gage Number Sample Date Flow (cfs)
Total Suspended Solids (mg/L)1
06905725 6/14/2000 8.3
06905725 6/15/2000 7.3
06905725 6/20/2000 0.22
06905725 7/27/2000 0 10
06905725 10/25/2000 0.03
06905725 11/15/2000 0.1 < 10
06905725 12/20/2000 0.02
06905725 1/24/2001 0.24 10
06905725 2/14/2001 59
06905725 3/28/2001 4.3
06905725 4/25/2001 4.1
06905725 5/22/2001 1.1
06905725 5/23/2001 0.82 11
06905725 6/18/2001 7.6
06905725 6/28/2001 2.5
06905725 7/26/2001 4.8 228
06905725 8/9/2001 0.13
06905725 9/11/2001 0.03
06905725 10/24/2001 3.5 50
06905725 11/29/2001 0.17 < 10
06905725 12/13/2001 0.83 20
06905725 1/9/2002 0.2 10
06905725 2/28/2002 1.4 18
06905725 3/20/2002 0.97 < 10
06905725 4/18/2002 1.6 17
06905725 5/22/2002 2.2 20
06905725 6/27/2002 0.06 10
06905725 8/22/2002 0.17 22
06905725 2/21/2003 0.05 < 10
06905725 3/13/2003 2.5 37
06905725 3/19/2003 0.3 14
06905725 4/24/2003 0.19 26
06905725 4/30/2003 1.9 32
06905725 5/7/2003 2.5 44
06905725 6/12/2003 0.72 16
06905725 7/9/2003 E 0.00 11

Sandy Creek TMDL 71
USGS Gage Number Sample Date Flow (cfs)
Total Suspended Solids (mg/L)1
06905725 9/17/2003 0.33 15
06905725 11/19/2003 E 0.01 38
06905725 12/11/2003 7.9 84
06905725 1/8/2004 0.24 19
06905725 2/20/2004 41 81
06905725 3/17/2004 25 60
06905725 4/21/2004 1.6 15
06905725 5/12/2004 0.55 < 10
06905725 6/24/2004 1.9 31
06905725 7/13/2004 11 52
06905725 8/24/2004 0.25 21
06905725 9/15/2004 0.52 < 10
06905725 10/28/2004 2 < 10
06905725 11/17/2004 1.8 < 10
06905725 12/17/2004 2.4 < 10
06905725 1/26/2005 18 46
06905725 2/8/2005 22 65
06905725 3/17/2005 2.9 < 10
06905725 4/7/2005 2.9 < 10
06905725 5/11/2005 11 10
06905725 6/29/2005 1.7 21
06905725 7/14/2005 0.02 < 10
06905725 8/18/2005 0.08 22
06905725 9/21/2005 0.05 74
06905725 10/4/2005 0.9 316
06905725 11/1/2005 0.04 22
06905725 12/13/2005 0.01 < 10
06905725 1/27/2006 0.12 < 10
06905725 2/15/2006 0.17 15
06905725 3/9/2006 0.3 < 10
06905725 4/14/2006 1.3 18
06905725 5/12/2006 1.1 10
06905725 6/15/2006 0.11 < 10
06905725 7/17/2006 0 34
06905725 8/8/2006 2.4 203
06905725 9/21/2006 0.06 11

Sandy Creek TMDL 72
USGS Gage Number Sample Date Flow (cfs)
Total Suspended Solids (mg/L)1
06905725 10/23/2006 0.03 20
06905725 11/15/2006 0.03 82
06905725 12/15/2006 0.2 < 10
06905725 1/24/2007 0.62 11
06905725 2/22/2007 8 < 10
06905725 3/13/2007 6.5 25
06905725 4/24/2007 1.7 < 50
06905725 5/8/2007 74 176
06905725 6/28/2007 12 444
06905725 7/17/2007 0.06 26
06905725 8/22/2007 2.5 245
06905725 9/26/2007 0.04 54
06905725 10/17/2007 0.07 312
06905725 11/7/2007 0.05 11
06905725 12/18/2007 2.8 20
06905725 1/9/2008 40 68
06905725 2/26/2008 39 180
06905725 3/25/2008 6.2 21
06905725 4/17/2008 5.8 28
06905725 5/22/2008 1.2 10
06905725 6/19/2008 2.5 25
06905725 7/18/2008 0.4 16
06905725 8/14/2008 3.9 182
06905725 9/23/2008 2.1 14
06905725 10/28/2008 1.5 < 15
06905725 11/20/2008 4.8 < 15
06905725 12/4/2008 3.5 < 15
06905725 1/29/2009 0.89 < 15
06905725 2/26/2009 4.8 < 15
06905725 3/12/2009 25 170
06905725 4/23/2009 5.4 < 15
06905725 5/14/2009 47 214
06905725 6/26/2009 5 < 150
06905725 7/21/2009 0.32 < 15
06905725 8/19/2009 2 106

Sandy Creek TMDL 73
USGS Gage Number Sample Date Flow (cfs)
Total Suspended Solids (mg/L)1
06898000 - Thompson River at Davis City, IA 06898000 10/14/1999 22 13 06898000 11/9/1999 12 14 06898000 12/15/1999 15 3 06898000 1/4/2000 19 4 06898000 2/1/2000 18 3 06898000 3/21/2000 30 6 06898000 4/10/2000 21 32 06898000 5/2/2000 27 76 06898000 6/19/2000 45 88 06898000 7/17/2000 40 49 06898000 8/15/2000 14 48 06898000 9/25/2000 30 14 06898000 10/12/2000 10 19 06898000 11/13/2000 30 14 06898000 12/13/2000 15 5 06898000 1/11/2001 0 3 06898000 2/15/2001 0 9 06898000 3/15/2001 4100 1690 06898000 4/11/2001 1200 1450 06898000 5/9/2001 180 440 06898000 6/12/2001 340 100 06898000 7/9/2001 82 30 06898000 8/14/2001 21 26 06898000 9/11/2001 120 100 06898000 10/8/2001 37 11 06898000 11/6/2001 24 13 06898000 12/4/2001 27 4 06898000 4/2/2002 59 9 06898000 5/8/2002 90 84 06898000 6/4/2002 74 62 06898000 7/2/2002 30 34 06898000 8/6/2002 29 91 06898000 9/5/2002 5.1 75 06898000 10/2/2002 5 34 06898000 11/4/2002 5.8 5 06898000 4/1/2003 26 18

Sandy Creek TMDL 74
USGS Gage Number Sample Date Flow (cfs)
Total Suspended Solids (mg/L)1
06898000 5/6/2003 1900 2850 06898000 6/3/2003 69 60 06898000 7/1/2003 120 110 06898000 8/5/2003 15 39 06898000 9/2/2003 4 41 06898000 10/1/2003 1 25 06898000 11/4/2003 220 460 06898000 12/2/2003 9 12 06898000 3/2/2004 430 280 06898000 4/6/2004 250 98 06898000 5/5/2004 92 16 06898000 6/2/2004 540 480 06898000 7/1/2004 160 27 06898000 8/2/2004 100 24 06898000 9/2/2004 310 110 06898000 10/5/2004 100 10 06898000 11/2/2004 24 6 06898000 12/1/2004 15 11 06898000 4/5/2005 83 34 06898000 5/2/2005 200 48 06898000 6/2/2005 190 47 06898000 7/6/2005 80 45 06898000 8/1/2005 34 43 06898000 9/7/2005 14 34 06898000 10/4/2005 13 34 06898000 11/2/2005 3.9 7 06898000 12/6/2005 8 8 06898000 2/1/2006 12 7 06898000 4/5/2006 95 120 06898000 5/1/2006 2950 2240 06898000 6/1/2006 290 820 06898000 7/12/2006 12 21 06898000 8/2/2006 6 32 06898000 9/6/2006 34 36 06898000 10/3/2006 11 20 06898000 11/1/2006 19 9 06898000 12/5/2006 65 18

Sandy Creek TMDL 75
USGS Gage Number Sample Date Flow (cfs)
Total Suspended Solids (mg/L)1
06898000 1/3/2007 440 610 06898000 2/7/2007 19 4 06898000 3/7/2007 540 140 06898000 4/3/2007 400 770 06898000 5/2/2007 540 250 06898000 6/5/2007 470 97 06898000 7/5/2007 65 25 06898000 8/2/2007 29 29 06898000 9/6/2007 140 27 06898000 10/2/2007 98 20 06898000 11/6/2007 190 15 06898000 12/4/2007 460 180 06898000 1/8/2008 2100 530 06898000 2/5/2008 360 43 06898000 3/4/2008 4650 730 06898000 4/1/2008 620 1100 06898000 5/6/2008 710 88 06898000 6/3/2008 4100 4900 06898000 7/9/2008 2700 3200 06898000 8/5/2008 240 100 06898000 9/2/2008 59 34
06896187 – Middle Fork Grand River near Grant City, MO 06896187 11/10/1999 2 9 06896187 5/17/2000 0.18 4.99 06896187 11/29/2000 1.2 4.99 06896187 5/1/2001 74 278 06896187 11/7/2001 3.2 4.99 06896187 1/16/2002 2.3 4.99 06896187 3/13/2002 4.4 7.5 06896187 5/8/2002 28 250 06896187 7/31/2002 0.4 4.99 06896187 9/4/2002 0.15 4.99 06896187 11/6/2002 0.96 4.99 06896187 1/15/2003 0.41 4.99 06896187 3/27/2003 0.46 8 06896187 5/21/2003 4.2 22 06896187 7/16/2003 0.39 12

Sandy Creek TMDL 76
USGS Gage Number Sample Date Flow (cfs)
Total Suspended Solids (mg/L)1
06896187 9/3/2003 0.01 28 06896187 11/5/2003 22 108 06896187 1/22/2004 1.1 4.99 06896187 3/24/2004 8.2 12 06896187 4/29/2004 20 4 06896187 5/19/2004 40 200 06896187 5/27/2004 32 120 06896187 6/24/2004 30 39 06896187 7/8/2004 5.7 4.99 06896187 7/30/2004 24 30 06896187 9/9/2004 3.5 10 06896187 9/23/2004 15 24 06896187 10/29/2004 10 14 06896187 11/9/2004 1.9 4.99 06896187 11/26/2004 4 23 06896187 1/20/2005 1.7 4.99 06896187 1/26/2005 150 305 06896187 2/25/2005 12 36 06896187 3/2/2005 80 32 06896187 3/21/2005 6.5 11 06896187 4/26/2005 24 69 06896187 5/24/2005 12 62 06896187 5/24/2005 23 87 06896187 6/21/2005 10 19 06896187 7/7/2005 2.6 17 06896187 7/26/2005 10 337 06896187 8/25/2005 3.8 41 06896187 9/15/2005 0.71 26 06896187 9/28/2005 1 18 06896187 10/25/2005 0.6 19 06896187 11/9/2005 0.71 4.99 06896187 11/21/2005 2 7 06896187 12/27/2005 4 18 06896187 1/19/2006 0.81 4.99 06896187 1/23/2006 2 6 06896187 3/28/2006 8 9 06896187 3/30/2006 3.3 4.99
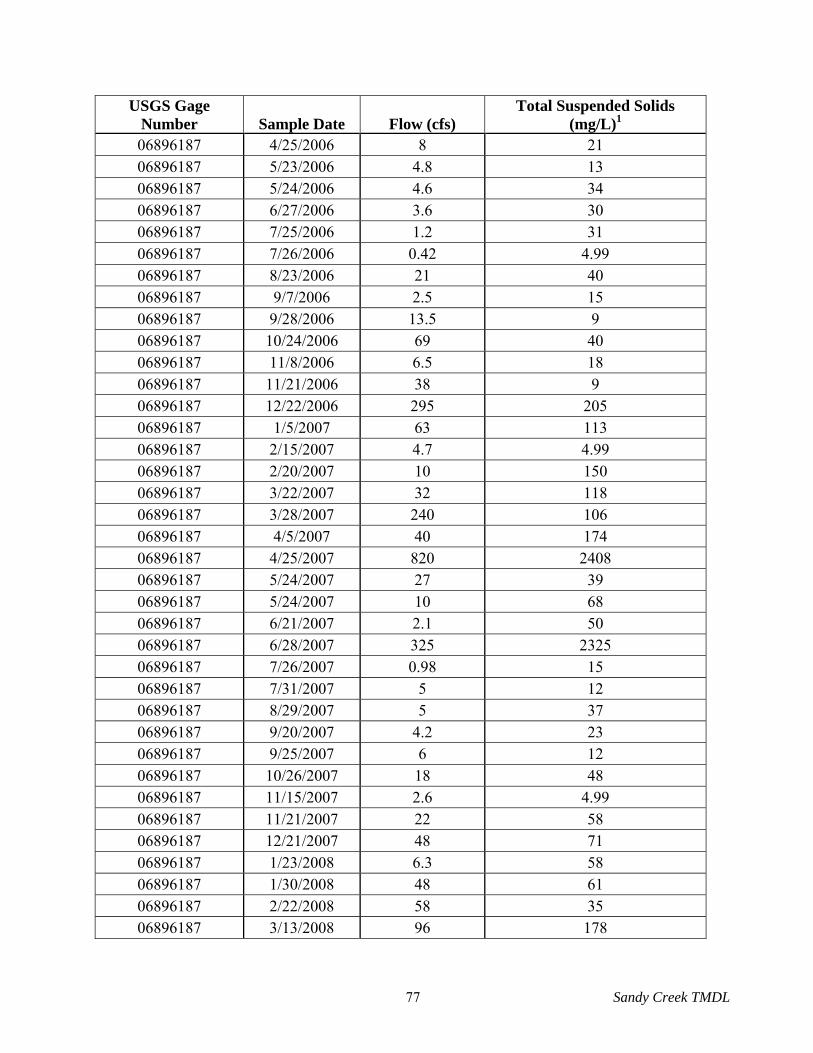
Sandy Creek TMDL 77
USGS Gage Number Sample Date Flow (cfs)
Total Suspended Solids (mg/L)1
06896187 4/25/2006 8 21 06896187 5/23/2006 4.8 13 06896187 5/24/2006 4.6 34 06896187 6/27/2006 3.6 30 06896187 7/25/2006 1.2 31 06896187 7/26/2006 0.42 4.99 06896187 8/23/2006 21 40 06896187 9/7/2006 2.5 15 06896187 9/28/2006 13.5 9 06896187 10/24/2006 69 40 06896187 11/8/2006 6.5 18 06896187 11/21/2006 38 9 06896187 12/22/2006 295 205 06896187 1/5/2007 63 113 06896187 2/15/2007 4.7 4.99 06896187 2/20/2007 10 150 06896187 3/22/2007 32 118 06896187 3/28/2007 240 106 06896187 4/5/2007 40 174 06896187 4/25/2007 820 2408 06896187 5/24/2007 27 39 06896187 5/24/2007 10 68 06896187 6/21/2007 2.1 50 06896187 6/28/2007 325 2325 06896187 7/26/2007 0.98 15 06896187 7/31/2007 5 12 06896187 8/29/2007 5 37 06896187 9/20/2007 4.2 23 06896187 9/25/2007 6 12 06896187 10/26/2007 18 48 06896187 11/15/2007 2.6 4.99 06896187 11/21/2007 22 58 06896187 12/21/2007 48 71 06896187 1/23/2008 6.3 58 06896187 1/30/2008 48 61 06896187 2/22/2008 58 35 06896187 3/13/2008 96 178

Sandy Creek TMDL 78
USGS Gage Number Sample Date Flow (cfs)
Total Suspended Solids (mg/L)1
06896187 3/26/2008 96 62 06896187 4/30/2008 180 150 06896187 5/30/2008 320 1583 06896187 5/30/2008 5080 3430 06896187 6/27/2008 475 1204 06896187 7/11/2008 14 112 06896187 7/31/2008 74 103 06896187 8/28/2008 11 11 06896187 9/18/2008 12 48 06896187 9/26/2008 21 37 06896187 10/31/2008 120 84 06896187 11/26/2008 55 24
06900900 – Locust Creek near Unionville, MO 06900900 11/30/1999 0.46 4 06900900 1/25/2000 0.1 8 06900900 5/11/2000 2 4.99 06900900 7/27/2000 0.94 20 06900900 11/13/2000 1.9 16 06900900 1/23/2001 4 4.99 06900900 5/23/2001 19 23 06900900 7/24/2001 2.9 26 06900900 10/24/2001 59 192 06900900 11/27/2001 4.4 4.99 06900900 1/2/2002 0.66 4.99 06900900 1/9/2002 0.94 4.99 06900900 2/26/2002 9.2 28 06900900 3/20/2002 8.8 4.99 06900900 4/16/2002 27 120 06900900 5/22/2002 16 15 06900900 6/27/2002 1.6 13 06900900 7/25/2002 0.52 4.99 06900900 8/20/2002 14 52 06900900 9/9/2002 0.05 18 06900900 10/16/2002 0.03 4.99 06900900 11/20/2002 0.15 4.99 06900900 12/17/2002 0.28 4.99 06900900 2/19/2003 0.36 4.99
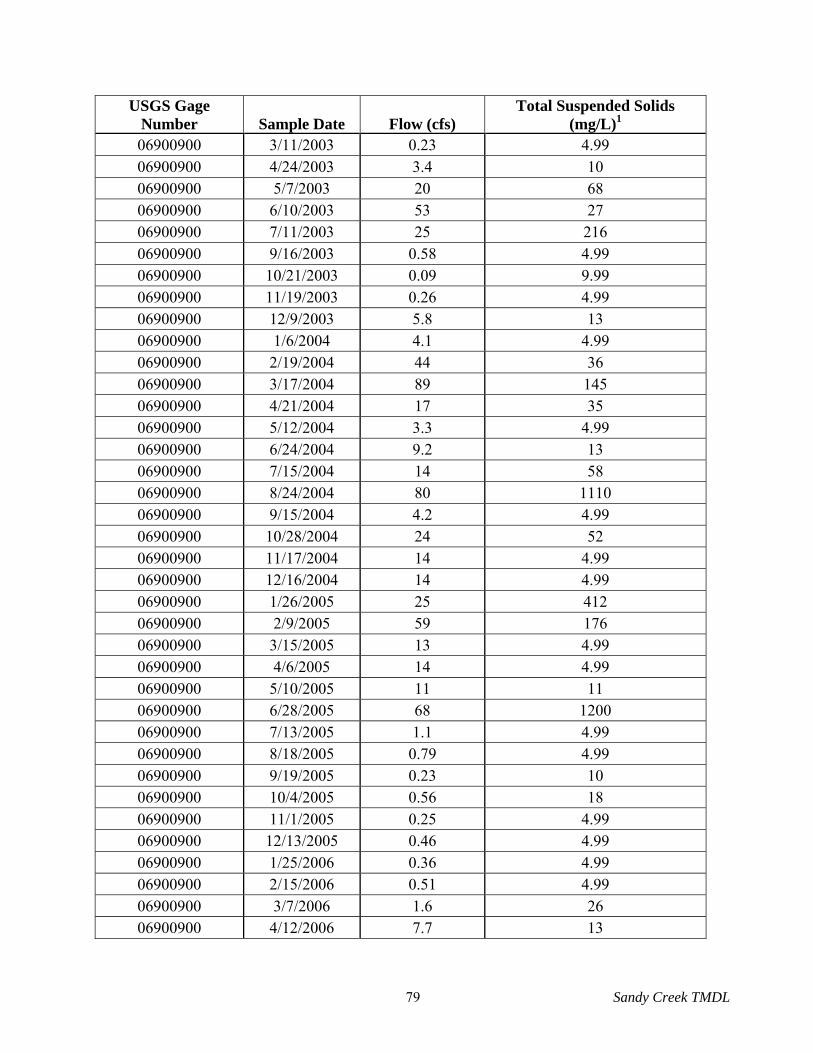
Sandy Creek TMDL 79
USGS Gage Number Sample Date Flow (cfs)
Total Suspended Solids (mg/L)1
06900900 3/11/2003 0.23 4.99 06900900 4/24/2003 3.4 10 06900900 5/7/2003 20 68 06900900 6/10/2003 53 27 06900900 7/11/2003 25 216 06900900 9/16/2003 0.58 4.99 06900900 10/21/2003 0.09 9.99 06900900 11/19/2003 0.26 4.99 06900900 12/9/2003 5.8 13 06900900 1/6/2004 4.1 4.99 06900900 2/19/2004 44 36 06900900 3/17/2004 89 145 06900900 4/21/2004 17 35 06900900 5/12/2004 3.3 4.99 06900900 6/24/2004 9.2 13 06900900 7/15/2004 14 58 06900900 8/24/2004 80 1110 06900900 9/15/2004 4.2 4.99 06900900 10/28/2004 24 52 06900900 11/17/2004 14 4.99 06900900 12/16/2004 14 4.99 06900900 1/26/2005 25 412 06900900 2/9/2005 59 176 06900900 3/15/2005 13 4.99 06900900 4/6/2005 14 4.99 06900900 5/10/2005 11 11 06900900 6/28/2005 68 1200 06900900 7/13/2005 1.1 4.99 06900900 8/18/2005 0.79 4.99 06900900 9/19/2005 0.23 10 06900900 10/4/2005 0.56 18 06900900 11/1/2005 0.25 4.99 06900900 12/13/2005 0.46 4.99 06900900 1/25/2006 0.36 4.99 06900900 2/15/2006 0.51 4.99 06900900 3/7/2006 1.6 26 06900900 4/12/2006 7.7 13

Sandy Creek TMDL 80
USGS Gage Number Sample Date Flow (cfs)
Total Suspended Solids (mg/L)1
06900900 5/11/2006 5.7 4.99 06900900 6/13/2006 0.66 19 06900900 7/18/2006 0.7 10 06900900 8/8/2006 2.9 14 06900900 9/19/2006 0.65 4.99 06900900 10/24/2006 0.23 4.99 06900900 11/14/2006 0.5 4.99 06900900 12/13/2006 0.85 4.99 06900900 1/23/2007 0.73 4.99 06900900 2/22/2007 106 85 06900900 3/14/2007 25 40 06900900 4/26/2007 2960 670 06900900 5/9/2007 189 266 06900900 6/26/2007 2.7 11 06900900 7/17/2007 0.63 4.99 06900900 8/22/2007 4.3 58 06900900 9/26/2007 2.4 9.99 06900900 10/17/2007 17 58 06900900 11/7/2007 6 4.99 06900900 12/19/2007 24 21 06900900 1/8/2008 210 260 06900900 2/27/2008 82 28 06900900 3/26/2008 26 31 06900900 4/17/2008 42 107 06900900 5/20/2008 14 4.99 06900900 6/19/2008 73 312 06900900 7/17/2008 6.2 19 06900900 8/14/2008 16 326 06900900 9/25/2008 20 11
640/IOWAa – Chariton River at Centerville, IA 640/IOWAa 10/16/1979 5 44 640/IOWAa 12/3/1979 5 14 640/IOWAa 1/2/1980 6 10 640/IOWAa 2/12/1980 2 25 640/IOWAa 3/4/1980 4 14 640/IOWAa 5/5/1980 9 56 640/IOWAa 6/18/1980 408 144

Sandy Creek TMDL 81
USGS Gage Number Sample Date Flow (cfs)
Total Suspended Solids (mg/L)1
640/IOWAa 7/1/1980 713 60 640/IOWAa 8/4/1980 778 40 640/IOWAa 8/28/1980 25 38 640/IOWAa 9/11/1980 685 12 640/IOWAa 10/20/1980 8 18 640/IOWAa 11/5/1980 8 16 640/IOWAa 12/10/1980 1235 58 640/IOWAa 1/13/1981 9 16 640/IOWAa 2/25/1981 67 512 640/IOWAa 3/3/1981 495 50 640/IOWAa 4/6/1981 67 14 640/IOWAa 5/4/1981 7 76 640/IOWAa 6/29/1981 5 116 640/IOWAa 8/10/1981 1100 64 640/IOWAa 9/1/1981 1050 28 640/IOWAa 10/5/1981 1018 16 640/IOWAa 11/16/1981 10 26 640/IOWAa 12/14/1981 1000 34 640/IOWAa 1/21/1982 24 18 640/IOWAa 2/17/1982 30 56 640/IOWAa 3/10/1982 587 16 640/IOWAa 5/2/1982 346 50 640/IOWAa 6/21/1982 387 58 640/IOWAa 7/15/1982 500 1500 640/IOWAa 8/3/1982 1440 48 640/IOWAa 10/5/1982 26 10 640/IOWAa 11/8/1982 1105 26 640/IOWAa 12/7/1982 19 200 640/IOWAa 1/3/1983 1425 32 640/IOWAa 2/14/1983 497 76 640/IOWAa 3/8/1983 1410 30 640/IOWAa 4/18/1983 720 26 640/IOWAa 5/11/1983 779 12 640/IOWAa 6/6/1983 698 30 640/IOWAa 7/5/1983 720 42 640/IOWAa 8/1/1983 20 41 640/IOWAa 9/12/1983 7 54

Sandy Creek TMDL 82
USGS Gage Number Sample Date Flow (cfs)
Total Suspended Solids (mg/L)1
640/IOWAa 10/27/1983 13 26 640/IOWAa 11/8/1983 12 84 640/IOWAa 12/12/1983 95 89 640/IOWAa 1/3/1984 205 8 640/IOWAa 2/21/1984 1098 28 640/IOWAa 3/14/1984 35 15 640/IOWAa 4/19/1984 720 22 640/IOWAa 5/7/1984 710 50 640/IOWAa 6/12/1984 11 350 640/IOWAa 7/12/1984 1120 68 640/IOWAa 8/15/1984 9 56 640/IOWAa 9/26/1984 26 42 640/IOWAa 10/23/1984 415 40 640/IOWAa 11/6/1984 416 34 640/IOWAa 12/5/1984 10 35 640/IOWAa 1/14/1985 109 31 640/IOWAa 2/18/1985 23 8 640/IOWAa 3/11/1985 1130 200 640/IOWAa 4/3/1985 189 26 640/IOWAa 5/2/1985 50 54 640/IOWAa 6/3/1985 8 56 640/IOWAa 9/10/1985 20 32 640/IOWAa 10/15/1985 56 42 640/IOWAa 11/14/1985 313 150 640/IOWAa 12/12/1985 1100 22 640/IOWAa 1/9/1986 164 14 640/IOWAa 2/20/1986 12 40 640/IOWAa 3/4/1986 52 16 640/IOWAa 4/9/1986 630 38 640/IOWAa 5/12/1986 439 44 640/IOWAa 6/10/1986 713 62 640/IOWAa 7/7/1986 849 49 640/IOWAa 8/18/1986 1050 17 640/IOWAa 9/9/1986 54 34 640/IOWAa 10/13/1986 737 40 640/IOWAa 11/6/1986 716 22 640/IOWAa 12/4/1986 1017 18

Sandy Creek TMDL 83
USGS Gage Number Sample Date Flow (cfs)
Total Suspended Solids (mg/L)1
640/IOWAa 1/15/1987 15 280 640/IOWAa 2/9/1987 15 15 640/IOWAa 3/3/1987 14 160 640/IOWAa 4/8/1987 722 34 640/IOWAa 5/26/1987 168 37 640/IOWAa 6/8/1987 410 53 640/IOWAa 7/1/1987 11 108 640/IOWAa 8/3/1987 242 36 640/IOWAa 9/3/1987 660 62 640/IOWAa 10/21/1987 98 20 640/IOWAa 11/4/1987 217 28 640/IOWAa 12/7/1987 840 23 640/IOWAa 1/14/1988 56 13 640/IOWAa 2/8/1988 23 8 640/IOWAa 3/17/1988 390 74 640/IOWAa 4/13/1988 32 29 640/IOWAa 5/23/1988 28 69 640/IOWAa 6/20/1988 27 39 640/IOWAa 7/12/1988 12 52 640/IOWAa 8/1/1988 30 61 640/IOWAa 9/1/1988 30 44 640/IOWAa 10/20/1988 28 29 640/IOWAa 11/3/1988 30 10 640/IOWAa 12/1/1988 20 6 640/IOWAa 1/16/1989 10 6 640/IOWAa 2/2/1989 10 5 640/IOWAa 3/1/1989 15 0.5 640/IOWAa 4/20/1989 20 40 640/IOWAa 5/3/1989 20 38 640/IOWAa 6/7/1989 22 81 640/IOWAa 7/5/1989 20 42 640/IOWAa 8/3/1989 20 50 640/IOWAa 9/5/1989 20 43 640/IOWAa 10/11/1989 22 33 640/IOWAa 11/1/1989 20 13 640/IOWAa 12/6/1989 14 9 640/IOWAa 1/10/1990 13 12

Sandy Creek TMDL 84
USGS Gage Number Sample Date Flow (cfs)
Total Suspended Solids (mg/L)1
640/IOWAa 2/1/1990 11 6 640/IOWAa 3/1/1990 12 21 640/IOWAa 4/4/1990 12 37 640/IOWAa 5/3/1990 13 52 640/IOWAa 6/6/1990 500 52 640/IOWAa 7/23/1990 250 190 640/IOWAa 8/13/1990 700 54 640/IOWAa 9/6/1990 800 59 640/IOWAa 10/18/1990 801 34 640/IOWAa 11/20/1990 12 15 640/IOWAa 12/26/1990 601 16 640/IOWAa 1/21/1991 50 10 640/IOWAa 2/12/1991 600 160 640/IOWAa 3/4/1991 11 100 640/IOWAa 4/3/1991 600 22 640/IOWAa 5/20/1991 700 37 640/IOWAa 6/11/1991 800 37 640/IOWAa 7/9/1991 600 40 640/IOWAa 8/12/1991 1200 70 640/IOWAa 9/5/1991 11 76 640/IOWAa 10/3/1991 11 26 640/IOWAa 11/13/1991 8 9 640/IOWAa 12/10/1991 15 12 640/IOWAa 1/22/1992 500 8 640/IOWAa 2/12/1992 12 4 640/IOWAa 3/9/1992 12 52 640/IOWAa 4/1/1992 400 27 640/IOWAa 5/4/1992 700 77 640/IOWAa 6/4/1992 750 36 640/IOWAa 7/2/1992 300 39 640/IOWAa 8/17/1992 1000 35 640/IOWAa 9/22/1992 1400 62 640/IOWAa 10/12/1992 800 24 640/IOWAa 11/4/1992 800 32 640/IOWAa 12/3/1992 1190 24 640/IOWAa 1/14/1993 1500 28 640/IOWAa 2/1/1993 1500 22

Sandy Creek TMDL 85
USGS Gage Number Sample Date Flow (cfs)
Total Suspended Solids (mg/L)1
640/IOWAa 3/15/1993 1500 14 640/IOWAa 4/12/1993 1500 40 640/IOWAa 5/17/1993 800 23 640/IOWAa 6/11/1993 410 89 640/IOWAa 7/20/1993 1500 54 640/IOWAa 8/2/1993 1800 76 640/IOWAa 9/2/1993 1000 32 640/IOWAa 10/7/1993 1800 30 640/IOWAa 11/4/1993 1800 27 640/IOWAa 12/2/1993 590 24 640/IOWAa 1/10/1994 18 15 640/IOWAa 2/2/1994 20 22 640/IOWAa 3/9/1994 1200 160 640/IOWAa 4/14/1994 18 20 640/IOWAa 5/5/1994 110 27 640/IOWAa 6/1/1994 17 45 640/IOWAa 7/5/1994 17 57 640/IOWAa 8/1/1994 14 69 640/IOWAa 9/8/1994 17 35 640/IOWAa 10/3/1994 18 41 640/IOWAa 11/1/1994 15 16 640/IOWAa 12/1/1994 13 7 640/IOWAa 1/9/1995 10 6 640/IOWAa 2/8/1995 12 37 640/IOWAa 3/9/1995 10 5 640/IOWAa 4/19/1995 9 170 640/IOWAa 5/3/1995 600 51 640/IOWAa 6/2/1995 800 74 640/IOWAa 7/7/1995 1000 140 640/IOWAa 8/4/1995 1200 56 640/IOWAa 9/5/1995 1200 56 640/IOWAa 10/4/1995 18 22 640/IOWAa 11/3/1995 4 9 640/IOWAa 12/7/1995 400 9 640/IOWAa 1/11/1996 15 6 640/IOWAa 2/5/1996 3 6 640/IOWAa 3/1/1996 100 19
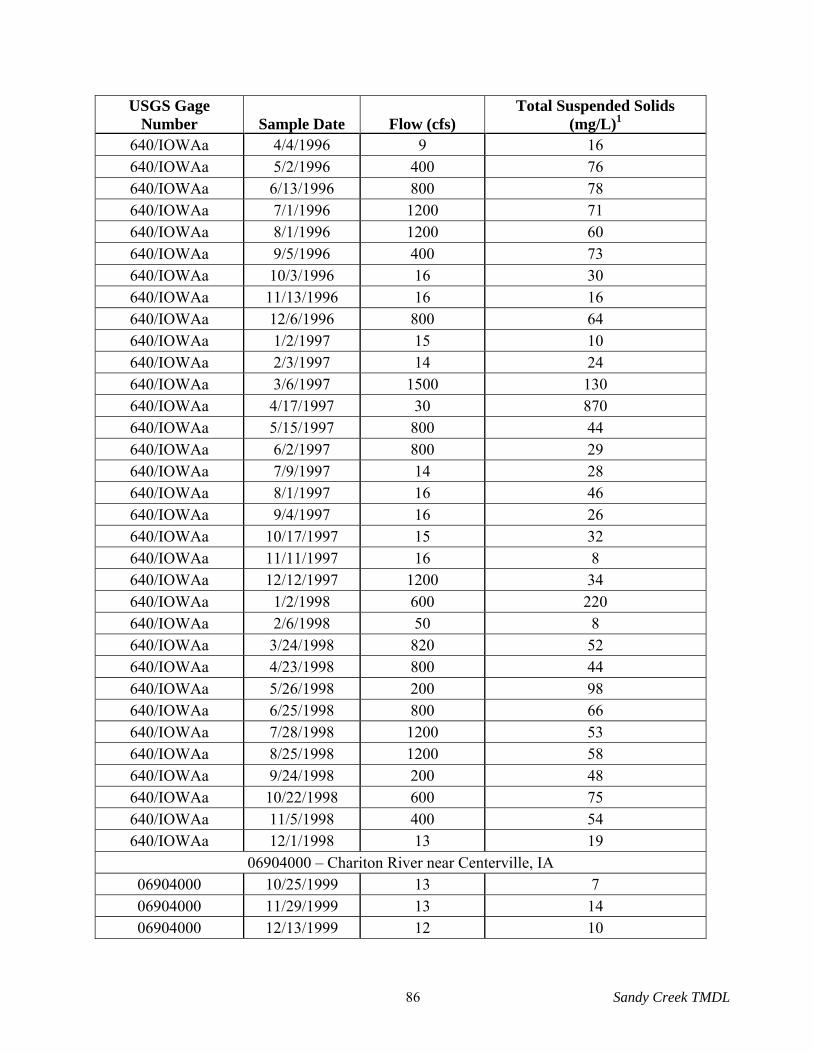
Sandy Creek TMDL 86
USGS Gage Number Sample Date Flow (cfs)
Total Suspended Solids (mg/L)1
640/IOWAa 4/4/1996 9 16 640/IOWAa 5/2/1996 400 76 640/IOWAa 6/13/1996 800 78 640/IOWAa 7/1/1996 1200 71 640/IOWAa 8/1/1996 1200 60 640/IOWAa 9/5/1996 400 73 640/IOWAa 10/3/1996 16 30 640/IOWAa 11/13/1996 16 16 640/IOWAa 12/6/1996 800 64 640/IOWAa 1/2/1997 15 10 640/IOWAa 2/3/1997 14 24 640/IOWAa 3/6/1997 1500 130 640/IOWAa 4/17/1997 30 870 640/IOWAa 5/15/1997 800 44 640/IOWAa 6/2/1997 800 29 640/IOWAa 7/9/1997 14 28 640/IOWAa 8/1/1997 16 46 640/IOWAa 9/4/1997 16 26 640/IOWAa 10/17/1997 15 32 640/IOWAa 11/11/1997 16 8 640/IOWAa 12/12/1997 1200 34 640/IOWAa 1/2/1998 600 220 640/IOWAa 2/6/1998 50 8 640/IOWAa 3/24/1998 820 52 640/IOWAa 4/23/1998 800 44 640/IOWAa 5/26/1998 200 98 640/IOWAa 6/25/1998 800 66 640/IOWAa 7/28/1998 1200 53 640/IOWAa 8/25/1998 1200 58 640/IOWAa 9/24/1998 200 48 640/IOWAa 10/22/1998 600 75 640/IOWAa 11/5/1998 400 54 640/IOWAa 12/1/1998 13 19
06904000 – Chariton River near Centerville, IA 06904000 10/25/1999 13 7 06904000 11/29/1999 13 14 06904000 12/13/1999 12 10

Sandy Creek TMDL 87
USGS Gage Number Sample Date Flow (cfs)
Total Suspended Solids (mg/L)1
06904000 1/5/2000 13 20 06904000 2/14/2000 12 7 06904000 3/6/2000 12 26 06904000 4/3/2000 12 41 06904000 5/2/2000 12 33 06904000 6/20/2000 11 78 06904000 7/24/2000 17 54 06904000 8/28/2000 16 73 06904000 9/12/2000 17 35 06904000 10/5/2000 7 43 06904000 11/9/2000 9 10 06904000 12/7/2000 11 8 06904000 1/3/2001 8 5 06904000 2/8/2001 10 16 06904000 3/8/2001 1200 57 06904000 4/3/2001 1500 29 06904000 5/1/2001 800 32 06904000 6/6/2001 800 370 06904000 7/3/2001 1500 27 06904000 8/1/2001 800 21 06904000 9/4/2001 12 27 06904000 10/2/2001 21 29 06904000 11/5/2001 13 25 06904000 12/3/2001 11 14 06904000 2/4/2002 13 10 06904000 4/1/2002 8 29 06904000 5/1/2002 13 60 06904000 6/3/2002 1500 41 06904000 7/1/2002 160 43 06904000 8/5/2002 9 24 06904000 9/4/2002 11 30 06904000 10/1/2002 11 25 06904000 11/5/2002 10 10 06904000 12/2/2002 8 6 06904000 1/6/2003 9 5 06904000 3/3/2003 9 5 06904000 4/1/2003 10 9
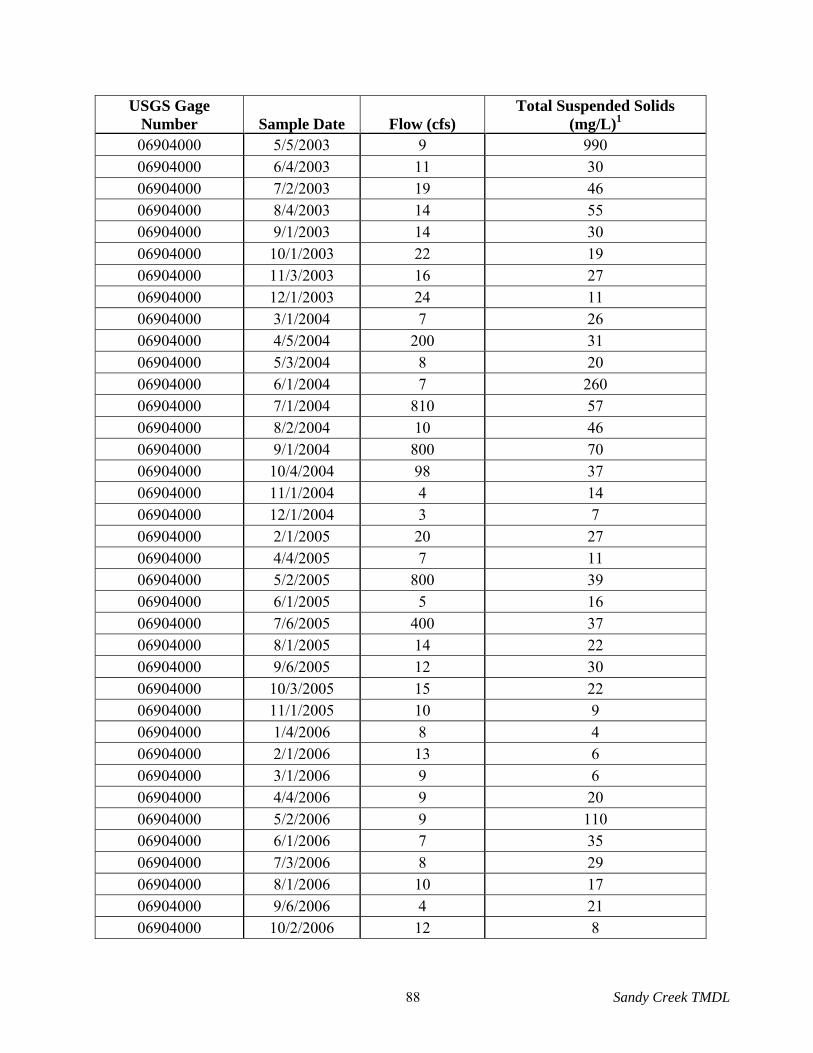
Sandy Creek TMDL 88
USGS Gage Number Sample Date Flow (cfs)
Total Suspended Solids (mg/L)1
06904000 5/5/2003 9 990 06904000 6/4/2003 11 30 06904000 7/2/2003 19 46 06904000 8/4/2003 14 55 06904000 9/1/2003 14 30 06904000 10/1/2003 22 19 06904000 11/3/2003 16 27 06904000 12/1/2003 24 11 06904000 3/1/2004 7 26 06904000 4/5/2004 200 31 06904000 5/3/2004 8 20 06904000 6/1/2004 7 260 06904000 7/1/2004 810 57 06904000 8/2/2004 10 46 06904000 9/1/2004 800 70 06904000 10/4/2004 98 37 06904000 11/1/2004 4 14 06904000 12/1/2004 3 7 06904000 2/1/2005 20 27 06904000 4/4/2005 7 11 06904000 5/2/2005 800 39 06904000 6/1/2005 5 16 06904000 7/6/2005 400 37 06904000 8/1/2005 14 22 06904000 9/6/2005 12 30 06904000 10/3/2005 15 22 06904000 11/1/2005 10 9 06904000 1/4/2006 8 4 06904000 2/1/2006 13 6 06904000 3/1/2006 9 6 06904000 4/4/2006 9 20 06904000 5/2/2006 9 110 06904000 6/1/2006 7 35 06904000 7/3/2006 8 29 06904000 8/1/2006 10 17 06904000 9/6/2006 4 21 06904000 10/2/2006 12 8

Sandy Creek TMDL 89
USGS Gage Number Sample Date Flow (cfs)
Total Suspended Solids (mg/L)1
06904000 11/1/2006 11 3 06904000 12/4/2006 10 9 06904000 1/4/2007 11 18 06904000 3/5/2007 10 23 06904000 4/2/2007 43 30 06904000 5/1/2007 790 47 06904000 6/4/2007 800 44 06904000 7/5/2007 1200 49 06904000 8/1/2007 400 19 06904000 9/5/2007 400 73 06904000 10/1/2007 800 40 06904000 11/5/2007 800 37 06904000 12/3/2007 800 25 06904000 1/7/2008 200 340 06904000 2/5/2008 790 20 06904000 4/1/2008 1200 200 06904000 5/5/2008 790 27 06904000 6/2/2008 790 27 06904000 7/9/2008 12 430 06904000 8/6/2008 1500 31 06904000 9/4/2008 1500 29
06906300 – East Fork Little Chariton River at Huntsville, MO 06906300 10/20/1982 52 15 06906300 11/3/1982 54 36 06906300 12/14/1982 416 50 06906300 1/5/1983 232 37 06906300 2/8/1983 113 35 06906300 3/8/1983 270 156 06906300 4/12/1983 798 122 06906300 5/11/1983 287 101 06906300 6/7/1983 188 66 06906300 7/19/1983 17 60 06906300 8/16/1983 4.8 30 06906300 9/28/1983 1 18 06906300 10/13/1983 10 31 06906300 11/21/1983 59 27 06906300 12/13/1983 442 78

Sandy Creek TMDL 90
USGS Gage Number Sample Date Flow (cfs)
Total Suspended Solids (mg/L)1
06906300 1/10/1984 100 37 06906300 2/14/1984 74 24 06906300 3/13/1984 144 33 06906300 4/10/1984 623 117 06906300 5/17/1984 320 110 06906300 6/12/1984 433 152 06906300 7/26/1984 16 40 06906300 8/23/1984 6 45 06906300 9/20/1984 6.3 19 06906300 10/12/1984 20 30 06906300 11/15/1984 322 75 06906300 12/13/1984 122 53 06906300 1/17/1985 194 53 06906300 2/15/1985 90 47 06906300 3/14/1985 626 81 06906300 4/4/1985 243 87 06906300 5/9/1985 72 261 06906300 6/6/1985 26 5 06906300 7/18/1985 13 68 06906300 9/19/1985 58 98 06906300 10/10/1985 1290 674 06906300 11/14/1985 1760 238 06906300 12/12/1985 300 71 06906300 1/15/1986 66 50 06906300 2/5/1986 320 376 06906300 3/7/1986 220 46 06906300 4/3/1986 130 67 06906300 5/6/1986 21 30 06906300 6/4/1986 274 117 06906300 7/16/1986 196 335 06906300 8/12/1986 60 66 06906300 9/4/1986 51 79 06906300 10/22/1986 324 79 06906300 11/20/1986 123 62 06906300 12/9/1986 790 189 06906300 1/14/1987 80 53 06906300 2/11/1987 83 47

Sandy Creek TMDL 91
USGS Gage Number Sample Date Flow (cfs)
Total Suspended Solids (mg/L)1
06906300 3/11/1987 73 35 06906300 4/7/1987 88 47 06906300 5/13/1987 29 36 06906300 6/2/1987 18 113 06906300 10/11/1989 7.8 30 06906300 11/8/1989 8.2 28 06906300 12/6/1989 8.6 20 06906300 1/19/1990 18 60 06906300 2/14/1990 16 22 06906300 3/22/1990 36 38 06906300 4/11/1990 26 24 06906300 5/8/1990 283 169 06906300 6/5/1990 180 0.5 06906300 7/10/1990 140 49 06906300 8/7/1990 30 34 06906300 9/5/1990 10 14 06906300 10/10/1990 16 19 06906300 11/14/1990 11 29 06906300 12/10/1990 27 10 06906300 1/9/1991 68 8 06906300 2/5/1991 87 90 06906300 3/11/1991 64 15 06906300 4/3/1991 73 67 06906300 5/15/1991 196 216 06906300 6/12/1991 128 39 06906300 11/9/1999 12 22 06906300 5/1/2000 9.5 20 06906300 11/20/2000 14 11 06906300 5/1/2001 74 59 06906300 11/5/2001 18 14 06906300 1/7/2002 10 4.99 06906300 3/5/2002 20 4.99 06906300 5/6/2002 3170 1280 06906300 7/15/2002 61 98 06906300 9/4/2002 51 39 06906300 11/26/2002 8.9 4.99 06906300 1/9/2003 12 4.99

Sandy Creek TMDL 92
USGS Gage Number Sample Date Flow (cfs)
Total Suspended Solids (mg/L)1
06906300 3/19/2003 23 14 06906300 5/1/2003 205 804 06906300 7/31/2003 8.5 13 06906300 9/10/2003 14 20 06906300 11/4/2003 28 4.99 06906300 1/6/2004 38 4.99 06906300 3/1/2004 57 33 06906300 5/19/2004 51 51 06906300 7/14/2004 64 56 06906300 9/1/2004 304 188 06906300 11/8/2004 151 51 06906300 1/25/2005 90 28 06906300 3/7/2005 37 32 06906300 5/3/2005 36 18 06906300 7/11/2005 7 25 06906300 9/6/2005 9.1 12 06906300 11/2/2005 12 4.99 06906300 1/5/2006 11 7.5 06906300 3/6/2006 17 4.99 06906300 5/3/2006 422 348 06906300 7/5/2006 49 14 06906300 9/5/2006 13 13 06906300 11/7/2006 17 4.99 06906300 1/4/2007 26 4.99 06906300 2/13/2007 36 13 06906300 3/6/2007 230 51 06906300 4/3/2007 274 120 06906300 5/2/2007 297 76 06906300 6/5/2007 144 56 06906300 7/10/2007 56 54 06906300 9/11/2007 13 25
Note: Blank cells indicate that there was no data for that particular parameter on that date. 1non-filterable residue data (NFR) is interchangeable with total suspended solids data (TSS)

Sandy Creek TMDL 93
Appendix D
Supplemental Implementation Plan
States are not required under Section 303(d) of the Clean Water Act to develop TMDL implementation plans and EPA does not approve or disapprove them. However, the Missouri Department of Natural Resources (MDNR) included an implementation plan in this TMDL to provide information regarding how point and nonpoint sources can or should be controlled to ensure implementation efforts achieve the loading reductions identified in this TMDL. EPA recognizes that technical guidance and support are critical to determining the feasibility of and achieving the goals outlined in this TMDL. Therefore, this informational plan is included to be used by local professionals, watershed managers and citizens for decision-making support and planning purposes. It should not be considered to be a part of the established Sandy Creek TMDL. Point Sources
The point source portion of a TMDL is typically implemented through permit action. Effluent limits and monitoring requirements for existing operating permits will be reevaluated to reflect the water quality targets set by the TMDL as the permits approach renewal. This includes effluent limits for TSS and nutrients using the WLAs developed for this TMDL and instream monitoring of TSS or turbidity, nitrogen and phosphorus. Future inspections of the permitted facilities by MDNR will determine the extent and nature of input from these sites. Discharge permits may need to be amended to include additional measures (e.g., a storm water pollution prevention plan) that ensure the facilities do not cause or contribute to the impairment of Sandy Creek. Additionally, permitted facilities identified to contribute to the pollutant loading of the impaired segment shall adopt appropriate best management practices (BMPs) to reduce such loading from their storm water outfalls. BMPs are recommended methods, structures and practices designed to prevent or reduce water pollution. These facilities must also regularly measure instream pollutant concentrations to determine the efficacy of the control measures. In addition to permitted point sources, this TMDL also cites AMLs as contributors to the impairment of Sandy Creek. As stated in Section 3.1.2, the MDNR Land Reclamation Program is in the process of reclaiming the AMLs in the vicinity of Sandy Creek through the use of forfeited bond funds. The goal of the Land Reclamation Program is to return AMLs to productive uses, such as wildlife habitat, farming, grazing or other recreational uses. Nonpoint Sources
Nonpoint sources of sediment are not regulated in Missouri. However, with cropland and grassland comprising a significant portion of the land area in the watershed, agricultural runoff is a likely contributor of sediment to the impaired water body. Contributions of sediment from agricultural areas should be reduced to meet the TMDL targets.
To reduce the loading and effect of sediment on Sandy Creek, efforts should be made to encourage agricultural producers in the watershed to adopt erosion control BMPs. The concept of BMPs is one of a voluntary and site specific approach to water quality problems. In the Sandy

Sandy Creek TMDL 94
Creek watershed, agricultural BMPs should focus on erosion control measures such as grassy swales, contour farming, the expansion or enhancement of riparian zones, off-stream watering of livestock and rotational grazing practices.
In an effort to most effectively implement voluntary BMPs, MDNR may work with the Natural Resources Conservation Service, local university extension offices and the local Soil and Water Conservation District to encourage area land owners to implement these practices. An additional approach may be to work with these agencies to form a watershed group comprised of local stakeholders to promote the use of erosion control practices.