united states securities and exchange...
TRANSCRIPT

UNITED STATES
SECURITIES AND EXCHANGE COMMISSION
WASHINGTON, D.C. 20549
FORM 10-Q
QUARTERLY REPORT PURSUANT TO SECTION 13 OR 15(d) OF THE
SECURITIES EXCHANGE ACT OF 1934 For the quarterly period ended June 30, 2008 Commission file number: 0-31164
Preformed Line Products Company
(Exact Name of Registrant as Specified in Its Charter)
Ohio 34-0676895
(State or Other Jurisdiction of Incorporation or Organization) (I.R.S. Employer Identification No.)
660 Beta Drive Mayfield Village, Ohio
44143
(Address of Principal Executive Office) (Zip Code)
(440) 461-5200
(Registrant's telephone number, including area code) Indicate by check mark whether the registrant (1) has filed all reports required to be filed by Section 13 or 15 (d) of the Securities Exchange Act of 1934 during the preceding 12 months (or for such shorter period that the registrant was required to file such reports) and (2) has been subject to such filing requirements for the past 90 days. Yes _X__ No __ Indicate by check mark whether the registrant is a large accelerated filer, an accelerated filer, or a non-accelerated filer. See definition of “large accelerated filer,” “accelerated filer” and “smaller reporting company” in Rule 12b-2 of the Exchange act. Large accelerated filer ____ Accelerated filer _X__ Non-accelerated filer____ (Do not check if a smaller reporting company) Smaller reporting Company ____ Indicate by check mark whether the registrant is a shell company (as defined in Rule 12b-2 of the Exchange Act). Yes No _X_ The number of common shares outstanding as of August 6, 2008: 5,214,830.

2
Table of Contents
Page
Part I - Financial Information
Item 1. Financial Statements and Supplementary Data 3
Item 2. Management's Discussion and Analysis of Financial Condition and Results
of Operations 17
Item 3. Quantitative and Qualitative Disclosures About Market Risk 25
Item 4. Controls and Procedures 25
Part II - Other Information
Item 1. Legal Proceedings 26
Item 1A. Risk Factors 26
Item 2. Unregistered Sales of Equity Securities and Use of Proceeds 26
Item 3. Defaults Upon Senior Securities 27
Item 4. Submission of Matters to a Vote of Security Holders 27
Item 5. Other Information 27
Item 6. Exhibits 27
SIGNATURES 29

3
PART I – FINANCIAL INFORMATION
ITEM 1. FINANCIAL STATEMENTS AND SUPPLEMENTARY DATA
PREFORMED LINE PRODUCTS COMPANY
CONSOLIDATED BALANCE SHEETS
(UNAUDITED)
June 30, December 31,
2008 2007
Thousands of dollars, except share data
ASSETS
Cash and cash equivalents 23,331$ 23,392$
Accounts receivable, less allowances of $1,065 ($1,199 in 2007) 48,275 37,002
Inventories - net 44,823 43,788
Deferred income taxes 2,976 2,982
Prepaids and other 6,097 4,098
Current assets of discontinued operations - 12,188
TOTAL CURRENT ASSETS 125,502 123,450
Property and equipment - net 63,143 58,506
Patents and other intangibles - net 5,722 5,637
Goodwill 5,063 3,928
Deferred income taxes 4,001 3,744
Other assets 8,911 8,601
TOTAL ASSETS 212,342$ 203,866$
LIABILITIES AND SHAREHOLDERS' EQUITY
Notes payable to banks 2,750$ 4,076$
Current portion of long-term debt 1,630 1,949
Trade accounts payable 19,553 15,178
Accrued compensation and amounts withheld from employees 9,150 6,995
Accrued expenses and other liabilities 7,672 6,829
Accrued profit-sharing and other benefits 2,493 3,577
Dividends payable 1,043 1,076
Income taxes payable 1,161 772
Current liabilities of discontinued operations - 1,897
TOTAL CURRENT LIABILITIES 45,452 42,349
Long-term debt, less current portion 3,200 3,010
Unfunded pension obligation 3,035 2,787
Income taxes payable, noncurrent 1,974 1,837
Deferred income taxes 1,407 1,486
Other noncurrent liabilities 2,018 1,772
Minority interests 1,255 904
SHAREHOLDERS' EQUITY
Common stock - $2 par value, 15,000,000 shares authorized,
5,214,830 and 5,380,956 issued and outstanding, net of 551,059
and 378,333 treasury shares at par, respectively 10,430 10,762
Paid in capital 3,012 2,720
Retained earnings 139,547 140,339
Accumulated other comprehensive income (loss) 1,012 (4,100)
TOTAL SHAREHOLDERS' EQUITY 154,001 149,721
TOTAL LIABILITIES AND SHAREHOLDERS' EQUITY 212,342$ 203,866$
See notes to consolidated financial statements.

4
PREFORMED LINE PRODUCTS COMPANY STATEMENTS OF CONSOLIDATED INCOME
(UNAUDITED)
2008 2007 2008 2007
In thousands, except per share data (restated) (restated)
Net sales 75,362$ 58,072$ 135,227$ 110,051$
Cost of products sold 51,685 38,358 92,545 72,768
GROSS PROFIT 23,677 19,714 42,682 37,283
Costs and expenses
Selling 6,186 5,861 11,760 11,054
General and administrative 7,691 6,168 15,047 11,652
Research and engineering 2,338 1,783 4,327 3,455
Other operating expenses - net 233 124 143 310
Goodwill impairment - - - 199
16,448 13,936 31,277 26,670
OPERATING INCOME 7,229 5,778 11,405 10,613
Other income (expense)
Interest income 216 254 430 541
Interest expense (138) (132) (277) (297)
Other income (expense) 22 (7) 20 (13)
100 115 173 231
INCOME BEFORE INCOME TAXES, MINORITY
INTERESTS AND DISCONTINUED OPERATIONS 7,329 5,893 11,578 10,844
Income taxes 2,382 2,509 3,797 4,175
INCOME BEFORE MINORITY INTERESTS
AND DISCONTINUED OPERATIONS 4,947 3,384 7,781 6,669
Minority interests, net of tax (78) - (111) -
INCOME FROM CONTINUING OPERATIONS 4,869 3,384 7,670 6,669
Income from discontinued operations, net of tax 620 180 769 47
NET INCOME 5,489$ 3,564$ 8,439$ 6,716$
Income per share from continuing operations - basic 0.92$ 0.63$ 1.44$ 1.25$
Income per share from discontinued operations - basic 0.12$ 0.04$ 0.14$ 0.01$
Total net income per share - basic 1.04$ 0.67$ 1.58$ 1.26$
Income per share from continuing operations - diluted 0.91$ 0.63$ 1.43$ 1.23$
Income per share from discontinued operations - diluted 0.12$ 0.03$ 0.14$ 0.01$
Total net income per share - diluted 1.03$ 0.66$ 1.57$ 1.24$
Cash dividends declared per share 0.20$ 0.20$ 0.40$ 0.40$
Weighted-average number of shares outstanding - basic 5,296 5,369 5,339 5,364
Weighted-average number of shares outstanding - diluted 5,345 5,421 5,387 5,408
See notes to consolidated financial statements.
Six month periods ended June 30,Three month periods ended June 30,

5
PREFORMED LINE PRODUCTS COMPANY STATEMENTS OF CONSOLIDATED CASH FLOWS
(UNAUDITED)
2008 2007
Thousands of dollars (restated)
OPERATING ACTIVTIES
Net income 8,439$ 6,716$
Less: income from discontinued operations 769 47
Income from continuing operations 7,670 6,669
Adjustments to reconcile net income to net cash provided by operations:
Depreciation and amortization 3,983 3,410
Provision for accounts receivable allowances 248 938
Provision for inventory reserves 735 646
Deferred income taxes (330) 117
Stock-based compensation expense 88 128
Excess tax benefits from stock-based awards (16) (193)
Goodwill impairment - 199
Net investment in life insurance (196) 145
Other - net 184 65
Changes in operating assets and liabilities, net of business acquisitions:
Accounts receivable (11,113) (10,610)
Inventories 35 (5,506)
Trade accounts payables and accrued liabilities 4,950 5,768
Income taxes payable 1,175 1,447
Other - net (1,256) (553)
NET CASH PROVIDED BY OPERATING ACTIVITIES 6,157 2,670
INVESTING ACTIVITIES
Capital expenditures (6,256) (4,121)
Business acquisitions - net of cash acquired (237) (2,550)
Proceeds from the sale of discontinued operations 11,783 -
Proceeds from the sale of property and equipment 185 93
NET CASH PROVIDED BY (USED IN) INVESTING ACTIVITIES 5,475 (6,578)
FINANCING ACTIVITIES
Decrease in notes payable to banks (987) (166)
Proceeds from the issuance of long-term debt 3,600 -
Payments of long-term debt (4,330) (1,132)
Dividends paid - net (2,152) (1,893)
Excess tax benefits from stock-based awards 16 193
Proceeds from issuance of common shares 201 487
Purchase of common shares for treasury (7,457) (328)
NET CASH USED IN FINANCING ACTIVITIES (11,109) (2,839)
Effects of exchange rate changes on cash and cash equivalents 54 272
Net increase (decrease) in cash and cash equivalents 577 (6,475)
NET CASH (USED IN) PROVIDED BY DISCONTINUED OPERATIONS
Operating cash flows 958 544
Investing cash flows (1,596) (239)
Financing cash flows - (250)
NET CASH (USED IN) PROVIDED BY DISCONTINUED OPERATIONS (638) 55
Cash and cash equivalents at beginning of year 23,392 29,949
CASH AND CASH EQUIVALENTS AT END OF PERIOD 23,331$ 23,529$
See notes to consolidated financial statements.
Six Month Periods Ended June 30,

6
PREFORMED LINE PRODUCTS COMPANY
NOTES TO CONSOLIDATED FINANCIAL STATEMENTS
(UNAUDITED)
In thousands, except share and per share data
NOTE A – BASIS OF PRESENTATION The accompanying unaudited consolidated financial statements of Preformed Line Products Company (the Company) have been prepared in accordance with accounting principles generally accepted in the United States of America for interim financial information and with the instructions to Form 10-Q and Article 10 of Regulation S-X. The preparation of these consolidated financial statements requires management to make estimates and assumptions that affect the amounts reported in the financial statements and the accompanying notes. Actual results could differ from these estimates. However, in the opinion of management, these consolidated financial statements contain all estimates and adjustments, consisting of normal recurring accruals, required to fairly present the financial position, results of operations, and cash flows for the interim periods. Operating results for the three and six month periods ended June 30, 2008 are not necessarily indicative of the results to be expected for the year ending December 31, 2008. The consolidated balance sheet at December 31, 2007 has been derived from the audited consolidated financial statements, but does not include all of the information and notes required by U.S. generally accepted accounting principles for complete financial statements. For further information, refer to the consolidated financial statements and notes to consolidated financial statements included in the Company’s 2007 Annual Report on Form 10-K filed on April 7, 2008 with the Securities and Exchange Commission. Reclassifications
Certain prior period amounts have been reclassified to conform to current year presentation.
Restatement
Subsequent to the issuance of the consolidated financial statements for the three and six month periods ended June 30, 2007, the Company determined that (a) the write-off of goodwill related to its Thailand operations of $.2 million should have been recorded during the first quarter of 2007, (b) the $.2 million charge related to the step-up in inventory valuation in the purchase price allocation for the acquisition of Direct Power and Water Corporation (DPW) on March 22, 2007 should have been recorded during the second quarter of 2007, and (c) intercompany profit of $.8 million in inventory at June 30, 2007 should not have been recognized in earnings until the inventory was sold to a third party. The $.8 million adjustment consisted of $.6 million of profit in inventory remaining at the end of the first quarter and $.2 million of profit in inventory remaining at the end of the second quarter. As a result, the Company has restated the accompanying consolidated financial statements for the three and six month periods ended June 30, 2007.

7
The effect of the restatement is as follows:
Three month periods Six month periods
ended June 30, 2007 ended June 30, 2007
Cost of products sold 42,691$ 80,314$
Gross profit 21,062 39,970
Goodwill impairment - -
Operating income 6,494 11,872
Income before income tax 6,624 12,136
Income tax 2,808 4,602
Net income 3,816 7,534
Net income per share - basic 0.71$ 1.40$
Net income per share - diluted 0.70$ 1.39$
Operating Cash Flows:
Net income 7,534$
Goodwill impairment -
Inventories (5,628)
Income Taxes 1,458
As previously reported
As restated
Three month periods Six month periods
ended June 30, 2007 ended June 30, 2007
Cost of products sold 43,090$ 81,293$
Gross profit 20,663 38,991
Goodwill impairment - 199
Operating income 6,095 10,694
Income before income tax 6,225 10,958
Income tax 2,661 4,242
Net income 3,564 6,716
Net income per share - basic 0.67$ 1.26$
Net income per share - diluted 0.66$ 1.24$
Operating Cash Flows:
Net income 6,716$
Goodwill impairment 199
Inventories (4,847)
Income Taxes 1,171
Certain of the restated amounts above do not agree with the statements of consolidated income due to the sale of discontinued operations in May 2008, as discussed in Note L – Discontinued Operations.

8
NOTE B – OTHER FINANCIAL STATEMENT INFORMATION Inventories - net
June 30, December 31,
2008 2007
Finished products 21,680$ 20,417$
Work-in-process 3,415 2,363
Raw materials 29,466 29,860
54,561 52,640
Excess of current cost over LIFO cost (4,389) (3,733)
Noncurrent portion of inventory (5,349) (5,119)
44,823$ 43,788$
During the first quarter of 2008, management determined that $.5 million of its current inventory balance should have been classified as noncurrent at December 31, 2007. In addition to this reclassification from current to noncurrent, management also identified and corrected the classification of certain inventory balances between the categories of inventory at December 31, 2007. Although, management determined that these adjustments were not material, quantitatively or qualitatively, to the consolidated balance sheet at December 31, 2007, the reclassifications are included in the December 31, 2007 column in the above table. Noncurrent inventory is included in other assets on the consolidated balance sheets. Property and equipment - net
Major classes of property and equipment are stated at cost and were as follows:
June 30, December 31,
2008 2007
Land and improvements 6,259$ 6,223$
Buildings and improvements 49,017 44,537
Machinery and equipment 97,180 91,376
Construction in progress 5,330 6,053
157,786 148,189
Less accumulated depreciation 94,643 89,683
63,143$ 58,506$
Property and equipment includes $.7 million of purchases in trade accounts payable at June 30, 2008 and $.8 million at December 31, 2007. Comprehensive income
The components of comprehensive income are as follows:
2008 2007 2008 2007
Net income 5,489$ 3,564$ 8,439$ 6,716$
Other comprehensive income:
Foreign currency translation adjustments 3,200 2,322 5,104 3,075
Recognized net actuarial loss 4 - 8 -
Comprehensive income 8,693$ 5,886$ 13,551$ 9,791$
Six month periods ended June 30,Three month periods ended June 30,

9
Legal proceedings
From time to time, the Company may be subject to litigation incidental to its business. The Company is not a party to any pending legal proceedings that the Company believes would, individually or in the aggregate, have a material adverse effect on its financial condition, results of operations, or cash flows. NOTE C – PENSION PLANS PLP-USA hourly employees of the Company who meet specific requirements as to age and service are covered by a defined benefit pension plan. The Company uses a December 31 measurement date for this plan. Net periodic benefit cost for the Company's PLP-USA plan included the following components:
2008 2007 2008 2007
Service cost 167$ 177$ 335$ 354$
Interest cost 256 234 512 469
Expected return on plan assets (261) (234) (522) (469)
Recognized net actuarial loss 6 26 12 52
Net periodic benefit cost 168$ 203$ 337$ 406$
Three month periods ended June 30, Six month periods ended June 30,
During the six month period ended June 30, 2008, $.1 million of contributions have been made to the plan. The Company presently anticipates contributing an additional $.1 million to fund its pension plan in 2008 for a total of $.2 million. NOTE D – COMPUTATION OF EARNINGS PER SHARE Earnings per share amounts for each period are presented in accordance with Statement of Financial Accounting Standards (SFAS) No. 128, “Earnings Per Share,” which requires the presentation of basic and diluted earnings per share. Basic earnings per share were computed by dividing net income by the weighted-average number of shares of common stock outstanding for each respective period. Diluted earnings per share were calculated by dividing net income by the weighted-average of all potentially dilutive shares of common stock that were outstanding during the periods presented. Actual weighted-average shares of common stock outstanding used in the calculation of basic and diluted earnings per share for the three and six month periods ended June 30, 2008 and 2007 were as follows:

10
2008 2007 2008 2007
Numerator
Income from continuing operations 4,869$ 3,384$ 7,670$ 6,669$
Income from discontinued operations 620 180 769 47
Net income 5,489$ 3,564$ 8,439$ 6,716$
Denominator
Determination of shares
Weighted-average common shares outstanding 5,296 5,369 5,339 5,364
Dilutive effect - employee stock options 49 52 48 44
Diluted weighted-average common shares outstanding 5,345 5,421 5,387 5,408
Earnings per common share
Basic
Income from continuing operations 0.92$ 0.63$ 1.44$ 1.25$
Income from discontinued operations 0.12$ 0.04$ 0.14$ 0.01$
Total net income 1.04$ 0.67$ 1.58$ 1.26$
Diluted
Income from continuing operations 0.91$ 0.63$ 1.43$ 1.23$
Income from discontinued operations 0.12$ 0.03$ 0.14$ 0.01$
Total net income 1.03$ 0.66$ 1.57$ 1.24$
Three month periods ended June 30, Six month periods ended June 30,
For the three and six month periods ended June 30, 2008, 13,000 stock options were excluded from the calculation of diluted earnings per share due to the average market price being lower than the exercise price, and as such they are anti-dilutive. For the six month period ended June 30, 2007, 16,000 stock options were excluded from the calculation of diluted earnings per share due to the average market price being lower than the exercise price, and as such they are anti-dilutive. For the three month period ended June 30, 2007, no stock options were anti-dilutive. NOTE E – GOODWILL AND OTHER INTANGIBLES The Company performed its annual impairment test for goodwill pursuant to SFAS No. 142, “Goodwill and Intangible Assets” as of January 1, 2008, and determined that no adjustment to the carrying value of goodwill was required. The aggregate amortization expense for other intangibles with finite lives for each of the three and six month periods ended June 30, 2008 was $.1 million and $.3 million, respectively, and for the three and six month periods ended June 30, 2007 was $.1 million and $.2 million, respectively. Amortization expense is estimated to be $.5 million annually for 2008 through 2012. The Company’s addition of $1 million to goodwill is related to the acquisition of DPW in the amount of $.5 million and the joint venture formed between the Company’s Australian subsidiary and BlueSky Energy Pty Ltd in the amount of $.5 million (see Note K - Business Combinations for further details). The changes in the carrying amount of goodwill, by segment, for the six month period ended June 30, 2008, are as follows:
Australia South Africa All Other Total
Balance at January 1, 2008 1,782$ 57$ 2,089$ 3,928$
Additions 485 - 466 951
Curency translation 168 (8) 24 184
Balance at June 30, 2008 2,435$ 49$ 2,579$ 5,063$
The Company’s patents and other intangibles consist of:

11
Gross Carrying Accumulated Gross Carrying Accumulated
Amount Amortization Amount Amortization
Finite-lived intangible assets
Patents 4,813$ (2,742)$ 4,812$ (2,585)$
Land use rights 1,418 (21) 1,259 (8)
Customer relationships 991 (266) 985 (154)
7,222$ (3,029)$ 7,056$ (2,747)$
Indefinite-lived intangible assets
Trademarks 1,529$ 1,328$
Goodwill 5,063 3,928
6,592$ 5,256$
June 30, 2008 December 31, 2007
NOTE F – STOCK OPTIONS
The 1999 Stock Option Plan (the Plan) permits the grant of 300,000 options to buy common shares of the Company to certain employees at not less than fair market value of the shares on the date of grant. At June 30, 2008 there were 9,000 options remaining available for issuance under the Plan. Options issued to date under the Plan vest 50% after one year following the date of the grant, 75% after two years, and 100% after three years, and expire ten years from the date of grant. Shares issued as a result of stock option exercises will be funded with the issuance of new shares. The Company’s shareholders approved the Preformed Line Products Company Long Term Incentive Plan of 2008 at the 2008 Annual Meeting of Shareholders. Under the Preformed Line Products Company Long Term Incentive Plan of 2008, certain employees, officers, and directors will be eligible to receive awards of options and restricted shares. The total number of company common shares reserved and available for awards under the Plan is 400,000. As of June 30, 2008, no options or restricted shares have been granted under the plan. There were 13,000 options granted during the six month period ended June 30, 2008 and 15,000 options granted during the six month period ended June 30, 2007 under the Plan. The fair value for the stock options granted in 2008 and 2007 were estimated at the date of grant using the Black-Scholes option-pricing model with the following weighted-average assumptions:
2008 2007
Risk-free interest rate 4.2% 4.3%
Dividend yield 2.8% 3.1%
Expected life (years) 6 6
Expected volatility 34.4% 40.7%

12
Activity in the Company’s stock option plan for the six month period ended June 30, 2008 was as follows:
Number of
Shares
Weighted -
Average
Exercise Price
per Share
Weighted -
Average
Remaining
Contractual
Term (Years)
Aggregate
Intrinsic
Value
Outstanding at January 1, 2008 110,942 25.34$
Granted 13,000 51.62$
Exercised (6,600) 31.38$
Forfeited - -
Outstanding (vested and expected
to vest) at June 30, 2008 117,342 27.91$ 6.5 1,611$
Exercisable at June 30, 2008 89,842 23.02$ 4.8 1,560$
The weighted–average grant-date fair value of options granted during 2008 and 2007 was $15.52 and $11.51, respectively. The total intrinsic value of stock options exercised during the six month periods ended June 30, 2008 and 2007 was $.1 million and $.7 million, respectively. Cash received for the exercise of stock options during 2008 was $.2 million. The total fair value of stock options vested during the six month periods ended June 30, 2008 and 2007 was $.1 million. For the six month periods ended June 30, 2008 and 2007, the Company recorded compensation expense related to the stock options of $.1 million for each period. The total compensation cost related to nonvested awards not yet recognized at June 30, 2008 is expected to be $.3 million over principally one year. The excess tax benefits from stock-based awards for the six month period ended June 30, 2008 was less than $.1 million and represents the reduction in income taxes otherwise payable during the period, attributable to actual gross tax benefits in excess of the expected tax benefits for options exercised in the current period. NOTE G – FAIR VALUE OF FINANCIAL ASSETS AND LIABILITIES In September 2006, the Financial Accounting Standards Board (FASB) issued Statement of Financial Accounting Standards No. 157, “Fair Value Measurements” (SFAS 157). This standard defines fair value, establishes a framework for measuring fair value in generally accepted accounting principles and expands disclosures about fair value measurements. This standard does not require new fair value measurements; however, the application of this standard may change current practice for an entity. This standard was effective for financial statements issued for fiscal years beginning after November 15, 2007 and interim periods within those fiscal periods. This standard enables the reader of the financial statements to assess the inputs used to develop those measurements by establishing a hierarchy for ranking the quality and reliability of the information used to determine fair values. The standard requires that assets and liabilities carried at fair value to be classified and disclosed in one of the following three categories: Level 1: Quoted market prices in active markets for identical assets or liabilities; Level 2: Observable market based inputs or unobservable inputs that are corroborated by market data; or Level 3: Unobservable inputs that are not corroborated by market data. In February 2008, the FASB issued FAS No. 157-1, “Application of FASB Statement No. 157 to FASB Statement No. 13 and Other Accounting Pronouncements that Address Fair Value Measurements for Purposes of Lease Classification or Measurement under Statement 13” (FSP 157-1). This FSP 157-1 amends SFAS No. 157, Fair Value Measurements, to exclude FASB Statement No. 13, “Accounting for Leases, and other accounting pronouncements that address fair value measurements for purposes of lease classification or measurement under Statement 13.” This FSP was effective upon the initial adoption of SFAS No. 157. In February 2008, the FASB issued FASB Staff Position No. 157-2 , “Effective Date of FASB Statement No. 157” (FSP 157-2), which delays the effective date of SFAS 157 for all nonrecurring fair value measurements of nonfinancial assets and nonfinancial liabilities until fiscal years beginning after November 15, 2008. FSP 157-2 states that a measurement is recurring if it happens at least annually and defines nonfinancial assets and nonfinancial liabilities as all assets and liabilities

13
other than those meeting the definition of a financial asset or financial liability in SFAS No. 159, “The Fair Value Option for Financial Assets and Financial Liabilities Including an Amendment to FAS No. 115” (SFAS 159). The Company adopted this standard as of January 1, 2008 as it relates to financial assets and financial liabilities and its adoption did not have an impact on its consolidated financial statements. The Company is currently evaluating the impact that the adoption of SFAS 157, as it relates to nonfinancial assets and liabilities, will have on its consolidated financial results. In February 2007, the FASB issued SFAS 159. This standard permits entities to measure certain financial instruments and certain other items at fair value. The fair value option established by this standard permits all entities to choose to measure eligible items at fair value at specified election dates. A business entity shall report unrealized gains and losses on items for which the fair values option has been elected at each subsequent reporting period. The fair value option election is irrevocable, unless a new election date occurs. SFAS 159 establishes presentation and disclosure requirements to help financial statement users understand the effect of the entity’s election on earnings, but does not eliminate disclosure requirements of other accounting standards. This standard is effective as of the beginning of the first fiscal year that begins after November 15, 2007. The Company adopted this standard on January 1, 2008 and did not elect to measure any additional financial instruments or other items at fair value. NOTE H – RECENTLY ISSUED ACCOUNTING PRONOUNCEMENTS In May 2008, the FASB issued SFAS No. 162, "The Hierarchy of Generally Accepted Accounting Principles" (SFAS 162). SFAS 162 identifies the sources of accounting principles and the framework for selecting the principles used in the preparation of financial statements. SFAS 162 will be effective 60 days following the Securities and Exchange Commission's approval of the Public Company Accounting Oversight Board amendments to AU Section 411, "The Meaning of Present Fairly in Conformity with Generally Accepted Accounting Principles." The Company does not expect the adoption of this standard to have an impact on its financial position, results of operations, or cash flows. In March 2008, the FASB issued FASB Statement 161, “Disclosures about Derivative Instruments and Hedging Activities” (SFAS 161). SFAS 161 requires companies with derivative instruments to disclose information on how derivative instruments and related hedged items are accounted for under FASB No. 133, “Accounting for Derivative Instruments and Hedging Activities, and how derivative instruments and related hedged items affect a Company's financial position, financial performance and cash flows.” SFAS 161 is effective for financial statements issued for fiscal years and interim periods beginning after November 15, 2008. The Company is currently evaluating the potential impact, if any, of the adoption of SFAS 161 on our consolidated financial statements. In December 2007, the FASB issued SFAS No. 160, “Noncontrolling Interests in Consolidated Financial Statements an amendment of ARB No. 51” (SFAS 160). This standard amends ARB No. 51 to establish accounting and reporting for the noncontrolling interest in a subsidiary and for deconsolidation of a subsidiary. It also amends certain of ARB No. 51’s consolidation procedures for consistency with the requirements of FASB Statement No. 141 (revised 2007), "Business Combinations." This standard is effective for financial statements issued for fiscal years, and interim periods within those fiscal years, beginning on or after December 15, 2008. In December 2007, the FASB issued SFAS No. 141R, “Business Combinations” (SFAS 141R). SFAS 141R revises the principles and requirements for how the acquirer recognizes and measures in its financial statements the identifiable assets acquired, the liabilities assumed, any noncontrolling interest in the acquiree, and the goodwill acquired in a business combination or gain from a bargain purchase. SFAS 141R also revises the principles and requirements for how the acquirer determines what information to disclose to enable users of the financial statements to evaluate the nature and financial effects of the business combination. This pronouncement is effective as of January 1, 2009. Both standards, SFAS 160 and 141R, will be applied prospectively to future business combinations entered into beginning in 2009. In April 2008, The FASB issued FASB Staff Position No. FAS 142-3, "Determination of the Useful Life of Intangible Assets" (FSP 142-3). FSP 142-3 amends the factors that should be considered in developing renewal or extension assumptions used to determine the useful life of a recognized intangible asset under SFAS No. 142, "Goodwill and Other Intangible Assets" (SFAS 142). The intent of FSP 142-3 is to improve the consistency between the useful life of a recognized intangible asset under SFAS 142 and the period of expected cash flows used to measure the fair value of the asset under SFAS 141R and other U.S. generally accepted accounting principles. This Statement applies prospectively to

14
business combinations for which the acquisition date is on or after the beginning of the first annual reporting period beginning December 15, 2008. NOTE I – SEGMENT INFORMATION The following table presents a summary of the Company’s reportable segments for the three and six month periods ended June 30, 2008 and 2007. During the second quarter of 2008, the Company sold its Superior Modular Products (SMP) segment, therefore the Company has reevaluated its reportable segments. Accordingly, the Company has added Belos, as a reportable segment, which is comprised of the Company’s operation in Poland producing and selling the Company’s energy products. Current year and prior year amounts have been restated to reflect the seven reportable segments. Financial results for the PLP-USA segment include the elimination of all segments’ intercompany profit in inventory.
2008 2007 2008 2007
Net sales
PLP-USA 30,697$ 26,517$ 55,704$ 54,006$
Australia 7,783 7,270 14,688 13,765
Brazil 9,884 6,821 15,939 11,342
South Africa 2,536 1,770 4,137 3,270
Canada 2,706 2,648 5,072 4,939
Poland 5,439 - 9,374 -
All Other 16,317 13,046 30,313 22,729
Total net sales 75,362$ 58,072$ 135,227$ 110,051$
Intersegment sales
PLP-USA 2,006$ 1,403$ 4,250$ 3,064$
Australia 374 68 629 113
Brazil 217 352 331 927
South Africa 39 294 59 432
Canada 546 21 1,227 39
Poland 43 - 215 -
All Other 1,653 2,963 3,598 4,748
Total intersegment sales 4,878$ 5,101$ 10,309$ 9,323$
Income from continuing operations
PLP-USA 1,471$ 1,457$ 2,349$ 2,885$
Australia 145 265 233 598
Brazil 456 361 576 845
South Africa 591 318 914 623
Canada 540 359 841 680
Poland 438 - 605 -
All Other 1,228 624 2,152 1,038
Total income from continuing operations 4,869$ 3,384$ 7,670$ 6,669$
Income from discontinued operations, net of tax 620 180 769 47
Net income 5,489$ 3,564$ 8,439$ 6,716$
Three month periods ended June 30, Six month periods ended June 30,

15
June 30, December 31,
2008 2007
Identifiable assets
PLP-USA 74,269$ 70,535$
Australia 27,474 25,122
Brazil 21,575 18,022
South Africa 5,640 4,901
Canada 9,146 8,672
Poland 16,422 13,238
All Other 57,816 51,188
Discontinued operations - 12,188
Total identifiable assets 212,342$ 203,866$
NOTE J – INCOME TAXES The Company’s effective tax rate was 33% and 43% for the three month periods ended June 30, 2008 and 2007, respectively, and 33% and 39% for six month periods ended June 30, 2008 and 2007, respectively. The lower effective tax rate for both periods ending June 30, 2008 is primarily due to increased earnings in foreign jurisdictions with lower tax rates. The Company provides valuation allowances against deferred tax assets when it is more likely than not that some portion, or all of its deferred tax assets will not be realized. As of January 1, 2008, the Company had gross unrecognized tax positions including the accrual of interest of approximately $1.8 million. Under the provisions of FASB Interpretation No. 48, “Accounting for Uncertainty in Income Taxes” the Company believes that it is reasonably possible that it may decrease the unrecognized tax benefits by approximately $.6 million within the next twelve months due to the expiration of statues of limitations. NOTE K – BUSINESS COMBINATIONS On March 22, 2007, the Company acquired all of the issued and outstanding shares of DPW for $3 million, subject to a holdback of $.4 million. DPW is a New Mexico company that designs and installs solar systems and manufactures mounting hardware, battery, and equipment enclosures. The holdback of $.4 million is held as security for the sellers indemnity obligations. Depending on the post-closing performance of DPW, earn outs may be paid to the sellers for each of the three years following the closing date of acquisition. The Company estimates that an earn out payment of $.4 million will be required and has recorded such amount as a liability in the purchase price allocation. The Company’s consolidated balance sheets reflects the acquisition of DPW under the purchase method of accounting. The following table summarizes the estimated fair values of the assets acquired and liabilities assumed at the date of acquisition. The purchase price allocation has been finalized.
Current assets 1,474$
Property and equipment 289
Goodwill 1,756
Other intangibles 944
Total assets acquired 4,463
Current liabilities (1,045)
Deferred income taxes (418)
Total liabilites assumed (1,463)
Net assets acquired 3,000$

16
On September 6, 2007, the Company acquired approximately 83.74% of the issued and outstanding shares of Belos SA (Belos) for $6 million. Belos is a Polish company that manufactures and supplies fittings for low, medium, and high voltage power networks in its domestic and export markets. Depending on the post-closing performance of Belos, certain contingent consideration may be paid in the year following the closing. The Company’s consolidated balance sheets reflect the acquisition of Belos under the purchase method of accounting. As part of the allocation of the purchase price to the fair value of the assets acquired and liabilities assumed, the Company recorded a current liability of $1 million related to contingent consideration. Since the fair values assigned to assets acquired and liabilities assumed exceeded the cost of the acquired business including the contingent consideration, the Company allocated the excess as a pro rata reduction to the amounts that otherwise would have been assigned to the acquired property and equipment and other intangibles. The following table summarizes the assigned fair values of the assets acquired and liabilities assumed at the date of acquisition. The purchase price allocation is preliminary.
Current assets 6,088$
Property and equipment 3,939
Other intangibles 1,917
Other assets 437
Total assets acquired 12,381
Current liabilities (2,744)
Long term debt, less current portion (112)
Other non-current liabilities and deferred taxes (1,675)
Minority interest (850)
Total liabilites assumed (5,381)
Net assets acquired 7,000$
Of the $1.9 million of acquired intangibles, $1.1 million was assigned to registered trademarks that are not subject to amortization. The remaining $.8 million of acquired intangibles consists of land use rights of $.7 million with a useful life of 82.25 years. On May 21, 2008, the Company entered into a Joint Venture Agreement for $.3 million to form a joint venture between the Company’s Australian subsidiary, Preformed Line Products Australia Pty Ltd (PLP-AU) and BlueSky Energy Pty Ltd, a solar systems integration and installation business based in Sydney, Australia. PLP-AU holds a 50% ownership interest in the new joint venture company, which will operate under the name BlueSky Energy Australia (BlueSky), with the option to acquire the remaining 50% ownership interest from BlueSky Energy Pty Ltd over the next five years. BlueSky Energy Pty Ltd has transferred technology and assets to the joint venture. The Company’s consolidated balance sheet as of June 30, 2008 reflects the investment in the joint venture under the purchase method of accounting. The allocation of the purchase price has not yet been finalized as the valuation of intangibles has not been completed. NOTE L – DISCONTINUED OPERATIONS On May 30, 2008, the Company sold its’ SMP subsidiary for $11.8 million and recognized a $.5 million gain, net of tax, which includes expenses incurred related to the disposition of SMP, subject to the finalization of working capital adjustments and a holdback of $1.5 million to be held in escrow for a period of one year. The Company does not provide any significant continuing involvement in the operations of SMP. The sale of SMP has been accounted for in accordance with SFAS No. 144, “Accounting for the Impairment or Disposal of Long- Lived Assets.” Accordingly, operating results of SMP are presented in the Company’s consolidated statements of operations as discontinued operations, net of tax, and all periods presented have been reclassified. The operation had been reported within the SMP reporting segment, which is comprised of the U.S. operations supporting the Company’s data communication products. The operating results of the business unit for the three and six month periods ended June 30, 2008, are as follows:

17
2008 2007 2008 2007
Net Sales 3,470$ 5,681$ 8,308$ 10,233$
Income before income taxes 196 332 456 114
Provision for income taxes (71) (152) (182) (67)
Gain on sale, net of tax 495 - 495 -
Income from discontinued operations 620$ 180$ 769$ 47$
Three month periods ended June 30, Six month periods ended June 30,
ITEM 2. MANAGEMENT’S DISCUSSION AND ANALYSIS OF FINANCIAL CONDITION AND RESULTS
OF OPERATIONS
Restatement of second quarter 2007
Subsequent to the issuance of the consolidated financial statements for the three and six month periods ended June 30, 2007, the Company determined that (a) the write-off of goodwill related to its Thailand operations of $.2 million should have been recorded during the first quarter of 2007, (b) the $.2 million charge related to the step-up in inventory valuation in the purchase price allocation for the acquisition of Direct Power and Water Corporation (DPW) on March 22, 2007 should have been recorded during the second quarter of 2007, and (c) intercompany profit of $.8 million in inventory at June 30, 2007 should not have been recognized in earnings until the inventory was sold to a third party. The $.8 million adjustment consisted of $.6 million of profit in inventory remaining at the end of the first quarter and $.2 million of profit in inventory remaining at the end of the second quarter. As a result, the Company has restated the accompanying consolidated financial statements for the three and six month periods ended June 30, 2007. OVERVIEW The Company is an international designer and manufacturer of products and systems employed in the construction and maintenance of overhead and underground networks for the energy, telecommunication, cable operators, information (data communication), and other similar industries. Our primary products support, protect, connect, terminate, and secure cables and wires. We also provide solar hardware systems and mounting hardware for a variety of solar power applications. Our goal is to continue to achieve profitable growth as a leader in the innovation, development, manufacture, and marketing of technically advanced products and services related to energy, communications, cable systems, and solar, and to take advantage of this leadership position to sell additional quality products in familiar markets. The reportable segments are PLP-USA, Australia, Brazil, South Africa, Canada, Belos SA (Belos), and All Other. Our PLP-USA segment is comprised of our U.S. operations primarily supporting our domestic energy and telecommunications products. The Australia segment is comprised of all of our operations in Australia supporting energy, telecommunications and data communications products. Our Brazil, South Africa, and Canada segments are comprised of the manufacturing and sales operations from those locations which meet at least one of the criteria of a reportable segment. The Belos segment is comprised of a manufacturing and sales operation in Poland, and has been included as a segment to comply with reporting segments for 75% of consolidated sales. Our remaining operations are included in All Other as none of these operations meet the criteria for a reportable segment and individually represent less that 10% for each of our consolidated net sales, net income, and assets. DISCONTINUED OPERATION Our consolidated financial statements were impacted by the divestiture of Superior Modular Products subsidiary (SMP) on May 30, 2008. We received from a third party $11.8 million of net proceeds from the sale of SMP and recognized a $.5 million gain, net of tax, on the sale of the business, which includes expenses incurred related to the disposition of SMP, and a holdback of $1.5 million to be held in escrow for a period of one year. We will not provide any significant continuing involvement in the operations of SMP after the closing of the sale. For tax purposes, the sale of SMP generated a capital loss, which was not deductible except for amounts used to offset capital gains in the current year and from a preceding year. A full valuation allowance was provided against the deferred tax asset on the remaining portion of the capital loss.

18
The operating results of SMP are presented in our consolidated statements of operations as discontinued operations, net of tax, and all periods presented have been reclassified. For the three month period ended June 30, 2008, income from discontinued operations was $.6 million, or $.12 per diluted share, compared to $.2 million, or $.03 per diluted share, for the same period in 2007. Income from discontinued operations for the six month period ended June 30, 2008 was $.8 million, or $.14 per diluted share, compared to income of less than $.1 million, or $.01 per diluted share, for the same period in 2007. Preface
Our net sales for the three month period ended June 30, 2008 increased $17.3 million, or 30%, and gross profit increased $4 million, or 20%, compared to the same period in 2007. Our net sales in the three month period ended June 30, 2008 increased $5.4 million as the result of the acquisition of Belos in the third quarter of 2007. The favorable impact of the change in the conversion rate of local currencies to U.S. dollars for the three months ended June 30, 2008 compared to the same period in 2007 contributed $3.6 million to the increase in net sales. Additionally, PLP-USA net sales increased $4.2 million for the three months ended June 30, 2008 compared to the same period in 2007. Gross profit for the three months ended June 30, 2008 increased $4 million, or 20%, primarily as a result of increased sales but was partially offset by a $2.5 million, or 18%, increase in costs and expenses when compared to the same period in 2007. As a result, income from continuing operations of $4.9 million, or $.91 per diluted share, increased $1.5 million, or $.29 per diluted share, compared to the three months ended June 30 2007. Our net sales for the six month period ended June 30, 2008 increased $25.2 million, or 23%, and gross profit increased $5.4 million, or 14%, compared to the same period in 2007. Our net sales increased $12.8 million as a result of our two acquisitions in 2007, Direct Power and Water Corporation (DPW) and Belos, being reflected in 2008 results with only DPW results reported in the second quarter 2007. The favorable impact of the change in the conversion rate of local currencies to U.S. dollars for the six months ended June 30, 2008 compared to the same period in 2007, contributed $6.6 million to the increase in net sales. Additionally, both PLP-USA and South Africa net sales increased $2.9 million for the six months ended June 30, 2008 compared to the same period in 2007. Gross profit for the six months ended June 30, 2008 increased as a result of increased sales but was partially offset by a $4.6 million, or 17% increase in costs and expenses. As a result income from continuing operations of $7.7 million, or $1.43 per diluted share, increased $1 million, or $.20 per diluted share, compared to the six month period ended June 30, 2007. THREE MONTH PERIODS ENDED JUNE 30, 2008 COMPARED TO THREE MONTH PERIODS ENDED JUNE 30, 2007 Net Sales. For the three month periods ended June 30, 2008, net sales were $75.4 million, an increase of $17.3 million, or 30%, from the same period in 2007 as summarized in the following table:
Change
due to
thousands of dollars currency %
conversion Net Net
2008 2007 Change rate changes change change
Net sales
PLP-USA 30,697$ 26,517$ 4,180$ -$ 4,180$ 16 %
Australia 7,783 7,270 513 929 (416) (6)
Brazil 9,884 6,821 3,063 1,633 1,430 21
South Africa 2,536 1,770 766 (242) 1,008 57
Canada 2,706 2,648 58 212 (154) (6)
Poland 5,439 - 5,439 - 5,439 100
All Other 16,317 13,046 3,271 1,033 2,238 17
Consolidated 75,362$ 58,072$ 17,290$ 3,565$ 13,725$ 24 %
Three month periods ended June 30,

19
The increase in PLP-USA net sales of $4.2 million, or 16%, was due primarily to price/mix increases of $2.4 million and sales volume increases of $1.8 million. We anticipate a slight increase in sales for the remainder of 2008, although we believe PLP-USA sales for the year will continue to be impacted by the slowing economy and housing market. Excluding the effect of currency conversion, Australia net sales decreased $.4 million, or 6%, primarily as a result of lower data communication sales compared to the same period in 2007. Excluding the effect of currency conversion, Brazil net sales increased $1.4 million, or 21%, primarily as a result of increased volume in sales to the energy market. South Africa net sales increased $1 million, excluding the effect of currency conversion, or 57%, due to increased sales volume in the energy market. Canada net sales remained constant as a result of the favorable effect of currency conversion offset by a slight decrease in sales volume. Belos was acquired effectively in the third quarter of 2007. Belos net sales of $5.4 million were included in our consolidated results for the quarter ended June 30, 2008, but not for the same period in 2007. All Other net sales increased $3.3 million, or 25%, compared to 2007 primarily as a result of a $1 million favorable impact of the change in the conversion rate of local currencies to U.S. dollars for the three months ended June 30, 2008 compared to the same periods in 2007 and an increase in energy sales volume. We continue to see competitive pricing pressures globally but believe that our international sales will continue to grow in 2008 but at a slower rate of increase than we experienced in 2007. Gross profit. Gross profit of $23.7 million for the three month periods ended June 30, 2008 increased $4 million, or 20%, compared to the same period in 2007 as summarized in the following table:
Change
due to
thousands of dollars currency %
conversion Net Net
2008 2007 Change rate changes change change
(restated)
Gross profit
PLP-USA 9,584$ 9,396$ 188$ -$ 188$ 2 %
Australia 2,343 2,308 35 281 (246) (11)
Brazil 2,030 1,679 351 335 16 1
South Africa 1,258 817 441 (120) 561 69
Canada 1,271 1,089 182 97 85 8
Poland 1,497 - 1,497 - 1,497 100
All Other 5,694 4,425 1,269 322 947 21
Consolidated 23,677$ 19,714$ 3,963$ 915$ 3,048$ 15 %
Three month periods ended June 30,
PLP-USA gross profit of $9.6 million for the three month period ended June 30, 2008 increased $.2 million, or 2%, compared to the same period in 2007. PLP-USA gross profit increased $1.5 million due to higher net sales partially offset by $1.3 million in increased product costs primarily as a result of higher material costs and per unit manufacturing costs. Australia gross profit remained relatively unchanged as a result of the favorable impact of converting local currency into U.S. dollars compared to the second quarter 2007 conversion rates offset by a decrease in gross profit due to lower net sales. Brazil gross profit increased $.4 million as a result of a $.3 million favorable impact when local currency was converted to U.S. dollars compared to the second quarter 2007 conversion rates. Excluding the effect of currency conversion, South Africa gross profit of $1.3 million increased $.6 million due to increased sales and improved product margins. Excluding the effect of currency conversion, Canada gross profit of $1.3 million increased $.1 million. Our consolidated gross profit increased $1.5 million as a result of the inclusion of Belos gross profit in the three month period ended June 30, 2008. All Other gross profit of $5.7 million increased $1.3 million primarily due to increased sales and a favorable impact due to the change in conversion rates compared to the same period in 2007. We have experienced substantial cost increases for most of our raw material commodities and anticipate additional cost increases for the remainder of the year. As a result, we expect that there will continue to be pressure on maintaining our current product margins. Costs and expenses. Costs and expenses for the three month period ended June 30, 2008 increased $2.5 million, or 18%, compared to the same period in 2007 as summarized in the following table:

20
Change
due to
thousands of dollars currency %
conversion Net Net
2008 2007 Change rate changes change change
Costs and expenses
PLP-USA 8,553$ 7,696$ 857$ -$ 857$ 11 %
Australia 1,755 1,527 228 210 18 1
Brazil 1,261 1,050 211 206 5 -
South Africa 359 309 50 (36) 86 28
Canada 408 416 (8) 32 (40) (10)
Poland 829 - 829 - 829 100
All Other 3,281 2,918 363 192 171 6
Consolidated 16,446$ 13,916$ 2,530$ 604$ 1,926$ 14 %
Three month periods ended June 30,
The increase in PLP-USA costs and expenses of $.9 million was primarily due to a $.2 million increase in commissions on higher sales, a $.5 million increase in personnel related expenses and a $.3 million increase in auditing fees partially offset by a decrease of $.1 million in advertising and promotional expense. South Africa’s increase in costs and expenses was primarily due to increased personnel related costs. Costs and expenses increased by $.8 million due to the inclusion of Belos in our consolidated results for the three month period ended June 30, 2008. All Other costs and expenses increased primarily due to a $.2 million increase in general and administrative expenses. Operating income. Our operating income of $7.2 million for the three month period ended June 30, 2008 increased $1.5 million, or 25%, compared to the same period in 2007 primarily due to a $4 million increase in gross profit partially offset by $2.5 million increase in costs and expenses. PLP-USA operating income of $2.4 million decreased $.4 million, or 16%, primarily due to the $.9 million increase in costs and expenses exceeding the $.2 million increase in gross profit. Australia operating income of $.2 million decreased $.2 million due primarily to an increase in costs and expenses. Brazil operating income of $.7 million for the three month period ended June 30, 2008 increased $.1 million compared to the same period in 2007 as a result of the $.4 million increase in gross profit being partially offset by a $.2 million increase in costs and expenses. South Africa operating income of $.8 million increased $.4 million primarily as a result of the $.6 million increase in gross profit offset by an increase in costs and expenses. Canada operating income of $.7 million increased $.2 million compared to the same period in 2007 primarily as a result of the $.2 million increase in gross profit. Belos operating income of $.7 million was a result of their $1.5 million in gross profit being offset by $.8 million in costs and expenses. All Other operating income of $1.8 million increased $.8 million compared to the same period in 2007 primarily as a result of the $1.3 million increase in gross profit offset by the $.4 million increase in costs and expenses. Income taxes. Income tax expenses from continuing operations for the three month period ended June 30, 2008 of $2.4 million were $.1 million lower than the same period in 2007. The effective tax rate for the three month periods ended June 30, 2008 was 33% compared to 43% in 2007. The effective tax rate for three month periods ended June 30, 2008 is lower than the statutory federal rate of 34% and prior periods rate of 43% primarily due to increased foreign earnings in jurisdictions with lower tax rates. Income from continuing operations. Income from continuing operations for the three month period ended June 30, 2008 was $4.9 million, or $.91 per diluted share, compared to net income of $3.4 million, or $.63 per diluted share, for the same period in 2007. PLP-USA income from continuing operations of $1.5 million remained flat compared to the same period in 2007 primarily as a result of a $.4 million decrease in operating income and a decrease in other income being offset by a reduction in tax expense. Australia income of $.1 million decreased $.1 million compared to the second quarter 2007 primarily due to a $.2 million decrease in operating income being partially offset by lower income taxes. Brazil income of $.5 million increased $.1 million compared to the same period in 2007 as a result of a $.1 million increase in operating income. South Africa income of $.6 million increased $.3 million as a result of a $.4 million increase in operating profit being partially offset by higher income tax expense. Canada income of $.5 million increased $.2 million as a result of the $.2 million increase in operating income. Belos income of $.4 million is a result of $.7 million in operating income being partially offset by other expense, income taxes, and minority interest of $.3 million. All Other income of $1.2 million increased $.6 million primarily as a result of the $.8 million increase in operating income, a $.1 million increase in other

21
income partially offset by a $.3 million increase in income taxes compared to the same period in 2007. SIX MONTH PERIODS ENDED JUNE 30, 2008 COMPARED TO SIX MONTH PERIODS ENDED JUNE 30, 2007 Net Sales. For the six month period ended June 30, 2008, net sales were $135.2 million, an increase of $25.2 million, or 23%, from the same period in 2007 as summarized in the following table:
Change
due to
thousands of dollars currency %
conversion Net Net
2008 2007 Change rate changes change change
Net sales
PLP-USA 55,704$ 54,006$ 1,698$ -$ 1,698$ 3 %
Australia 14,688 13,765 923 1,860 (937) (7)
Brazil 15,939 11,342 4,597 2,699 1,898 17
South Africa 4,137 3,270 867 (352) 1,219 37
Canada 5,072 4,939 133 559 (426) (9)
Poland 9,374 - 9,374 - 9,374 100
All Other 30,313 22,729 7,584 1,857 5,727 25
Consolidated 135,227$ 110,051$ 25,176$ 6,623$ 18,553$ 17 %
Six month periods ended June 30,
PLP-USA net sales increased $1.7 million, or 3%. The increase in PLP-USA net sales is mostly due to price/mix increases related to energy sales for the six month period ended June 30, 2008. This increase in energy sales was partially offset by a decrease in the underground telecommunications market. Excluding the effect of currency conversion, Australia net sales decreased $.9 million, or 7%, primarily due to lower energy sales volume. Excluding the effect of currency conversion, Brazil net sales increased $1.9 million, or 17%, from the same period in 2007. This increase was primarily due to increased volume in the energy and telecommunication markets. Excluding the effect of currency conversion, South Africa net sales increased $1.2 million, or 37%, from the same period in 2007. This increase was primarily due to increased sales volume in the energy market. Excluding the effect of currency conversion, Canada net sales decreased $.4 million as a result of lower communication sales. Belos, as noted above, was acquired effectively in the third quarter of 2007. Belos net sales of $9.4 million were included in our consolidated results for the six month periods ended June 30, 2008, but not for the comparable six month period ended in 2007. Excluding the effect of currency conversion, All Other net sales increased $5.7 million, or 25%, compared to the same period in 2007. This increase was primarily a result of a $2.6 million increase in energy sales compared to the same period in 2007 and the inclusion of DPW sales in our consolidated results for the entire six month period ended June 30, 2008 versus only three months in the six month period ended June 30 2007. Gross profit. Gross profit of $42.7 million for the six month period ended June 30, 2008 increased $5.4 million, or 14%, compared to the same period in 2007 as summarized in the following table:

22
Change
due to
thousands of dollars currency %
conversion Net Net
2008 2007 Change rate changes change change
(restated)
Gross profit
PLP-USA 17,684$ 17,907$ (223)$ - (223)$ (1) %
Australia 4,373 4,421 (48) 553 (601) (14)
Brazil 3,514 3,415 99 596 (497) (15)
South Africa 1,988 1,541 447 (171) 618 40
Canada 2,281 2,072 209 247 (38) (2)
Poland 2,431 - 2,431 - 2,431 100
All Other 10,411 7,927 2,484 628 1,856 23
Consolidated 42,682$ 37,283$ 5,399$ 1,853$ 3,546$ 10 %
Six month periods ended June 30,
PLP-USA gross profit of $17.7 million for the six month period ended June 30, 2008 decreased $.2 million, or 1%, compared to the same period in 2007. PLP-USA gross profit decreased due to higher net sales offset by higher material costs and per unit manufacturing costs. Excluding the effect of currency conversion, Australia gross profit decreased $.6 million as a result of lower net sales and increased manufacturing expense. Brazil gross profit increased $.1 million as a result of a $.6 million favorable impact when local currency was converted to U.S. dollars compared to the second quarter 2007 conversion rates and increased gross profit from sales volume of $.6 million. These gross profit increases were offset by a $.2 million decrease in product margins and an excess and obsolescence reserve adjustment made in the three and six month periods ended June 30, 2007, for $.6 and $.2 million, respectively. During 2007, management’s comprehensive review of the components of our Brazilian operation’s excess and obsolescence reserve calculation revealed that the details of the reserve account included an inappropriate reserve of $.6 million at December 31, 2006. Based on the timing of the completion of certain aspects of this review, we recorded a $.4 million adjustment in the first quarter of 2007 and an additional adjustment of $.2 million in the second quarter of 2007 related to the excess and obsolete reserve at December 31, 2006. Excluding the effect of currency conversion, South Africa gross profit of $2 million increased $.6 million due to increased sales and improved product margins. Excluding the effect of currency conversion, Canada gross profit remained constant. Our consolidated gross profit for the six months ended June 30, 2008 increased $2.4 million as a result of the inclusion of Belos gross profit. Excluding the effect of currency conversion, All Other gross profit increased $1.9 million primarily as a result of increased sales partially offset by increased manufacturing expenses. Costs and expenses. Cost and expenses for the six month period ended June 30, 2008 increased $4.6 million, or 17%, compared to the same period in 2007 as summarized in the following table:
Change
due to
thousands of dollars currency %
conversion Net Net
2008 2007 Change rate changes change change
(restated)
Costs and expenses
PLP-USA 16,286$ 15,147$ 1,139$ -$ 1,139$ 8 %
Australia 3,319 2,831 488 418 70 2
Brazil 2,531 2,009 522 430 92 5
South Africa 590 558 32 (48) 80 14
Canada 855 803 52 98 (46) (6)
Poland 1,472 - 1,472 - 1,472 100
All Other 6,213 5,302 911 371 540 10
Consolidated 31,266$ 26,650$ 4,616$ 1,269$ 3,347$ 13 %
Six month periods ended June 30,

23
PLP-USA costs and expenses increased $1.1 million primarily due to $.9 million related to an increase in personnel related expenses, a $.5 million increase in auditing fees, and a $.1 million increase in commission expense on higher sales partially offset by a $.4 million decrease in advertising and sales promotional expense. Excluding the effect of currency conversion, Australia costs and expenses increased $.1 million due to increased personnel related expenses and consulting fees. Excluding the effect of currency conversion, Brazil costs and expenses increased $.1 million primarily due to the increase in research and engineering and marketing personnel related expenses. Excluding the effect of currency conversion, South Africa costs and expenses increased primarily due to increased personnel related expenses and travel costs. Canada costs and expenses remained relatively flat compared to the same period in 2007. Our consolidated costs for the six month periods ended June 30, 2008 increased $1.5 million compared to the same period in 2007 as a result of including Belos costs and expenses. Excluding the effect of currency conversion, All Other costs and expenses increased $.5 million compared to the same period in 2007. This increase is primarily due to $.2 million increase in administrative expenses and a $.3 million increase related to the inclusion of DPW’s costs and expenses for the six month period ended June 30, 2008 compared to the inclusion of only three months in the six month period ended June 30, 2007. Operating income. Operating income of $11.4 million for the six month period ended June 30, 2008 increased $.8 million, or 7%, compared to the same period in 2007. This increase was primarily a result of the $ 5.4 million increase in gross profit being partially offset by the $4.6 million increase in costs and expenses. PLP-USA operating income of $3.8 million decreased $1.1 million primarily as a result of the $.2 million decrease in gross profit coupled with the $1.1 million increase in costs and expenses being partially offset by a $.2 million increase in intercompany royalty income. Australia operating income of $.4 million decreased $.6 million compared to the same period in 2007 primarily as a result of the $.5 million increase in costs and expenses. Brazil operating income of $.9 million decreased $.4 million compared to the same period in 2007 primarily as a result of the $.1 million increase in gross profit being offset by $.5 million of higher costs and expenses. South Africa operating income of $1.2 million increased $.4 million primarily as a result of the $.4 million improvement in gross profit compared to the same period in 2007. Canada operating income of $1.2 million increased $.1 million primarily as a result of a $.2 million increase in gross profit partially offset by a $.1 million increase in costs and expenses. Belos operating income of $1 million was primarily a result of $2.4 million in gross profit being partially offset by $1.5 million in costs and expenses. All Other operating income of $3 million increased $1.4 million compared to the same period in 2007 primarily as a result of the $2.5 million increase in gross profit being partially offset by $.9 million in increased costs and expenses and $.2 million.
Income taxes. Income tax expenses from continued operations for the six month period ended June 30, 2008 of $3.8 million was $.4 million lower than the same period in 2007. The effective tax rate for the six month periods ended June 30, 2008 and 2007 was 33% and 39% respectively. The effective tax rate for the six month period ended June 30, 2008 is lower than the statutory federal rate of 34% and the prior period’s rate of 39% primarily due to increased earnings in foreign jurisdictions with lower tax rates.
Income from continuing operations. Income from continuing operations for the six month period ended June 30, 2008 was $7.7 million, or $1.43 per diluted share, compared to income from continuing operations of $6.7 million, or $1.23 per diluted share, for the same period in 2007. PLP-USA income from continuing operations of $2.4 million decreased $.5 million compared to the same period in 2007 primarily as a result of the $1.1 million decrease in operating income and a $.2 million decrease in other income being partially offset by a $.8 million reduction in tax expense. Australia net income of $.2 million decreased $.4 million compared to the same period in 2007 primarily due to the $.5 decrease in operating income being partially offset by $.1 million in lower income taxes. Brazil income of $.6 million decreased $.3 million compared to the same period in 2007 as a result of the $.4 million decrease in operating income being partially offset by $.1 million in lower income taxes. South Africa income of $.9 million increased $.3 million as a result of the $.4 million increase in operating profit being partially offset by a $.1 million increase in income taxes. Canada income of $.8 million increased $.2 million as a result of the $.1 million increase in operating income. Belos income of $.6 million is a result of $1 million in operating income being partially offset by other expense, income taxes and minority interest of $.4 million. All Other income of $2.2 million increased $1.1 million primarily as a result of the $1.4 million increase in operating income, a $.1 million increase in other income partially offset by a $.4 million increase in income taxes compared to the same period in 2007.

24
APPLICATION OF CRITICAL ACCOUNTING POLICIES AND ESTIMATES Our critical accounting policies are consistent with the information set forth in Item 7, Management’s Discussion and Analysis of Financial Condition and Results of Operations, included in our Form 10-K for the year ended December 31, 2007 and are, therefore, not presented herein.
WORKING CAPITAL, LIQUIDITY AND CAPITAL RESOURCES Cash increased $.6 million for the six month period ended June 30, 2008. Net cash provided by operating activities was $6.2 million primarily because of net income and depreciation partially offset by the increase in accounts receivable, net of the increase in payables and accrued liabilities compared to year-end. The major investing and financing uses of cash were $6.3 million in capital expenditures, $2.2 million in dividend payments, and $7.5 million for repurchases of common shares, offset by proceeds of $11.8 million from the sale of SMP, net of transaction expenses. Net cash provided by investing activities of $5.5 million represents an increase of $12.1 million when compared to the cash used for investing activities in 2007. In May 2008, we sold SMP for proceeds of $11.8 million, net of transaction expenses, with an after-tax gain of $.5 million. Also in May 2008, we formed a joint venture with BlueSky Energy Pty Ltd for an initial cash payment of $.3 million. In March 2007, we acquired all the issued and outstanding shares of DPW for an initial cash payment of $2.6 million. Capital expenditures increased $2.1 million in the six month periods ended June 30, 2008 when compared to the same period in 2007 due mostly to a solar installation project at our Spain subsidiary, additional machinery investment at our Brazil subsidiary and PLP-USA locations, and a building expansion at our China subsidiary. Cash used in financing activities was $11.1 million compared to $2.8 million in the previous year. This increase was primarily a result of $7.3 million cash used to repurchase common shares outstanding when compared to the same period in 2007. Our current ratio was 2.8 to 1 at June 30, 2008 and December 31, 2007. At June 30, 2008, our unused balance under our main credit facility was $20 million and our bank debt to equity percentage was 5%. Our main revolving credit agreement contains, among other provisions, requirements for maintaining levels of working capital, net worth, and profitability. At June 30, 2008, we were in compliance with these covenants. We believe our future operating cash flows will be more than sufficient to cover debt repayments, other contractual obligations, capital expenditures and dividends. In addition, we believe our existing cash position, together with our available borrowing capacity, provides substantial financial resources. If we were to incur significant indebtedness, we expect to be able to continue to meet liquidity needs under our credit facilities. We would not increase our debt to a level that we believe would have a material adverse impact upon the results of operations or financial condition. RECENTLY ISSUED ACCOUNTING PRONOUNCEMENTS In May 2008, the FASB issued SFAS No. 162, "The Hierarchy of Generally Accepted Accounting Principles" (SFAS 162). SFAS 162 identifies the sources of accounting principles and the framework for selecting the principles used in the preparation of financial statements. SFAS 162 will be effective 60 days following the Securities and Exchange Commission's approval of the Public Company Accounting Oversight Board amendments to AU Section 411, "The Meaning of Present Fairly in Conformity with Generally Accepted Accounting Principles." The Company does not expect the adoption of this standard to have an impact on its financial position, results of operations, or cash flows. In March 2008, the FASB issued FASB Statement 161, “Disclosures about Derivative Instruments and Hedging Activities” (SFAS 161). SFAS 161 requires companies with derivative instruments to disclose information on how derivative instruments and related hedged items are accounted for under FASB No. 133, “Accounting for Derivative Instruments and Hedging Activities, and how derivative instruments and related hedged items affect a Company's financial position, financial performance and cash flows.” SFAS 161 is effective for financial statements issued for fiscal years and interim periods beginning after November 15, 2008. The Company is currently evaluating the potential impact, if any, of the adoption of SFAS 161 on our consolidated financial statements. In December 2007, the FASB issued SFAS No. 160, “Noncontrolling Interests in Consolidated Financial Statements an amendment of ARB No. 51” (SFAS 160). This standard amends ARB No. 51 to establish accounting and reporting for the noncontrolling interest in a subsidiary and for deconsolidation of a subsidiary. It also amends certain of ARB No. 51’s

25
consolidation procedures for consistency with the requirements of FASB Statement No. 141 (revised 2007), "Business Combinations." This standard is effective for financial statements issued for fiscal years, and interim periods within those fiscal years, beginning on or after December 15, 2008. In December 2007, the FASB issued SFAS No. 141R, “Business Combinations” (SFAS 141R). SFAS 141R revises the principles and requirements for how the acquirer recognizes and measures in its financial statements the identifiable assets acquired, the liabilities assumed, any noncontrolling interest in the acquiree, and the goodwill acquired in a business combination or gain from a bargain purchase. SFAS 141R also revises the principles and requirements for how the acquirer determines what information to disclose to enable users of the financial statements to evaluate the nature and financial effects of the business combination. This pronouncement is effective as of January 1, 2009. Both standards, SFAS 160 and 141R, will be applied prospectively to future business combinations entered into beginning in 2009. In April 2008, The FASB issued FASB Staff Position No. FAS 142-3, "Determination of the Useful Life of Intangible Assets" (FSP 142-3). FSP 142-3 amends the factors that should be considered in developing renewal or extension assumptions used to determine the useful life of a recognized intangible asset under SFAS No. 142, "Goodwill and Other Intangible Assets" (SFAS 142) The intent of FSP 142-3 is to improve the consistency between the useful life of a recognized intangible asset under SFAS 142 and the period of expected cash flows used to measure the fair value of the asset under SFAS 141R and other U.S. generally accepted accounting principles. This Statement applies prospectively to business combinations for which the acquisition date is on or after the beginning of the first annual reporting period beginning on or after December 15, 2008.
ITEM 3. QUANTITATIVE AND QUALITATIVE DISCLOSURES ABOUT MARKET RISK
The Company operates manufacturing facilities and offices around the world and uses fixed and floating rate debt to finance the Company's global operations. As a result, the Company is subject to business risks inherent in non-U.S. activities, including political and economic uncertainty, import and export limitations, and market risk related to changes in interest rates and foreign currency exchange rates. The Company believes the political and economic risks related to the Company's foreign operations are mitigated due to the stability of the countries in which the Company's largest foreign operations are located. The Company has no foreign currency forward exchange contracts outstanding at June 30, 2008. The Company does not hold derivatives for trading purposes.
The Company is exposed to market risk, including changes in interest rates. The Company is subject to interest rate risk on its variable rate revolving credit facilities and term notes, which consisted of borrowings of $7.6 million at June 30, 2008. A 100 basis point increase in the interest rate would have resulted in an increase in interest expense of less than $.1 million for the six month period ended June 30, 2008. The Company's primary currency rate exposures are related to foreign denominated debt, intercompany debt, foreign exchange contracts, foreign denominated receivables, and cash and short-term investments. A hypothetical 10% change in currency rates would have a favorable/unfavorable impact on fair values of $2.3 million and on income before income taxes of less than $.1 million.
ITEM 4. CONTROLS AND PROCEDURES
Evaluation of Disclosure Controls and Procedures
An evaluation was performed under the supervision and with the participation of the Company’s management, including the Chief Executive Officer and Vice President - Finance and Treasurer, of the effectiveness of the Company’s disclosure controls and procedures (as defined in Securities and Exchange Act Rules 13a-15(e) and 15-d-15(e)) as of June 30, 2008. Based on that evaluation, the Company’s management including the Chief Executive Officer and Vice President - Finance and Treasurer, concluded that the Company’s disclosure controls and procedures were not effective as of June 30, 2008 solely because of the material weakness in the Company’s internal controls over financial reporting identified as of December 31, 2007 relating to not having sufficient resources with the appropriate technical accounting knowledge in the

26
finance organization. In light of the foregoing, the Company performed additional analysis and post-closing procedures as deemed necessary to ensure that the accompanying Unaudited Consolidated Financial Statements were prepared in accordance with U.S. generally accepted accounting principles for interim financial information and the instructions to Form 10-Q. Accordingly, management believes that the Unaudited Consolidated Financial Statements included in this report present fairly, in all material aspects, the Company’s financial position as of June 30, 2008, and the results of its operations and cash flows for the six month periods then ended.
Changes in Internal Control over Financial Reporting
The Company has engaged an outside consultant to assist in preparing and reviewing the accounting for income taxes. A Manager of Internal Audit and a Technical Accounting Manager have been hired subsequent to December 31, 2007. Additionally, the Company’s management is recruiting a Financial Analyst. These actions are being taken to remedy the material weakness in internal control over financial reporting identified as of December 31, 2007. However, the improvements in controls have not all been implemented or operating effectively for a period of time sufficient for the Company to fully evaluate their operating effectiveness. Other than these actions, there have not been any changes in the Company’s internal control over financial reporting (as defined in Rule 13a-15(f) and 15d-15(f)) during the quarter ended June 30, 2008 that materially affected or are reasonably likely to materially affect the Company’s internal control over financial reporting.
PART II – OTHER INFORMATION
ITEM 1. LEGAL PROCEEDINGS
The Company is subject to various legal proceedings and claims that arise in the ordinary course of business. In the opinion of management, the amount of any ultimate liability with respect to these actions will not materially affect our financial condition or results of operations.
ITEM 1A. RISK FACTORS
There were no material changes from the risk factors previously disclosed in the Company’s Annual Report on Form 10-K for the year ended December 31, 2007 filed on April 7, 2008.
ITEM 2. UNREGISTERED SALES OF EQUITY SECURITIES AND USE OF PROCEEDS
On February 15, 2007, the Board of Directors authorized a plan to repurchase up to 200,000 shares of Preformed Line Products Company, superseding any previously authorized plan, including the December 2004 plan. The repurchase plan does not have an expiration date. The following table includes repurchases for the three-month periods ended June 30, 2008.
Period (2008)
Total
Number of
Shares
Purchased
Average
Price Paid
per Share
Total Number of Shares
Purchased as Part of
Publicly Announced Plans
or Programs
Maximum Number of
Shares that may yet be
Purchased under the
Plans or Programs
April - $ - 16,422 183,578
May 169,326 43.15 169,326 14,252
June - - 169,326 14,252
Total 169,326
On May 15, 2008, the Company announced that the Board of Directors authorized the repurchase of 152,726 of Preformed Line Products common shares from Mrs. Barbara Drinko, as personal representative of the Estate of John Deaver Drinko, individually and as beneficiary of the John Deaver Drinko IRA, and as trustee of the John Deaver Drinko Trust Agreement, dated October 27, 1994, and from National City Bank, as trustee of the Elizabeth Gibson Drinko IRA, in a privately negotiated transaction. The negotiated purchase price per share paid by the Company was $42.24.
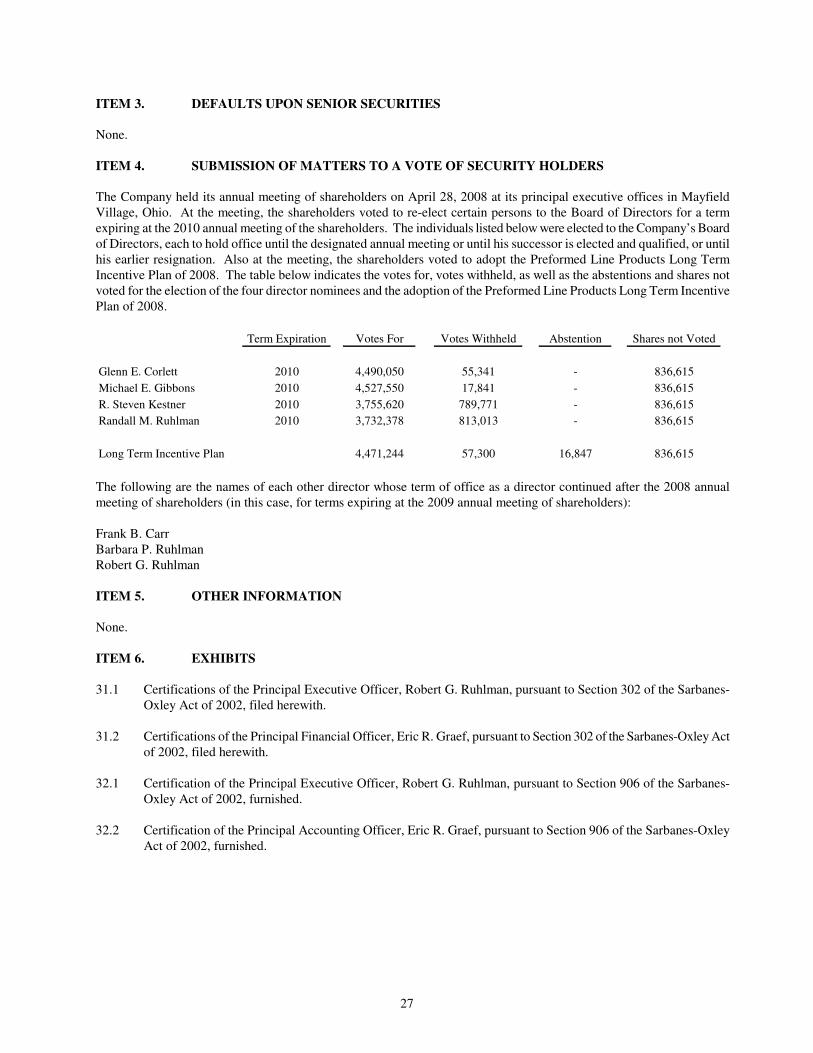
27
ITEM 3. DEFAULTS UPON SENIOR SECURITIES
None.
ITEM 4. SUBMISSION OF MATTERS TO A VOTE OF SECURITY HOLDERS
The Company held its annual meeting of shareholders on April 28, 2008 at its principal executive offices in Mayfield Village, Ohio. At the meeting, the shareholders voted to re-elect certain persons to the Board of Directors for a term expiring at the 2010 annual meeting of the shareholders. The individuals listed below were elected to the Company’s Board of Directors, each to hold office until the designated annual meeting or until his successor is elected and qualified, or until his earlier resignation. Also at the meeting, the shareholders voted to adopt the Preformed Line Products Long Term Incentive Plan of 2008. The table below indicates the votes for, votes withheld, as well as the abstentions and shares not voted for the election of the four director nominees and the adoption of the Preformed Line Products Long Term Incentive Plan of 2008.
Term Expiration Votes For Votes Withheld Abstention Shares not Voted
Glenn E. Corlett 2010 4,490,050 55,341 - 836,615
Michael E. Gibbons 2010 4,527,550 17,841 - 836,615
R. Steven Kestner 2010 3,755,620 789,771 - 836,615
Randall M. Ruhlman 2010 3,732,378 813,013 - 836,615
Long Term Incentive Plan 4,471,244 57,300 16,847 836,615
The following are the names of each other director whose term of office as a director continued after the 2008 annual meeting of shareholders (in this case, for terms expiring at the 2009 annual meeting of shareholders): Frank B. Carr Barbara P. Ruhlman Robert G. Ruhlman
ITEM 5. OTHER INFORMATION
None.
ITEM 6. EXHIBITS
31.1 Certifications of the Principal Executive Officer, Robert G. Ruhlman, pursuant to Section 302 of the Sarbanes-
Oxley Act of 2002, filed herewith. 31.2 Certifications of the Principal Financial Officer, Eric R. Graef, pursuant to Section 302 of the Sarbanes-Oxley Act
of 2002, filed herewith. 32.1 Certification of the Principal Executive Officer, Robert G. Ruhlman, pursuant to Section 906 of the Sarbanes-
Oxley Act of 2002, furnished. 32.2 Certification of the Principal Accounting Officer, Eric R. Graef, pursuant to Section 906 of the Sarbanes-Oxley
Act of 2002, furnished.

28
FORWARD LOOKING STATEMENTS Cautionary Statement for “Safe Harbor” Purposes Under The Private Securities Litigation Reform Act of 1995 This Form 10-Q and other documents the Company files with the Securities and Exchange Commission contain forward-looking statements regarding the Company’s and management’s beliefs and expectations. As a general matter, forward-looking statements are those focused upon future plans, objectives or performance (as opposed to historical items) and include statements of anticipated events or trends and expectations and beliefs relating to matters not historical in nature. Such forward-looking statements are subject to uncertainties and factors relating to the Company’s operations and business environment, all of which are difficult to predict and many of which are beyond the Company’s control. Such uncertainties and factors could cause the Company’s actual results to differ materially from those matters expressed in or implied by such forward-looking statements. The following factors, among others, could affect the Company’s future performance and cause the Company’s actual results to differ materially from those expressed or implied by forward-looking statements made in this report:
• The overall demand for cable anchoring and control hardware for electrical transmission and distribution lines on a worldwide basis, which has a slow growth rate in mature markets such as the United States, Canada, and Western Europe;
• Technological developments that affect longer-term trends for communication lines such as wireless communication;
• The decreasing demands for product supporting copper-based infrastructure due to the introduction of products using new technologies or adoption of new industry standards;
• The Company’s success at continuing to develop proprietary technology to meet or exceed new industry performance standards and individual customer expectations;
• The Company’s success at implementing price increases to offset rising material costs;
• The Company’s success in strengthening and retaining relationships with the Company’s customers, growing sales at targeted accounts and expanding geographically;
• The extent to which the Company is successful in expanding the Company’s product line into new areas;
• The Company’s ability to identify, complete and integrate acquisitions for profitable growth;
• The potential impact of consolidation, deregulation and bankruptcy among the Company’s suppliers, competitors and customers;
• The relative degree of competitive and customer price pressure on the Company’s products;
• The cost, availability and quality of raw materials required for the manufacture of products;
• The effects of fluctuation in currency exchange rates upon the Company’s reported results from international operations, together with non-currency risks of investing in and conducting significant operations in foreign countries, including those relating to political, social, economic and regulatory factors;
• Changes in significant government regulations affecting environmental compliances;
• The telecommunication market’s continued deployment of Fiber-to-the-Premises;
• Those factors described under the heading “Risk Factors” on page 12 of the Company’s Annual Report on Form 10-K for the year ended December 31, 2007 filed on April 7, 2008.

29
SIGNATURES
Pursuant to the requirements of the Securities Exchange Act of 1934, the registrant has duly caused this report to be signed on its behalf by the undersigned thereunto duly authorized. August 8, 2008 /s/ Robert G. Ruhlman___________________ Robert G. Ruhlman Chairman, President and Chief Executive Officer (Principal Executive Officer)
August 8, 2008 /s/ Eric R. Graef______________________ Eric R. Graef Vice President - Finance and Treasurer (Principal Accounting Officer)

30
EXHIBIT INDEX
31.1 Certifications of the Principal Executive Officer, Robert G. Ruhlman, pursuant to Section 302 of the Sarbanes-Oxley Act of 2002, filed herewith.
31.2 Certifications of the Principal Financial Officer, Eric R. Graef, pursuant to Section 302 of the Sarbanes-Oxley Act
of 2002, filed herewith. 32.1 Certification of the Principal Executive Officer, Robert G. Ruhlman, pursuant to Section 906 of the Sarbanes-
Oxley Act of 2002, furnished. 32.2 Certification of the Principal Accounting Officer, Eric R. Graef, pursuant to Section 906 of the Sarbanes-Oxley
Act of 2002, furnished.