universiti putra malaysia radiation synthesis and ...psasir.upm.edu.my/5090/1/fs_2007_63.pdfiv...
TRANSCRIPT
UNIVERSITI PUTRA MALAYSIA
RADIATION SYNTHESIS AND CHARACTERIZATION OF CONDUCTING POLYANILINE AND POLYANILINE/SILVER NANOPARTICELS
MOHAMMED AHMED ALI OMER
FS 2007 63
RADIATION SYNTHESIS AND CHARACTERIZATION OF CONDUCTINGPOLYANILINE AND POLYANILINE/SILVER NANOPARTICELS
By
MOHAMMED AHMED ALI OMER
Thesis Submitted to the School of Graduate Studies, Universiti Putra Malaysia,in Fulfilment of the Requirements for the Degree of Doctor of Philosophy
September 2007

ii
Dan mereka bertanya kepadamu tentang roh. Katakan: “Roh itu dariperkara urusan tuhanku dan kamu tidak diberikan ilmu pengetahuan
melainkan sedikit sahaja”(Al-Israa – 85)

iii
To the Soule of my parent mum Maddeina M.O. and Ahmed Ali O. who were
sincerely encourage and foster me through out my study-hood, I dedicate the benefits
of this humble work. To the Soule of Uncle Abdelrahman Ali O., Omer Awad O. and
my brother Alfatih Shaikh Alddin Ali, Allah rewards them with paradise.
To my friend as well as my Uncle Salahualdinn Ali O, whose generous help and
sincere encouragement motivated me to go ahead for further study, to my patientful
wife Omsalam Mohamed Ismail, our son Ahmed Mohammed Ahmed and those who
are sincerely pray for my success.
iv
Abstract of the thesis presented to the Senate of Universiti Putra Malaysia infulfilment of requirement for the degree of Doctor of Philosophy
RADIATION SYNTHESIS AND CHARACTERIZATION OF CONDUCTINGPOLYANILINE AND POLYANILINE/SILVER NANOPARTICELS
By
MOHAMMED AHMED ALI OMER
September 2007
Chairman: Professor Elias Saion, PhD
Faculty: Science
The conducting polymer PANI nanoparticles were synthesized from polyvinyl
alcohol PVA and aniline hydrochloride (AniHCl) blend films at different AniHCl
monomer concentrations (0.5, 1.0, 1.5 and 2.0 g or as 9.0, 16.7, 23.1, and 28.6 wt %)
and irradiated with gamma radiation at different doses (0, 10, 20, 30, 40, and 50
kGy) at ambient conditions. Upon irradiation AniHCl undergoes dechlorination by
the loss of Cl– that acts as an oxidant and ‘in situ’ polymerizing aniline into
conducting PANI nanoparticles. The formation of conducting PANI has been
observed by the change of colour from colourless to dark green due to the formation
of polaron species characterized by the defect in molecular structure of the polymer
and was confirmed by Raman scattering at 1637 cm-1 Raman shift assigned for C=N
stretching of imines group. The SEM morphology of PVA/PANI composites reveals
the spherical structure of nanoparticles, 50 – 100 nm in diameter which then
v
transformed into globular clusters of conducting PANI with good environmental
stability.
The optical properties of PANI nanoparticles were measured by means of UV-visible
spectrophotometry and found that the absorbance at 790 nm band of conducting
PANI increased exponentially with the increase of dose and fitted the expression of
the form: )/exp( 00 DDyy , where D is the absorbed dose and 0D is the dose
sensitivity. The results reveal that the optical parameters such as absorption edge,
activation energy, and band gap energy decreased with the increase of dose and
AniHCl concentration. When the dose increased from 10 kGy to 50 kGy the
absorption edge decreased from 1.0 to 0.91 eV for 9.0% AniHCl and from 0.82 to
0.44 eV for 28.6% AniHCl, the activation energy decreased from 2.25 to 1.5 eV for
9.0% AniHCl and from 0.8 to 0.69 eV for 28.6% AniHCl, and the band gap energy
decreased from 1.36 to 1.18 eV for 9.0% AniHCl and from 1.12 to 1.00 eV for 28.6
wt% AniHCl. The electrical conductivity was determined by an impedance analyzer
and found the conductivity increased with the increase of dose and AniHCl
concentration. The conductivity is mainly the direct current (dc) component
attributed to the creation of polarons in the PANI structure and they are the charge
carriers of conducting PANI which are set in motion in a form of electron hopping
within the backbone of the composites. The dc conductivity increased from
61075.5 S/m to 31032.1 S/m for 9.0 wt% and from 51076.7 S/m to
11017.1 S/m for 28.6 wt% AniHCl when the dose was increased from 10 kGy to
50 kGy. The dc conductivity is therefore governed by the exponential relation of the
form: )/exp( 00 DDdc , where 0 and 0D were found varied with different
AniHCl concentration.

vi
The silver nanoparticles were synthesized from PVA/silver nitrate (AgNO3) blend
films at different AgNO3 dopant concentration of 0.01 wt % and irradiated with
gamma radiation at different doses (0, 10, 20, 30, 40, and 50 kGy) at ambient
conditions. Upon gamma irradiation, the released electrons interact with silver ions
Ag+ which reduce to silver nanoparticles Ag0. The formation of Ag0 nanoparticles
has been observed by the colour changed from colourless to golden yellow due to the
presence of Ag0 nanoparticles and was confirmed by XRD analysis. Further, the
presence of metal nanoparticles was verified with the UV-visible absorption
measurement that reveals the absorption peak at 425 nm due to surface plasmon
resonant phenomenon at the conduction band of Ag0 nanoparticles where the
absorbance increased with the increase of dose and fitted the expression of the form:
)/exp( 00 DDyy .
The composites of PVA/PANI/Ag0 nanoparticles were radio-synthesized with the
concentration of AniHCl at 28.6 wt%. The concentrations of AgNO3 dopant are
different (0.01, 0.03, 0.05, and 0.07 wt %) and different radiation doses (0, 10, 20,
30, 40, and 50 kGy). The results from optical absorption measurement reveal two
absorption bands at 415 nm due to surface plasmons of Ag0 nanoparticles and at 600
nm due to polarons of low conducting PANI. The absorption band shifted from 425
nm to 415 nm crrosponds to decreasing diameter of Ag0 nanoparticles in the presence
of PANI in the composites. The band gap increased with the increase of AgNO3
dopant, from 1.72 eV for 0.01 wt% to 2.58 eV for 0.07 wt% dopant irradiated at 50
kGy. The dc conductivity increased with the increase of dose and decreased with the
increase of dopant concentration Ag+. The dc conductivity for 0.01 wt% dopant
increased from 61077.9 S/m at 10 kGy to 41051.8 S/m at 50 kGy. For dopant
vii
concentration at 0.07 wt%, however, the dc conductivity increased from
71007.1 S/m at 10 kGy to 51023.1 S/m at 50 kGy. The dc conductivity of
PVA/PANI/Ag0 nanocomposites was found to have an exponential expression of the
form: )/exp( 00 DDdc .

viii
Abstrak tesis yang dikemukakan kepada Senat Universiti Putra Malaysia sebagaimemenuhi keperluan untuk ijazah Doktor Falsafah
SINTESIS SINARAN DAN PENCIRIAN POLIANILINA KONDUKTORDAN ZARAH NANO POLIANILINA/ARGENTUM DISEBARKAN
Oleh
MOHAMMED AHMED ALI OMER
September 2007
Pengerusi: Profesor Elias Saion, PhD
Fakulti : Sains
Zarah nano bagi polimer konduktor PANI telah disintesiskan daripada film adunan
PVA/aniline hidroklorida (AniHCl) pada kepekatan monomer AniHCl berbeza (9.0,
16.7, 23.1, and 28.6 wt%) dan disinarkan dengan sinaran gama pada dos berbeza (0,
10, 20, 30, 40, and 50 kGy) dalam keadaan ambien. Setelah disinarkan AniHCl
mengalami nyahklorin dengan kehilangan Cl– yang bertindak sebagai pengoksidan
dan secara ‘in situ’ mengpolimerkan anilina kepada zarah nano PANI konduktor.
Pembentukan PANI konduktor telah diperhatikan sebagai perubahan warna daripada
tak berwarna kepada hijau gelap kerana pembentukan spesis polaron yang dikaitkan
sebagai kecacatan struktur molekul polimer dan telah disahkan oleh pengukuran
serakan Raman pada anjakan Raman 1637 cm-1 yang dipadankan kepada rengangan
ikatan C=N dalam kumpulan amina. Morpologi SEM bagi komposit PVA/PANI
menunjukkan struktur zarah nano berbentuk sfera berdiameter 50 – 100 nm dan
ix
kemudian struktur zarah nano PANI bertukar kepada kulster PANI dengan
mempunyai kestabilan alam sekitar yang baik.
Ciri optik zarah nano PANI telah diukur dengan menggunakan kaedah
spektrophotometri UV-tampak dan didapati penyerapan pada 790 nm bertambah
secara eksponen dengan pertambahan dos berpadanan dengan bentuk:
)/exp( 00 DDyy , yang mana D ialah dos terserap dan 0D ialah kepekaan dos.
Keputusan menunjukkan parameter optik seperti penyerapan pinggir, tenaga
pengaktifan dan tenaga jalur celah didapati berkurangan dengan pertambahan dos
dan kepekatan AniHCl. Apabila dos ditingkatkan daripada 10 kGy kepada 50 kGy
didapati penyerapan pinggir berkurangan daripada 1.0 kepada 0.91 eV untuk 9.0%
AniHCl dan daripada 0.82 kepada 0.44 eV untuk 28.6% AniHCl, tenaga pengaktifan
berkurangan daripada 2.25 kepada 1.5 eV untuk 9.0% AniHCl dan daripada 0.8
kepada 0.69 eV untuk 28.6% AniHCl, serta tenaga jalur celah berkurangan daripada
1.36 kepada 1.18 eV untuk 9.0% AniHCl dan daripada 1.12 kepada 1.00 eV untuk
28.6% AniHCl. Kekonduksina elektrik telah ditentukan secara analisis impedans dan
didapati kekonduksian bertambah dengan pertambahan dos dan kepekatan AniHCl.
Kekonduksian dipengaruhi oleh komponen arus terus (dc) kerana kewujudan polaron
dalam struktur PANI dan ia adalah pembawa cas bagi PANI. Kekonduksian arus
terus dc bertambah daripada 61075.5 S/m kepada 31032.1 S/m untuk 9.0% dan
daripada 51076.7 S/m kepada 11017.1 S/m untuk 28.6% AniHCl dimana dos
ditingkatkan daripada 10 kGy kepada 50 kGy. Kekonduksian dc dipengaruhi oleh
hubungan eksponen dalam bentuk )/exp( 00 DDdc , dimana 0 dan 0D
didapati berubah dengan kepekatan AniHCl.
x
Zarah argentum nano telah disentisis daripada film adunan PVA/argentum nitrat
(AgNO3) pada kepekatan dopan AgNO3 ialah 0.01 wt % dan disinarkan dengan sinar
gama pada dos berbeza (0, 10, 20, 30, 40, and 50 kGy) dalam keadaan ambient.
Semasa penyinaran gama electron yang dihasilkan bersaling tindak dengan ion
argentum Ag+ lalu menghasilkan zarah argentum nano Ag0. Pembentukan zarah
argentum nano Ag0 telah diperhatikan sebagai perubahan warna daripada tak
berwarna kepada kuning emas kerana kehadiran zarah argentum nano Ag0 dan telah
disahkan secara analisis XRD. Seterusnya kehadiran zarah argentum nano Ag0 telah
ditentusahkan secara kaedah penyerapan UV-tampak yang menghasilkan puncak
penyerapan pada 425 nm kerana kehadiran plasmon pada jalur konduksi zarah nano
argentum Ag0. Penyerapan bertambah dengan pertambahan dos dan berpadanan
dengan hubungan eksponen dalam bentuk )/exp( 00 DDyy .
Komposit zarah nano PVA/PANI/Ag0 telah disentisis dengan kepekatan AniHCl
28.6 wt%. Kepekatan dopan AgNO3 berbeza (0.01, 0.03, 0.05, and 0.07 wt %) dan
berbeza dos sinar gama (0, 10, 20, 30, 40, and 50 kGy). Keputusan daripada
pengukuran penyerapan optik menunjukkan dua jalur penyerapan pada 415 nm
bersumber daripada plasmon dipermukaan zarah argentum nano Ag0 dan pada 600
nm disebabkan oleh polaron pada PANI konduksi rendah. Jalur penyerapan beranjak
daripada 425 nm kepada 415 nm yang menunjukkan bahawa diameter zarah
argentum nano Ag0 telah berkurangan kerana kehadiran PANI dalam komposit.
Tenaga jalur celah bertambah dengan pertambahan dopan AgNO3 daripada 1.72 eV
untuk 0.01 wt% kepada 2.58 eV untuk 0.07 wt% pada dos 50 kGy. Kekonduksian dc
bertambah dengan pertambahan dos dan berkurangan dengan pertambahan kepekatan
dopan. Kekonduksian dc untuk dopan 0.01 wt% bertambah daripada 61077.9 S/m
xi
pada 10 kGy kepada 41051.8 S/m pada 50 kGy. Untuk dopan 0.07 wt%
kekonduksian dc bertambah daripada 71007.1 S/m pada 10 kGy kepada
51023.1 S/m pada 50 kGy. Kekonduksian dc komposit nano PVA/PANI/Ag0
didapati mempunyai hubungan eksponen dalam bentuk )/exp( 00 DDdc .

xii
ACKNOWLEDGEMENTS
I would like to express my utmost gratitude to Prof. Dr. Elias Saion, Chairman of the
Supervisory Committee whose fingerprint illuminates the pages of this thesis and
moreover the academic and even social experiences that he taught us during the
period of my study, as well as to my cosupervisor Dr. Khairulzaman Hj Mohamad
Dahlan from Nuclear Agency Malaysia and Associate Prof. Dr. Noorhana Yahaya
and Prof. Dr. Anuar Kassim who are sincere and hones in helping me through my
work to compolete this humble thesis.
I Also feel so indebted with thanks and warm appreciation to Prof. Dr. Abdul Halim
Shahri whose ideas directed and quidet me to have wider knowledge in the field of
material characterizations. Also I have to acknoeledge and to show my specially
thanks and considerations to my friends and lab-mates Mr. Khalid Ahmed M. from
Jordon (UPM), Mr. Awad Ahmed A. from Saudi Arabia (UPM), Mr. Iskander H.
(UPM) and Mr. Hamzah Mohd.H. (MNA).
Also sincere thanks and acknowledge to Mr. Mohammad Zain, Mr. Mohammad
Shah, Miss. Usnita Osman, and Miss. Azian Osman for their assistance and
encouragement.
Thanks are expressed to the Nuclear Agency of Malaysian for allowing me to
irradiate my research samples, especially the department of high dose rate
represented by Mr. Shahri bin Hashim and Mr. Taiman Kadni at SDDL department.
xiii
I certify that an Examination Committee has met on September 18, 2007 to conductthe final examination of Mohammed Ahmed Ali Omer on his Doctor of Philosophythesis entitled “Radiation Synthesis and Characterization of Conducting Polyanilineand Polyaniline/Silver Nanoparticles” in accordance with Universiti PertanianMalaysia (Higher Degree) Act 1980 and Universiti Pertanian Malaysia (HigherDegree) Regulations 1981. The Committee recommends that the student be awardedthe relevant degree.
Members of the Examination Committee are as follows:
Hj. Wan Mahmood Mat yunus, PhDAssociate ProfessorFaculty of ScienceUniversiti Putra Malaysia(Chairman)
Mohamad Maarof H. A. Moksin, PhDProfessorFaculty of ScienceUniversiti Putra Malaysia(Internal Examiner)
Zainal Abidin Talib, PhDAssociate ProfessorFaculty of ScienceUniversiti Putra Malaysia(Internal Examiner)
Ibrahim Talib, PhDProfessorSchool of PhysicsUniversiti Kabangsaan Malaysia(External Examiner)
__________________________________HASSANA MOHD. GHAZALI, ph DProfessor / Deputy DeanSchool of Graduate StudiesUniversiti Putra Malaysia
Date: 24 October 2007

xiv
This thesis was submitted to the Senate of Universiti Putra Malaysia and has beenaccepted as fulfilment of the requirement for the degree of Doctor of Philosophy.The members of the Supervisory Committee are as follows:
Elias Saion, PhDProfessorFaculty of ScienceUniversiti Putra Malaysia(Chairman)
Khairulzaman Hj. Moh. Dahlan, PhDAssociate ProfessorNuclear Energy Agency Malaysia-Bangi (NEAM)(Member)
Anuar Kassim, PhDProfessorFaculty of ScienceUniversiti Putra Malaysia(Member)
Noorhana Yahaya, PhDAssociate ProfessorFaculty of ScienceUniversiti Putra Malaysia(Member)
_____________________AINI IDERIS, ph DProfessor and DeanSchool of Graduate StudiesUniversiti Putra Malaysia
Date:15 November 2007
xv
TABLE OF CONTENTS
Page
iiiivviiixiixiiixivxxxxixxiixxxi
DEDICATIONABSTRACTABSTRAKACKNOWLEDGEMENTSAPPROVALAPPROVALTABLE OF CONTENTSLIST OF TABLESLIST OF FIGURESLIST OF ABBREVIATIONS
CHAPTER113456678
1 INTRODUCTION1.1 Background of the Study1.2 Conducting PolyanilineNanoparticles1.3 Polyaniline/Silver Nanoparticles1.4 Statement of the Problems1.5 Significant of the Study1.6 Scope of the Present Study1.7 Objectives of the Study.1.8 Thesis Outline
991011131519212222232626292932384548
48
2 LITERATURE REVIEW2.1 Background of conducting polymers.
2.1.1 History of conducting polymers.2.1.2 Conjugated polymer.2.1.3 Concepts of solitons, polarons, and bipolarons.2.1.4 Types of conducting polymers.2.1.5 Conducting polyaniline.2.1.6 Polyvinyl Alcohol
2.2 Synthesis of PANI and its composites2.2.1 Chemically polymerization.2.2.2 Electrochemically polymerization of PANI.2.2.3 Polymerization of PANI by UV photo-doping.2.2.4 Polymerization of PANI by -irradiation doping.
2.3 Characterization of PANI and PANI composites2.3.1 Chemical structure and oxidation state of PANI.2.3.2 Optical properties of PANI.2.3.3 Electrical properties of PANI.2.3.4 Morphological structure of PANI anocomposites
2.4 Applications of conducting polymers2.4.1 Sheilding of electromagnetic radiation and
electrostatics.
xvi
4950505252545454565757575858596061626263646769727274757676
2.4.2 Electrode materials for ion batteries2.4.3 Supercapacitors2.4.4 Electrocatalystics and biosensors2.4.5 Photoconductivity and solar energy conversion2.4.6 Biological sensors
2.5 Metalic Nanoparticles2.5.1 Fundamental of metallic nanoparticles.2.5.2 History of metal nanoparticles.2.5.3 Classes of metal nanoparticles.
2.6 Synthesis of composite polymer/metal nanoparticles.2.6.1 Liquid metals atomization by electrospraying2.6.2 Gas phase spattering condensation method2.6.3 Solution phase chemical reduction method2.6.4 Solution phase electrochemical method2.6.5 Ultrasound irradiation method2.6.6 Photo-reduction by UV-irradiation method2.6.7 Ionizing radiation reduction method
2.7 Characterization of metal nanoparticles2.7.1 Electrical conduction2.7.2 Electron spin resonance2.7.3 Linear optical properties2.7.4 X-ray diffraction2.7.5 SEM and TEM nanoparticles morphology
2.8 Applications of metal nanoparticles and their composites2.8.1 Surface enhanced Raman scattering (SERS)2.8.2 Surface enhanced fluorescence2.8.3 Surface plasmon resonant absorption2.8.4 Electrocatalysts2.8.5 Metallic nanoparticles for nanbiotechnolog
78788082848486889191949596979898100100104
3 THEORETICAL STUDIES3.1 Ionizing radiation.
3.1.1 Radiation sources3.1.2 γ-radiation source
3.2 γ-radiation interaction with matter3.2.1 Photo-electric absorption3.2.2 Compton scattering3.2.3 Pair production3.2.4 Releigh scattering3.2.5 -ray attenuation coefficients
3.3 γ-radiation interaction with molecules3.3.1 Polymerization3.3.2 Crosslinking3.3.3 Radiation grafting
3.4 Interaction of electron with specimen3.4.1 Elastic scattering3.4.2 Inelastic scattering3.4.3 Scanning electron microscopy (SEM) principle
3.5 X-ray diffraction spectroscopy XRD
xvii
107108109109110111112114115115117118119121123126130132134
3.6 Interaction of light with molecules3.6.1 Molecular bonding transition3.6.2 The spinning transition3.6.3 Translational motion3.6.4 Rotational transition3.6.5 Molecular vibration3.6.6 Electronictransition in molecules3.6.7 Transition involving nucleus
3.7 Absorption of light and UV-visible spectrophotometery3.7.1 Optical absortion3.7.2 Mechanism of absorption process3.7.3 Absorption edge3.7.4 Optical band gap3.7.5 UV-visible absorption spectrophotoscopy3.7.6 Light interaction with nanoparticles
3.8 Scattering of light and Raman Spectroscopy3.9 Interaction of electric field with dielectric materials
3.9.1 Dielectric Constant and Dielectric Loss3.9.2 Electrical Conduction in Dielectrics
138138138
139139
144144145
147149
4 MATERIALS AND METHOD4.1 Materials4.2 Preparation of composite of PVA/AniHCl film samples4.3 Preparation of composite of PVA/AniHCl/AgNO3 film
Silver nitrate (AgNO3)4.4 Irradiation of film samples4.5 Scanning Electron Microscopy (SEM) and
morphological study4.6 X-ray diffraction (XRD) and crystallinity measurement4.7 UV-visible spectroscopy and absorbance measurement4.8 Raman spectroscopy and chemical structure
identification4.9 Impedance analyzer and conductivity measurement
151151151155
156157157159162
164166166169
5 RESULTS AND DISCUSSION5.1 Oxidation and reduction process by radiation.
5.1.1 The formation of PANI nanoparticles.5.1.2 The formation of Ag0 nanoparticles.5.1.3 The formation of nanocomposites of PANI/Ag0
nanoparticles.5.2 Scanning electron microscope (SEM) morphology.
5.2.1 The SEM morphology of PANI nanoparticles.5.2.2 The SEM morphology of solid phase HCl.5.2.3 The SEM morphology of Ag0 nanoparticles.5.2.4 The SEM morphology of PANI/Ag0
nanoparticles.5.3 X-ray diffraction (XRD) analysis.
5.3.1 XRD spectra of PVA/PANI nanocomposites.5.3.2 XRD spectra of PVA/PANI/Ag0 nanocomposites
5.4 Raman scattering analysis of PANI nanoparticles 171
xviii
176176178180180
184187189194197202202204206211215
219220222226
228
231
234
236
249
249
252255
264264
5.5 Color change of irradiated PVA/PANI and PVA/AgNO3
nanocomposites.5.5.1 Color change of PANI nanoparticles.5.5.2 Color change of Ag0 nanoparticles.
5.6 Optical characteristics of PANI nanoparticles5.6.1 UV-visible spectra5.6.2 Quantitative analysis formation of PANI
nanoparticles.5.6.3 Quantitative analysis of HCl formation5.6.4 Absorption edge of PANI nanoparticles5.6.5 Activation energy (∆E) of PANI nanoparticles.5.6.6 Band gap of PANI nanoparticles
5.7 Optical characteristics of PANI/Ag0 nanoparticles5.7.1 UV-visible spectra of Ag0 nanoparticles5.7.2 Band gap of Ag0 nanoparticles5.7.3 UV-visible spectra of PANI/Ag0 nanoparticles.5.7.4 Absorption edge of PANI/Ag0 nanoparticles.5.7.5 Band gap of PANI/Ag0 nanoparticles.
5.8 Electrical conductivity of composites of PVA/PANInanoparticles.5.8.1 Conductivity of PVA irradiated at various doses.
5.8.1.1 The dc conductivity of irradiated PVA.5.8.1.2 The ac conductivity of irradiated PVA
5.8.2 Conductivity of PVA/AniHClcomposites atvarious concentrations.
5.8.3 Conductivity of PANI nanoparticles at variousdoses.
5.8.4 The dc conductivity of PANI nanoparticlesdetermine from direct extrapolation method.
5.8.5 The dc conductivity of PANI nanoparticlesdetermine from Cole-Cole plot.
5.9 Electrical conductivity of composite of PVA/PANI/Ag0
nanoparticles.5.9.1 Conductivity of PANI/Ag0 nanoparticles at
various Ag+ concentration and doses.5.9.2 The ac conductivity of PANI/Ag0 nanoparticles
determined from direct extrapolation.5.9.3 The ac conductivity of PANI/Ag0 nanoparticles
determined from Cole-Cole plots.5.9.4 Analysis of the ac conductivity of PANI/Ag0
nanoparticles
270270273
6 CONCLUSION AND FUTURE WORKS6.1 Conclusion6.2 Future Works
REFERENCES 275BIODATA OF THE AUTHOR 311
xix
LIST OF TABLES
Table Page
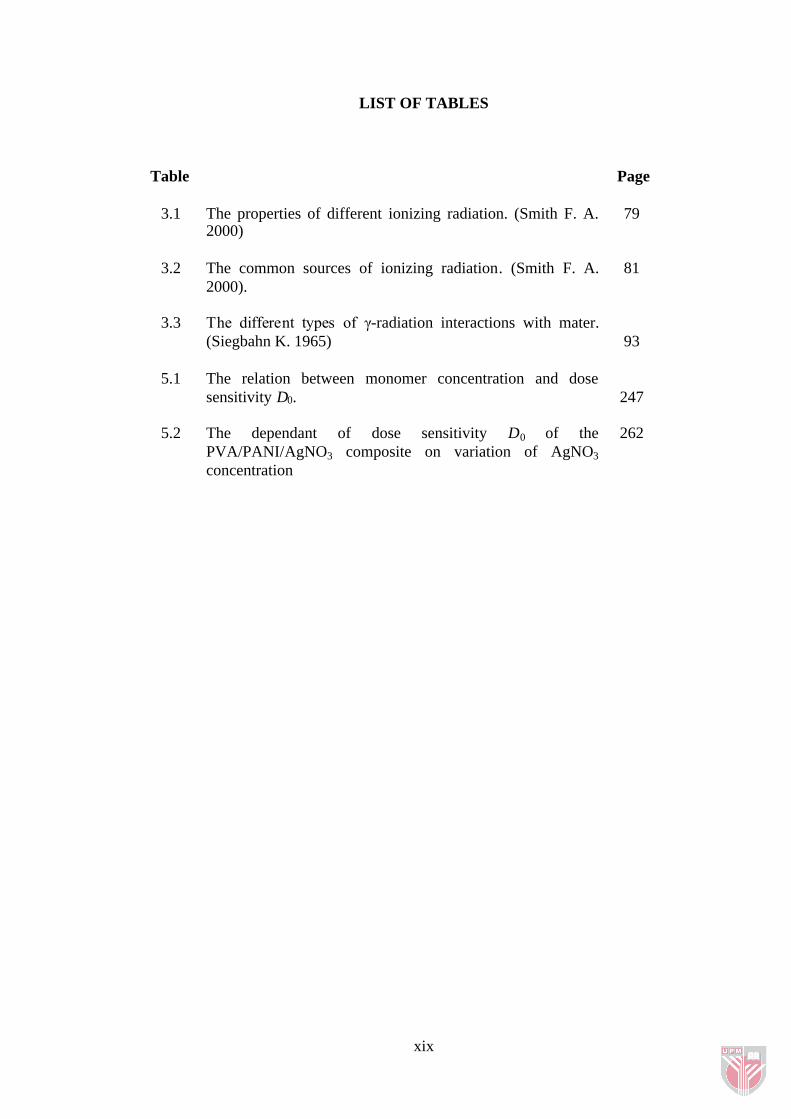
3.1 The properties of different ionizing radiation. (Smith F. A.2000)
79
3.2 The common sources of ionizing radiation. (Smith F. A.2000).
81
3.3 The different types of γ-radiation interactions with mater.(Siegbahn K. 1965) 93
5.1 The relation between monomer concentration and dosesensitivity D0. 247
5.2 The dependant of dose sensitivity D0 of thePVA/PANI/AgNO3 composite on variation of AgNO3concentration
262
xx
LIST OF FIGURES
Figure Page
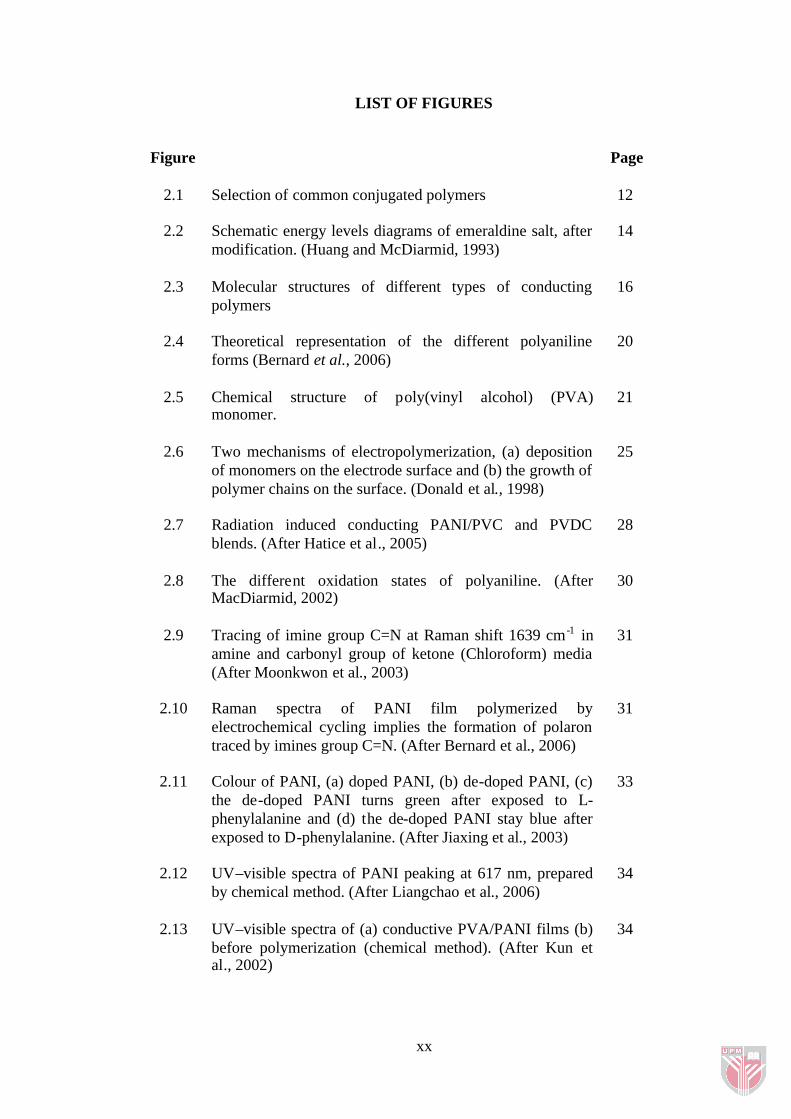
2.1 Selection of common conjugated polymers 12
2.2 Schematic energy levels diagrams of emeraldine salt, aftermodification. (Huang and McDiarmid, 1993)
14
2.3 Molecular structures of different types of conductingpolymers
16
2.4 Theoretical representation of the different polyanilineforms (Bernard et al., 2006)
20
2.5 Chemical structure of poly(vinyl alcohol) (PVA)monomer.
21
2.6 Two mechanisms of electropolymerization, (a) depositionof monomers on the electrode surface and (b) the growth ofpolymer chains on the surface. (Donald et al., 1998)
25
2.7 Radiation induced conducting PANI/PVC and PVDCblends. (After Hatice et al., 2005)
28
2.8 The different oxidation states of polyaniline. (AfterMacDiarmid, 2002)
30
2.9 Tracing of imine group C=N at Raman shift 1639 cm -1 inamine and carbonyl group of ketone (Chloroform) media(After Moonkwon et al., 2003)
31
2.10 Raman spectra of PANI film polymerized byelectrochemical cycling implies the formation of polarontraced by imines group C=N. (After Bernard et al., 2006)
31
2.11 Colour of PANI, (a) doped PANI, (b) de-doped PANI, (c)the de-doped PANI turns green after exposed to L-phenylalanine and (d) the de-doped PANI stay blue afterexposed to D-phenylalanine. (After Jiaxing et al., 2003)
33
2.12 UV–visible spectra of PANI peaking at 617 nm, preparedby chemical method. (After Liangchao et al., 2006)
34
2.13 UV–visible spectra of (a) conductive PVA/PANI films (b)before polymerization (chemical method). (After Kun etal., 2002)
34
xxi
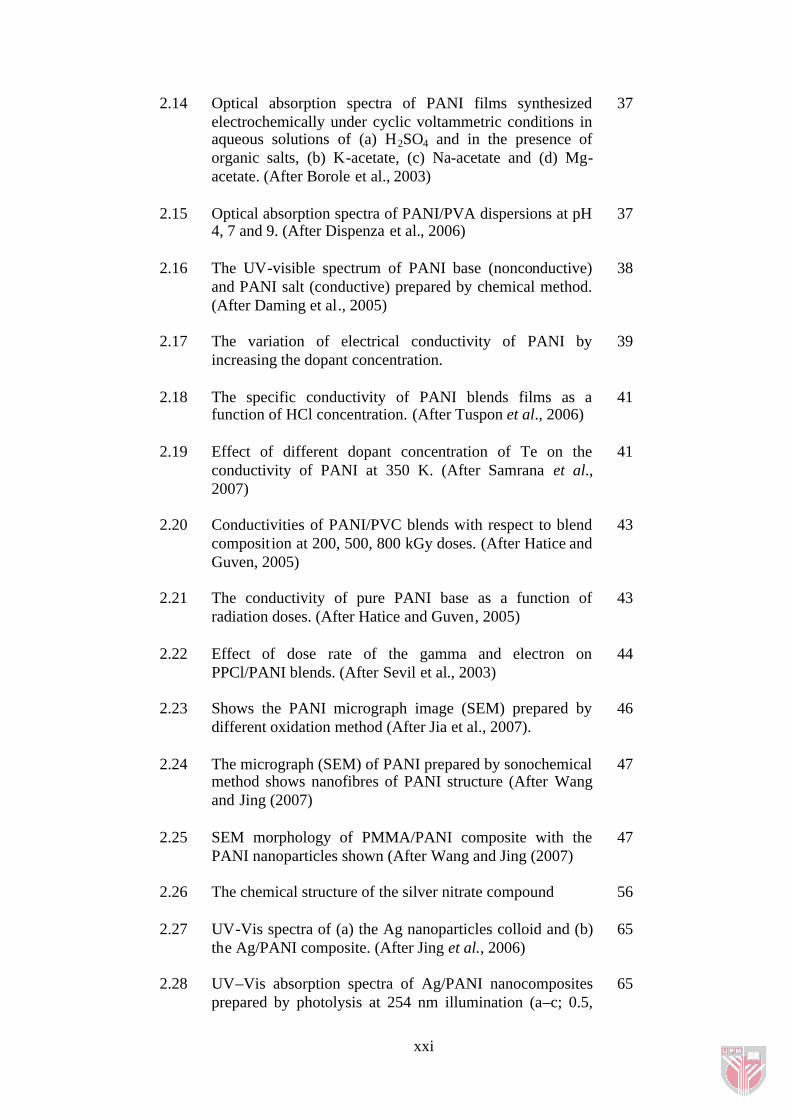
2.14 Optical absorption spectra of PANI films synthesizedelectrochemically under cyclic voltammetric conditions inaqueous solutions of (a) H2SO4 and in the presence oforganic salts, (b) K-acetate, (c) Na-acetate and (d) Mg-acetate. (After Borole et al., 2003)
37
2.15 Optical absorption spectra of PANI/PVA dispersions at pH4, 7 and 9. (After Dispenza et al., 2006)
37
2.16 The UV-visible spectrum of PANI base (nonconductive)and PANI salt (conductive) prepared by chemical method.(After Daming et al., 2005)
38
2.17 The variation of electrical conductivity of PANI byincreasing the dopant concentration.
39
2.18 The specific conductivity of PANI blends films as afunction of HCl concentration. (After Tuspon et al., 2006)
41
2.19 Effect of different dopant concentration of Te on theconductivity of PANI at 350 K. (After Samrana et al.,2007)
41
2.20 Conductivities of PANI/PVC blends with respect to blendcomposition at 200, 500, 800 kGy doses. (After Hatice andGuven, 2005)
43
2.21 The conductivity of pure PANI base as a function ofradiation doses. (After Hatice and Guven, 2005)
43
2.22 Effect of dose rate of the gamma and electron onPPCl/PANI blends. (After Sevil et al., 2003)
44
2.23 Shows the PANI micrograph image (SEM) prepared bydifferent oxidation method (After Jia et al., 2007).
46
2.24 The micrograph (SEM) of PANI prepared by sonochemicalmethod shows nanofibres of PANI structure (After Wangand Jing (2007)
47
2.25 SEM morphology of PMMA/PANI composite with thePANI nanoparticles shown (After Wang and Jing (2007)
47
2.26 The chemical structure of the silver nitrate compound 56
2.27 UV-Vis spectra of (a) the Ag nanoparticles colloid and (b)the Ag/PANI composite. (After Jing et al., 2006)
65
2.28 UV–Vis absorption spectra of Ag/PANI nanocompositesprepared by photolysis at 254 nm illumination (a–c; 0.5,
65
xxii
1.5 and 2M silver nitrate solution used for reaction. (AfterKhanna et al., 2005)
2.29 The UV–visible spectra of a few samples of solutionirradiated with 6 MeV electrons at different fluencies in therange 2 × 10¹³ – 3 × 1015 cm−2. (After Bogle et al., 2006)
66
2.30 XRD patterns of the PVA and PVA/Ag nanocompositefilms. (After Yu et al., 2006)
68
2.31 XRD patterns of the Ag/thiophere nanocomposites. (AfterLee et al., 2007)
68
2.32 XRD patterns of the Ag/PANI nanocomposites. (After Jinget al., 2006)
69
2.33 SEM image of silver nanoparticles synthesized byirradiating a mixture of AgNO3 and PVA solutions with 6MeV electrons at a fluence of 2 × 10¹³ e cm−2. (After Bogleet al., 2006)
70
2.34 Morphology structures of (a) SEM and (b) TEM images ofthe Ag/PANI nanocomposites. (After Jing et al., 2006)
71
2.35 SERS, emission and Raman inelastic scattering spectra forvarious dye molecules adsorbed on Ag nanoparticles (a)rhodamine (3 molecules/particle), (b) rhodamine (30molecules/particles, (c) crystal violet (30molecules/particle), and (d) malachite green (300molecules/particle). (After Maruyama and Futamata, 2005)
73
2.36
2.37
The lanthanide-coated silver colloids showing lanthanideluminescance increased over 10-fold and the lifetimereduced by 10-fold. (After Aslan et al., 2005)
Electroluminescence enhancement of surface plasmon-enhanced Si light-emitting diode, before and after thedeposition of of Ag islands and ZnS over-coating. (AfterCatchpole and Pillai, 2006)
74
75
3.1 Decay scheme of Co60 radioisotope which ends by Nicle-60 stable. Another frequently used γ-ray source is cesium-137, a fission product from nuclear reactors. The energy ofthe emitted photon is 662 keV and the half-life is 30.17years. Nuclear reactors themselves are potential sources ofγ-rays.
83
3.2 Schematic diagram of photoelectric absorption of γ-radiation resulting in ejection of orbital electron from Lshell leading to ionization process of an atom.
86

xxiii
3.3 Schematic diagram of Compton scattering for γ-radiationresulting in ionization and scattering of the incident photonwith less energy.
88
3.4 Schematic diagram of Pair Production process for γ-radiation being interfered in the nucleus field and orbitalelectron to produce triplet particles
90
3.5 The expected irradiation results of the organic molecules,where R. and S. are free radicals and M and N aremolecular products.
95
3.6 Schemes for grafting process for polymer A with monomerB using -radiation.
98
3.7 Schemes for electron beam interaction with sample and thesubsequent scattering types.
99
3.8 Steps of electron beam production, interaction with sampleand the detection of the scattered secondary electron.
103
3.9 Scheme for light photon interaction with matter, giving itsenergy to electron which set in excitation state.
108
3.10 The possible electronic transition for the electrons at ,and n bonds
114
3.11 Schematically illustrates the sequence of direct electronictransitions from the initial state i to the final state f, or byan indirect process in which the intermediate state k ispopulated by scattering and relaxation of ‘‘hot’’ electrons,which are photo-excited in the substrate.
120
3.12 Schemes for UV-visible spectroscopy principle and stepsof taking the spectra.
122
3.13 The different possibilities of visual light scattering:Rayleigh scattering (no Raman effect), Stokes scattering(molecule absorbs energy) and anti-Stokes scattering(molecule loses energy)
127
3.14 The principle of Raman spectroscopy sample process(Fadini, 1989)
129
3.15 The Cole-Cole plot representation of the Debye equation. 134
3.16 The resultant Cole-Cole plot of really impedance Z’ versusimaginary impedance Z”.
137
xxiv
4.1 γ-irradiation system model (J. L. Sherperd) at theMalaysian Nuclear Agency, Bangi
142
4.2 The change of colour of the irradiated (a) PVA/AniHClcomposites and (b) PVA/AniHCl/AgNO3 composites afterirradiating with different doses at 30 kGy and 50 kGy.
143
4.3 The sample set up and the XRD system model 7602EA,Philips. Faculty of Science, Department of Physics-UPM
145
4.4 The UV-visible spectrophotometer model Camspec M530.Faculty of Science, Department of Physics-UPM.
147
4.5 Raman system and its accessories for sample set up andcharacterization, Faculty of Science, department of Physics- UPM
148
4.6 The LCR-meter model HP 4284A with the sample set upfor conductivity measurement. Faculty of Science,department of Physics - UPM
150
5.1 Conducting PANI in polyemeraldine (EB) structurerepresents the polaron species induced by radiation dopingshowing N+ ions within the imines doped by Cl- ions.
154
5.2 PANI in polypernigraniline (PB) structure represents thepolaron species induced by radiation doing showing N+
ions within the imines doped by Cl- ions.
154
5.3 SEM micrographs of PANI nanoparticles polymerized by50 kGy Co-60 γ-rays for 28.6 wt% monomer, taken (a)after preparation (b) 5month later.
158
5.4 SEM micrographs of 28.6 wt% AniHCl of PVA/PANInanocomposites polymerized by radiation at 50 kGyillustrating (a) the residual of HCl appear on theforeground and (b) the rectangle crystalline structure ofHCl.
161
5.5 SEM micrograph of Ag0 nanoparticles induced by -radiation at 50 kGy dispersed in PVA matrix
163
5.6 SEM, micrograph of PANI/Ag0 nanoparticles dispersed inPVA matrix film irradiated at 50 kGy.
165
5.7 XRD patterns of pure PVA irradiated at different doses 168
5.8 XRD patterns of PVA/PANI nanocomposites at differentdoses.
168