university of birmingham visco-plasticity during in-situ
TRANSCRIPT

University of Birmingham
Visco-plasticity during In-situ Cooling fromSolidification of a Nickel-Base Single CrystalSuperalloy using Neutron DiffractionD'Souza, Neil; Kelleher, Joe; Kabra, Saurabh; Panwisawas, Chinnapat
DOI:10.1016/j.msea.2016.11.013
License:Creative Commons: Attribution-NonCommercial-NoDerivs (CC BY-NC-ND)
Document VersionPeer reviewed version
Citation for published version (Harvard):D'Souza, N, Kelleher, J, Kabra, S & Panwisawas, C 2017, 'Visco-plasticity during In-situ Cooling fromSolidification of a Nickel-Base Single Crystal Superalloy using Neutron Diffraction', Materials Science andEngineering A, vol. 681, pp. 32-40. https://doi.org/10.1016/j.msea.2016.11.013
Link to publication on Research at Birmingham portal
Publisher Rights Statement:Checked for eligibility: 04/11/2016
General rightsUnless a licence is specified above, all rights (including copyright and moral rights) in this document are retained by the authors and/or thecopyright holders. The express permission of the copyright holder must be obtained for any use of this material other than for purposespermitted by law.
•Users may freely distribute the URL that is used to identify this publication.•Users may download and/or print one copy of the publication from the University of Birmingham research portal for the purpose of privatestudy or non-commercial research.•User may use extracts from the document in line with the concept of ‘fair dealing’ under the Copyright, Designs and Patents Act 1988 (?)•Users may not further distribute the material nor use it for the purposes of commercial gain.
Where a licence is displayed above, please note the terms and conditions of the licence govern your use of this document.
When citing, please reference the published version.
Take down policyWhile the University of Birmingham exercises care and attention in making items available there are rare occasions when an item has beenuploaded in error or has been deemed to be commercially or otherwise sensitive.
If you believe that this is the case for this document, please contact [email protected] providing details and we will remove access tothe work immediately and investigate.
Download date: 21. Dec. 2021

Visco-plasticity during In-situ Cooling from Solidification of a Nickel-Base
Single Crystal Superalloy using Neutron Diffraction
Neil D’Souza1, Joe Kelleher2, Saurabh Kabra2, Chinnapat Panwisawas3*,*
1Rolls-Royce plc, PO Box 31, Derby, DE24 8BJ, UK
2ISIS Neutron and Muon Source, Science and Technology Facilities Council, Rutherford
Appleton Laboratory, Harwell, Oxford, Didcot OX11 0QX, UK
3School of Metallurgy and Materials, University of Birmingham, Birmingham B15 2TT, UK
*Corresponding author: [email protected]
Abstract
In-situ neutron diffractometry is performed to study the visco-plasticity in a nickel-base
single crystal superalloy during in-situ cooling from high temperatures. It is found that visco-
plastic deformation has two contributions from creep and stress relaxation, which are subject
to the accumulation of dislocation activity and dislocation annihilation, respectively. Use has
been made of the lattice strain evolution of the (200) γ + γ′ peak to confirm this effect. The
decrease in lattice strain and macro-stress during in-situ cooling has been observed and
confirms that there was softening taking place before thermal strain dominates at lower
temperatures. Therefore, in-situ isothermal cyclic loading and relaxation tests under strain
control, akin to thermal contraction during casting, have been carried out. A visco-plasticity
law was then developed based on macro-strain development during creep and lattice strain
evolution during stress relaxation within an appropriate timescale, where transient effects are
captured. The constitutive law developed has been used to independently determine the

evolution of stress and strain during in-situ cooling. The implementation of these findings
into thermo-mechanical modelling during cooling from solidification is also discussed.
Key words: neutron diffraction; in-situ cooling; visco-plasticity; stress relaxation; lattice
strain
1. Introduction
Mechanical response during the investment casting of single-crystal superalloys is governed
by the thermo-mechanical histories induced by mechanical deformation arising from
differential thermal contractions of the metal (superalloy) and ceramic (mould and internal
core), under casting conditions [1, 2]. Cooling rates [3] and dendritic growth rates [4, 5] can
be controlled through optimising the furnace parameters and appropriate component design to
minimise defects in single-crystal castings that also conform to acceptable dimensional
tolerance. On cooling during and after solidification of a single crystal superalloy casting,
little is known about the in-situ introduction of high temperature deformation [6, 7] and the
quantification of processing-induced deformation [8]. To the best of the authors’ knowledge,
finite element calculations that determine thermo-mechanical behaviour are traditionally
contingent on the quality of the as-cast materials data and thermo-physical properties used in
the model [9]. Such an approach has advantages, as it confers a predictive capability on
turbine blade designers enabling them to produce a design space for achieving a minimal-
waste manufacturing route and design criteria with functional integrity.
Processing-induced plasticity can be introduced at temperatures close to the γ′ solvus
temperature in single crystal Ni-base superalloys [10 - 12]. In that study it was proposed that
2 – 3 % plasticity induced at high temperatures leads to a dislocation network [1], which

results in re-crystallisation during subsequent solution heat treatment to release the stored
strain energy within the microstructure. Typical mechanisms resulting in a reduction in the
dislocation density include creep and stress relaxation [13 - 19]. On the other hand, larger
stresses arising at lower temperatures can lead to other commonly encountered casting
defects, such as hot tears [20, 21]. For a prediction of such casting defects, it becomes
challenging to address how processing-induced plasticity should be quantitatively treated on
the one hand, as well as whether time-dependent plasticity should also be considered [1]. The
latter is important, since it is accompanied by relaxation and reduction in the stress and which
is dependent on the time that the casting resides in the critical temperature regime during
cooling [3].
Materials modelling used in thermo-mechanical analysis follows usually plastic flow (time
independent) or visco-plastic flow (time dependent) approaches, the applicability of which
depends upon the working temperature regimes [22, 23]. Within process modelling of
investment casting, owing to the limited high temperature materials data, the extrapolation of
intermediate temperature tests permits the elasto-plastic analysis to be performed. Uniaxial
tensile or compression testing using constant strain rate at elevated temperatures is
conventionally carried out to derive the empirical or phenomenological laws for plastic flow
for use in this analysis [1]. However, the predictive capability can be further improved by
taking into account visco-plasticity [3]. Visco-plasticity is conventionally incorporated
through consideration of secondary (steady state) creep testing using constant stress at
elevated temperature. Although creep has technological significance [24 - 28] and offers a
convenient means of including visco-plasticity in the analysis, it is not altogether relevant to
investment casting process modelling. The principal objections here are related to the
material condition, i.e. as-cast, segregated and not homogenous, but also the fact that visco-

plastic behaviour has to be considered at small time scales to accurately capture the
stress/strain transients during cooling, i.e. few minutes as compared to hours [3].
On the other hand, advent of in-situ testing capabilities equipped with synchrotron [29, 30] or
neutron [31, 32] light sources provide substantial benefits for the observation of lattice strain
evolution, which dictates the underlying macroscopic response at the component level.
Following such an approach, the aim in this study is therefore three-fold.
First, neutron diffraction experiments are used to investigate the processing-induced visco-
plasticity during the in-situ cooling of uniaxial tensile samples under representative casting
conditions. Towards this end, the strain control mode was employed, where the length of the
sample is fixed during cooling, which is akin to metal freezing around a rigid (immovable)
ceramic core. As mentioned before, to capture the transients in stress/strain during cooling it
is required to use a small neutron data acquisition time, but without compromising the error
in strain measurement. Our previous work [31] has used 10 mins acquisition time; however
more recently a lower acquisition time of 3 mins has been observed to be statistically reliable
[32]. Additionally, from the measurement of macro-stress a key insight will be obtained on
the efficacy of this choice of lower acquisition time, as the micro-strain directly measured
using diffraction can be compared with the macro-strain deduced from the stress.
Second, isothermal relaxation testing is carried out to rationalise the visco-plasticity and
stress relaxation behaviour at 950oC and 1000oC, and corresponds to the temperature range of
the cooling experiments. Using the discrete data, best-fit equations for creep and stress
relaxation can be obtained to quantify the visco-plasticity over the stress and temperature
range, which is akin to the creep modelling approach that has been conventionally adopted [1
– 3]. Using these equations the visco-plasticity can be calculated during cooling and

subsequently compared with the experimentally measured values. The rationalisation of
process-induced visco-plasticity during cooling from solidification is then discussed.
One criticism for such an approach is that during solidification and subsequent cooling, alloys
might not have not reached kinetic equilibrium and γ/γ′ might not possess a good coherent
relationship. It has been however demonstrated that γ′ precipitation kinetics is diffusion
controlled and therefore accompanied by interfacial equilibrium [33]. Consequently, the
coherency is unaffected, as this is determined by the interfacial composition. On the other
hand, the other important drawback of using isothermal creep/relaxation tests to determine
visco-plasticity is to ignore the history dependence of the prior deformation existing within
the solid, as it has cooled to the given temperature. One possible way of taking this into
account was by adopting the cyclic relaxation tests, where the deformation in prior cycles is
incorporated within the relaxation tests. Therefore, a third and important objective is to assess
the validity of using isothermal loading tests by re-heating to calculate visco-plasticity. This
is achieved by directly comparing the experimentally measured visco-plastic strain in the in-
situ cooling experiments to that predicted using the relaxation/creep tests.
Implications of this work will be beneficial for establishing a better mesoscopic description
for the process modelling of investment casting by examining the conditions in which this
approach can be adopted.
2. Method
2.1 Material
Tensile test pieces with a diameter of 5.85 mm and a gauge length of 29 mm of CMSX4
(nominal composition in Table 1) following the design used in [31], have been fabricated

using the state-of-the-art investment casting process at the Precision Casting Facility (PCF),
Rolls-Royce plc, Derby, UK. Prior to casting, moulds were seeded with the required
orientation to ensure an axial orientation of the single crystals to within 5° from [100]. The
single crystals were then directionally solidified in a small-bore furnace using a withdrawal
rate of 5 × 10⁻⁵ m/s. In this manner, the orientation of the seed was conferred on to the test
pieces that subsequently solidified; more details are included in [31]. Tensile bars were
subject to electro-discharge machining (EDM) at the shoulders and grips, but the gauge
length portion remained in the as-cast condition.
2.2 Neutron diffraction measurement
A series of samples were examined during in-situ heating, loading and subsequent relaxation
of stress on the ENGIN-X instrument, at the ISIS pulsed neutron facility, Rutherford
Appleton Laboratory, Didcot, UK. An optical furnace was used to heat the samples in air and
a K-type thermocouple was held in contact with the sample to monitor temperature profiles.
Isothermal stress relaxation tests were conducted at two temperatures, 950°C and 1000°C.
The samples were heated at a ramping rate of 10 °C/min up to 800°C and thereafter at a rate
of 5 °C/min to the set temperatures. Prior to loading, each sample was held at the requisite
testing temperature for nine minutes for thermal equilibrium and also to get the extensometer
stabilised. At each temperature, a range of initial tensile stresses were used for stress
relaxation testing and the stresses were applied at a rate a strain rate of 0.2% min-1.
Specifically, the loading started with a relatively small stress and dwelt at the stress for nine
minutes under load control, which was then followed by stress relaxation under strain control
mode for an additional 12 minutes. The initial stress was then increased by an increment of
10 MPa from the previous applied stress before another dwelling and stress relaxation test
was conducted. The predicted stress ranges derived from a previous modelling study of

solidification and cooling of simple one-dimensional and three-dimensional bobbin-type
geometries has been taken as a reference for the selection of the initial stress for each
temperature [2, 3].
The loading axis in these experiments was horizontal and at 45° to the incident beam,
allowing simultaneous measurement of lattice spacing both parallel and perpendicular to the
loading axis. The samples were mounted such that the stress was applied along specimen
axis. The positioning of the rig was such as to yield the longitudinal lattice spacing in one
detector and the transverse lattice displacement in the other. The detectors were fixed at 90°
to the incident beam and the data are obtained from the full ± 15° detector bank [31]. In all
cases the neutron measurement volume was typically of the order of few cubic mm [34]. For
the single crystal to be correctly aligned measurements are taken and the sample subsequently
rotated until the desired lattice planes, in this (100) and (010), are located in the north-bank
and south-bank detector respectively. At time-of-flight sources, such as ISIS, neutron pulses
each with a continuous range of velocities and therefore wavelengths are directed at a
specimen. The flight times of diffracted neutrons are measured and the wavelengths are then
calculated. In Ni-base alloys, since γ (A1) and γ/ (L12) have almost identical lattice
parameters, any fundamental reflection obtained in the experiment are produced from both
phases. However, since γ/ possesses an ordered structure primitive cubic lattice, additional
super-lattice reflections are also observed. Thus the position of the first-order (100) [(hkl),
where h, k and l are mixed] can be determined unequivocally, from which the (200) γ + γ/
doublet peak can be fitted using a constrained double peak fit [34]. The doublet analysis was
carried out using routines written in the OpenGenie software with the appropriate peak shape
[35].
2.3 Data analysis

In the current study, the stress relaxation tests were carried out under strain-control mode.
The elastic (lattice) strain, 𝜀el , during stress relaxation could be calculated using the
following equation:
𝜀el = (𝑑 − 𝑑0)/𝑑0 (1)
where d0 is the stress-free lattice spacing and d is the lattice spacing at any instant under load.
With neutron diffraction, both the d-spacing for (100) crystal planes of γ/ (L12) (d100) and that
for (200) crystal planes of (γ+ γ/) (d200) could be identified. The stress relaxation tests lasted
12 mins and the data acquisition time was 3 mins (i.e., Δt = 0, 3, 6, 9 and 12 mins). By
calculating the relaxation strain, εrel for different durations, under different temperatures and
stress levels, it is possible to derive the dependence of strain rate (or strain) on temperature,
stress time and microstructure. The strain rate equation is anticipated to be in the form;
𝜀̇rel = 𝜀̇rel(𝑡,𝑇(𝑡),𝜎,𝝁) (2)
Here, 𝝁 is referred to microstructural parameters [24, 25, 28], which is not considered for
now. The experimental data is to be fitted using a power law equation for the stress and strain
development during relaxation and within a time interval of up to 12 mins;
ε̇rel(T) = A0 exp(−Q
RT) (
σσ0
)n 𝑡𝑚
where A = A(T) = A0 exp(− QRT
), n = n(T) and m = m(T) are temperature dependent. In
addition to in-situ isothermal testing, in-situ cooling tests were also performed for two
different initial stresses of 350 MPa and 280 MPa, respectively. The sample was heated from
room temperature to 1000°C and following an isothermal hold for 9 mins. A tensile stress
was then applied and the sample was held for another 9 mins under load control prior to
cooling. Cooling was carried out at a nominal rate of 1 °C min-1. For this test, the sample was

held under strain control mode to simulate the real strain development during casting. During
casting, the metal solidifies and cools in a ceramic mould and hence contraction of metal
around a rigid ceramic will place the metal in a state of tension [1]. This is similar to what
occurs in the cooling experiment performed under strain control, where the contraction of the
sample is severely constrained by the Instron grips. The initially applied stresses of 350 MPa
and 280 MPa are equivalent to the range of stresses that would have developed in the metal
during solidification down to 1000°C [2, 3].
The experimental conditions of cooling under an initially applied axial load lend itself to an
elementary one-dimensional analysis, from which the stress and strain development during
cooling can be calculated;
𝜀 = 𝜀th + 𝜀el + 𝜀vp
𝜎 = 𝐸𝜀el
𝜀th = 𝛼(T− Tref)
εvp = �dεvp
dtdt
∆t
0
Here,
∆𝜀 = ∆𝜀th + ∆𝜀el + ∆𝜀vp, (3)
where α is the thermal expansion coefficient, ∆ε is the change in strain during cooling from T
to [T - ∆T] in time interval ∆t (∆T > 0) and ∆𝜀vp is the visco-plastic strain. For un-restrained
(free) contraction, ∆ε = α ∆T and therefore, ∆σ = 0. However, for complete constraint ∆ε = 0
and for all other cases, ∆ε > 0. Since the cooling was done in the strain-control mode, ∆ε = 0
and Equation 3 can be modified as;

|∆𝜀th|− |∆𝜀el| = |∆𝜀vp|, (4)
where ∆𝜀th = 𝛼∆T and ∆𝜀el = ∆𝜎𝐸
. Therefore, from the experimentally measured ∆T and ∆σ,
the incremental visco-plastic strain during cooling between successive temperature intervals
can be calculated, where α = 15 × 10-6 K-1 in the temperature range [3].
3. Results
3.1 Stress build-up and visco-plasticity during continuous cooling
Figure 1 presents the evolution of stress with temperature during continuous cooling at a
nominal cooling rate of 1°C/min, where the initial stresses were, σi = 350 MPa (Figure 1(a))
and 280 MPa (Figure 1(b)), respectively. The measurement uncertainty in the measured stress
over the range of stresses considered in these experiments was 1160 Pa (i.e. 0.35% of the
applied load, which was in the range of 7.5 kN to 12 kN). In the first instance cooling was
carried in the temperature range, 900°C ≤ T ≤ 998°C and in the latter; 950°C ≤ T ≤ 996°C.
The initial stages of cooling were accompanied by a decrease in stress. For σi = 350 MPa,
stress decreases continuously by up to 105 MPa within 15 mins corresponding to the
temperature range, 984°C ≤ T ≤ 998°C. Whereas σi = 280 MPa, stress decreases continuously
by up to 9 MPa within 6 mins corresponding to the temperature range, 990°C ≤ T ≤ 996°C.
On further cooling, for σi = 350 MPa, stress remains nearly constant over the following
24 mins corresponding to the temperature range, 984°C ≤ T ≤ 957°C and thereafter
monotonically increases up to 900°C (termination of test). As for σi = 280 MPa stress
increases continuously (although there is one instance of local relaxation at between 974 and
976°C) up to 950°C (termination of test).

Figure 2 plots the visco-plastic strain calculated from the change in stress, i.e. ∆σE
= ∆εel with
temperature during cooling and corresponding to an initial stress of 350 MPa. On the other
hand, the elastic strain can also be measured directly from the axial (200) γ + γ′ micro-strain
by making use of the stress-free lattice spacing at the given temperature. The visco-plastic
strain in both cases is then calculated using Equation 4 and is also included in Figure 2 and
corresponding to the temperature range, 970°C ≤ T ≤ 1000°C. The contribution of the
uncertainty corresponding to the measured stress and the (200) lattice strain has also been
indicated. The uncertainty for the (200) lattice strain, ∆ε (200) = (∆d200 / d200), where ∆d200 is
the error in measurement of the (200) lattice spacing. It can be observed that there is very
good agreement between the visco-plastic strains calculated using either approach, even after
considering measurement uncertainty. This therefore implies that, ∆𝜎𝐸
= ∆𝜀el,macroscopic ≅
∆𝜀200. The good agreement between the macroscopic strain and the axial (200) lattice strain
arises since the axial orientation of the samples was within 5° from [100]. This implies that
(100) and (200) planes are near-normal to the applied axial stress. It follows importantly
therefore that it is appropriate to treat the (200) fundamental γ + γ′ peak as a composite peak
in the analysis without the need for de-convolution of γ from γ′ in (200). This aspect has been
also demonstrated in our previous studies [31].
The evolution of stress and strain during cooling was examined within a wide range of
applied stresses, (σ/σ0 > 1 and σ/σ0 < 1). Accordingly, Figures 3(a) and 3(b) present the
calculated visco-plastic strain with temperature during cooling and corresponding to initial
stresses of 350 MPa and 280 MPa respectively within the nominal temperature range, 950°C
< T < 1000°C. The following observations can be made and tabulated in Table 2. As for σi =
350 MPa, visco-plasticity is accompanied by a decrease in stress of 77 MPa within 6 mins in
the range, 994.5°C ≤ T ≤ 998°C, where ∆εvp = 4 – 6 × 10⁻⁴. Thereafter, ∆εvp ≈ 1 – 2 ×10⁻⁴ for

a further 9 mins in the range, 984°C ≤ T < 994.5°C. During the constant stress region
thereafter corresponding to a further time interval of 24 mins in the range, 957°C ≤ T <
984°C, there is a near ten-fold decrease in visco-plastic strain and ∆εvp = 0.6 – 0.9 ×10⁻⁴. On
further cooling in the range, 900°C ≤ T < 957°C, the stress (and elastic strain) begins to
increase. While σi = 280 MPa, visco-plasticity is accompanied by an initial decrease in stress
of 9 MPa within 6 mins in the range, 990°C ≤ T ≤ 996°C, where ∆εvp ≈ 10-4. Even though the
measurement uncertainty is half of the measured visco-plastic strain, thereafter during
subsequent cooling in the range, 950°C ≤ T ≤ 990°C visco-plasticity can be neglected and
accompanied by increasing stress. However, some visco-plasticity is observed in a small
temperature interval 974°C ≤ T ≤ 976°C, where ∆εvp ≈ 8 ×10⁻⁵. It is not clear for the exact
reason for this. A possible reason is the operation of a recovery mechanism, with the decrease
in elastic strain related to release of accommodation stress (also referred to as back-stress)
and as observed in the creep experiments of Coakley et. al. [36]. However, in this analysis it
must be emphasised that no attempt was made to separate out γ and γ′ contribution in the
(200) peak, as would be required for a detailed analysis of the micro-mechanism(s) involved.
3.2 Stress relaxation and creep strain from isothermal tests
Stress relaxation over a wide range of stresses was carried out under strain-control mode at
two representative temperatures of 950°C and 1000°C respectively. The initial stresses were
340 MPa and 280 MPa respectively with an increment of 10 MPa and the measured lattice
strain case corresponds to the composite (200) γ + γ′ peak. Since the strain is dependent on
the stress and testing temperature, for a meaningful comparison at two different temperatures
and stresses, the initial applied stress has been normalised by the 0.2% yield stress, σ0 at that
temperature, i.e. σ/σ0. According to Equation 1, the evolution of lattice strain as a function of
stress can be calculated as shown in Figure 4. In Figure 4, the measurement uncertainty has

not been included for each measurement to retain clarity in the figure. In summary, the range
of measurement uncertainty for (200) lattice strain was 30 × 10-6 to 45 × 10-6 and 35 × 10-6 to
60 × 10-6 corresponding to the isothermal relaxation tests at 950°C (Figure 4(a)) and at
1000°C (Figure 4(b)) respectively.
Figure 5 then presents the evolution of lattice strain rate with σ/σ0 covering a range of some
typical stresses and corresponding to temperatures of 950°C (Figure 5(a)) and 1000°C
(Figure 5(b)), and included is the contribution of the measurement uncertainty in the (200)
lattice strain. At each temperature the extent of stress relaxation is significantly dependent on
the initial stress level. The higher the initial stress, the more pronounced the stress relaxation.
The data acquisition time for each neutron measurement was 3 mins and therefore the lattice
strain has been averaged over that time interval. For a given σ/σ0 and temperature, the strain
rate decreases beyond ∆t = 6 mins. However, the temporal dependence for the relaxation
strain rate is only prominent at 1000°C and for σ/σ0 > 0.92.
Since the relaxation strain rate at 950°C is nearly constant for σ/σ0 < 1 over the entire time
interval ( ∆𝜀̇rel < 10−6 ), a power law fit can be applied to obtain a best-fit for the
experimental data and is given in Table 3. It is clear that in this case the temporal dependence
is absent, i.e. m = 0. At 1000°C there exists a temporal dependence of strain rate for
σ/σ0 >> 0.92. Also, in the continuous cooling experiments the data acquisition time for each
measurement is 3 mins. Therefore, a power law fit is applied to obtain a best-fit for the strain
rate relaxation with σ/σ0, but for ∆t = 3 mins only at 1000°C. Therefore for such a best-fit, m
= 0, since the data is acquired over the time interval of 3 mins. A similar best-fit can be
obtained for time intervals of 6 mins, 9 mins and 12 mins, but relaxation in these time
intervals have little physical significance with regards to the cooling experiments, as the
transient stresses and strains will not be captured. Consequently for σ/σ0 < 1, the fitting
parameters for 𝜀̇rel are tabulated in Table 3.
On the other hand, at higher temperatures, creep strain can also become dominant. The creep
strain rate can be directly obtained from the isothermal hold at peak stress prior to relaxation
(see Section 2.2). Figures 6(a) and 6(b) plot the creep strain rate over the 9 mins isothermal
hold with σ/σ0 and referring to 950°C and 1000°C respectively. At each temperature the
creep strain rate is dependent on the initial stress and increases with σ/σ0 and temperature. At
1000°C, the creep rate is 5 – 10 times greater than at 950°C for a given σ/σ0. The temporal
dependence for the creep strain rate is only prominent at 1000°C and for σ/σ0 > 0.92. Like in
the case of stress relaxation, a best-fit power law curve can be applied to the creep rate and
the following fitting parameters are given in Table 3.
3.3 Contribution of stress relaxation and creep strain rate to visco-plasticity during
cooling
The relaxation or creep strain within a temperature interval, ∆T (or time interval ∆t) can be
calculated using the data in Table 3 as follows;
∆εrel/creep = A[σ(T)+σ(T−∆T)2σ0(T) ]𝑛∆t (5)
It is difficult to fit an Arrhenius type equation for the relaxation/creep strain rate over the
entire temperature interval because at least three temperatures are required. Therefore, using a
conservative approach the relaxation/creep strains calculated at 1000°C will be applied over
the temperature interval of 980°C ≤ T ≤ 1000°C and that calculated at 950°C will be applied
over the temperature interval of 950°C ≤ T ≤ 960°C. Implications of using such an approach
will be presented in the discussion section. Accordingly, the calculated relaxation/creep
strains in these temperature intervals are superimposed on the measured visco-plastic strain

in Figures 7(a) and 7(b) corresponding to the continuous cooling experiments, σi = 350 MPa
and σi = 280 MPa respectively. In the case of the measured visco-plastic strain, the
contribution of the uncertainty in measurement of the (200) lattice strain has been included.
On the other hand, in the case of the calculated relaxation strain, the measurement uncertainty
has been taken into consideration in obtaining the best-fit curve in Figure 5.
In summary, for σi = 350 MPa (σi > σ0) the visco-plasticity during initial 3 mins of cooling is
over-estimated by an order of magnitude by relaxation/creep in the range,
996.5°C ≤ T ≤ 998°C. Thereafter, there is good agreement between the measured visco-
plastic strain and the calculated relaxation/creep strain during subsequent cooling in the
temperature interval 987.5°C ≤ T ≤ 996.5°C, which is divided into the following sub-intervals
in Table 4. However, during subsequent cooling in 950°C ≤ T ≤ 987.5°C there is only a small
variation in stress (238 MPa ≤ σ ≤ 245 MPa) and in this case the relaxation/creep strains
under-estimate the visco-plastic strain by an order of magnitude. As for σi = 280 MPa (σi <
σ0), there is good agreement between the measured visco-plastic strain and the calculated
relaxation strain only in the initial stages of cooling in the temperature interval
990°C ≤ T ≤ 996°C. On further cooling in 950°C ≤ T ≤ 994°C the stress progressively
increases and visco-plasticity becomes negligible (uncertainty in strain measurements = 50
micro-strain = 5 × 10⁻⁵ and therefore strains below this threshold have to be ignored). In this
case, the creep strain initially over-estimates the visco-plastic strain in the temperature range,
980°C ≤ T ≤ 994°C, but thereafter in the temperature range, 950°C < T < 960°C
creep/relaxation is absent, which is consistent with the absence of visco-plastic strain on
cooling.
4. Discussion

During cooling, the thermal strain is accommodated by an elastic and visco-plastic
contribution. Visco-plasticity during cooling arises from stress relaxation/creep. Both creep
and relaxation are time dependent processes and although the micro-mechanisms are similar,
some differences exist [35]. From the isothermal loading tests it was observed that both creep
rate and the relaxation rate data could be represented by a power-law fit in the temperature
range of 950 – 1000°C. The acquisition time for a given neutron diffraction measurement was
3 mins. An increasing acquisition time results in greater fidelity of the reading for lattice
spacing, but this increasing time interval will fail to capture the transient stress/strain
evolution during cooling. Specifically, in the isothermal relaxation tests and corresponding to
the time interval of 3 mins, the uncertainty in (200) lattice strain, ∆ε200 is about 5 × 10⁻⁵ <<
∆εrel. Further, within this time interval, the decrease in relaxation strain rate from 1000°C to
950°C for a given σ/σ0 is three-fold. Also, the decrease in creep strain rate from 1000°C to
950°C is three-fold for σ/σ0 < 0.92, but increases rapidly for increasing σ/σ0.
It is therefore reasonable to apply the relaxation strain rate measured at 950°C to the
temperature interval, 950°C ≤ T ≤ 960°C and similarly that measured at 1000°C to the
temperature interval, 980°C ≤ T ≤ 1000°C, while accepting the fact that the relaxation strain
could be slightly over-estimated closer to 980°C. For σ/σ0 ≤ 0.92, it is reasonable to adopt a
similar approach as in the case of the relaxation rate for the applicability of the creep rate in
the two above-mentioned temperature ranges. Some comments can now be made with respect
to the calculated relaxation/creep strain with the measured visco-plastic strain during cooling.
In the calculation of the evolution of stress and strain during cooling an elementary 1D
approach was adopted, where the length of the sample is fixed (∆ε = 0) and all of the thermal
strain was accommodated elastically and visco-plastically. This approach was shown to be
valid, since the visco-plastic strain calculated from evolution of the axial stress during

cooling (∆σ/E) was equal to the directly measured (200) micro-strain from the changes in d-
spacing of the (200) lattice planes. In this case, all the samples were seeded such that the
axial orientation of the bars were within 5° from [100], i.e. the (200) planes were oriented
near-normal to the applied stress. The time interval for neutron data acquisition was 3 mins
and for a given cooling rate determines the temperature interval, ∆T within which the visco-
plastic strain is measured. When this is coupled with stress/relaxation creep, some important
points should be noted. When σ/σ0 > 1 (σi = 350 MPa), appreciable visco-plasticity is
observed within initial 3 mins of cooling; 998°C ≤ T ≤ 996.5°C, and relaxation/creep strain
significantly over-estimates this visco-plasticity. Unlike for σ/σ0 <1, there is a marked time-
dependence of relaxation/creep strain rate in the isothermal tests when σ/σ0 > 1. Therefore,
the given time interval is unable to capture the transient effects if the power law equation for
relaxation/creep (c.f. Table 4), which is used in conjunction with Equation 4. Consequently a
smaller time interval ∆ti << 3 mins is required to accurately calculate the contribution of
relaxation/creep to visco-plasticity during initial cooling. The relaxation/creep during initial 3
mins of cooling is then given by, ∆𝜀rel/creep = ∑𝜀(𝑡)̇ ∆𝑡𝑖 = ∫ 𝜀̇(𝑡)𝑑𝑡∆𝑡0 and ∆𝑡 = ∑∆𝑡𝑖 =
3 mins.
However, it is not possible to indefinitely decrease the time interval for calculation. A lower
acquisition time leads to greater measurement uncertainties and therefore an upper bound
exists for the time/temperature interval for calculations. During subsequent cooling in the
temperature range, 987.5°C ≤ T ≤ 996.5°C, relaxation/creep adequately accounts for visco-
plasticity during cooling (and is an order of magnitude greater than the uncertainty in
measurement of strain, ∆ε200 ≈ 5 × 10⁻⁵) thereby indicating the validity of the approach. It is
also important to emphasise that in this calculation the time interval for measurement does
not significantly bias the results, as summarised in Table 6 for an increase in time interval for
the calculations. On the other hand for when σ/σ0 < 1, (σi = 280 MPa), the visco-plastic strain

during initial cooling, 990°C ≤ T ≤ 996°C is comparable to the relaxation strain obtained from
isothermal tests. Like in the previous case, the time interval for measurement does not
significantly bias the results, as summarised in Table 7.
It follows from the preceding discussion that the visco-plastic strain during cooling for a
nominal cooling rate of 1 °C/s is well accounted for by relaxation/creep obtained from the
isothermal loading tests and corresponding to a time interval of 3 mins. On the other hand, at
lower temperatures when the visco-plastic strain measured during cooling is compared with
that calculated from the isothermal loading tests, there are some discrepancies that are
observed. These can be explained as follows. When σ/σ0 > 1 (σi = 350 MPa), dominant visco-
plasticity occurs through stress relaxation/creep. A reduction in barriers for dislocation
motion from thermally activated processes such as climb and cross-slip results in increased
dislocation glide and mobility. This occurs within γ-channels as well as in γ′ precipitates,
where in the latter stacking faults have been observed [31]. It is can be inferred that the
elimination of such barriers to dislocation motion persist to lower temperatures as well, since
on further cooling in the range, 957°C ≤ T ≤ 987.5°C, all of the thermal strain is
accommodated by relaxation/strain and the stress is constant, σ ≈ 245 MPa. However, such a
“history” dependence of the microstructure during cooling from higher temperature because
of the accompanying relaxation/creep to lower temperatures cannot arise in the isothermal
loading tests. Therefore, it is not unexpected that the stress relaxation/creep calculated for
these lower stresses in the isothermal tests under-estimates the extent of visco-plasticity
during cooling. On further cooling in the temperature range; 900°C ≤ T ≤ 957°C, no further
visco-plasticity is observed leading to stress build-up where all the thermal strain is
accommodated elastically; α∆T = ∆σE≈ 6.5 × 10⁻⁴ . When σ/σ0 < 1 (σi = 280 MPa), the
initial visco-plasticity that occurred through stress relaxation in the range,
990°C ≤ T ≤ 996°C, was subsequently absent on further cooling (i.e. ∆εvp < 5 × 10-5 =

measurement uncertainty) in the range, 950°C ≤ T ≤ 990°C. However in the range,
980°C ≤ T ≤ 990°C, stress relaxation from isothermal tests was ∼ 10-4 and therefore over-
estimating the visco-plasticity during cooling. In this case, it can be inferred that
modifications to the dislocation density arising during initial stress relaxation, where elastic
strain is converted into plastic strain plays a significant role in subsequently retarding
relaxation on further cooling. Like in the preceding case, the changing dislocation density
from prior relaxation plays a significant role on subsequent relaxation during cooling, which
will not captured in the isothermal loading tests.
Following from this discussion, there are some important aspects that need careful attention
during the computational modelling of solidification in Ni-base alloys. Specifically in lieu of
this study when stress relaxation/creep is used to calculate visco-plasticity for describing the
evolution of stress/strain in the temperature range of 900 – 1000°C. First, when the initial
stresses are high (σ/σ0 > 1), visco-plasticity is dominant and there is a larger temperature
range over which this approach can be used before the relaxation/creep strain under-estimates
visco-plasticity. Second, when the initial stresses are low (σ/σ0 < 1), relaxation is less
dominant and there is a very small temperature range beyond which the relaxation strain
over-estimates visco-plasticity. Lastly, it must be noted that below a certain temperature,
relaxation/creep strains calculated using the best-fit equations from the isothermal tests are
negligible. In this case all of the thermal strain is accommodated through an increase in
elastic stress and also the results agree with the directly measured visco-plastic strain during
cooling.
For more accurate calculation of visco-plasticity in-situ solidification experiments must be
performed, where it is possible in principle to directly measure the visco-plastic strain [37].
However, the only drawback in such cases is that the entire sample is melted and during

subsequent freezing the structure is polycrystalline. Therefore additional deformation
mechanisms, such as grain boundary sliding can occur and is less representative for single
crystals, which is the object of study in this article.
Conclusions
• The initially applied stress plays an important role in visco-plasticity during cooling.
• It was observed that the visco-plastic response during cooling arises from stress
relaxation and creep.
• Very good agreement is obtained for the visco-plastic strain measured directly from
the (200) lattice planes with that calculated from the macro-stress for axial
orientations close to [100].
• Modelling approaches that use such constitutive equations to calculate the evolution
of stress and strain during cooling from re-heating isothermal loading tests have to be
used with caution.
o Specifically, when the initial stresses are high, there is a larger temperature
range over which this approach can be used before the relaxation/creep strains
begin to under-estimate the visco-plasticity during cooling.
o For a lower initial stress there is a smaller temperature range beyond which
the relaxation strains over-estimate the visco-plasticity during cooling.
Acknowledgements
The authors acknowledge the help of Mr. Kevin Goodwin, Martin Perry and Dean Welton
from the Precision Casting Facility (PCF) for the manufacture of the tensile test pieces and
fixtures for the Instron machine. Dr. Chunlei Qiu of Cardiff University is also acknowledged
for assistance in one of the experiments.

References
[1] C. Panwisawas, H. Mathur, J.-C. Gebelin, D. Putman, C.M.F. Rae, R.C. Reed, Prediction
of recrystallization in investment cast single-crystal superalloys, Acta. Mater. 61 (2013) 51-
66.
[2] C. Panwisawas, J.-C. Gebelin, R.C. Reed, Analysis of the mechanical deformation arising
from the investment casting of directionally solidified and single crystal superalloys, Mater.
Sci. Technol. 29 (2013) 843 – 853.
[3] C. Panwisawas, Modelling and Prediction of Recrystallisation in Single Crystal
Superalloys, PhD Thesis, University of Birmingham, 2013.
[4] Z.L. Li, D.D. Zhang, X.L. Su, Q.Y. Xu, B.C. Liu, Role of as-cast dendritic microstructure
in recrystallization of a Ni-based single crystal superalloy, J. Alloys Comp. 660 (2016) 115 –
124.
[5] Z.L. Li, Q.Y. Xu, B.C. Liu, Microstructure simulation on recrystallization of an as-cast
nickel based single crystal superalloy, Comp. Mater. Sci. 107 (2015) 122 – 133.
[6] D.C. Cox, B. Roebuck, C.M.F. Rae, R.C. Reed, Recrystallisation of single crystal
superalloy CMSX-4, Mater. Sci. Technol. 19 (2003) 440-446.
[7] Z.L. Li, X.Y. Fan, Q.Y. Xu, B.C. Liu, Influence of deformation temperature on
recrystallization in a Ni-based single crystal superalloy, Mater. Lett. 160 (2015) 318 – 322.
[8] R.W. Salkeld, T.T. Field, E.A. Ault, Preparation of single crystal superalloys for post-
casting heat treatment. United States Patent 5413648 (1995).
[9] P. Carter, D.C. Cox, C.A. Gandin, R.C. Reed, Process modelling of grain selection during
the solidification of single crystal superalloy castings. Mater. Sci. Eng. A280 (2000) 233–
246.

[10] H.N. Mathur, Recrystallisation in single crystal nickel-based superalloys, PhD Thesis,
University of Cambridge, 2013.
[11] H.N. Mathur, C.N. Jones, C.M.F. Rae, A study on the effect of composition, and the
mechanisms of recrystallization in single crystal Ni-based superalloys. MATEC Web of
Conferences 14 (2014) 07003.
[12] L. Wang, F. Pyczak, J. Zhang, L.H. Lou, R.F. Singer, Effect of eutectics on plastic
deformation and subsequent recrystallization in the single crystal nickel base superalloy
CMSX-4, Mater. Sci. Eng. A 532 (2012) 487 – 492.
[13] M. Dupeux, J. Henriet, M. Ignat, Tensile stress relaxation behaviour of Ni-based
superalloy single crystals between 973 and 1273K, Acta Metall. 35 (1987) 2203 – 2212.
[14] H. Wang, B. Clausen, C. N. Tome, P. D. Wu, Studying the stress relaxation and creep on
lattice strain evolution of stainless steel under tension, Acta Mater. 61 (2013) 1179 – 1188.
[15] P. Feltham, Stress relaxation in alpha-iron at low temperatures, Phil. Mag. 67 (6) (1961)
847 – 850.
[16] B. Jakobson, H. F. Poulsen, U. Lienert, J. Bernier, C. Gundlach, W. Pantleon, Stability
of dislocation structures in copper towards stress relaxation investigated by high angular
resolution 3D X-ray diffraction, Phys. Stat. Sol. A 206 (2009) 21 – 30.
[17] Z.L. Li, J.C. Xiong, Q.Y. Xu, J.R. Li, B.C. Liu, Deformation and recrystallization of
single crystal nickel-based superalloys during investment casting, J. Mater. Proc. Technol.
217 (2015) 1-12.
[18] J. Meng, T. Jin, X.F. Sun, Z.Q. Hu, Effect of surface recrystallization on the creep
rupture properties of a nickel-base single crystal superalloy, Mater. Sci. Eng. A 527 (2010)
6119-6122.
[19] J.J. Moverare, S. Johansson, R.C. Reed, Deformation and damage mechanisms during
thermal–mechanical fatigue of a single-crystal superalloy, Acta. Mater. 57 (2009) 2266-2276.
[20] N. Wang, S. Mokadem, M. Rappaz , W. Kurz, Solidification cracking of superalloy
single- and bi-crystals, Acta Mater. 52 (2004) 3173 – 3182.
[21] J.-M. Drezet, B. Mireux, Z. Szaraz, T. Pirling, In-situ neutron diffraction during casting:
determination of rigidity point in grain refined Al-Cu alloys, Materials 7 (2014) 1165 – 1172.
[22] J.L. Chaboche, A review of some plasticity and viscoplasticity constitutive theories, Int.
J. Plast. 24(10) (2008) 1642–1693.
[23] J.-B. le Graverend, J. Cormier, F. Gallerneau, P. Villechaise, S. Kruch, J. Mendez, A
microstructure-sensitive constitutive modeling of the inelastic behavior of single crystal
nickel-based superalloys at very high temperature, Int. J. Plast. 59 (2014) 55–83.
[24] M. McLean, B.F. Dyson, Modeling the Effects of Damage and Microstructural
Evolution on the Creep Behavior of Engineering Alloys, J. Eng. Mater. Technol. 122 (2000)
273-278.
[25] A. Ma, D. Dye, R.C. Reed, A model for the creep deformation behaviour of single-
crystal superalloy CMSX-4, Acta. Mater. 56 (2008) 1657 – 1670.
[26] J. Cormier, G. Cailletaud, Constitutive modeling of the creep behavior of single crystal
superalloys under non-isothermal conditions inducing phase transformations, Mater. Sci.
Eng. A 527 (2010) 6300-6312.
[27] J. Coakley, D. Dye, H.C. Basoalto, Creep and creep modelling of a multimodal nickel-
base superalloy, Acta. Mater. 59 (2011) 854 – 863.
[28] Z. Zhu, H.C. Basoalto, N. Warnken, R.C. Reed, A model for the creep deformation
behaviour of nickel-based single crystal superalloys, Acta. Mater. 60 (2012) 4888 – 4900.

[29] D.M. Collins, D.J. Crudden, E. Alabort, T. Connolley, R.C. Reed, Time-resolved
synchrotron diffractometry of phase transformations in high strength nickel-based
superalloys, Acta Mater. 94 (2015) 244 – 256.
[30] D. Dye, J. Coakley, V.A. Vorontsov, H.J. Stone, R.B. Rogge, Elstic moduli and load
partitioning in a single-crystal nickel superalloy, Scr. Mater. 61 (2009) 109 – 112.
[31] N. D'Souza, J. Kelleher, C.L. Qiu, S.Y. Zhang, S. Gardner, R. E. Jones, D. Putman, C.
Panwisawas, The role of stress relaxation and creep during high temperature deformation in
Ni-base single crystal superalloys-Implications to strain build-up during directional
solidification, Acta. Mater. 106 (2016) 322-332.
[32] C.L. Qiu, N. D'Souza, J. Kelleher, C. Panwisawas, An experimental investigation into
the stress and strain development of a Ni-base single crystal superalloy during cooling from
solidification, Under review.
[33] M. P. Jackson, M. J. Starink, R. C. Reed, Determination of the precipitation kinetics of
Ni3Al in the Ni – Al system using differential scanning calorimetry, Mater. Sci. Eng. A. 264
(1999) 26 – 38.
[34] M.R. Daymond, M. Preuss, B. Clausen, Evidence of variation in slip mode in a
polycrystalline nickel-base superalloy with change in temperature from neutron diffraction
strain measurements, Acta Mater. 55 (2007) 3089 – 3102.
[35] F. A. Ackeroyd, R. L Ashworth, S. D. Johnston, J. M. Martin, C. M. Moreton-Smith, D.
S. Sivia, OpenGenie 1999.
[36] J. Coakley, R. C. Reed, J. L. W. Warwick, K. M. Rahman, D. Dye, Lattice strain
evolution during creep in single-crystal superalloys, Acta Mater. 60 (2012) 2729 – 2738.

[37] J.-M. Drezet, B. Mireux, Z. Szaraz, T. Pirling, In-situ neutron diffraction during casting:
Determination of rigidity point in grain refined Al-Cu alloys, Materials 7 (2014) 1165-1172.

Figure 1: Macroscopic stress evolution during the in-situ cooling experiment from the initial stresses of (a) 350 MPa and (b) 280 MPa. Given the scale on the Y-axis (MPa) and the magnitude of error (10-3 MPa), this error bar is barely noticeable.
(a)
(b)

Figure 2: Comparison between the measured visco-plastic strain from macro-stress data and
neutron measurement using the in-situ cooling from the initial stress of 350 MPa. There is
negligible error for visco-plastic strain obtained from measured stress, c.f. Figure 1 (a).
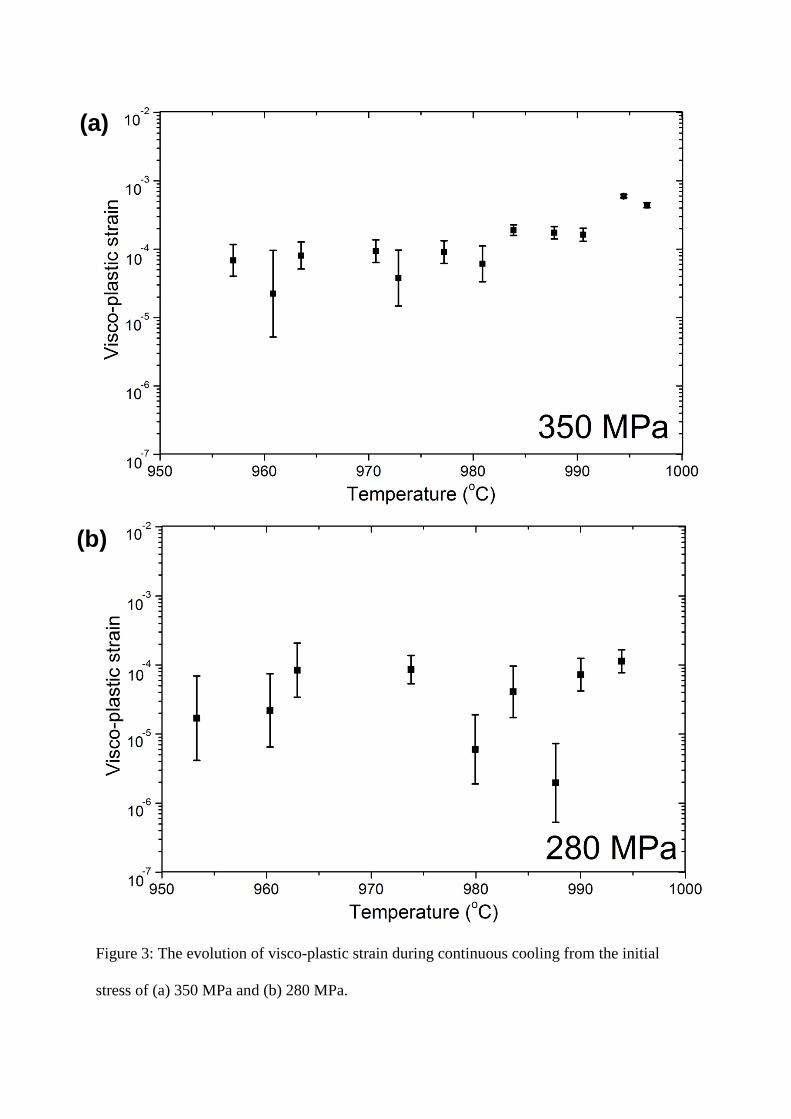
Figure 3: The evolution of visco-plastic strain during continuous cooling from the initial
stress of (a) 350 MPa and (b) 280 MPa.
(a)
(b)

Figure 4: Axial elastic response of γ and γ + γ′ phases during relaxation at 950oC and 1000oC
under strain control measurement.
(a)
(c)
(b)
(d)

Figure 5: Dependence of the calculated and fitting relaxation strain rate on stress and time at
(a) 950°C; and (b) 1000°C.
(a)
(b)

Figure 6: Dependence of the calculated and fitting creep strain rate on stress and time at (a)
950°C; and (b) 1000°C. No error bars included, as this pertains to the extensometer reading.
(a)
(b)

Figure 7: Comparison between the measured visco-plastic strain from macro-stress data, and
calculated creep and visco-plastic strains from neutron measurement from the initial stresses
of (a) 350 MPa and (b) 280MPa.
(a)
(b)

Table 1: The nominal compositions (in wt. %) of CMSX4 single-crystal superalloy.
Cr Co Mo Re W Al Ti Ta Hf Ni
6.5 9 0.6 3 6 5.6 1 6.5 0.1 Balance
Table 2: The evolution of calculated visco-plastic strain during in-situ cooling from two initial stresses.
σi (MPa)
∆𝛆𝐯𝐯 0 – 6 mins 6 – 15 mins 15 – 39 mins
350 [4 – 6 × 10⁻⁴] ± 0.35 ×
10-4 [1 – 2 ×10⁻⁴] ± 0.35 ×
10-4 [0.6 – 0.9 ×10⁻⁴] ± 0.35 ×
10-4
280 [0.8 – 1 × 10⁻⁴] ± 0.50 × 10⁻⁴
0 (only some localised visco-plasticity between 18 to 21 mins)
Table 3: Fitting parameters for the visco-plastic response for σ/σ0 < 1.
T (oC) �̇� ∆𝐭 (mins) A (s-1) n
950oC 𝜀̇rel for all ∆t 2 × 10⁻⁶ 10.2
ε̇creep for all ∆t 4 × 10⁻⁶ 12.3
1000oC 𝜀̇rel 3 mins 7 × 10⁻⁶ 12.2
ε̇creep 3 mins 2 × 10⁻⁵ 14
Table 4: Comparison between the measured visco-plastic strain and the calculated relaxation/creep strain during subsequent cooling from 350 MPa.
Temperature interval ∆𝛆𝐯𝐯 ∆𝛆𝐫𝐫𝐫 ∆𝛆𝐜𝐫𝐫𝐫𝐯
994.5°C ≤ T ≤ 996.5°C 5.8×10⁻⁴ ± 0.35 × 10⁻⁴ 4 × 10⁻⁴ 9.5 × 10⁻⁴
990.5°C ≤ T ≤ 994.5°C 1.6 × 10⁻⁴ ± 0.35 × 10⁻⁴ 0.9 × 10⁻⁴ 1.8 ×10⁻⁴
987.5°C ≤ T ≤ 990.5°C 1.7 × 10⁻⁴ ± 0.35 × 10⁻⁴ 0.6 × 10⁻⁴ 1.1 × 10⁻⁴

Table 5: Comparison between the measured visco-plastic strain and the calculated relaxation/creep strain during subsequent cooling from 280 MPa.
Temperature interval ∆𝛆𝐯𝐯 ∆𝛆𝐫𝐫𝐫 ∆𝛆𝐜𝐫𝐫𝐫𝐯
994°C ≤ T ≤ 996°C 1.1 × 10⁻⁴ ± 0.50 × 10⁻⁴ 1.7 × 10⁻⁴ 3.7 × 10⁻⁴
990°C ≤ T ≤ 994°C 0.8 × 10⁻⁴ ± 0.50 × 10⁻⁴ 1.2 × 10⁻⁴ 2.9 × 10⁻⁴
Table 6: Comparison between the measured visco-plastic strain and the calculated relaxation/creep strain during subsequent cooling from 350 MPa during the 6 min time interval.
Time interval (∆t) ∆𝛆𝐯𝐯 ∆𝛆𝐫𝐫𝐫 ∆𝛆𝐜𝐫𝐫𝐫𝐯
6 mins
(990.5°C ≤ T ≤ 996.5°C)
7.5× 10⁻⁴ ± 0.35 × 10⁻⁴ 6.6 × 10⁻⁴ 15 × 10-4
Table 7: Comparison between the measured visco-plastic strain and the calculated relaxation/creep strain during subsequent cooling from 280 MPa during the 6 min time interval.
Time interval (∆t) ∆𝛆𝐯𝐯 ∆𝛆𝐫𝐫𝐫 ∆𝛆𝐜𝐫𝐫𝐫𝐯
6 mins
(990°C ≤ T ≤ 996°C)
1.9 × 10⁻⁴ ± 0.50 × 10⁻⁴ 3.4 × 10⁻⁴ 7 ×10⁻⁴