university of houston clear lake unaudited … · clear lake unaudited annual financial report for...
TRANSCRIPT

UNIVERSITY OF HOUSTON CLEAR LAKE
UNAUDITED ANNUAL FINANCIAL REPORT
FOR THE YEAR ENDED AUGUST 31, 2006
WITH AUGUST 31, 2005 COMPARATIVE DATA

UNIVERSITY OF HOUSTON – CLEAR LAKE
TABLE OF CONTENTS
MISCELLANEOUS DATA SECTION
Letter Of Transmittal ................................................................I
Organizational Data .................................................................II
Statement Of Procedure Regarding Annual Financial Report ...........................III
PRIMARY STATEMENTS
Balance Sheet / Statement Of Net Assets - Proprietary Funds .......................1
Statement Of Revenues, Expenses, And Changes In Net Assets - Proprietary Funds ....2
Matrix Of Operating Expenses Reported By Function - Proprietary Funds .............3
Statement Of Cash Flows – Proprietary Funds .......................................4
Notes To The Financial Statements .................................................5
SUPPORTING STATEMENTS
SCHEDULE
1-A Schedule Of Expenditures Of Federal Awards ........................................6
1-B Schedule Of State Grant Pass – Throughs From/To State Agencies ....................7
2-A Miscellaneous Bond Information ....................................................8
2-B Changes In Bonded Indebtedness ....................................................9
2-C Debt Service Requirements ........................................................10
2-D Analysis Of Funds Available For Debt Service .....................................11
2-E Defeased Bonds Outstanding .......................................................12
2-F Early Extinguishment And Refunding ...............................................13
3 Reconciliation Of Cash In State Treasury .........................................14


UNIVERSITY OF HOUSTON – CLEAR LAKE
ORGANIZATIONAL DATA AUGUST 31, 2006
BOARD OF REGENTS Morgan Dunn O’Connor, Victoria Term Expires August 31, 2005* Robert B. Johnson, Houston Term Expires February 01, 2007 Michael J. Cemo, Houston Term Expires August 31, 2007 Raul A. Gonzalez, Austin Term Expires August 31, 2007 Leroy L. Hermes, Houston Term Expires August 31, 2007 Dennis D. Golden, O.D., Carthage Term Expires August 31, 2009 Lynden B. Rose, Houston Term Expires August 31, 2009 Calvin W. Stephens, Dallas Term Expires August 31, 2009 Jim P. Wise, Houston Term Expires August 31, 2011 Welcome W. Wilson, Sr., Houston Term Expires August 31, 2011 *Will remain on the Board until replacement is appointed OFFICERS OF THE BOARD (FISCAL YEAR 2006) Leroy L. Hermes Chair Michael J. Cemo Vice Chair Dennis D. Golden, O.D. Secretary OFFICERS OF THE BOARD (FISCAL YEAR 2007) Leroy L. Hermes Chair Michael J. Cemo Vice Chair Calvin W. Stephens Secretary ADMINISTRATIVE OFFICERS William A. Staples President Edward J. Hayes Senior Vice President and Provost Michelle P. Dotter Vice President for Administration
and Finance

III - 1
UNIVERSITY OF HOUSTON – CLEAR LAKE
FINANCIAL STATEMENTS (WITH DETAILED SUPPORTIVE SCHEDULES)
STATEMENT OF PROCEDURE REGARDING
ANNUAL FINANCIAL REPORT Present herein are the financial statements with detailed supportive schedules for the University of Houston – Clear Lake for the fiscal year ended August 31, 2006. These statements and detailed supportive schedules are in compliance with the guidelines in Reporting Requirements for Annual Financial Reports of State Agencies and Universities, published by the Texas Comptroller of Public Accounts. Additionally, this report has been prepared in accordance with the requirements contained in Governmental Accounting Standards Board Statement No. 34, Basic Financial Statements - and Management's Discussion and Analysis - for State and Local Governments. This detailed internal report supplements the annual financial report of the University of Houston System and is intended to be for limited distribution primarily to financial and academic officers of the University who need access to the details included herein; it also provides a historical record of transactions relating to this particular component institution. The financial report for the University of Houston System includes the primary statements on a combined, system-wide basis complete with explanatory notes. The State Auditor has not audited the accompanying annual financial statements and, therefore, an opinion has not been nor will be expressed on the financial statements and related information contained in this report. The information contained in the combined financial statements of the University of Houston System, and its related components, is part of and included in the State of Texas Comprehensive Annual Financial Report. The Annual Financial Report of the University of Houston System is reviewed by the State Auditor as part of the audit of the State of Texas Comprehensive Annual Financial Report, upon which an opinion is expressed.

Unaudited
University of Houston - Clear Lake Statement of Net Assets
August 31, 2006
Total 2006 Total 2005
AssetsCurrent Assets
Cash and Cash EquivalentCash on Hand $ 31,600.00 $ 31,600.00Cash in Bank 35,569.40 1,911,541.95Cash in State Treasury 4,337,523.04 6,049,128.12Cash Equivalents 21,835,323.58 18,041,816.38
Restricted:Cash and Cash Equivalent
Cash in Bank (1,950,197.25) (2,094,126.11)Loans and Contracts 1,844,627.18 1,701,689.31
Legislative Appropriations 3,970,137.76 3,757,341.92Receivables From:
Federal Receivables 1,159,464.49 1,411,277.37UHS Intercampus Receivables 10,126,212.80 9,606,743.00Accounts Receivable 3,042,426.88 1,278,078.01Other Receivables 12,745.72 406,276.17
Due From Agencies 123,114.53 131,023.18Consumable Inventories 21,390.33 18,513.67Deferred Charges 1,194,070.69 951,250.10
Total Current Assets 45,784,009.15 43,202,153.07
Non-Current AssetsRestricted:
UHS Intercampus Receivables 7,164,384.73 6,586,591.48Loans and Contracts 573,169.77 572,625.58
UHS Intercampus Receivables 5,871,649.55 5,222,722.00Capital Assets
Non-DepreciableLand and Land Improvements 9,437,721.74 9,437,721.74Other Capital Assets 1,789,121.12 1,729,121.12
DepreciableBuilding and Building Improvements 82,194,251.14 82,194,251.14
Less Accumulated Depreciation (45,615,479.32) (43,438,256.43)Infrastructure 8,722,088.76 8,722,088.76
Less Accumulated Depreciation (7,737,200.83) (7,656,905.09)Facilities and Other Improvements 793,275.18 793,275.18
Less Accumulated Depreciation (79,327.52) (39,663.76)Furniture and Equipment 9,249,098.29 11,080,100.20
Less Accumulated Depreciation (7,441,420.03) (9,052,409.21)Vehicles, Boats and Aircraft 578,721.27 505,231.27
Less Accumulated Depreciation (454,806.30) (426,739.90)Other Capital Assets 17,019,087.07 15,832,286.86
Less Accumulated Depreciation (10,505,123.65) (10,003,049.02)
Total Noncurrent Assets 71,559,210.97 72,058,991.92
Total Assets 117,343,220.12 115,261,144.99
1 - 1

Unaudited
University of Houston - Clear Lake Statement of Net Assets
August 31, 2006
Total 2006 Total 2005
LiabilitiesCurrent Liabilities
PayablesAccounts Payable 2,194,909.67 2,129,756.08Federal Payable 1,817.83 (5,419.09)Payroll Payable 2,557,648.19 2,406,945.89Other Payable 60,237.93 62,353.49
Deferred Revenues 15,233,710.57 14,009,753.86Revenue Bonds Payable 1,408,066.11 1,368,066.11Employees' Compensable Leave 717,878.62 686,194.29Funds Held for Others 1,087,315.61 2,017,825.57
Total Current Liabilities 23,261,584.53 22,675,476.20
Non-Current LiabilitiesRevenue Bonds Payable 29,331,958.60 30,740,024.71Employees' Compensable Leave 835,298.83 805,532.46
Total Non-Current Liabilities 30,167,257.43 31,545,557.17
Total Liabilities 53,428,841.96 54,221,033.37
Net AssetsInvested in Capital Assets, Net of Related Debt 27,642,814.20 28,080,981.06Restricted for:
Debt Retirement 218.04 430.05Capital ProjectsFunds Held as Permanent Investments
NonexpendableEndowment Funds 6,079,098.98 5,181,158.92
Other Restricted 1,465,910.19 1,238,658.63Unrestricted 28,726,336.75 26,538,882.96
Total Net Assets $ 63,914,378.16 $ 61,040,111.62
1 - 2

Unaudited
University of Houston - Clear LakeStatement of Revenues, Expenses and Changes in Net Assets
For The Year Ended August 31, 2006
Total 2006 Total 2005
Operating RevenuesSales of Goods and Services (PR-Chgs for Services)
Tuition and Fees $ 31,091,274.35 $ 29,148,454.62Tuition and Fees - Pledged 575,604.00 568,717.50
Discounts and Allowances (1,528,169.35) (1,927,399.04)Auxiliary Enterprise 1,376,252.31 1,370,195.06Other Sales of Goods and Services 1,195,822.81 1,231,405.74
Federal Revenue-Operating (PR-OP Grants/Contributions) 4,707,546.15 4,786,086.23Federal Pass Through Revenue (PR-OP Grants/Contributions) 244,665.00 366,296.72State Grant Revenue (PR-OP Grants/Contributions) 590,831.10 339,333.05State Grant Pass Through Revenue (PR-OP Grants/Contributions) 167,698.87 199,907.67Other Grants and Contracts-Operating (PR-OP Grants/Contributions) 639,345.19 374,380.48
Total Operating Revenues 39,060,870.43 36,457,378.03
Operating ExpensesInstruction 29,231,840.20 27,840,810.85Research 1,213,976.90 1,249,184.79Public Service 297,238.37 177,889.25Academic Support 9,330,824.43 8,706,986.19Student Services 2,435,493.96 2,443,693.48Institutional Support 11,830,006.28 11,484,068.21Operation & Maintenance of Plant 7,090,059.70 5,837,877.48Scholarships & Fellowships 4,304,134.14 3,800,799.22Auxiliary Enterprises 4,500,905.00 3,930,443.73Depreciation & Amortization 3,694,607.21 3,646,822.79
Total Operating Expenses 73,929,086.19 69,118,575.99
Operating Income (Loss) (34,868,215.76) (32,661,197.96)
Non-Operating Revenues (Expenses)Legislative Revenue (GR) 28,111,951.00 26,210,352.00Additional Appropriations (GR) 5,247,803.90 4,856,134.56Gifts (PR-OP Grants/Contributions) 549,119.87 382,847.61Interest and Investment Income (PR-Chgs for Services) 3,367,941.92 1,285,343.36Interest Expense and Fiscal Charges (1,292,604.23) (1,338,558.26)Gain (Loss) on Sale of Capital Assets (GR) (3,985.18)Other Non-Operating Revenue (Expenses) (PR-Chgs for Services) (1,372,935.69) (1,571,437.13)
Total Non-Operating Revenues (Expenses) 34,611,276.77 29,820,696.96
Income (Loss) before Other Revenues, Expenses, Gains, Losses and Transfers (256,938.99) (2,840,501.00)
2 - 1

Unaudited
University of Houston - Clear LakeStatement of Revenues, Expenses and Changes in Net Assets
For The Year Ended August 31, 2006
Total 2006 Total 2005
Other Revenues, Expenses, Gains, Losses and TransfersCapital Appropriation (HEAF) 4,000,892.00 3,853,447.00Additions to Permanent and Term Endowments 209,197.79 162,750.23UHS Intercampus Transfers-In 47,233.29 16,948.00UHS Intercampus Transfers-Out (898,581.33) (665,889.65)Transfers-In 809.30Transfers-Out (94,201.00) (75,874.00)Legislative Transfers-In 76,996.00 81,049.00Legislative Transfers-Out (207,812.00) (218,750.00)Legislative Appropriations Lapsed (2,519.22) (24,672.00)
Total Other Revenues, Expenses, Gains, Losses and Transfers 3,131,205.53 3,129,817.88
Change In Net Assets 2,874,266.54 289,316.88
Net Assets Beginning 61,040,111.62 70,263,509.79Restatements (9,512,715.05)
Net Assets Beginning, as Restated 61,040,111.62 60,750,794.74
Net Assets, Ending $ 63,914,378.16 $ 61,040,111.62
2 - 2

Unaudited
University of Houston - Clear LakeMatrix of Operating Expenses Reported by Function
For The Year Ended August 31, 2006
Public Academic StudentOperating Expenses Instruction Research Service Support Services
Cost of Goods Sold $ $ $ $ $Salaries and Wages 21,910,503.18 716,593.76 133,661.12 5,058,518.16 1,186,916.86Payroll Related Costs 4,637,637.68 111,228.12 24,747.30 1,183,705.64 316,304.76Professional Fees and Services 518,984.33 26,228.56 3,341.45 823,854.11 360,431.08Travel 117,553.04 40,644.05 5,790.65 273,822.49 18,569.64Materials and Supplies 675,897.79 147,937.31 41,544.62 1,121,849.90 379,870.66Communication and Utilities 299,721.50 8,513.71 248.21 155,293.14 48,875.07Repairs and Maintenance 72,267.31 5,537.29 3,057.89 338,617.01 20,119.52Rentals and Leases 117,295.53 2,375.75 29,468.13 40,724.33Printing and Reproduction 88,580.17 7,179.15 1,608.40 74,744.74 44,889.87Depreciation and AmortizationInterest 7,139.25 10.98 535.00 20.32Scholarships 454,515.54 4,000.00 5,998.05Claims and LossesOther Operating Expenses 331,744.88 143,728.22 83,238.73 264,418.06 18,771.85
Total Operating Expenses $ 29,231,840.20 $ 1,213,976.90 $ 297,238.37 $ 9,330,824.43 $ 2,435,493.96
3 - 1

Unaudited
University of Houston - Clear LakeMatrix of Operating Expenses Reported by Function
For The Year Ended August 31, 2006
Operation and Scholarships DepreciationInstitutional Maintenance of and Auxiliary and Total Total
Support Plant Fellowships Enterprises Amortization 2006 2005
$ $ $ $ 9,066.58 $ $ 9,066.58 $ 11,180.416,549,900.12 2,267,262.00 104,206.11 2,267,266.58 40,194,827.89 37,786,353.901,736,173.05 741,073.92 525,350.91 9,276,221.38 8,532,354.032,014,673.41 389,076.46 21,725.69 639,669.88 4,797,984.97 4,385,501.70
67,522.08 3,943.29 234.18 49,220.98 577,300.40 552,217.52290,836.23 328,402.90 938.90 144,811.97 3,132,090.28 3,663,514.21291,954.68 2,828,503.62 100.00 618,068.84 4,251,278.77 3,245,171.4051,919.11 441,942.42 236.64 76,396.12 1,010,093.31 847,549.5975,377.82 23,018.49 35,426.72 323,686.77 234,001.42
116,297.17 1,621.44 55,066.53 389,987.47 465,457.213,694,607.21 3,694,607.21 3,646,822.79
325,223.53 65.24 184.77 333,179.09 344,684.404,114,324.62 4,578,838.21 4,137,259.41
118,648.25 118,648.25 128,209.86191,480.83 65,149.92 62,368.00 80,375.12 1,241,275.61 1,138,298.14
$ 11,830,006.28 $ 7,090,059.70 $ 4,304,134.14 $ 4,500,905.00 $ 3,694,607.21 $ 73,929,086.19 $ 69,118,575.99
3 - 2

Unaudited
University of Houston - Clear LakeStatement of Cash Flows
For The Year Ended August 31, 2006
Total 2006 Total 2005
Cash Flows from Operating ActivitiesReceipts from Customers $ 1,190,697.34 $ 1,206,439.33Proceeds from Tuition & Fees 30,002,876.60 27,187,160.37Proceeds from Research Grants & Contracts 647,253.84 316,663.02Proceeds from Loan Programs 3,080,034.21 2,186,663.74Proceeds from Auxiliaries 1,370,348.47 1,342,487.92Proceeds from Other Revenues 5,969,790.92 5,653,332.41Payments to Suppliers for Goods and Services (14,493,064.49) (12,590,199.38)Payments to Employees for Salaries (40,022,455.29) (37,364,379.28)Payments to Employees for Benefits (9,236,440.98) (8,437,069.98)Payments for Loans Provided (3,223,516.27) (2,760,864.25)Payments for Other Expenses (7,381,418.84) (9,618,006.14)
Net Cash Provided (Used) by Operating Activities (32,095,894.49) (32,877,772.24)
Cash Flows from Noncapital Financing ActivitiesProceeds from State Appropriations 30,719,398.84 30,247,443.90Proceeds from Gifts 399,119.87 382,847.61Proceeds from Endowments 2,009,992.85 1,249,088.23Proceeds of Transfers from Other Funds 809.30Proceeds from Other Financing 180,468.15 3,980,200.38Payments for Transfers to Other Funds (945,549.04) (648,941.65)Payments for Other Uses (1,746,190.60) 15,047,616.30
Net Cash Provided by Noncapital Financing Activities 30,617,240.07 50,259,064.07
Cash Flows from Capital and Related Financing ActivitiesProceeds from the Sale of Capital Assets 3,000.00Proceeds from Debt Issuance (8,066.11) (8,066.11)Proceeds from Other Financing Activities 2,294,225.00 1,105,757.00Proceeds from Capital Contributions 4,000,892.00 3,853,447.00Payments for Additions to Capital Assets (1,817,561.27) (5,869,859.17)Payments of Principal on Debt (1,360,000.00) (1,323,000.00)Payments of Interest on Debt Issuance (1,294,719.79) (1,340,322.27)Payments of Other Related Financing Activities (1,553,403.84) (5,551,637.51)
Net Cash Provided by Capital and Related Financing Activities 261,365.99 (9,130,681.06)
Cash Flows from Investing ActivitiesProceeds from Interest Income 1,567,146.86 199,005.36
Net Cash Provided (Used) by Investing Activities 1,567,146.86 199,005.36
Net Increase (Decrease) in Cash and Cash Equivalents 349,858.43 8,449,616.13
Cash and Cash Equivalents, September 1, 2005 23,939,960.34 15,490,344.21Restatements to Beginning Cash and Cash Equivalents
Cash and Cash Equivalents, August 31, 2006 $ 24,289,818.77 $ 23,939,960.34
4 - 1

Unaudited
University of Houston - Clear LakeStatement of Cash Flows
For The Year Ended August 31, 2006
Total 2006 Total 2005
Reconciliation of Operating Income (Loss) to Net CashProvided (Used) by Operating Activities
Operating Income (Loss) (34,868,215.76) (32,661,197.96)
Adjustments to Reconcile Operating Income to Net CashProvided (Used) by Operating Activities
Amortization and Depreciation 3,694,607.21 3,646,822.79Changes in Assets and Liabilities:
(Increase) Decrease in Receivables (1,119,005.54) (460,792.77)(Increase) Decrease in Inventories (2,876.66) 5,200.01(Increase) Decrease in Prepaid Expenses (242,820.59) 601,660.95(Increase) Decrease in Loans and Contracts (143,482.06) (574,200.51)(Increase) Decrease in Other Assets 7,908.65 (57,717.46)Increase (Decrease) in Payables 244,763.11 (4,820,554.99)Increase (Decrease) in Deferred Income 1,223,956.71 159,549.72Increase (Decrease) in Compensated Absence Liability 61,450.70 64,548.57Increase (Decrease) in Benefits Payable (21,670.30) 30,735.48Increase (Decrease) in Other Liabilities (930,509.96) 1,188,173.93
Total Adjustments 2,772,321.27 (216,574.28)
Net Cash Provided (Used) by Operating Activities $ (32,095,894.49) $ (32,877,772.24)
Non-Cash TransactionsCapital Assets Acquired Through Gift 150,000.00
Non-Cash Transactions $ 150,000.00 $
4 - 2

UNAUDITED
5 - 1
UNIVERSITY OF HOUSTON-CLEAR LAKE NOTES TO THE FINANCIAL STATEMENTS FOR THE YEAR ENDED AUGUST 31, 2006
NOTE 1: Summary of Significant Accounting Policies Entity The University of Houston-Clear Lake (the University) is an agency of the State of Texas and its financial records comply with state statutes and regulations. This includes compliance with the Texas Comptroller of Public Accounts' Reporting Requirements for State Agencies. The University serves the state as the primary provider of educational and cultural opportunities, skilled employers and leaders, technical knowledge, and innovative research to the Houston metropolitan area and the Gulf Coast region. Houston and the upper Gulf Coast region represent approximately one fourth of the state’s population and economy. The University includes within this report all components as determined by an analysis of their relationship to the University as listed below. Due to the statewide requirements embedded in Governmental Accounting Standards Board Statement No. 34, Basic Financial Statements - and Management's Discussion and Analysis - for State and Local Governments, the Comptroller of Public Accounts does not require the accompanying annual financial report to comply with all the requirements in this statement. The financial report will be considered for audit by the State Auditor as part of the audit of the State of Texas Comprehensive Annual Financial Report; therefore, an opinion has not been expressed on the financial statements and related information contained in this report. The accompanying financial statements and related information have been prepared in conformity with the instructions contained in the State Comptroller’s manual, Reporting Requirements for Annual Financial Reports of State Agencies and Universities. The instructions and the accompanying report are designed to assist the Texas Comptroller of Public Accounts in compiling and preparing a Comprehensive Annual Financial Report for the State of Texas. Since the University’s annual financial report is not subject to a separate financial audit, certain information, such as a Management Discussion and Analysis and a complete set of Government-Wide Financial Statements, are not included in the accompanying report. The University’s financial statements are considered to be materially accurate in all respects.
Blended Component Units No component units have been identified which should have been blended into an appropriated fund.
Discretely Presented Component Units These component units are legally separate from the state, but are financially accountable to the state, or have a relationship with the state such that exclusion would cause the financial statements to be misleading or incomplete. The component unit columns of the financial statements include the financial data of these entities.
No component units have been identified which should have been discretely presented in the financial statements.
Fund Structure The accompanying financial statements are presented on the basis of funds, each of which is considered a separate accounting entity.

UNAUDITED
5 - 2
Governmental Fund Types & Government-wide Adjustment Fund Types
General Fund
The General Fund is the principal operating fund used to account for most of the state's general activities. It accounts for all financial resources except those accounted for in other funds.
Special Revenue Funds
Special Revenue funds are used to account for the proceeds of specific revenue sources (other than for private-purpose trusts or for major capital projects) that are legally restricted to use for specified purposes.
Debt Service Funds
Debt Service funds are used to account for the accumulation of resources for, and the payment of, general long-term debt principal and interest.
Capital Project Funds
Capital Project funds are used to account for financial resources used for the acquisition, repair, renovation or construction of major capital facilities (other than those financed by proprietary or similar trust funds).
Permanent Funds
Permanent funds are used to account for resources that are legally restricted to the extent that only earnings, and not principal, may be used for purposes that support the state's programs.
Capital Asset Adjustment Fund Type
Capital Asset Adjustment fund type will be used to convert governmental fund type capital assets from modified accrual to full accrual.
Long-Term Liabilities Adjustment Fund Type
Long-Term Liabilities Adjustment fund type will be used to convert governmental fund type debt from modified accrual to full accrual.
Other Adjustments Fund Type
Other Adjustments fund type will be used to convert all other governmental fund type activity from modified accrual to full accrual.
Proprietary Fund Types
Enterprise Funds
Enterprise funds are used to account for any activity for which a fee is charged to external users for goods or services. Activities must be reported as enterprise funds if any one of the following criteria is met.
1. The activity is financed with debt that is secured solely by a pledge of
the net revenues from fees and charges of the activity.
2. Laws or regulations require that the activity's costs of providing services including capital costs (such as depreciation or debt service), be recovered with fees and charges.
3. The pricing policies of the activity establish fees and charges designed
to recover its costs, including capital costs.
Internal Service Funds Internal Service funds are used to account for the financing of goods and services provided by one department or agency to other departments or agencies of a governmental unit, or to other governmental units, within the state, on a cost reimbursement basis.

UNAUDITED
5 - 3
Fiduciary Fund Types Fiduciary funds account for assets held by the state in a trustee capacity or as an agent for individuals, private organizations, other governmental units, and/or other funds. When assets are held under the terms of a formal trust agreement, either a pension trust fund, or a private purpose trust fund is used.
Pension Trust Funds
Pension trust funds are used to account for resources held in trust for the member and beneficiaries of defined benefit pension plans. A separate pension trust fund is used for each separate pension plan. Separate pension trust funds also may be established to account for supplemental pension benefits.
External Investment Trust Funds
External investment trust funds are used to account for the state's external portion of investment pools reported by the sponsoring government.
Agency Funds
Agency funds are used to account for assets the government holds on behalf of others in a purely custodial capacity. Agency funds involve only the receipt, temporary investment, and remittance of fiduciary resources to individuals, private organizations, or other governments.
Private-Purpose Trust Funds
Private-purpose trust funds are used to account for all other trust arrangements whose principal and interest benefit individuals, private organizations, or other governments.
Component Units
The fund types of individual discrete component units are available from the component units' separately issued financial statements. Additional information about component units can be found in Note 17.
Governmental Component Units are used to account for discretely presented component units that follow governmental fund accounting principles.
Proprietary Component Units are used to account for the discretely presented component units which follow proprietary fund measurement focus and accounting principles.
Business-Type Activities
The operations of the Universities are considered to be a Business-Type Activity. The University charges fees to external users for goods and services. Consequently the accompanying financial statements are presented using the proprietary fund type structure.
Basis of Accounting
The basis of accounting determines when revenues and expenditures or expenses are recognized in the accounts reported in the financial statements. The accounting and financial reporting treatment applied to a fund is determined by its measurement focus.
Governmental fund types that build the fund financial statements are accounted for using the modified accrual basis of accounting. Under the modified accrual basis, revenues are recognized in the period in which they become both measurable and available to finance operations of the fiscal year or liquidate liabilities existing at fiscal year end. The State of Texas considers receivables collected within sixty days after year-end to be available and recognizes them as revenues of the current year for Fund Financial Statements prepared on the modified accrual basis. Expenditures and other uses of financial resources are recognized when the related liability is incurred.
Governmental adjustment fund types that will build the government-wide financial statements are accounted for using the full accrual basis of accounting. This includes capital assets, accumulated depreciation, unpaid Employee Compensable leave, the unmatured debt service (principal and interest) on general long-term liabilities, long-term capital leases, long-term claims and judgments and full

UNAUDITED
5 - 4
accrual revenues and expenses. The activity will be recognized in these fund types.
Proprietary funds, pension trust funds, external investment trust funds and private-purpose trust funds are accounted for on the accrual basis of accounting. Under the accrual basis of accounting, revenues are recognized when earned and expenses are recognized at the time liabilities are incurred. Proprietary funds distinguish operating from non-operating items. Operating revenues and expenses result from providing services or producing and delivering goods in connection with the proprietary funds’ principal ongoing operations. Operating expenses for the enterprise and internal services funds include the cost of sales and services, administrative expenses, and depreciation on capital assets.
Budget and Budgetary Accounting
The budget is prepared biennially and represents appropriations authorized by the legislature and approved by the Governor (the General Appropriations Act). Additionally the University prepares an annual budget which represents anticipated sources of revenues and authorized uses. This budget is approved by the System’s Board of Regents. Unencumbered appropriations are generally subject to lapse 60 days after the end of the fiscal year for which they were appropriated.
Assets, Liabilities, and Fund Balances/Net Assets
ASSETS Cash and Cash Equivalents
Short-term highly liquid investments with an original maturity of three months or less are considered cash equivalents.
Securities Lending Collateral
Investments are stated at fair value in all funds except pension trust funds in accordance with GASB Statement 31, Accounting and Financial Reporting for Certain Investments and for External Investment Pools. For pension trust funds, investments are required to be reported at fair value using the accrual basis of accounting in accordance with GASB Statement 25, Financial Reporting for Defined Benefit Pension Plans and Note Disclosures for Defined Contribution Plans.
Securities lent are reported as assets on the balance sheet. The costs of securities lending transactions are reported as expenditures or expenses in the Operating Statement. These costs are reported at gross.
Restricted Assets
Restricted assets include monies or other resources restricted by legal or contractual requirements. These assets include proceeds of enterprise fund general obligation and revenue bonds and revenues set aside for statutory or contractual requirements. Assets held in reserve for guaranteed student loan defaults are also included.
Inventories and Prepaid Items
Inventories include both merchandise inventories on hand for sale and consumable inventories. Inventories are valued at cost, generally utilizing the last-in, first-out method. The consumption method of accounting is used to account for inventories and prepaid items that appear in the governmental and proprietary fund types. The cost of these items is expensed when the items are consumed.
Capital Assets
Assets with an initial, individual cost of more than $5,000 and an estimated useful life in excess of one year are capitalized. These assets are capitalized at cost or, if purchased, at appraised fair value as of the date

UNAUDITED
5 - 5
of acquisition. Purchases of assets by governmental funds are reported as expenditures, Depreciation is reported on all exhaustible assets. Inexhaustible assets such as works of art and historical treasures are not depreciated. Road and highway infrastructure is reported on the modified basis. Assets are depreciated over the estimated useful life of the asset using the straight-line method.
All capital assets acquired by proprietary funds or trust funds are reported at cost or estimated historical cost, if actual historical cost is not available. Donated assets are reported at fair value on the acquisition date. Depreciation is charged to operations over the estimated useful life of each asset, using the straight-line method.
Current Receivables - Other
Other receivables include year-end revenue accruals. This account can appear in governmental and proprietary fund types.
Non-Current Receivables - Other
Receivable balances not expected to be collected within one year of fiscal year end.
LIABILITIES
Accounts Payable Accounts payable represent the liability for the value of assets or services received at the balance sheet date for which payment is pending.
Current Payables - Other
Payables are the accrual at year-end of expenditure transactions. Payables may be included in either the governmental or proprietary fund types.
Non-Current Payables - Other
Payable balances not expected to be paid within one year of fiscal year end.
Employees' Compensable Leave Balances Employees' Compensable Leave Balances represent the liability that becomes due upon the occurrence of relevant events such as resignations, retirements, and uses of leave balances by covered employees. Liabilities are reported separately as either current or non-current in the Statement of Net Assets.
Capital Lease Obligations
Capital lease obligations represent the liability for future lease payments under capital lease contracts contingent upon the appropriation of funding by the Legislature. Liabilities are reported separately as either current or non-current in the statement of net assets.
Bonds Payable - General Obligation Bonds
The unmatured principal of general obligations bonds is accounted for in the Long-term Liabilities column. Payables are reported separately as either current or non-current in the statement of net assets.
Bonds payable are recorded at par. The bond proceeds are accounted for as an Other Financing Source in the governmental funds when received, and expenditures for payment of principal and interest are recorded in debt service funds when paid. These amounts are adjusted in the long-term liabilities column.
Bonds Payable - Revenue Bonds
Revenue bonds are generally accounted for in the proprietary funds. The bonds payable are reported at par, less unamortized discount or plus unamortized premium. Interest expense is reported on the accrual basis, with amortization of discount or premium. Payables are reported separately as either current or non-current in the Statement of Net Assets.

UNAUDITED
5 - 6
FUND BALANCE/NET ASSETS The difference between fund assets and liabilities is Net Assets on the government-wide, proprietary, and fiduciary fund statements, and the Fund Balance is the difference between fund assets and liabilities on the governmental fund statements.
Reservations of Fund Balance
Fund balances for governmental funds are classified as either reserved or unreserved in the fund financial statements. Reservations are legally restricted to a specific future use and are not available for expenditure.
Reserved for Encumbrances
This represents commitments of the value of contracts awarded or assets ordered prior to year-end but not received as of that date. Encumbrances are not included with expenditures or liabilities. They represent current resources designated for specific expenditures in subsequent operating periods.
Unreserved/Undesignated
This represents the unappropriated balance at year-end.
Invested In Capital Assets, Net Of Related Debt Invested in capital assets, net of related debt consists of capital assets, net of accumulated depreciation and reduced by outstanding balances for bonds, notes, and other debt that are attributed to the acquisition, construction, or improvement of those assets.
Restricted Net Assets Restricted net assets result when constraints placed on net asset use are either externally imposed by creditors, grantors, contributors, and the like, or imposed by law through constitutional provisions or enabling legislation.
Unrestricted Net Assets
Unrestricted net assets consist of net assets, which do not meet the definition of the two preceding categories. Unrestricted net assets often have constraints on resources, which are imposed by management, but can be removed or modified.
INTERFUND ACTIVITIES AND BALANCES The University has the following types of transactions between funds:
1. Transfers - Legally required transfers that are reported when incurred as Transfers In by the recipient fund and as Transfers Out by the disbursing fund.
2. Reimbursements - Reimbursements are repayments from funds responsible for
expenditures or expenses to funds that made the actual payment. Reimbursements of expenditures made by one fund for another that are recorded as expenditures in the reimbursing fund and as a reduction of expenditures in the reimbursed fund. Reimbursements are not displayed in the financial statements.
3. Interfund Receivables and Payables - Interfund loans are reported as
interfund receivables and payables. If repayment is due during the current year or soon thereafter it is classified as Current. Repayment for two (or more) years is classified as Non-Current.
4. Interfund Sales and Purchases - Charges or collections for services
rendered by one fund to another that are recorded as revenues of the recipient fund and expenditures or expenses of the disbursing fund. The composition of the University’s interfund activities and balances are presented in Note 8.

UNAUDITED
5 - 7
NOTE 2: Capital Assets A summary of changes in Capital Assets for the year ended August 31, 2006, is presented in Table 2.
Table 2 - Capital Assets
University of Houston-Clear Lake
Balance
9/1/2005 Adjustments Completed CIP
Business-Type Activities:
Non-Depreciable Assets
Land & Land Improvements $ 9,437,721.74 $ $
Construction in Progress
Other Capital Assets 1,729,121.12
Total Non-Depreciable Assets 11,166,842.86
Depreciable Assets
Buildings & Building Improvements 82,194,251.14
Infrastructure 8,722,088.76
Facilities & Other Improvements 793,275.18
Furniture & Equipment 11,080,100.20
Vehicles, Boats & Aircraft 505,231.27
Other Capital Assets 15,832,286.86
Total Depreciable Assets at
Historical Costs 119,127,233.41
Less Accumulated Depreciation:
Buildings & Building Improvements (43,438,256.43)
Infrastructure (7,656,905.09)
Facilities & Other Improvements (39,663.76)
Furniture & Equipment (9,052,409.21)
Vehicles, Boats & Aircraft (426,739.90)
Other Capital Assets (10,003,049.02)
Total Accumulated Depreciation (70,617,023.41)
Depreciable Assets, Net 48,510,210.00
Business Type Activities - Capital Assets, Net $ 59,677,052.86 $ $

UNAUDITED
5 - 8
University of Houston-Clear Lake
Inc-Int-
Agy Dec-Int-
Agy Balance
Transfers Transfers Additions Deletions 8/31/2006
$ $
$
$
$ 9,437,721.74
60,000.00 1,789,121.12
60,000.00 11,226,842.86
82,194,251.14
8,722,088.76
793,275.18
486,435.41 (2,317,437.32) 9,249,098.29
73,490.00 578,721.27
1,347,635.86 (160,835.65) 17,019,087.07
1,907,561.27 (2,478,272.97) 118,556,521.71
(2,177,222.89) (45,615,479.32)
(80,295.74) (7,737,200.83)
(39,663.76) (79,327.52)
(706,448.14) 2,317,437.32 (7,441,420.03)
(28,066.40) (454,806.30)
(662,910.28) 160,835.65 (10,505,123.65)
(3,694,607.21) 2,478,272.97 (71,833,357.65)
(1,787,045.94) 46,723,164.06
$ $ $ (1,727,045.94) $ $ 57,950,006.92

UNAUDITED
5 - 9
NOTE 3: Deposits, Investments, & Repurchase Agreements The University of Houston System is authorized by statute to make investments following the “prudent person rule”. There were no significant violations of legal provisions during the period. Deposits of Cash in Bank As of August 31, 2006, the carrying amount of deposits was $(1,914,627.85) as presented below. Government and Business Type Activities
Cash In Bank - Carrying Value $ (1,914,627.85)
Less: Certificates of deposit included in carrying value and reported as Cash Equivalent
Less: Uninvested Securities Lending Cash Collateral included in carrying value and reported as Securities Lending Colleratal
Less: Securities Lending CD Collateral included in carrying value and reported as Securities Lending Collateral
Cash in Bank per Annual Financial Report $ (1,914,627.85)
Proprietary Funds Current Assets Cash in Bank $ 35,569.40
Proprietary Funds Current Assets Restricted Cash in Bank (728,843.75)
Proprietary Funds Non-Current Assets Restricted Cash in Bank (1,221,353.50)
Cash in Bank per Annual Financial Report $ (1,914,627.85)
These amounts consist of all cash in local banks. These amounts are included on the Statement of Net Assets as part of the “Cash and Cash Equivalents” accounts. As of August 31, 2006, the total bank balance was as follows.
Governmental and Business-Type Activities
$267,684
Custodial credit risk for deposits is the risk that, in the event of the failure of a depository financial institution, the University will not be able to recover deposits or will not be able to recover collateral securities that are in the possession of an outside party. The University uses a third party financial institution other than the pledging financial institution as the custodian of any collateral securities. The bank balances that were exposed to custodial credit risks are as follows.
Fund Type
GAAP Fund
Uninsured and Uncollateralized
Uninsured and Collateralized with
securities held by the pledging financial
institution
Uninsured and collateralized with securities held by the pledging financial institution’s trust
department or agent but not in the state’s name
05 9999 $ 0.00 $ 0.00 $ 0.00

UNAUDITED
5 - 10
Foreign currency risk for deposits is the risk that changes in exchange rates will adversely affect the deposit. The University’s policy is to limit deposits subject to foreign currency risk to 5% of total deposits. The exposure to foreign currency risk for deposits as of August 31, 2006 is as follows.
Fund Type GAAP Fund Currency Balance
05 9999 Euro $ 0.00 Investments As of August 31, 2006, the fair value of investments are as presented below.
Governmental and Business-Type FairActivities Value
U.S. Government
U.S. Treasury Securities $ U.S. Treasury Strips
U.S. Treasury TIPS
U.S. Government Obligations (Ginnie Mae, Fannie Mae, Freddie Mac,
Sallie Mae, etc.)
U.S. Government Obligations (Texas Treasury Safekeeping Trust Co)
Corporate Obligations
Corporate Assets and Mortgage Backed Securities
Equities
International Obligations (Govt and Corp)
International Equities
Repurchase Agreements
Repurchase Agreements (Texas Treasury Safekeeping Trust Co)
Fixed Income Money Market and Bond Mutual Funds
Other Commingled Funds 21,835,323.58International Other Commingled Funds
Other Commingled Funds (TexPool)
Commercial Paper
Securities Lending Collerateral Investment Pool
Real Estate
Misc.(alternative investments, limited partnerships, guaranteed
investment contracts, political subdivisions, bankers' acceptance,
negotiable CD's)
Total Investments $ 21,835,323.58
Reconciliation of Investments per Financial Statements
Proprietary Fund Current Assets Restricted Short-Term Investments $ 21,853,323.58 Proprietary Fund Non-Current Assets Restricted Short-Term Investments
Investments per Financial Statements $ 21,853,323.58
Credit risk is the risk that an issuer or other counterparty to an investment will not be able to fulfill its obligations. The general investment policy of the University limits investments in debt securities that are not in the top three investment grade ratings issued by nationally recognized statistical rating organizations to 5% of total investments. As of August 31, 2006, the University had no investment securities with credit risk exposure.

UNAUDITED
5 - 11
Standard & Poor'sFund GAAPType Fund Investment Type AAA AA A05 9999 U.S. Government Agency Obligations $ $ $
U.S. Government Agency Obligations (Texas Treasury Safekeeping Trust)Repurchase Agreements (Texas Treasury Safekeeping Trust Co)Fixed Inc Money Mrkt & Bnd Mutual FdMisc
Fund GAAPType Fund Investment Type BBB B NR05 9999 Corporate Obligations $ $ $
Concentration of credit risk is the risk of loss attributable to the magnitude of investment in a single issuer. As of August 31, 2006, the agency’s concentration of credit risk in any single issuer did not exceed five percent of total investment assets as reported on the Statement of Net Assets. Reverse Repurchase Agreements The University, by statute, is authorized to enter into reverse repurchase agreements. A reverse repurchase agreement is a transaction in which a broker-dealer or financial institution transfers cash to the University and the University transfers securities to the broker-dealer and promises to repay the cash plus interest in exchange for the same or similar securities. Credit risk exposure for the University arises when a broker-dealer does not return the securities or their value at the conclusion of the reverse repurchase agreement. During the fiscal year, the University had no investments in reverse repurchase agreements. Securities Lending The University does not participate in a security-lending program. In securities lending transactions, the University transfers its securities to broker-dealers and other entities for collateral - which may be cash, or securities - and simultaneously agrees to return the collateral for cash or the same securities in the future. The University invests the cash received as collateral and, if the returns on those investments exceed the rebate paid to the borrowers of the securities, the securities lending transactions generate income for the University. However, if the investment of the cash collateral does not provide a return exceeding the rebate or if the investment incurs a loss on principal, part of the payment to the borrower would come from the University’s resources. The borrower will pay a loan premium or fee for the securities loan, thus generating income for the University. Securities lending is authorized by state statutes. The University is authorized to lend its U.S. Government and Agency securities. Collateral is either cash or U.S. Government or Agency securities at a value of 102 percent of the value of the securities lent. The securities lending contracts allow the University to pledge or sell collateral securities without borrower default. At year-end, the University has no credit risk exposure to borrowers because the amounts the University owes to borrowers exceed the amounts the borrowers owe the University. Contracts with the lending agents require them to indemnify the University if the borrowers fail to return the securities. The policy is to match the maturities of the collateral investments and the securities loans. There were no

UNAUDITED
5 - 12
significant violations of legal or contractual provisions, any borrower or lending agent default losses, and no recoveries of prior-period losses during the year. Derivative Investing The University did not hold any collateralized mortgage obligations at fiscal year-end. These securities are purchased to provide incremental yield above that available on corporate securities with similar terms. The overall return or yield on mortgage-backed securities depends on the amount of interest collected over the life of the security and the change in the fair value. It is estimated that these securities will provide future cash inflows on a time schedule that approximately matches the outflows associated with the University’s liabilities. These highly marketable securities are rated AAA by the major rating agencies. The University does not enter into forward-exchange contracts to manage exposure of foreign portfolio holdings to changes in foreign currency exchange rates. A forward exchange contract is a commitment to purchase or sell a foreign currency at a future date at a negotiated forward rate. Risks associated with such contracts include movement in the value of the foreign currency related to the U.S. dollar and the ability of the counterpart to perform. NOTE 4: Short-Term Debt The University did not hold any short-term debt resulting from anticipation notes, lines of credit or any other similar type of loan at fiscal year-end. NOTE 5: Summary of Long Term Liabilities Changes In Long-Term Liabilities During the year ended August 31, 2006, the following changes, presented in Table 5, occurred in liabilities. Table 5-Long Term Liabilities
Business Type Balance Balance Amounts DueActivities 9/1/2005 Additions Reductions 8/31/2006 Within 1 yr
Revenue Bonds Payable $ 32,108,090.82 $ $ 1,368,066.11 $ 30,740,024.71 $ 1,408,066.11
Compensable Leave 1,491,726.75 941,718.66 880,267.96 1,553,177.45 717,878.62
$ 33,599,817.57 $ 941,718.66 $ 2,248,334.07 $ 32,293,202.16 $ 2,125,944.73
Notes and Loans Payable The University reported no long term notes or loans payable at the end of the year ended August 31, 2006. Claims and Judgments At August 31, 2006, various lawsuits and claims involving the University were pending. While the ultimate liability, if any, with respect to litigation and other claims asserted against the University cannot be reasonably estimated at this time, such liability, to the extent not provided for by insurance or otherwise, is not expected to have a material effect on University accounts. Employees' Compensable Leave A state employee is entitled to be paid for all unused vacation time accrued, in the event of the employee's resignation, dismissal, or separation from State employment,

UNAUDITED
5 - 13
provided the employee has had continuous employment with the State for six months. Expenditures for accumulated annual leave balances are recognized in the period paid or taken in governmental fund types. For these fund types, the liability for unpaid benefits is recorded in the Statement of Net Assets. An expense and liability for proprietary fund types are recorded in the proprietary funds as the benefits accrue to employees. No liability is recorded for non-vesting accumulating rights to receive sick pay benefits. Full-time state employees earn annual leave from eight to twenty-one hours per month depending on the respective employees' years of state employment. The state's policy is that an employee may carry his accrued leave forward from one fiscal year to another fiscal year with a maximum number of hours up to 532 for those employees with 35 or more years of state service. Accrued leave in excess of the normal maximum was converted to sick leave at the conclusion of fiscal year 2005. Employees with at least six months of state service who terminate their employment are entitled to payment for all accumulated annual leave up to the maximum allowed. Lump sum payments made to employees, who separated from state service during the 2006 fiscal year, for accrued vacation and compensatory leave, totaled $122,719.48. NOTE 6: Capital Leases The University may enter into long-term leases for financing the purchase of certain fixed assets. Such leases are classified as capital leases for accounting purposes and, therefore, are recorded at the present value of the future minimum lease payments at the inception of the lease. There were no outstanding capital lease payments payable at August 31, 2006. NOTE 7: Operating Lease Obligations Included in the Expenditures reported in the financial statements are the following amounts of rent paid or due under operating leases:
Fund Type Amount
Proprietary Fund
$ 231,997.03 Future minimum lease rental payments under non-cancelable operating leases having an initial term in excess of one year are as follows:
2007 $ 185,624.29 2008 139,218.22 2009 92,812.14 2010 46,406.07 2011 23,203.04 2012-2016 11,601.52 2017-2021 5,800.76
Total Minimum Future Lease Rental Payments $ 504,666.04

UNAUDITED
5 - 14
NOTE 8: Interfund Balances / Activities As explained in Note 1, under Interfund Transactions and Balances, there are numerous transactions between funds and agencies. At year-end amounts to be received or paid are reported as:
1. Interfund Receivables or Interfund Payables 2. Due From Other Agencies or Due To Other Agencies 3. Due From Other Funds or Due To Other Funds 4. Transfers In or Transfers Out 5. Legislative Transfers In or Legislative Transfers Out
The University experienced routine transfers with other State agencies, which were consistent with the activities of the fund making the transfer. Repayment of interfund balances will occur within one year from the date of the financial statement.
Individual balances and activity at August 31, 2006, are shown in Table 8. Table 8.1 Interfund Receivables and Payables
Current Interfund Current
Interfund Receivable Payable Purpose
Current Portion: General Revenue (01) $ $
Total Current Interfund Receivable/Payable $ $
Non-Current Interfund
Current Interfund
Receivable Payable
Non-Current Portion: General Revenue (01) $ $
Total Non-Current Interfund Receivable/Payable $ $

UNAUDITED
5 - 15
Table 8.2 Due From/To Other Agencies
Due From Other
Agencies Due to Other Agencies Source
Enterprise (05)
APPD Fund 5015,D23 Fund 5015 Agency 601, D23 Fund 5015 University of Houston Clear Lake $ 5,587.00 $
State Grant
APPD Fund 5079, D23 Fund 5079 Agency 781 D23 Fund 5079 University of Houston Clear Lake 117,527.53
State Pass Through
Total Due From/To Other Agencies $ 123,114.53 $
Table 8.3 Due From/To Other Funds
Due From Other Funds Due to Other Funds
General Revenue (01) $
Total Due From/To Other Funds $
Source
Table 8.4-Transfers In and Out Transfers in Transfers Out
Enterprise (05) APPD Fund 9999, D23 Fund 7999 Agency 781, D 23 Fund 0001
University of Houston $ $ 94,201.00
§ 56.465 Tex Educ Code Ann., SUBCHAPTER Q (B-ontime)
Total Transfers In/Out $ $ 94,201.00

UNAUDITED
5 - 16
Table 8.5 Legislative Transfers In and Out Legislative Legislative Transfers In Transfers Out GENERAL REVENUE (01) $ $ APPD Fund 0001,D23 Fund 0001 Agency 730, D23 Fund 0001
UH-Clear Lake 76,996.00
Shared Appropriation approved by UH Board of Regents
Agency 759, D23 Fund 0001 University of Houston
UH-Clear Lake 207,812.00
Shared Appropriation approved by UH Board of Regents
Agency 765, D23 Fund 0001 University of Houston UH Victoria Total Legislative Transfers in and Out $ 76,996.00 $ 207,812.00
NOTE 9: Contingent Liabilities As mentioned in Note 5, various lawsuits and claims involving the University were pending. While the ultimate liability, if any, remains uncertain, management does not expect any possible adverse ruling to have a material effect on University accounts. The University has received several federal grants for specific purposes that are subject to review and audit by the grantor agencies. Such audits could lead to a request for reimbursements to grantor agencies for expenditures disallowed under the terms of the grant, Based on prior experience, management believes such disallowances, if any, will be immaterial. NOTE 10: Continuance Subject to Review The University is not subject to the provisions of the Texas Sunset Act (Chapter 325, Texas Government Code Annotated). The Act provides for the regular assessment of the continuing need for state agencies to exist. Certain agencies, such as institutions of higher education and courts, are not subject to the Sunset Act. NOTE 11: Risk Financing and Related Insurance The University is exposed to a variety of civil claims resulting from the performance of its duties. It is University policy to periodically assess the proper combination of commercial insurance and retention of risk to cover losses to which it may be exposed. The University assumes substantially all risks associated with tort and liability claims due to the performance of its duties. Currently there is the purchase of some commercial insurance, and the University is not involved in any risk pools with other government entities.

UNAUDITED
5 - 17
The University’s liabilities are reported when it is both probable that a loss has occurred and the amount of that loss can be reasonably estimated. Liabilities include an amount for claims that have been incurred but not reported. Liabilities are reevaluated periodically to consider current settlements, frequency of claims, past experience and economic factors. Changes in the balances of the University’s claims liabilities during fiscal years 2006 and 2005 are shown in Table 11. Table 11-Claims and Liabilities
Beginning EndingBalance Increases Decreases Balance
$ 15,347.20 $ 93,341.89 $ 108,689.09 $
$ $ 125,477.47 $ 119,923.35 $ 5,554.12
Fiscal Year
2005
2006
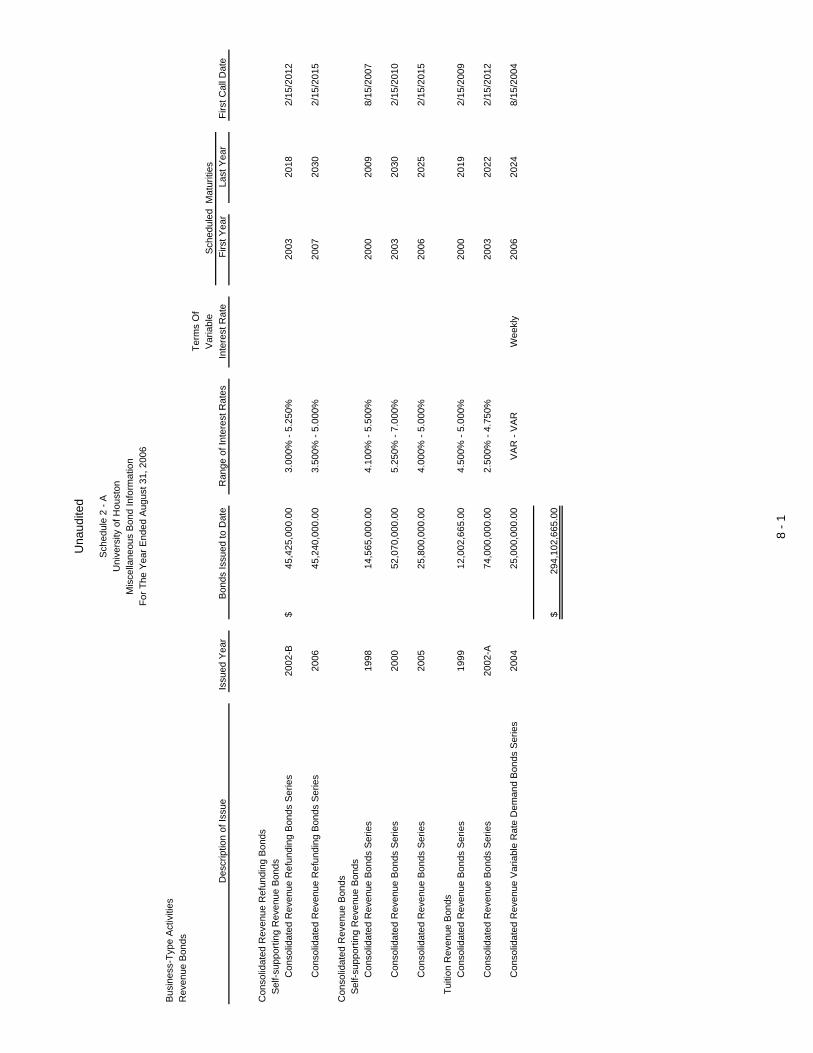
NOTE 12: Segment Information The University has no segment activity that requires separate disclosure in the notes to the financial statements. A segment is an identifiable activity, or group of activities, reported as or within an enterprise fund or an other stand-alone entity that has one or more bonds or other debt instruments outstanding, with a revenue stream pledged in support of that debt. In addition, the activity’s revenues, expenses, gains and losses, assets, and liabilities are required to be accounted for separately. NOTE 13: Bonded Indebtedness Bonds Payable Detailed supplemental bond information is disclosed in Schedule 2-A, Miscellaneous Bond Information, Schedule 2-B, Changes in Bonded Indebtedness, Schedule 2-C Debt Service Requirements, Schedule 2-D, Analysis of Funds Available for Debt Service, Schedule 2-E, Defeased Bonds Outstanding, and Schedule 2-F, Early Extinguishment and Refunding. Revenue Bonds • Consolidated Revenue Bonds, Series 2002-A
- To finance the acquisition, purchase, construction, improvement, renovation, enlargement, and equipping of any property, building, structure, activity, service, operation, or facility of the University of Houston System.
- Issued 9-1-02. - $130,955,000; all bonds authorized have been issued. - Source of revenue for debt service – Tuition and various other fees, and revenues and balances that may be legally available for payment of debt obligations (funding for fiscal year 2006, partially from Legislative appropriation).
General Obligation Bonds At August 31, 2006 the University had no bonds payable classified as General Obligation Bonds. Refunding Bonds At August 31, 2006 the University had no bonds payable classified as Refunding Bonds. NOTE 14: Subsequent Events As of the date this report was issued, there have been no occurrences since August 31, 2006 that have had a significant financial impact.

UNAUDITED
5 - 18
NOTE 15: Related Parties The University Of Houston System is affiliated with several foundations and organizations that have been created to benefit certain operations of the University. Those which have a significant relationship with the University are described below. The assets, liabilities, and equities of the various foundations and organizations are not contained in the financial statements of the University.
• University of Houston-Clear Lake The University of Houston-Clear Lake has no material affiliations with any foundations or organizations.
• Privatized Student Housing Facilities Several student housing facility projects have been constructed by private external entities in order to enhance the residential life experience of students at various System campuses. The participating entities have financed and constructed housing complexes on System owned property adjacent to the university campus. These facilities are operated under grounded leases and management agreements with the System for extended time periods. Under the terms of the agreements, cash revenues from rental income, net of operating expenses, are shared with the University. Repayment of project financing is serviced from revenues generated by the housing projects, and is the sole responsibility of the external entity. The related loans and bonds are not liabilities of the System or component universities. Century Development operates the University Forest project at the University of Houston-Clear Lake. NOTE 16: Stewardship, Compliance and Accountability A negative Change in Net Assets did not occur in the Enterprise Fund operations for the fiscal year.
NOTE 17: The Financial Reporting Entity and Joint Ventures The Financial Reporting Entity The University of Houston System is an agency of the State of Texas, and its financial records reflect compliance with applicable state statutes and regulations. The System was established by House Bill No. 188, Sixty-Fifth Legislature, Regular Session, effective September 1, 1977. Components of the System are System Administration (1977), University of Houston (1963), Clear Lake (1973), Downtown (1974), and Victoria (1973). The System is governed by an appointed nine member Board of Regents. Although the University is affiliated with several separate legal entities, as previously disclosed, these organizations are not considered component units as defined by generally accepted accounting principles. Therefore, the account balances and financial transactions of these organizations are not included in the University's financial statements. NOTE 18: Restatement Of Fund Balances/Retained Earnings During fiscal year 2006, no adjustments were made which required restatement of the amounts in fund balances and fund equity NOTE 19: Employees Retirement Plans The State has joint contributory retirement plans for substantially all its employees. The University participates in the plans administered by the Teachers Retirement System of Texas. Future pension costs are the liabilities of the Retirement System. The Retirement System does not account for each State agency separately. Annual financial reports prepared by the Retirement System include audited financial statements and actuarial assumptions and conclusions.

UNAUDITED
5 - 19
The state has also established an Optional Retirement Program for institutions of higher education. Participation in the Optional Retirement Program is in lieu of participation in the Teacher Retirement System. The Optional Retirement Program provides for the purchase of annuity or mutual fund contracts. Since these are individual investment product contracts, the state has no additional or unfunded liability for this program. NOTE 20: Deferred Compensation State employees may elect to defer a portion of their earnings for income tax and investment purposes pursuant to authority granted in the Texas Government Code Annotated, Section 609.001. Multiple plans are available for employees' deferred compensation plan. Both plans are administered by the Employees Retirement System. The State’s 457 plan complies with the Internal Revenue Code Section 457. The State also administers another plan; “TexaSaver” created in accordance with Internal Revenue Code Sec. 401(k). The assets of this plan do not belong to the state. The state has no liability related to this plan. The tax deferred investment program permits benefits-eligible employees of the University to purchase qualified tax deferred investments with a portion of their salaries. Participation in the program is voluntary and is a supplement to the Teacher Retirement System or the Optional Retirement Program. It is however, separate and apart from either. NOTE 21: Donor-Restricted Endowments Amounts reported as net appreciation on investments of donor-restricted endowments that are available for authorization for expenditure are disclosed in Table 21. Effective September 1, 1995, the Board of Regents adopted an endowment income payout policy whereby the payout rate is based on a percentage of the fiscal year end market value averaged over rolling three year periods. If an endowment were in existence less than three years, the average is based on the number of years in existence.
Table 21-EndowmentsAmount of NetAppreciation/(Depreciation) Reported in Net Assets
Endowments $ 897,940.06 Restricted for Non-Expendable
Term Endowments Restricted for Non-Expendable
Total $ 897,940.06
Donor RestrictedEndowments
NOTE 22: Management Discussion and Analysis The System is continuing the development and implementation of integrated financial, human resources, and student information systems that were purchased from PeopleSoft. The implementation of these systems increases the availability of accurate and timely management information. The University of Houston System’s financial condition and position are strong. The University’s administrative and management teams realize that universities must be good stewards of the dollars with which they are entrusted. Management strives to make sound financial decisions. NOTE 23: Post Employment Health Care and Life Insurance Benefits (UT, A&M and ERS only) Provisions of this requirement only apply to the following agencies: University of Texas, Texas A&M University and Employees Retirement System.

UNAUDITED
5 - 20
NOTE 24: Special or Extraordinary Items No items have been identified which should have been presented in the financial statements. NOTE 25: Disaggregation of Receivable & Payable Balances Balances of receivables and payables reported on the Statement of Net Assets may be aggregations of different components. GASB Statement 38, Certain Financial Statement Note Disclosures, requires that the University provide details in the notes to the financial statements when significant components have been obscured by aggregation. The Statement of Net Assets is presented in the classified format, and therefore the current and non-current portions of receivables and payables are separately disclosed. Significant balances in various classifications of receivables and payables are disclosed below. A. Taxes Receivable No reportable balances for this classification. B. Federal Receivable Balances by category type for Federal Receivable are shown in Table 25.1.
C. Tax Refunds Payable No reportable balances for this classification. D. Other Receivables – Current No reportable balances for this classification. E. Other Payables – Current No reportable balances for this classification F. Other Receivables – Non-Current No reportable balances for this classification.
Table 25.1-Federal Receivable
Federal Receivable Program Net Receivable
Department of Commerce $ 6,003.81Department of Education 1,549,997.17Department of Health and Human Services 10,978.01National Aeronautics and Space Administration (427,588.69)National Science Foundation 20,074.19
Total Net Federal Receivable $ 1,159,464.49
As Reported on the Financial Statements
Current Federal Receivable $ 1,159,464.49
Total Net Federal Receivable $ 1,159,464.49

UNAUDITED
5 - 21
G. Other Payables – Non-Current No reportable balances for this classification. Note 26: Termination Benefits The University has no retiring members of the Employees Retirement System of Texas (ERS) or the Teacher Retirement System(TRS) that were eligible for a temporary retirement incentive payment.

UnauditedSchedule 1 - A
University of Houston - Clear LakeSchedule of Expenditures Of Federal Awards
For The Year Ended August 31, 2006
TotalPass-Thru To &
Expenditures
Note:1 Non-monetary assistanceDonation of Federal Surplus Personal Property
No Activity $
Total Non-monetary Assistance 0.00
Note 2: ReconciliationFederal Revenues
Federal Grants and Contracts 4,707,546.15Federal Pass Through Grants
From Other State Agencies 244,665.00Indirect Cost Recoveries
Federal GrantsFederal Pass Through From State Agencies
Total Federal Revenues 4,952,211.15
Reconciling ItemsAdditions
Pass Through To State Entities & Other EntitiesNon-monetary Assistance Donation-Federal Surplus PropertyNew Student Loans Processed / Adm Costs Federal Family Education Loan Program 29,823,521.00 Federal Perkins Loan Program 77,241.00 Health Prof Student Loans - Optometry
Total Additions 29,900,762.00
DeductionsFederal Perkins Program Disb-Institute Share
Total Deductions 0.00
Total Reconciling Items 29,900,762.00
Total Pass Through & Expenditures Per Federal Schedule $ 34,852,973.15
Federal Grantor / Pass Through Grantor / Program Title
6 - 1

Unaudited
Schedule 1 - AUniversity of Houston - Clear Lake
Schedule of Expenses Of Federal AwardsFor The Year Ended August 31, 2006
Total LoansProcessed
New Loans Administrative Administrative Loan ReceivableProcessed Cost Recovered Cost Recovered Ending Balances
Note 3: Student Loan Program & Adm Cost RecoveredDepartment Of Education
84.032 Federal Family Education ProgramLoan - Non-monetary Loans $ 29,823,521.00 $ $ 29,823,521.00 $
84.038 Federal Perkins Loan ProgramPerkins Student Loans 77,241.00 77,241.00 573,169.77
Total Department Of Education 29,900,762.00 29,900,762.00 573,169.77
Department Of Health & Human Services93.342 Health Profession Student Loans
Optometry LoansTotal Department of Health & Human Services
Total Student Loan Program & Adm Cost Recovered $ 29,900,762.00 $ $ 29,900,762.00 $ 573,169.77
Note 4: Governmental PublicationsVarious University of Houston System libraries participate as a Depository Library in the Government Publications Program, CFDA number 40.001. The University is the legal custodian of Government Publications,which remain the property of the Federal Government. The Publications are not assigned a value by the Government Printing Office. The University System Libraries that participate as a depository library are the Universityof Houston M.D. Anderson Library, the University of Houston O'Quinn Law Library, and the University of Houston - Clear Lake Alfred R. Neumann Library.
Note 5: Unemployment Insurance FundsNone received
Federal Agency
6 - 2

Unaudited
Schedule 1 - BUniversity of Houston - Clear Lake
Schedule of State Grant Pass-Throughs From/To State AgenciesFor The Year Ended August 31, 2006
Total
Pass Through FromCoordinating Board (Agency 781)
Texas Grant Program $ 82,594.00General Academic Developmental Education Program 0.00General Academic Enrollment Growth Program 0.00Advanced Research Program 48,780.00Advanced Technology Program 0.00Developmental Education Program 0.00College Work Study Program 27,769.875th Year Accounting Scholarships Program 8,555.00Roberta High Memorial Pharmacy Residency Program 0.00Texas Workforce Development Program 0.00
Total Coordinating Board (Agency 781) 167,698.87
Texas Education Agency (Agency 701)Foundation School Program 0.00Foundation School Program Technology Allotment 0.00Student Success Initiatives 0.00School Lunch Program Matching 0.00
Total Texas Education Agency (Agency 701) 0.00
Texas Attorney General's Office (Agency 302)Crime Victim Assistance Grants 0.00
Total Texas Attorney General (Agency 302) 0.00
Lamar University (Agency 734)Texas Air Research Center 0.00Texas Hazardous Waste Research Center 0.00
Total Lamar University (Agency 734) 0.00
Total Pass Through From Other Agencies $ 167,698.87
Pass Through ToTexas A&M University at Corpus Christi (Agency 760)
Texas Natural Resources Conservation Commission GrantTotal Texas A&M University at Corpus Christi (Agency 760) $ 0.00
Total Pass Through To Other Agencies $ 0.00
7 - 1
Una
udite
d
Sch
edul
e 2
- AU
nive
rsity
of H
oust
onM
isce
llane
ous
Bon
d In
form
atio
nFo
r The
Yea
r End
ed A
ugus
t 31,
200
6
Bus
ines
s-Ty
pe A
ctiv
ities
Rev
enue
Bon
dsTe
rms
Of
Var
iabl
eS
ched
uled
Mat
uriti
esD
escr
iptio
n of
Issu
eIs
sued
Yea
rB
onds
Issu
ed to
Dat
eR
ange
of I
nter
est R
ates
Inte
rest
Rat
eFi
rst Y
ear
Last
Yea
rFi
rst C
all D
ate
Con
solid
ated
Rev
enue
Ref
undi
ng B
onds
S
elf-s
uppo
rting
Rev
enue
Bon
dsC
onso
lidat
ed R
even
ue R
efun
ding
Bon
ds S
erie
s20
02-B
$45
,425
,000
.00
3.00
0% -
5.25
0%20
0320
182/
15/2
012
Con
solid
ated
Rev
enue
Ref
undi
ng B
onds
Ser
ies
2006
45,2
40,0
00.0
03.
500%
- 5.
000%
2007
2030
2/15
/201
5
Con
solid
ated
Rev
enue
Bon
ds
Sel
f-sup
porti
ng R
even
ue B
onds
Con
solid
ated
Rev
enue
Bon
ds S
erie
s19
9814
,565
,000
.00
4.10
0% -
5.50
0%20
0020
098/
15/2
007
Con
solid
ated
Rev
enue
Bon
ds S
erie
s20
0052
,070
,000
.00
5.25
0% -
7.00
0%20
0320
302/
15/2
010
Con
solid
ated
Rev
enue
Bon
ds S
erie
s20
0525
,800
,000
.00
4.00
0% -
5.00
0%20
0620
252/
15/2
015
Tu
ition
Rev
enue
Bon
dsC
onso
lidat
ed R
even
ue B
onds
Ser
ies
1999
12,0
02,6
65.0
04.
500%
- 5.
000%
2000
2019
2/15
/200
9
Con
solid
ated
Rev
enue
Bon
ds S
erie
s20
02-A
74,0
00,0
00.0
02.
500%
- 4.
750%
2003
2022
2/15
/201
2
Con
solid
ated
Rev
enue
Var
iabl
e R
ate
Dem
and
Bon
ds S
erie
s20
0425
,000
,000
.00
VA
R -
VA
RW
eekl
y20
0620
248/
15/2
004
$29
4,10
2,66
5.00
8 - 1

Una
udite
d
Sch
edul
e 2-
BU
nive
rsity
of H
oust
onC
hang
es In
Bon
ded
Inde
bted
ness
For T
he Y
ear E
nded
Aug
ust 3
1, 2
006
Bus
ines
s-Ty
pe A
ctiv
ities
Bon
dsB
onds
Bon
dsB
onds
Out
stan
ding
Bon
dsM
atur
ed o
rR
efun
ded
orO
utst
andi
ngD
escr
iptio
n of
Issu
e09
/01/
2005
Issu
edR
etire
dE
xtin
guis
hed
08/3
1/20
06
Gen
eral
Obl
igat
ion
Bon
dsN
one
Rev
enue
Bon
dsC
onso
lidat
ed R
even
ue R
efun
ding
Bon
ds S
erie
s 20
02-B
$35
,420
,000
.00
$$
5,20
0,00
0.00
$$
30,2
20,0
00.0
0C
onso
lidat
ed R
even
ue R
efun
ding
Bon
ds S
erie
s 20
0645
,240
,000
.00
45,2
40,0
00.0
0
Con
solid
ated
Rev
enue
Bon
ds S
erie
s 19
986,
655,
000.
001,
545,
000.
005,
110,
000.
00C
onso
lidat
ed R
even
ue B
onds
Ser
ies
1999
9,50
6,75
8.50
493,
063.
009,
013,
695.
50C
onso
lidat
ed R
even
ue B
onds
Ser
ies
2000
49,6
90,0
00.0
091
0,00
0.00
44,4
30,0
00.0
04,
350,
000.
00C
onso
lidat
ed R
even
ue B
onds
Ser
ies
2002
-A65
,865
,000
.00
2,80
0,00
0.00
63,0
65,0
00.0
0C
onso
lidat
ed R
even
ue V
aria
ble
Rat
e D
eman
d B
onds
Ser
ies
2004
23,7
00,0
00.0
023
,700
,000
.00
Con
solid
ated
Rev
enue
Bon
ds S
erie
s 20
0525
,800
,000
.00
315,
000.
0025
,485
,000
.00
Tota
l Rev
enue
Bon
ds$
216,
636,
758.
50$
45,2
40,0
00.0
0$
11,2
63,0
63.0
0$
44,4
30,0
00.0
0$
206,
183,
695.
50
Net
Bon
dsA
mou
nts
Una
mor
tized
Una
mor
tized
Issu
ance
Gai
n / (
Loss
) On
Out
stan
ding
Due
With
inP
rem
ium
Dis
coun
tC
osts
Ref
undi
ng08
/31/
2006
One
Yea
r
Rev
enue
Bon
dsC
onso
lidat
ed R
even
ue R
efun
ding
Bon
ds S
erie
s 20
02-B
$1,
965,
551.
43$
$$
$32
,185
,551
.43
$5,
640,
917.
51C
onso
lidat
ed R
even
ue R
efun
ding
Bon
ds S
erie
s 20
061,
644,
510.
7346
,884
,510
.73
149,
979.
18
Con
solid
ated
Rev
enue
Bon
ds S
erie
s 19
985,
110,
000.
001,
620,
000.
00C
onso
lidat
ed R
even
ue B
onds
Ser
ies
1999
9,01
3,69
5.50
516,
456.
50C
onso
lidat
ed R
even
ue B
onds
Ser
ies
2000
4,35
0,00
0.00
975,
000.
00C
onso
lidat
ed R
even
ue B
onds
Ser
ies
2002
-A25
7,58
1.95
63,3
22,5
81.9
52,
896,
618.
19C
onso
lidat
ed R
even
ue V
aria
ble
Rat
e D
eman
d B
onds
Ser
ies
2004
81,2
97.4
723
,781
,297
.47
444,
645.
57C
onso
lidat
ed R
even
ue B
onds
Ser
ies
2005
86,5
44.6
625
,571
,544
.66
829,
678.
09
Tota
l Rev
enue
Bon
ds$
4,03
5,48
6.24
$$
$$
210,
219,
181.
74$
13,0
73,2
95.0
4
9 - 1

Unaudited
Schedule 2 - CUniversity of Houston
Debt Service RequirementsFor The Year Ended August 31, 2006
Business-Type Activities
Description of Issue Year Principal Interest Total
General Obligations Bonds Self-Supporting Bonds None $ $ $
Not Self-Supporting Bonds None $ $ $
Revenue Bonds Self-Supporting Bonds Consolidated Revenue Refunding Bonds Series 2002-B 2007 $ 5,470,000.00 $ 1,439,543.76 $ 6,909,543.76
2008 5,760,000.00 1,148,175.00 6,908,175.002009 6,080,000.00 837,375.00 6,917,375.002010 1,155,000.00 647,456.25 1,802,456.252011 1,215,000.00 585,243.75 1,800,243.752012 - 2016 7,130,000.00 1,870,050.00 9,000,050.002017 - 2021 3,410,000.00 181,387.50 3,591,387.502022 - 20262027 - 2031
$ 30,220,000.00 $ 6,709,231.26 $ 36,929,231.26
Consolidated Revenue Refunding Bonds Series 2006 2007 $ 80,000.00 $ 2,140,693.76 $ 2,220,693.762008 90,000.00 2,137,118.76 2,227,118.762009 95,000.00 2,133,881.26 2,228,881.262010 100,000.00 2,130,343.76 2,230,343.762011 1,380,000.00 2,100,868.76 3,480,868.762012 - 2016 7,880,000.00 9,419,593.80 17,299,593.802017 - 2021 10,085,000.00 7,185,968.80 17,270,968.802022 - 2026 12,835,000.00 4,435,071.90 17,270,071.902027 - 2031 12,695,000.00 1,173,212.50 13,868,212.50
$ 45,240,000.00 $ 32,856,753.30 $ 78,096,753.30
Consolidated Revenue Bonds Series 1998 2007 $ 1,620,000.00 $ 203,843.76 $ 1,823,843.762008 1,705,000.00 120,718.76 1,825,718.762009 1,785,000.00 39,046.88 1,824,046.88201020112012 - 20162017 - 20212022 - 20262027 - 2031
$ 5,110,000.00 $ 363,609.40 $ 5,473,609.40
Consolidated Revenue Bonds Series 2000 2007 $ 975,000.00 $ 270,375.00 $ 1,245,375.002008 1,045,000.00 199,675.00 1,244,675.002009 1,125,000.00 123,725.00 1,248,725.002010 1,205,000.00 42,175.00 1,247,175.0020112012 - 20162017 - 20212022 - 20262027 - 2031
$ 4,350,000.00 $ 635,950.00 $ 4,985,950.00
10 - 1

Unaudited
Schedule 2 - CUniversity of Houston
Debt Service RequirementsFor The Year Ended August 31, 2006
Business-Type Activities
Description of Issue Year Principal Interest Total
Consolidated Revenue Bonds Series 2005 2007 $ 825,000.00 $ 1,079,112.50 $ 1,904,112.502008 865,000.00 1,045,312.50 1,910,312.502009 910,000.00 1,009,812.50 1,919,812.502010 955,000.00 972,512.50 1,927,512.502011 1,005,000.00 933,312.50 1,938,312.502012 - 2016 5,860,000.00 3,988,637.50 9,848,637.502017 - 2021 7,530,000.00 2,633,812.50 10,163,812.502022 - 2026 7,535,000.00 770,331.25 8,305,331.252027 - 2031
$ 25,485,000.00 $ 12,432,843.75 $ 37,917,843.75
Not Self-Supporting Bonds None $ $ $
Tuition Revenue Bonds Consolidated Revenue Bonds Series 1999 2007 $ 516,456.50 $ 418,888.51 $ 935,345.01
2008 543,449.00 395,040.64 938,489.642009 570,441.50 369,978.10 940,419.602010 597,434.00 342,954.11 940,388.112011 622,627.00 313,977.66 936,604.662012 - 2016 3,573,807.00 1,086,812.50 4,660,619.502017 - 2021 2,589,480.50 197,938.71 2,787,419.212022 - 20262027 - 2031
$ 9,013,695.50 $ 3,125,590.23 $ 12,139,285.73
Consolidated Revenue Bonds Series 2002-A 2007 $ 2,880,000.00 $ 2,586,687.52 $ 5,466,687.522008 2,975,000.00 2,473,187.52 5,448,187.522009 3,075,000.00 2,352,187.52 5,427,187.522010 3,190,000.00 2,226,887.52 5,416,887.522011 3,315,000.00 2,096,787.52 5,411,787.522012 - 2016 18,750,000.00 8,340,437.60 27,090,437.602017 - 2021 23,460,000.00 3,995,275.04 27,455,275.042022 - 2026 5,420,000.00 128,725.00 5,548,725.002027 - 2031
$ 63,065,000.00 $ 24,200,175.24 $ 87,265,175.24
Consolidated Revenue Variable Rate Demand Bonds Series 2004 2007 $ 440,000.00 $ 1,056,600.00 $ 1,496,600.00
2008 930,000.00 1,025,775.00 1,955,775.002009 975,000.00 982,912.50 1,957,912.502010 1,020,000.00 938,025.00 1,958,025.002011 1,065,000.00 891,112.50 1,956,112.502012 - 2016 6,115,000.00 3,672,337.50 9,787,337.502017 - 2021 7,660,000.00 2,129,625.00 9,789,625.002022 - 2026 5,495,000.00 378,337.50 5,873,337.502027 - 2031
$ 23,700,000.00 $ 11,074,725.00 $ 34,774,725.00
Total $ 206,183,695.50 $ 91,398,878.18 $ 297,582,573.68
10 - 2

Una
udite
d
Sch
edul
e 2-
DU
nive
rsity
of H
oust
onA
naly
sis
Of F
unds
Ava
ilabl
e Fo
r Deb
t Ser
vice
For T
he Y
ear E
ndin
g A
ugus
t 31,
200
6
Bus
ines
s-Ty
pe A
ctiv
ities
Gen
eral
Obl
igat
ion
Bon
ds
Beg
inni
ng B
alan
ceA
vaila
ble
for
Deb
t Ser
vice
Inte
rest
Ear
ned
onO
ther
Ple
dged
Ope
ratin
gS
tate
's G
ener
alTo
tal S
ourc
esD
escr
iptio
n of
Issu
e09
/01/
2005
Inve
stm
ents
Sou
rces
Tran
sfer
sR
even
ueA
vaila
ble
$$
$$
$$
Tota
l$
$$
$$
$
Ref
unde
d or
Oth
er A
pplic
atio
nTo
tal A
pplic
atio
nP
rinci
pal
Inte
rest
Ext
ingu
ishe
dof
Fun
dsof
Fun
ds
$$
$$
$
Tota
l$
$$
$$
Req
uire
dA
ctua
l
$$
Tota
l$
$
Ple
dged
Sou
rces
Oth
er S
ourc
esS
ourc
es o
f Fun
ds
App
licat
ion
of F
unds
End
ing
Bal
ance
Ava
ilabl
e fo
r D
ebt S
ervi
ce a
t 08/
31/2
006
11 -
1

Una
udite
d
Sch
edul
e 2-
DU
nive
rsity
of H
oust
onA
naly
sis
Of F
unds
Ava
ilabl
e Fo
r Deb
t Ser
vice
For T
he Y
ear E
ndin
g A
ugus
t 31,
200
6B
usin
ess-
Type
Act
iviti
esR
even
ue B
onds
Ope
ratin
gIn
tere
st E
arne
dO
ther
Ple
dged
Tota
l Ple
dged
Oth
erO
pera
ting
Exp
ense
sC
apita
lN
et A
vaila
ble
for
Des
crip
tion
of Is
sue
Rev
enue
son
Inve
stm
ents
Rev
enue
sS
ourc
esS
ourc
es &
Exp
endi
ture
sO
utla
yD
ebt S
ervi
ceC
onso
lidat
ed R
even
ue R
efun
ding
Bon
ds
and
Con
solid
ated
Rev
enue
Bon
ds (A
)$
$11
,509
.44
$27
8,06
8,44
7.61
$27
8,07
9,95
7.05
$$
$$
278,
079,
957.
05
Tota
l$
$11
,509
.44
$27
8,06
8,44
7.61
$27
8,07
9,95
7.05
$$
$$
278,
079,
957.
05
(A)
Oth
er P
ledg
ed R
even
ues
Con
sist
of
Tuiti
on a
nd F
ees
$22
9,68
0,76
4.90
Inve
stm
ent I
ncom
e6,
211,
443.
78S
ales
and
Ser
vice
35,5
01,7
28.9
3Le
gisl
ativ
e A
ppro
pria
tions
6,67
4,51
0.00
Tota
l as
show
n ab
ove
$27
8,06
8,44
7.61
(B)
Exp
endi
ture
ass
ocia
ted
with
ple
dged
sour
ces
wer
e ap
prox
imat
ely
$ 21
8,26
1,28
9.27
Ref
unde
d or
Des
crip
tion
of Is
sue
Prin
cipa
lIn
tere
stE
xtin
guis
hed
Min
imum
Act
ual
Min
imum
Act
ual
Con
solid
ated
Rev
enue
Ref
undi
ng B
onds
Ser
ies
2002
-B$
5,20
0,00
0.00
$1,
709,
712.
52$
$$
$$
Con
solid
ated
Rev
enue
Ref
undi
ng B
onds
Ser
ies
2006
1,15
4,67
3.86
Con
solid
ated
Rev
enue
Bon
ds S
erie
s 19
981,
545,
000.
0028
2,96
8.76
Con
solid
ated
Rev
enue
Bon
ds S
erie
s 19
9949
3,06
3.00
441,
602.
70C
onso
lidat
ed R
even
ue B
onds
Ser
ies
2000
910,
000.
001,
542,
728.
13C
onso
lidat
ed R
even
ue B
onds
Ser
ies
2002
-A2,
800,
000.
002,
689,
687.
52C
onso
lidat
ed R
even
ue V
aria
ble
Rat
e D
eman
d1,
066,
500.
00B
onds
Ser
ies
2004
Con
solid
ated
Rev
enue
Bon
ds S
erie
s 20
0531
5,00
0.00
1,51
4,41
3.82
Tota
l$
11,2
63,0
63.0
0$
10,4
02,2
87.3
1$
$$
$$
Ple
dged
and
Oth
er S
ourc
es a
nd R
elat
ed E
xpen
ditu
re fo
r FY
200
5
Deb
t Ser
vice
Inte
rest
& S
inki
ng F
und
Res
erve
Fun
d
11 -
2

Una
udite
d
Sch
edul
e 2-
EU
nive
rsity
of H
oust
onD
efea
sed
Bon
ds O
utst
andi
ngFo
r The
Yea
r End
ed A
ugus
t 31,
200
6
Bus
ines
s-Ty
pe A
ctiv
ities
Des
crip
tion
of Is
sue
Yea
r Ref
unde
dP
ar V
alue
Out
stan
ding
Gen
eral
Obl
igat
ions
Bon
ds$
Tota
l$
Rev
enue
Bon
ds
Dor
mito
ry R
even
ue B
onds
Ser
ies
1967
-A19
90$
320,
000.
00
Con
solid
ated
Rev
enue
Bon
ds S
erie
s 20
0020
0644
,430
,000
.00
Tota
l$
44,7
50,0
00.0
0
12 -
1

Una
udite
d
Sch
edul
e 2-
FU
nive
rsity
of H
oust
onE
arly
Ext
ingu
ishm
ent a
nd R
efun
ding
For T
he Y
ear E
nded
Aug
ust 3
1, 2
006
Bus
ines
s-Ty
pe A
ctiv
ities
For R
efun
ding
Onl
yA
mou
nt E
xtin
guis
hed
Ref
undi
ng Is
sue
Cas
h Fl
owE
cono
mic
Des
crip
tion
of Is
sue
Cat
egor
yO
r Ref
unde
dP
ar V
alue
Incr
ease
/ (D
ecre
ase)
Gai
n / (
Loss
)
Gen
eral
Obl
igat
ions
Bon
ds$
$$
$
Tota
l$
$$
$
Rev
enue
Bon
ds
Con
solid
ated
Rev
enue
Bon
ds S
erie
s 20
00A
dvan
ce R
efun
ding
$44
,430
,000
.00
$45
,240
,000
.00
$4,
688,
985.
42$
2,89
1,24
0.27
Tota
l$
44,4
30,0
00.0
0$
45,2
40,0
00.0
0$
4,68
8,98
5.42
$2,
891,
240.
27
13 -
1

Unaudited
Schedule 3University of Houston - Clear Lake
Reconciliation Of Cash In State TreasuryFor The Year Ended August 31, 2006
Cash in State Treasury Unrestricted Restricted Current Year Total
Local Revenue Fund No 0229 (UHC - 759) $ 4,337,523.04 $ $ 4,337,523.04
Total Cash in State Treasury $ 4,337,523.04 $ $ 4,337,523.04
14 - 1