university of louisville diversity plan
TRANSCRIPT

Mordean Taylor-Archer
Vice Provost for Diversity and International Affairs
University of Louisville
Presented December 11, 2017
University of Louisville Diversity Plan
1

2017-18 Diversity Plan
Three Focus Areas
2
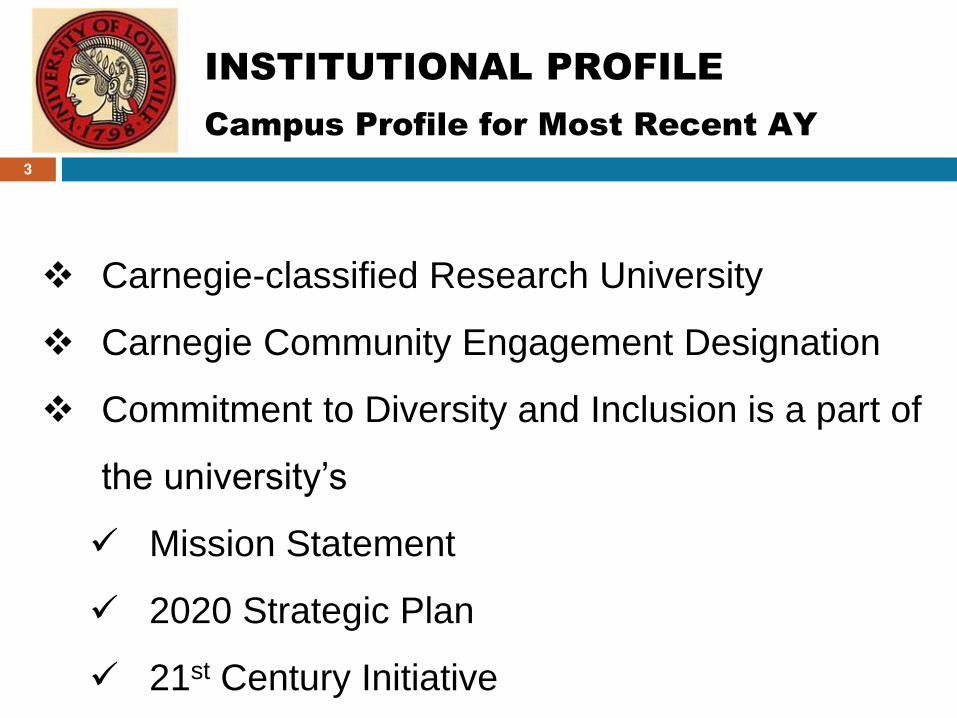
Carnegie-classified Research University
Carnegie Community Engagement Designation
Commitment to Diversity and Inclusion is a part of
the university’s
Mission Statement
2020 Strategic Plan
21st Century Initiative
INSTITUTIONAL PROFILE
Campus Profile for Most Recent AY
3

Total Enrollment = 22,640 (5,808 graduate, 16,033 UG,
155 post-doctoral, 811 non-degree seeking)
7,074 faculty and staff
17,406 Full-Time, 5,234 Part-Time Students
11,467 Female, 11,173 Male
16,723 In-state, 5,917 out-of-state
INSTITUTIONAL PROFILE
Campus Profile for Most Recent AY
4

11.1% African American/Black – African American only (does not include
2 or more races)
4.4% Hispanic
4.8% Other Students of Color – American Indian, 2 or more races
(including African American), Pacific Islander
20.3% Total URM
33% Low Income (Pell)
INSTITUTIONAL PROFILE
Undergraduate Student Profile
(2016-17 Baseline)
5

Pell-EligibleTotal undergraduate: 16,033
Total Pell Eligible: 5,231
Total First Generation: 3,328 (1,754 are ‘Yes’ First Generation AND Pell Eligible) + (1,574 are ‘Yes’ First Generation AND NOT
Pell Eligible)
Total undergraduate from Kentucky Counties: 12,853 (561 in Impoverished) + (12,292 in Count Not Impoverished)
Total from an Impoverished KY County: 561
Total Not from an Impoverished KY County: 12,292
Total Not from a KY County: 3,180
Percent of undergraduates who are Pell Eligible: 5,231/16,033 = 32.6%
Percent of undergraduates who are First Generation: 3,328/16,033 = 20.8%
Percent of First Generation who are Pell Eligible: 1,754/5,231 = 33.5%
Total Pell Eligible from an Impoverished KY County: 253 (102 are ‘Yes’ First Generation) + (151 are NOT First Generation)* -
not visible on table above
Percent of Pell Eligible from an Impoverished KY County: 253/561 = 45.1%
Total Pell Eligible who are First Generation in an Impoverished County: 102
Percent of undergraduates from Kentucky Counties who are Pell Eligible and First Generation from an Impoverished County:
102/12,853 = 0.8% (less than 1%)
INSTITUTIONAL PROFILE
Undergraduate Student Profile
(2016-17 Baseline)
6
11% African American/Black
3.87% Hispanic
4.6% Students of Color
19.47% Total URM
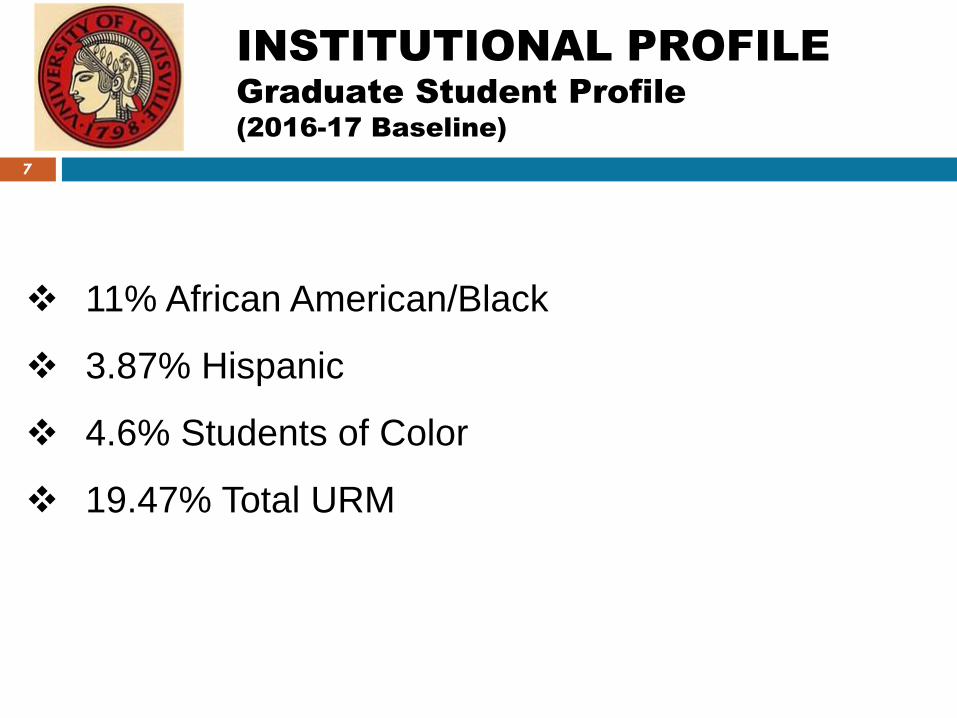
INSTITUTIONAL PROFILE
Graduate Student Profile
(2016-17 Baseline)
7
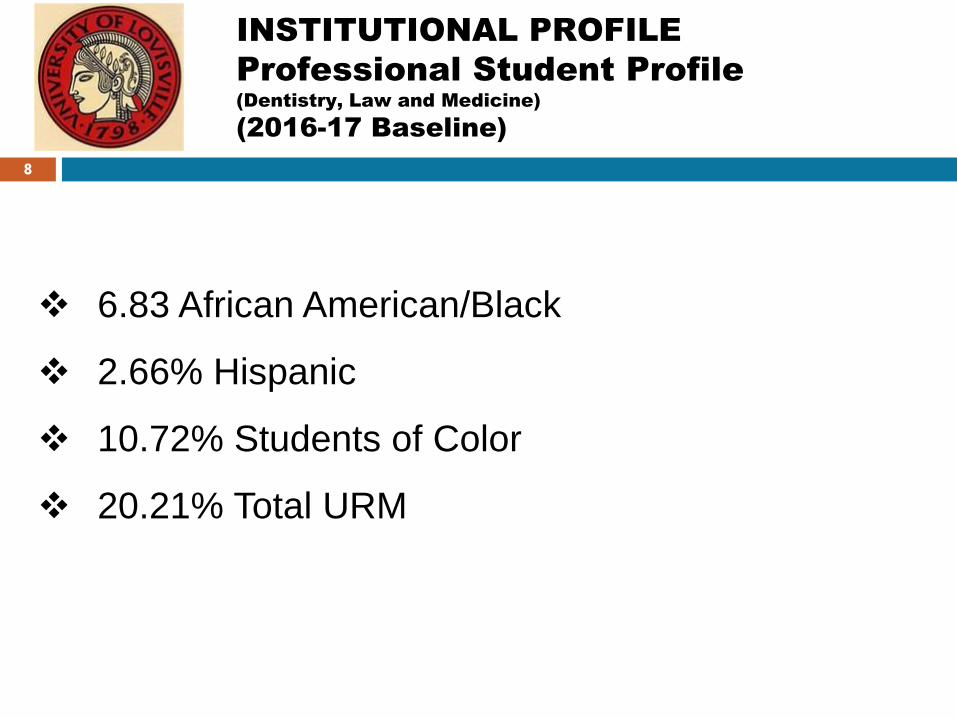
6.83 African American/Black
2.66% Hispanic
10.72% Students of Color
20.21% Total URM
INSTITUTIONAL PROFILE
Professional Student Profile
(Dentistry, Law and Medicine)
(2016-17 Baseline)
8

Undergraduate
Enrollment Targets
Performance Metric:
Undergraduate Enrollment
Baseline
15-16
AY
16-17
AY
17-18
AY
18-19
AY
19-20
AY
20-21
African American 11.0% 11.1% 11.8% 12.5% 13.3% 14.0%
Hispanic 4.0% 4.4% 4.6% 5.0% 5.6% 6.0%
URM 19.4% 20.3% 20.5% 21.3% 22.2% 23.0%
9

Performance Metric:
Graduate and Professional
Student Enrollment
Baseline
2015-16
AY
16-17
AY
17-18
AY
18-19
AY
19-20
AY
20-21
URM 13.8% 14.5% 14.8% 15.0% 15.3% 15.5%
Graduate and
Professional
Enrollment Targets
10

Performance MetricBaseline
2015-16
AY
16-17
AY
17-18
AY
18-19
AY
2019-20
AY
2020-21
6-Year Grad. Rate
Total – All Students 52.8% 54.3% 55.7% 57.1% 58.6% 60.1%
Low-income 45.1% 45.7% 47.8% 49.9% 52.0% 54.1%
URM 51.1% 51.8% 53.6% 55.2% 56.8% 58.5%
1st to 2nd-Year Retention
Total – All Students 79.7% 79.9% 80.3% 80.8% 81.2% 82.0%
Low-income 74.5% 75.0% 75.6% 76.2% 77.0% 77.5%
URM 78.0% 78.3% 78.9% 79.2% 79.5% 80.5%
Bachelor’s Degrees Awarded
Total – All Students 2,705 2,790 2,840 2,915 3,000 3,100
Low-income 1,143 1,186 1,230 1,271 1,313 1,356
URM 484 507 531 548 567 585
Success Targets
11

University of Louisville
Performance Narrative - Success
High Impact Strategies to Promote Student Success:
• Living/Learning Communities
• Summer Bridge/Early Arrival Programs
• Flight Plan
• Mandatory Mid-term Grades (will work with academic units to implement over the next five years)
• CardSmart Advising Software (identifies students at risk)
• Identity Center - Work with SGA to establish an Identity Center that will house diversity units and facilitate diversity programming and student engagement
12

University of Louisville
Impact
Workforce Diversity – Faculty Profile
13
TOTAL
FULL TIME PART TIME
GENDER GENDER
FEMALE MALE FEMALE MALE
RACE
American Indian/Alaska Native 2 . 1 . 3
Asian 73 166 10 12 261
Black/African American 62 53 25 6 146
Hispanic/Latino 20 31 5 6 62
Native Hawaiian/Other Pacific Islander 1 2 1 . 4
Non-Resident International 28 51 4 3 86
Two or More Races 5 7 2 1 15
Unspecified 1 8 . . 9
White 566 766 275 246 1,853
Total 758 1,084 323 274 2,439
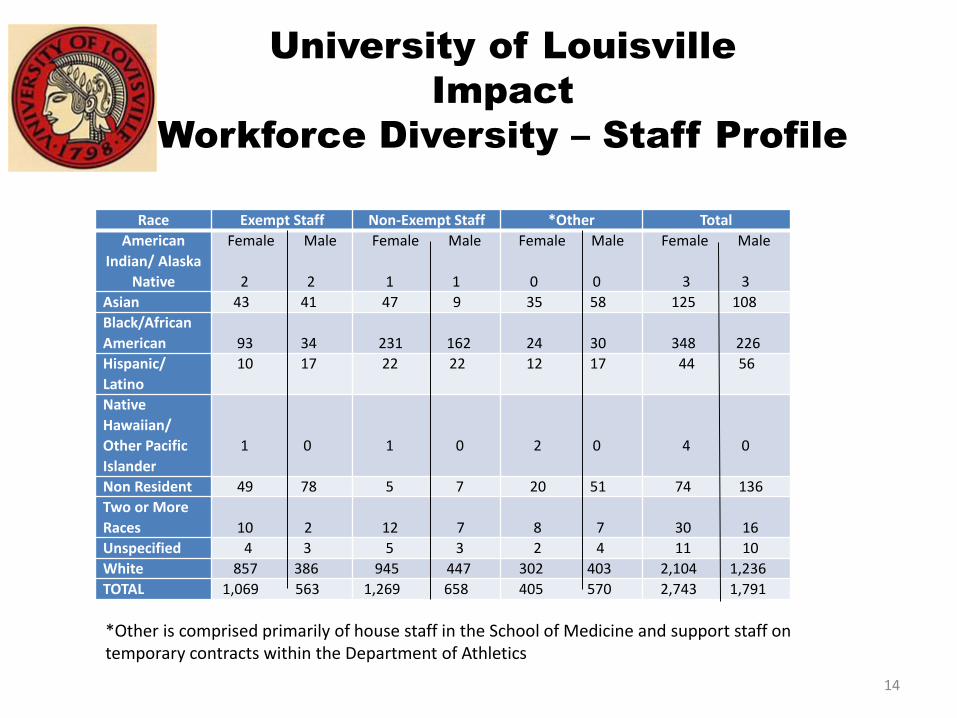
University of Louisville
Impact
Workforce Diversity – Staff Profile
14
Race Exempt Staff Non-Exempt Staff *Other Total
American
Indian/ Alaska
Native
Female Male
2 2
Female Male
1 1
Female Male
0 0
Female Male
3 3
Asian 43 41 47 9 35 58 125 108
Black/African
American 93 34 231 162 24 30 348 226
Hispanic/
Latino
10 17 22 22 12 17 44 56
Native
Hawaiian/
Other Pacific
Islander
1 0 1 0 2 0 4 0
Non Resident 49 78 5 7 20 51 74 136
Two or More
Races 10 2 12 7 8 7 30 16
Unspecified 4 3 5 3 2 4 11 10
White 857 386 945 447 302 403 2,104 1,236
TOTAL 1,069 563 1,269 658 405 570 2,743 1,791
*Other is comprised primarily of house staff in the School of Medicine and support staff on temporary contracts within the Department of Athletics
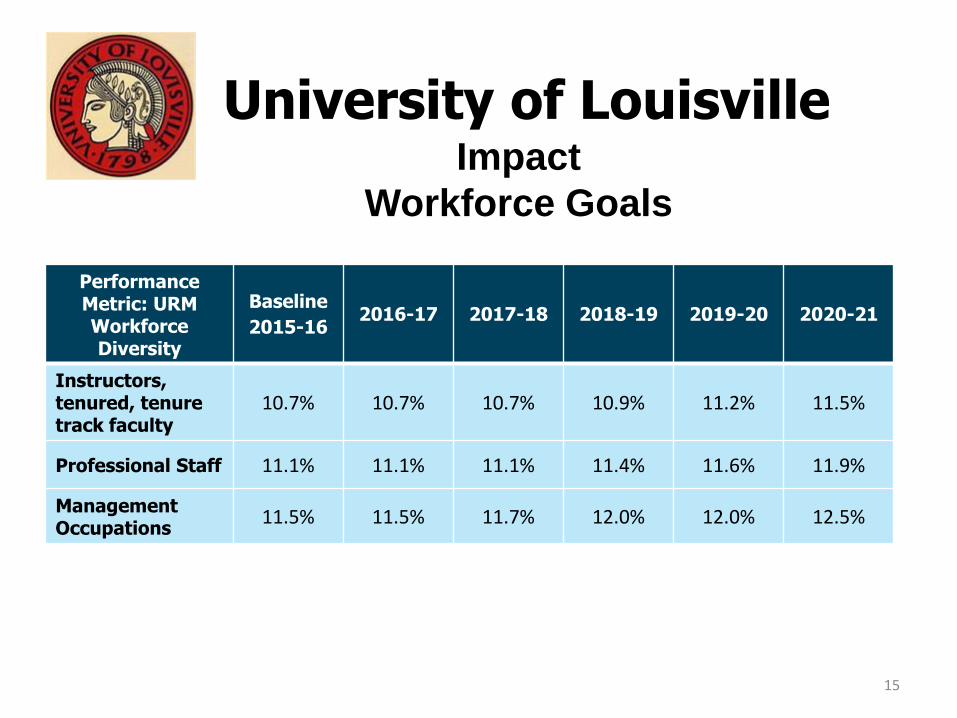
University of LouisvilleImpact
Workforce Goals
Performance Metric: URM Workforce Diversity
Baseline
2015-162016-17 2017-18 2018-19 2019-20 2020-21
Instructors, tenured, tenure track faculty
10.7% 10.7% 10.7% 10.9% 11.2% 11.5%
Professional Staff 11.1% 11.1% 11.1% 11.4% 11.6% 11.9%
ManagementOccupations
11.5% 11.5% 11.7% 12.0% 12.0% 12.5%
15

University of LouisvillePerformance Narrative - Impact
Culture of Excellence
In advancing the 21st Century Culture of Excellence, the diversity plan will focus on creating a culture that values equity, fairness, and inclusion.
High Impact Strategies to Promote Equity and Inclusion and Monitor Climate include: Campus Climate Surveys – beginning Fall 2017, a new survey process and timeline will be implemented:
• Surveys will be administered in periodic modules rather than as one long, comprehensive survey
• Administering one module per year will serve to keep the campus community more engaged in the process, will allow the appropriate time to implement proposed changes, and increase accountability for continuous improvements, providing transparent feedback to the entire campus.
• These proposed cycles allow for the collection of baseline information, creating and implementing action plans, and assessing the themes/modules again after ample time for implementation to measure improvement (based on the actions taken).
16

University of LouisvillePerformance Narrative - Impact
High Impact Strategies to Promote Equity and Inclusion and Monitor ClimateDiversity Training:
A functional area has been created in the Office of the Vice Provost for Diversity and
International Affairs. Diversity Education and Inclusive Excellence training, which
focuses on unconscious and implicit bias; cultural appropriation; micro-aggressions;
and understanding the latent effects of privilege, was designed to support campus-
wide diversity education and training and is based on recommendations from the 21st
Century Culture of Excellence and the President’s Diversity Steering committees.
Human Resources is developing a training model on a “Civil Treatment: Building an
Inclusive Workplace” program.
17

University of LouisvillePerformance Narrative - Impact
High Impact Strategies to Increase the Cultural Competency of Students
Cardinal Core - requires all undergraduate students to take a minimum of two
diversity courses:
• Courses in U.S. Diversity (D1) will broaden students’ understanding of how the
experiences and opportunities of individuals and groups in the United States are
shaped by various historical, cultural and social structures and processes of
stratification. These courses will center on race, socio-economic status, gender
and/or their interactions with other social demographics.
• Courses in Global Diversity Courses (D2) will broaden students’ understanding of
how the experiences and opportunities of individuals and/or groups in non-U.S.
societies are shaped by the various historical, cultural and social structures and of
stratification locally or globally.
18
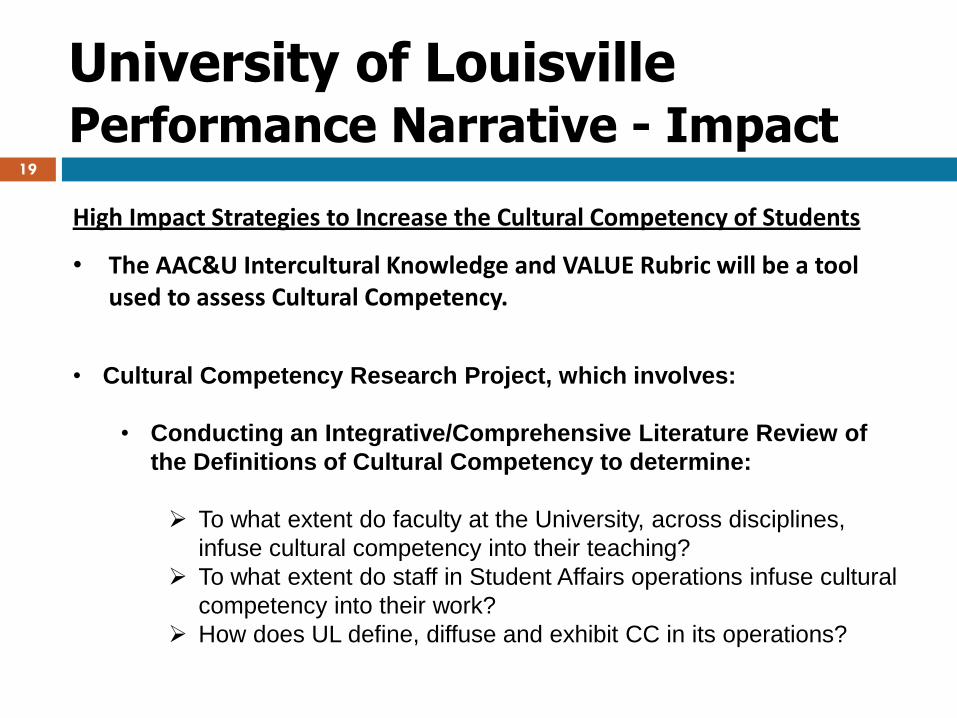
University of LouisvillePerformance Narrative - Impact
High Impact Strategies to Increase the Cultural Competency of Students
• The AAC&U Intercultural Knowledge and VALUE Rubric will be a tool used to assess Cultural Competency.
• Cultural Competency Research Project, which involves:
• Conducting an Integrative/Comprehensive Literature Review of
the Definitions of Cultural Competency to determine:
To what extent do faculty at the University, across disciplines,
infuse cultural competency into their teaching?
To what extent do staff in Student Affairs operations infuse cultural
competency into their work?
How does UL define, diffuse and exhibit CC in its operations?
19

University of LouisvillePerformance Narrative - Impact
High Impact Strategies to Increase the Cultural Competency of Faculty and Staff
Cultural Competency training for faculty and staff will continue to be
provided by the Office of Diversity Education and Inclusive Excellence.
However, the long-range plan is to develop online training modules, and,
although it will not be mandatory, it is expected that all faculty and staff
will participate in the training.
20

University of Louisville
Plan Assessment
Strategies will be assessed by:
• Examining the number of AA, H/L, URM and low-income students enrolled, retained and graduate
• Tracking the number of diverse faculty and staff hired, retained and promoted
• Tracking responses to the campus climate surveys and subsequent interviews with focus groups
• Using pre- and post-tests for workshops and trainings to determine progress regarding cultural competency
• Examining the results of the Deans’ Accountability Measurements
21

University of Louisville
Comprehensive Plan
Other Groups
The UofL Diversity Plan includes a comprehensive view of diversity programs and services to underrepresented groups on campus and in the community, including:
• Women and Gender Issues (including Title IX)
• LGBT Services
• Disability Services/ADA
• Veterans and Military Families
• Globalization/Internationalization Initiatives
• Diversity of Ideas/Thoughts
• Religious Diversity
• Community Engagement
22

University of Louisville
Questions?
23