unravelling the importance of benthic mineralisation and
TRANSCRIPT

Unravelling the Importance of Benthic
Mineralisation and Nutrient Cycling in
Macquarie Harbour, Tasmania
By
Malinda Auluck
Submitted in fulfilment of the requirements for the
Degree of Master of Science
Institute for Marine and Antarctic Studies
University of Tasmania,
April 2016

i
Declaration
Statement of originality
I declare that this thesis contains no material which has been accepted for the award of any
other degree or diploma in any tertiary institution, and to the best of my knowledge contains
no copy or paraphrase of material previously published or written by any other person
except where due acknowledgement is made in the text of the thesis, nor does the thesis
contain any material that infringes copyright.
Malinda Auluck
Statement of authority of access
This thesis may be made available for loan and limited copying in accordance with the
Copyright Act 1968.
Malinda Auluck

ii
Acknowledgements
First, I want to thank my family for giving me encouragement and support. Special
thanks to mum and dad for not only fully supporting me but also for taking up my
commitments when I decided to pursue this.
I would like to sincerely thank my supervisors Jeff Ross and Catriona Macleod for
the support, guidance, endless corrections of my bad grammar and most of all having
confidence in me especially during my difficult times. A really big thank you to Neil
Hartstein for recommending this project and co-supervising this thesis. Many thanks also to
Andrew Pender, Bronagh Kelly, Sam Gray and Adam Davey for the help in the field and
lab. The late night experiments, logistics and actual field work would not have been
possible.
To Daniela Farias and Tania Mendo, thanks for always being there and for the push I
needed to finish this. Your constant encouragement means a lot to me. Special thanks to
Camilla Novaglio, Gisele Astorga and Maxi Farias for taking care of me especially during
the last two months. Thanks for providing me lunches, dinners and desserts. Many thanks to
Rafael Leon (for the statistics advice), Kilian Stefest (for proof reading my chapters), Ivan
Hinojosa (for the company during the late night push), Mana Inoue, Jacob Heathcote, Joana
Cubillos, Felipe Briceno, Soxi Lee, Deborah and so many more. All of you have contributed
towards this. Thanks to the McClure family (Aidan, Steph, Barry and Lyn) for the help
while I was in Hobart. Aidan, I will always be grateful to you for getting me to Macquarie
Harbour.
I would also like to acknowledge DHI Water & Environment (Malaysia) and
Institute of Marine & Antarctic Studies for the financial support. This research was
supported by Fisheries Research and Development Corporation (FRDC).
iii
Abstract
Sediment biogeochemistry was studied in Macquarie Harbour, which is located on
the west coast of Tasmania, Australia. Rates of respiration and fluxes of nutrients, which are
either released or taken up during mineralisation of organic matter, were investigated at a
series of harbour wide sites and at sites under and adjacent to fish farms. Environmental
characteristics of the sediments and overlying water column were also measured to examine
their role in determining sediment biogeochemistry of the harbour. The purpose of this study
was to understand benthic mineralisation and nutrient cycling, particularly nitrogen cycling,
in Macquarie Harbour and the environmental controls of these processes. This study also
assessed the influence of organic loading from fish farming activities on sediment
biogeochemistry.
Sediments cores were collected from nine sites across the harbour in November
2012; these sites were located well outside the influence of benthic enrichment from fish
farms. Sediments were also collected from nine other sites to examine the influence of
organic enrichment from fish farming; six sites were located directly under the outer edge of
fish cages and three sites 50 m from the edge of the cages. To investigate the influence of
farm management practices, the cages, 50 m from cage and a subset of the control sites were
sampled again in January, May and September 2013.
The harbour wide study showed that the sediments in Macquarie Harbour contained
mainly terrestrial sourced organic matter based on its depleted carbon signatures.
Characterisation of the organic matter also showed gradients commonly observed in
estuaries where the isotopic signatures of carbon and nitrogen increased and the percentage
of total organic carbon and total nitrogen contents generally decreased from the upper
towards the lower estuary.
iv
Oxygen consumption and dissolved inorganic carbon (DIC) production rates suggest
that aerobic respiration were the dominant respiration pathway except at a few sites where
anaerobic respiration were prevalent. The uptake of nitrate from the water column for
denitrification at the majority of sites suggest that uncoupled nitrification-denitrification was
an important anaerobic pathway in the harbour. The release of ammonium at most of the
sites further suggest that nitrification in the sediments were limited, most likely due to low
oxygen penetration of sediments. Multiple regression of individual fluxes shows that
oxygen was a clear controlling factor for benthic mineralisation and nutrient cycling in
Macquarie Harbour.
The influence of fish farming on the benthic processes was clearly evident. Oxygen
consumption was six times higher at cage sites compared to the control sites. While oxygen
consumptions at 50 m from the cage sites were often elevated compared to the control sites,
the rates were not significantly higher. The high DIC/O2 consumption ratio, especially at the
cage sites, indicates that the main degradation pathway was through anaerobic respiration.
The presence of a white filamentous mat on the sediments taken from the fish cages
observed during the experiment highlight the likely role of anaerobic sulfate reduction.
Ammonium fluxes from sediments into the water column were also significantly
higher at the fish cages and conversely, nitrate uptake from the water column were higher at
cage sites. This is consistent with a reduction in sediment nitrification due to increased
bacterial respiration and low oxygen concentrations and a greater dependence on nitrate
from the water column for denitrification (i.e. uncoupled nitrification-denitrification). There
was also evidence that some of the nitrate is reduced to ammonium via dissimilatory nitrate
reduction to ammonium (DNRA). The release of phosphate from the sediments occurred at
the cage and 50 m sites, in contrast to phosphate uptake at control sites. Despite the
observed higher ammonium release from farm enriched sediments, there has been no

v
significant change in bottom water ammonium concentrations during the period of
significant industry expansion based on data from the monthly water quality monitoring
program. This suggests that more broadly across the harbour, nitrification in the water
column and sediment denitrification may be buffering the system against the increased
loads. This remains to be tested.
Based on the flux rates, there was no clear indication that there was any temporal
changes in Macquarie Harbour. This may reflect relatively stable bottom water conditions
throughout the year more broadly in the harbour. Sediment conditions showed improvement
at some of the cage sites during fallowing. However, the sediment response to fallowing at
some areas was not as expected. In one of the leases, benthic flux rates did not show signs of
recovery during fallowing (i.e. lower benthic respiration rates, lower nutrient flux rates), and
conversely, during stocking the flux rates declined instead. This suggest that other factors
are likely to be responsible for organic loading and mineralisation of organic matter.
This study is the first assessment of benthic nutrient cycling in Macquarie Harbour
sediments. Importantly it describes sediment function more broadly in the harbour and in
response to organic enrichment due to fish farming. The more recalcitrant organic matter
brought in by the rivers has kept the background oxygen consumption and nutrient levels
low. Despite low oxygen consumption, bottom water oxygen concentrations are naturally
low due to the long residence times and reduced mixing with surface waters. Sediment
nitrification appears to be reduced as a result, with sediment denitrification relying on nitrate
sourced from the water column. Lastly, considering that oxygen concentration is an
important driver of sediment function in Macquarie Harbour, the recently observed decline
in bottom water dissolved oxygen concentration and its implication for nutrient cycling
warrants attention.

vi
Table of Contents Declaration ................................................................................................................................ i
Acknowledgements .................................................................................................................. ii
Abstract ................................................................................................................................... iii
List of Figures ....................................................................................................................... viii
List of Tables ........................................................................................................................... x
Chapter 1: Introduction ............................................................................................................ 1
General Introduction ................................................................................................................ 2
Chapter 2: Spatial variation in benthic fluxes of respiration and nutrients in Macquarie
Harbour .................................................................................................................................. 10
Abstract .................................................................................................................................. 11
Introduction ............................................................................................................................ 11
Materials and Methods ........................................................................................................... 15
Study location .................................................................................................................... 15
Sample collection ............................................................................................................... 18
Sediment-water nutrient fluxes .......................................................................................... 19
Denitrification and dissimilatory nitrate reduction to ammonium (DNRA) ...................... 20
Sediment properties ........................................................................................................... 22
Macrofauna ........................................................................................................................ 23
Statistical analyses ............................................................................................................. 23
Results .................................................................................................................................... 25
Water parameters ............................................................................................................... 25
Sediment description .......................................................................................................... 25
Benthic flux rates ............................................................................................................... 27
Macrofauna ........................................................................................................................ 29
Environmental drivers of benthic fluxes ............................................................................ 31
Spatial variability and the influence of environmental drivers on the suite of benthic
fluxes .................................................................................................................................. 31
Discussion .............................................................................................................................. 38
Sediment characteristics .................................................................................................... 38
Sediment respiration .......................................................................................................... 40
Inorganic fluxes and transformation of nitrogen ............................................................... 42
Phosphate flux .................................................................................................................... 45

vii
Spatial variability and environmental drivers of benthic fluxes ........................................ 45
Comparison with other estuaries ........................................................................................ 47
Conclusion ............................................................................................................................. 50
Chapter 3: Sediment response to organic enrichment in Macquarie Harbour ....................... 51
Abstract .................................................................................................................................. 52
Introduction ............................................................................................................................ 52
Materials and Methods ........................................................................................................... 56
Study location .................................................................................................................... 56
Sampling design ................................................................................................................. 57
Sample collection ............................................................................................................... 59
Sediment-water nutrient fluxes .......................................................................................... 59
Denitrification and dissimilatory nitrate reduction to ammonium (DNRA) ...................... 60
Sediment properties ........................................................................................................... 61
Statistical analyses ............................................................................................................. 61
Univariate analysis ......................................................................................................... 62
Multivariate analysis ...................................................................................................... 62
Results .................................................................................................................................... 63
Sediment characteristics and bottom water dissolved oxygen concentration .................... 63
Benthic flux rates ............................................................................................................... 68
Comparison between cages ................................................................................................ 74
Exploring relationships between fluxes and environmental variables ............................... 75
Discussion .............................................................................................................................. 78
Variability in sediment characteristics ............................................................................... 78
Benthic nutrient processing ............................................................................................... 80
Benthic recovery following fallowing ............................................................................... 85
Conclusion and broader implications .................................................................................... 86
Chapter 4: Discussion ............................................................................................................ 88
General Discussion ................................................................................................................ 89
Conclusion ............................................................................................................................. 93
References .............................................................................................................................. 94

viii
List of Figures
Figure 1 The theoretical vertical distribution of diagenetic processes in marine sediment.
The depth scale is an approximate (modified from Kristensen, 2000). ....................... 3
Figure 2 The chemical species and major processes in the biogeochemical cycling of N
(taken from Herbert (1999) without modification). ..................................................... 5
Figure 3 Map of study sites. ................................................................................................. 17
Figure 4 δ13C, δ15N, C/N molar ratio, TOC and TN content from the top 3 cm of sediments
taken in Macquarie Harbour. Error bar indicates standard deviation of the mean of 2
samples taken from two separate cores. ..................................................................... 26
Figure 5 Flux rates of O2, DIC, PO43-, NH4+, NO2
-, NO3- and denitrification during
incubations of sediments taken from the control sites. All data are presented in mmol
m-2 d-1. Error bars indicate standard deviation of the mean (n= 3 or 4). Total
denitrification rates are the sum of uncoupled (Dw) and coupled nitrification-
denitrification (Dn) rates. ........................................................................................... 29
Figure 6 Principal component analysis (PCO) plot showing the non-metric multivariate
similarity among replicated benthic fluxes of nine sites in Macquarie Harbour. ...... 33
Figure 7 dbRDA plot of the DistLM based on environmental drivers fitted to the variation
of the benthic fluxes from nine sites in Macquarie Harbour. .................................... 34
Figure 8 PCO plot showing the non-metric multivariate similarity among replicated benthic
fluxes of eight sites (excluding KR1) in Macquarie Harbour. ................................... 36
Figure 9 dbRDA plot of the DistLM based on environmental drivers fitted to the variation
of the benthic fluxes from eight sites (excluding KR1). ............................................ 37
Figure 10 Map of sampling locations. Map only shows fish farming leases where sampling
sites were located. ...................................................................................................... 58
Figure 11 δ13C and δ15N signatures from surficial sediments taken at four sampling times.
CF1: Central lease cage 1; CF2: Central lease cage 2; C50: Central lease 50 m; CC:
Central lease control; GF1: Gordon lease cage 1; GF2: Gordon lease cage 2; G50:
Gordon lease 50 m; GC: Gordon lease control; LF1: Liberty Point lease cage 1; LF2:
Liberty Point lease cage 2; L50: Liberty Point lease 50 m; LC: Liberty Point lease
control. ....................................................................................................................... 65
Figure 12 Percentage of total organic carbon (TOC) and total nitrogen (TN) content in
sediments taken from cage, 50 m and control sites in Macquarie Harbour. CF1:
Central lease cage 1; CF2: Central lease cage 2; C50: Central lease 50 m; CC:
Central lease control; GF1: Gordon lease cage 1; GF2: Gordon lease cage 2; G50:
Gordon lease 50 m; GC: Gordon lease control; LF1: Liberty Point lease cage 1; LF2:
Liberty Point lease cage 2; L50: Liberty Point lease 50 m; LC: Liberty Point lease
control. ....................................................................................................................... 65

ix
Figure 13 Differences in C/N molar ratio and porosity among sites. Error bar on each point
represent standard deviation with n=2. ...................................................................... 66
Figure 14 Benthic flux rates of oxygen (O2), dissolved inorganic carbon (DIC), phosphate
(PO43-), ammonium (NH4
+), nitrite (NO2-) and nitrate (NO3
-). Each point represent
average values and error bar for standard deviation of four replicates. Positive values
indicates release from sediment and negative values indicates uptake by sediment. 70
Figure 15 Denitrification and dissimilatory nitrate reduction to ammonium (DNRA) rates
measured in Macquarie Harbour. Dw represents the process of uncoupled
nitrification-denitrification and Dn represents coupled nitrification-denitrification.
Error bar on each bar and point indicates standard deviation. ................................... 71
Figure 16 Relationship between DIC relative to NH4+ and PO4
3-. The Pearson correlation
coefficient (r) is given in the plot. ............................................................................. 74
Figure 17 CAP analysis of variation in flux measurements of sediment samples collected
from cage, 50 m and control sites at Central, Gordon and Liberty Point leases.
Vectors represents correlations of environmental variables to the variation in the
benthic fluxes. ............................................................................................................ 75
Figure 18 Pearson correlation analysis between DIC and NH4+ with several selected
environmental variables which are C:N molar, TOC and TN content. Pearson
correlation coefficient are (r) was also given in the plot. .......................................... 77
Figure 19 Conceptual diagram showing the benthic flux rates of oxygen (O2), dissolved
inorganic carbon (DIC), ammonium (NH4+), nitrate (NO3
-), denitrification, and
phosphate (PO43-) across Macquarie Harbour. All rates are presented in mmol m-2 d-
1. All measurements were taken from November survey. To represent the cage and
50 m sites flux rates, the measurements from all six cage sites and three 50 m sites
were averaged respectively. ....................................................................................... 91

x
List of Tables
Table 1 Name and code, with coordinates of each sampling site. To avoid confusion, the
site names and codes used in this study are identical to the ones used in the FFEMP.
................................................................................................................................... 19
Table 2 Bottom water characteristics at sampling sites in Macquarie Harbour in November
2012. .......................................................................................................................... 25
Table 3 Average porosity, median grain size and oxygen penetration depth (OPD). Error
(±) indicates standard deviation of the mean of 2 samples taken from two separate
cores. .......................................................................................................................... 27
Table 4 Summary of benthic fauna identified. The data represents the total number of
individuals collected from 4 sediment cores of each sampling sites. The average and
standard deviation of each site are also shown. ......................................................... 30
Table 5 Results of multiple linear regression model (using stepwise procedure) determining
the environmental driver of each of the key benthic flux in Macquarie Harbour.
Metric coefficient was also presented. Where the metric coefficient is not presented
for a given predictor variable, this indicates that the particular variable was not
retained in the model. ................................................................................................. 31
Table 6 The eigenvalue and eigenvector of the fluxes on the first five principal component
axes. ........................................................................................................................... 33
Table 7 DistLM on the relation of environmental variables to the benthic fluxes from nine
sites. The variables is explained using stepwise sequential tests, AICc selection
criterion, n = 35 and 9999 permutations. ................................................................... 34
Table 8 The eigenvalue and eigenvector of the fluxes taken from only eight sites on the
first five principal component axes. ........................................................................... 36
Table 9 DistLM on the relation of environmental variables to the benthic fluxes from eight
sites. The variables is explained using stepwise sequential tests. .............................. 37
Table 10 Comparison of fluxes between Macquarie Harbour and other estuaries. ............. 49
Table 11 Sediment characteristics (bottom water dissolved oxygen concentration (BDO),
grain size and depth) of sediments taken from 3 different farm leases in Macquarie
Harbour. ..................................................................................................................... 67
Table 12 Results of one-factor ANOVA of RCBD on the sampling times at cage and 50 m
sites from Central and Gordon leases. Significance level used were p-value <0.05. 71
Table 13 continued Results of one-factor ANOVA of RCBD on the sampling times at
control sites from Central and Gordon leases. Significance level used were p-value
<0.05. ......................................................................................................................... 72
Table 14 Results of one-factor ANOVA of RCBD on distance using measurements taken in
November and January from Central, Gordon and Liberty Point leases. Significance
p-values (<0.05) are shown in bold. .......................................................................... 73

xi

1
Chapter 1: Introduction

2
General Introduction
Estuaries are important transition zone connecting land, freshwater and marine
environment. Not only are estuaries high in productivity and biotic diversity, these systems
also provide critical habitat for commercially important fishes and shellfish (Bianchi, 2006).
The estuarine and coastal environment supports many human uses (Kennish, 1994) for
instance as a place for recreational activities, and infrastructure such as ports for shipping
and transportation and fisheries. Growing human populations have also increased
urbanisation along the coastal waters, escalating the extent of disturbances in the coastal
environments (Small & Nicholls, 2003). Some of these human activities, for instance
industries, agriculture and municipal sewage have caused anthropogenic problems such as
nutrient enrichment, declines in water quality and impacts on the diversity of marine life
(Howarth et al., 2000; Howarth et al., 2011; Kennish, 1994). The ecological processes and
functions of the receiving environment provide important ecological services which includes
organic matter decomposition, nutrient cycling, primary and secondary production and
pollution transport and transformation (Levin et al., 2001). However, continuous inputs from
anthropogenic sources to the estuarine environment could potentially change the ecological
processes which are important for the recycling of nutrients, oxygen regulation in water and
sediments and early diagenetic processes (Middelburg et al., 1993).
Benthic estuarine environments are sites where processes such as mineralisation of
organic matter takes place. The source of organic matter are primarily plant materials and
animal faeces (Bianchi, 2006). Mineralisation of organic matter is an important process for
the recycling of nutrients which are continuously used for primary production. With
anthropogenic activities supplying additional nutrients, increased rates of primary
production may result with a greater potential for algae blooms, and thus eutrophication
(Cloern, 2001; Paerl et al., 2006). The subsequent increase in the supply of organic matter

3
will increase microbial respiration rates and this can lead to hypoxic and anoxic condition
(Cloern, 2001; Middelburg & Levin, 2009; Rabalais et al., 2002).
Deposition of organic matter onto the estuary floor undergoes mineralisation either
through aerobic or anaerobic respiration (Jørgensen, 1983; Kristensen, 2000). Aerobic
respiration is usually dominant in the oxic zone of the sediment where oxygen is the
preferred terminal electron acceptor (Bianchi, 2006). This process mineralises organic
matter to H2O, CO2 and inorganic nutrients. As the oxic zone typically only extends to a few
mm in coastal sediments, mineralisation of organic matter that is buried deeper in the anoxic
layer of the sediment is carried out through anaerobic pathways. Anaerobic mineralisation
occurs in a sequence of terminal electron receptors by different types of bacteria. The order
starts from nitrate (NO3-), manganese oxide (MnO2), iron oxide (Fe(OH)3), sulfate (SO4
2-)
and CO2 (Figure 1) (Bianchi, 2006; Canfield, 1993). An increase in the deposition of organic
matter will first lead to an increase in aerobic respiration and the rapid consumption of
oxygen. When the supply of oxygen becomes limiting, anaerobic respiration becomes
dominant in highly enriched sediments.
Figure 1 The theoretical vertical distribution of diagenetic processes in marine sediment. The depth
scale is an approximate (modified from Kristensen, 2000).
4
During sediment mineralisation, the release of nutrients is imminent. One of the
nutrients that is of particular interest in the estuarine and coastal environments is nitrogen as
it is one of the nutrients that are limiting to primary productivity (Howarth & Marino, 2006).
Ammonium (NH4+) is released via aerobic respiration through the process of
ammonification. The ammonium produced may have several fates which include release to
the overlying water, adsorption on to sediments, assimilation by plants or bacteria, or
transformation to nitrogen gas (N2) via the process of ammonium oxidation (otherwise
known as Anammox) or oxidation to nitrite (NO2-) then nitrate (NO3
-) via the process of
nitrification (Blackburn & Henriksen, 1983; Cornwell et al., 1999; Joye & Anderson, 2008).
Together with ammonium, nitrite and nitrate can also be released into the overlying water
and these bioavailable forms of nitrogen therefore add to the broader supply of nutrients
available for primary production. However, the nitrate and nitrate formed via nitrification
may also be transformed via the process of denitrification which permanently removes
nitrogen from the environment as nitrogen gas. Denitrification is mediated by anaerobic
bacteria that use NO3- as a terminal electron receptor (Cornwell et al., 1999). Denitrifying
bacteria may use NO3- obtained either from nitrification in the sediment or from the water
column. When the microbial process involves the former, the process is referred to as
coupled nitrification-denitrification whereas the use of nitrate from the water column is
referred to as uncoupled denitrification (Herbert, 1999).
Nitrogen may also be retained in the form of NH4+ produced via the process of
dissimilatory nitrate reduction to ammonium (DNRA). This process occurs in the presence
of high sulfide concentrations in the sediment (An & Gardner, 2002; Gardner et al., 2006).
Both processes, denitrification and DNRA, are mediated by bacteria that couple the
oxidation of organic carbon or reduced iron and sulfide to the reduction of NO3- to NH4
+ or
N2 (Hulth et al., 2005) in the anoxic zone and also compete for NO3- as an electron accepter.

5
The broader understanding of benthic nutrient cycling has improves through experiments
and conceptual models, however knowledge at a local scale is still required to predict and
manage any disturbances, such as changes in organic enrichment, to the environment.
Figure 2 The chemical species and major processes in the biogeochemical cycling of N (taken from
Herbert (1999) without modification).
The rates of benthic respiration and nutrient fluxes can be influenced by several
factors. This includes organic loading (Caffrey et al., 1993; Christensen et al., 2000; Holmer
& Kristensen, 1992), presence of macrofauna (Glud et al., 2003; Heilskov & Holmer, 2001;
Kristensen, 1988, 2000) and oxygen concentration (Glud, 2008; Middelburg & Levin,
2009). As discussed, an increase in organic matter supply to sediments increases respiration
rates and nutrient regeneration. However, the depth of the water column also needs to be
considered given that mineralisation of organic matter also occurs in the water column
before it reaches the sediment (Boynton & Kemp, 2008).
Oxygen concentration can also influence benthic respiration and nutrient flux rates.
Processes such as aerobic respiration, nitrification and denitrification depends on the
availability of oxygen in the overlying water column and sediment. Oxygen concentration is

6
known to regulate denitrification rate as oxidation of ammonium either in the overlying
water column or sediment is needed to start the process of denitrification (Rysgaard et al.,
1994; Voss et al., 2011). A reduction in oxygen concentration could also cause a shift from
aerobic respiration towards anaerobic respiration (Middelburg & Levin, 2009). The presence
of macrofauna can also significantly affect the processes in sediments. Bioirrigating
macrofauna can stimulate mineralisation of organic matter and nutrient flux rates by
increasing the oxygen flow into the sediments (Kristensen, 2000). Organic matter can also
be transported between the aerobic and anaerobic zones within the sediments which leads to
greater exposure of organic matter for mineralisation (Aller, 1994).
The enhanced input of organic matter is not limited to the supply from primary
production. Finfish aquaculture is known to enrich benthic sediments in coastal and
estuarine environments through the production of organic waste in the form of uneaten feed
and fish faeces. The future demand for aquatic resources are only increasing with growing
human populations (Bianchi, 2006) and aquaculture has become one of the world’s major
food production industries (FAO, 2014). According to the Stephan and Hobsbawn (2014),
salmonids (salmon and trout), which are mostly farmed in Tasmania, have been Australia’s
most valuable seafood product since 2004-05. The increased use of coastal areas for farming
and intensified farming production in Tasmania has given rise to awareness of potential
environmental problems associated with fish farming, Therefore, increased effort is put into
planning and regulation to ensure that fish farming is environmentally sustainable.
Atlantic salmon take approximately 2 years to grow to harvest size in culture based
on a diet of nutrient rich feed that generally contains fishmeal, plant protein product, animal
by-product meal, crustacean meal or other food additives for growth and aesthetic value.
Over the last 30 years, feeding practices have improved significantly with the improvements
of feed conversion ratio and the use of automatic mechanical feeders (Belle & Nash, 2008).

7
However, the loss of unconsumed feed is inevitable and combined with fish faeces, can form
a significant source of organic enrichment on the seafloor beneath pens. The distribution of
waste material is normally concentrated beneath the pen (Valdemarsen et al., 2009)
nevertheless it also depends on the depth and current speed of the farming area (Black et al.,
2008). Greater depth and stronger current result in a larger depositional footprint but lower
degree of enrichment whereas weaker currents cause a greater accumulation of deposits
closer to the pen (Black et al., 2008). Nutrients from fish excretion (ammonium, urea, etc.)
are generally dispersed and diluted by surface currents. However, together with
mineralisation and the release of nutrient from locally deposited organic enrichment, it
contributes to the broader source of nutrients released from salmon farming that is available
for primary production. To ensure sustainable management of fish farms and ecosystem
protection from nutrient enrichment, activities such as fallowing of sediments is important.
Fallowing is a process of leaving areas for seabed free from farming, allowing the seabed to
eventually recover. The fallowing period may vary at different farm sites due to conditions
of the system such as residence time, rates of benthic processes, magnitude of impact etc., to
effectively reduce the probability for eutrophication to occur.
Growing global and domestic demands for salmon inevitably triggers the need for
expansion, and thus the search for new coastal areas suitable for farming. In Tasmania,
Macquarie Harbour offers a vast area suitable for salmon aquaculture. However, this
estuarine system is unique. The presence of a sill at the mouth of the estuary causes long
residence times and the large catchment inputs of freshwater result in a highly stratified
water column year round. This means that bottom water oxygen concentrations are naturally
low due to limited input of oxygenated oceanic waters. Similarly, vertical mixing is limited
due large freshwater inputs and the highly stratified water column. Thus it is important that

8
farm inputs of organic matter are managed such that the biological oxygen demand of farm
wastes doesn’t exceed the rate of oxygen renewal.
Christensen et al. (2000) studied the effect of fish farming in an estuarine fjord on
nitrogen processes. The study found that DNRA was high directly below fish cages
compared to denitrification while DNRA was negligible at sites unaffected by fish farming.
They estimated that only 0.1% of the nitrogen input from fish farming was removed by
denitrification and with the majority of nitrogen released to the water column as ammonium.
In another study, Nguyen et al. (2012) discovered that fish farming activities in Nha Phu
Estuary, Vietnam led higher respiration rates and the elevated release of ammonium.
Sediment nitrification was also inhibited and denitrification rates were negligible which
means that the estuary retained nitrogen that could be a source for pelagic primary
production. These studies demonstrate that important nitrogen transformation processes,
such as nitrification, DNRA and denitrification, are impacted in enriched sediments below
cage aquaculture, and as a result, the amount of bioavailable nitrogen that ultimately enters
the system. The depletion of oxygen is also known to intensify processes such as sulfate
reduction of organic material. Although the effects of benthic enrichment from cage
aquaculture have been well documented in these study areas, interpretation and application
of these predictions to other farming locations is tenuous. The physical, biological and
chemical characteristic of each system are unique, and therefore, local measurements and
data are imperative to ensure a robust understanding of benthic responses. Given the unique
conditions of Macquarie Harbour, understanding the interaction of benthic processes is
crucial.
This study was driven by the lack of understanding of benthic processes in
Macquarie harbour in the face of the proposed expansion of fish farming. The aims of this
study were to 1) quantify benthic respiration and nutrient flux rates at system and farm
9
scales, 2) identify the relationship between benthic processes and environmental drivers, 3)
obtain preliminary information on benthic-pelagic interactions in Macquarie Harbour, and 4)
investigate the effects of fish farming on benthic respiration and nutrient processes.
The three chapters are presented with the following objectives, with Chapters 2 and 3
written in a style suitable for publication:
1) Chapter 2: Quantifying the benthic processes and identifying potential environmental
drivers at a system scale. Comparison to previously studied estuaries.
2) Chapter 3: Quantifying and understanding the benthic response due to organic
enrichment from fish farming. Preliminary assessment of benthic processes in
response to farm management.
3) Chapter 4: Synthesis of results from both chapters and discussion of the major
findings, particularly in relation to nitrogen cycling and availability and the influence
of oxygen on Macquarie Harbour’s benthic processes.
10
Chapter 2: Spatial variation in benthic fluxes of respiration and
nutrients in Macquarie Harbour

11
Abstract
Benthic studies were conducted using sediments collected from various sites around
Macquarie Harbour, Tasmania, Australia. Fluxes of dissolved oxygen, ammonium, nitrate,
nitrite, phosphate, dissolved inorganic carbon (DIC), denitrification and dissimilatory nitrate
reduction to ammonium (DNRA) were measured for nine sites with depths ranging from 7
to 40 m. The isotopic signatures of the sediment showed a gradient with increasing carbon
(δ13C) and nitrogen (δ15N) signatures from the upper to the lower reaches of the harbour.
Respiration rates were lower around the central harbour which could be attributed to several
factors including low dissolved oxygen in the overlying water, recalcitrant organic matter
and depth. The DIC: oxygen ratios were >1 at four sites indicating anaerobic respiration at
those sites. The sediments in the harbour were generally a source of ammonium but a sink
for nitrate. Nitrate uptake occurred at most sites. This nitrate might be used for either
uncoupled denitrification or DNRA, consequently, uncoupled denitrification could play an
important role in controlling nitrogen in the water column in Macquarie Harbour. Bottom
water oxygen concentration was the most significant driver of the observed benthic fluxes,
suggesting that changes in bottom water oxygen concentration could affect the sediment
biogeochemistry in the harbour.
Introduction
Important ecological processes such as decomposition, nutrient cycling, primary and
secondary production occur in estuaries (Alongi, 1998; Levin et al., 2001). Interaction
between these processes can generate high productivity, making estuaries both ecologically
and economically important (Barbier et al., 2011). Nutrient regeneration in sediments plays
a key role in estuarine productivity where pelagic and benthic processes are strongly coupled

12
through the fluxes of nutrients across the sediment-water interface (Cowan et al., 1996;
Herbert, 1999; Kemp & Boynton, 1984).
One of the most important processes in coastal nutrient processing is the nitrogen (N)
cycle; understanding the transformation and fate of N is important because it is a limiting
factor for primary production (Howarth et al., 1988; Ryther & Dunstan, 1971). In sediments,
mineralisation of organic matter produces ammonium (NH4+) (Bianchi, 2006) which can
then be released from the sediment into the overlying water column, adsorbed onto
sediments, assimilated by plants or bacteria, oxidised to nitrite (NO2-) then nitrate (NO3
-)
(nitrification) or transformed to N2 via the process of ammonium oxidation (Cornwell et al.,
1999; Joye & Anderson, 2008). Denitrification takes place in deeper anoxic sediment layers
and converts NO3-, sourced either from nitrification or from the overlying water column, to
gaseous nitrogen (N2), effectively removing the N from the system (Cornwell et al., 1999;
Rysgaard et al., 1994). However, dissimilatory nitrate reduction to ammonium (DNRA) can
also occur in the anoxic sediment layers, in this case N is retained in the system when NO3-
is reduced to NH4+ (An & Gardner, 2002).
The cycling of phosphorus (P) between the sediment and water column is also
important in coastal water bodies, and can in some systems limit primary productivity. The
fate of phosphate (PO43-) in the sediments is largely controlled by the presence of iron
hydroxide which has the capacity to adsorb PO43- , releasing it again when iron (III) is
reduced to iron (II) in anaerobic conditions (Kraal et al., 2015; Roden & Edmonds, 1997).
The release or retention of nutrients, such as PO43- and NH4
+, produced from mineralisation
of organic matter in the sediments, can influence both primary productivity and re-supply of
organic matter.

13
In coastal areas, increased nutrient loading from anthropogenic activities has caused
an increase in eutrophication (Howarth et al., 2000). Eutrophication, which is defined as an
increase in the rate of organic matter supply in an ecosystem (Nixon, 1995), stimulates
benthic respiration which rapidly consumes oxygen (Howarth et al., 2000; Jensen et al.,
1990; Trimmer et al., 2000). Prolonged rapid oxygen consumption leads to hypoxia (< 2.0
mg/L), a common side-effect of eutrophication (Diaz & Rosenberg, 2008). The increase rate
of respiration due to an increase in the supply of organic matter not only decreases oxygen
concentration, it also supplies more nutrients to the water column which can further fuel
primary production.
Denitrification is an important mechanism for the removal of N (Seitzinger, 1990).
However, the importance of denitrification differs among systems in response to changes in
the concentration of water column NO3-, rates of carbon mineralisation, oxygen
concentration of the overlying water, oxygen penetration depth and the presence or absence
of vegetation and macrofauna (Cornwell et al., 1999; Nixon et al., 1996). At the same time,
some of these controlling factors are not just limited to regulating denitrification. Oxygen
concentration in the sediment and overlying water also has the potential to change other
biogeochemical processes given that oxygen has a significant influence on the various
processes that underpin both the N and P cycles (Joye & Anderson, 2008; Rysgaard et al.,
1994; Sundby et al., 1992). In the case of denitrification, oxygen levels regulate the rate of
denitrification, influencing the oxidation of NH4+ (Rysgaard et al., 1994; Voss et al., 2011).
A reduction in oxygen concentration could also cause a change in microbial communities
that use alternative electron acceptors such as NO3-, manganese (IV), iron (III) and sulfate
(Middelburg & Levin, 2009). Hypoxia is not limited to anthropogenic-induced
eutrophication, it can also be the result of natural or a combination of natural and
anthropogenic-induced processes (Middelburg & Levin, 2009). Changes in hydrodynamics

14
such as water column stratification, restriction in water exchange and high residence times
can also decrease oxygen levels and lead to hypoxia or anoxia (Diaz & Rosenberg, 2008;
Eyre, 1998; Rabalais et al.).
There are a range of other factors that could influence biogeochemical processes, for
example the burrowing activities of macrofauna can influence mineralisation and sediment
nutrient fluxes by introducing newer organic matter deeper into the sediment and providing
a new interface for microbial colonisation (Kristensen, 1988). Nizzoli et al. (2007) found
that Nereis bioturbation stimulated oxygen and NH4+ fluxes between sediment and water
column, and uncoupled denitrification. Physical properties such as sediment grain size can
influence solute transport between sediment and the water column. For example, the rate of
oxygen and nutrient exchange between the sediment and overlying water column will be
influenced by the type of transport, either through diffusive transport common in fine
sediment or through advective pore-water transport which is common in larger sediment
grain size (Cook et al., 2007; Huettel et al., 2014). The combination of factors that are likely
to be important in influencing biogeochemical processes in the sediments vary from system
to system, highlighting the importance of local understanding of biogeochemical processes.
Macquarie harbour is a unique estuary with fjord-like hydrodynamic characteristics.
The harbour has been studied comprehensively over the past four decades as a result of
mining discharge and dam activities, which have caused changes to the harbour. Several
studies have provided information on the hydrology, hydrodynamic, biological and sediment
chemistry of the harbour as part of rehabilitation efforts and scientific research (see
Carpenter et al.; Cresswell et al., 1989; Koehnken, 1996; O'Connor et al., 1996; Talman et
al., 1996; Teasdale et al., 1996; Tong & Williamson, 1998). Since mining activities ceased
in the 1990’s, the key industries associated with Macquarie Harbour are tourism and
aquaculture of salmon and trout. The salmonid industry is rapidly expanding in Tasmania,

15
with a particular focus on Macquarie Harbour, where the water quality conditions such as a
thick freshwater layer, low rates of fouling and low seal activity are particularly suitable for
growing salmon (DPIPWE et al., 2011). However, there is potential for negative effects
associated with fish farming due to the inputs of dissolved nutrients to the water column and
particulate loads to the benthos associated with faeces and uneaten feed (X. Wang et al.,
2012). Given the unique characteristics of the harbour environment, such as naturally low
bottom water dissolved oxygen conditions (Koehnken, 1996) and low light penetration in
the water column (O'Connor et al., 1996), the system response may not be easily predicted
from our understanding of conditions (Koehnken, 1996; O'Connor et al., 1996; X. Wang et
al., 2012) in other systems. There is a lack of understanding of the benthic biogeochemical
processes in Macquarie Harbour, addressing this knowledge gap is important particularly if
we wish to understand the implications of increased benthic enrichment associated with
further expansion. Therefore, the key aims of this study are to, for the first time, quantify the
rates and processes of benthic mineralisation of organic matter in Macquarie Harbour and to
determine the environmental drivers that could influence these processes. This information
will provide critical background understanding to underpin the assessment of the impacts of
farm based enrichment on benthic processes addressed in Chapter 3.
Materials and Methods
Study location
Located on the West Coast of Tasmania, Macquarie Harbour is an estuary with a
deep central basin with depths of 30 to 55 m. The harbour receives water from three major
sources: freshwater from the Gordon and King rivers and seawater from the open ocean
(Koehnken, 1996). A sill at the inlet of the harbour restricts the exchange of water between
the harbour and the open ocean, a characteristic commonly found in fjords. The restricted

16
water exchange has resulted in a stratified water column with high dissolved oxygen (DO),
low salinity surface waters; low DO and higher salinity bottom waters caused by long
residence time and an intermediate layer which is a mix of the bottom and surface layer (see
Carpenter et al., 1991; Cresswell et al., 1989; Koehnken, 1996).
The harbour, along with other estuaries on the western and southern coast of
Tasmania, are considered to have low productivity compared to other estuaries in Tasmania
(Edgar et al., 1999). Edgar et al. (1999) attributed this to low inputs of dissolved nutrients
and the dark tannin waters. For example, the abundance and diversity of macrofauna in
Macquarie Harbour is considered low (Edgar et al., 1999; O'Connor et al., 1996). Other than
small areas of reef found below 15 m depth in Macquarie Harbour, approximately 77% of
the total substrate area is predominantly silt and 19% is sand, with the sandy areas generally
located around the inlet at Hells Gate (Lucieer et al., 2009).

17
Figure 3 Map of study sites.

18
Sample collection
To examine benthic mineralisation at different locations in the harbour, nine
sampling sites were selected as shown in Figure 3 with location details provided in Table 1.
The sampling sites were chosen to include a broad coverage of the harbour and to overlap
with water quality monitoring sites used as part of the Fish Farm Environmental Monitoring
Program (FFEMP) (DPIPWE, 2012; DPIPWE et al., 2011). Using a box corer with a
Perspex liner attached, four box cores containing undisturbed sediment were collected from
each site in November 2012. Sediments from each box core were subsampled using two
different sizes of polyethylene cylindrical cores for benthic flux analysis. For benthic
respiration and nutrient flux (oxygen (O2), dissolved inorganic carbon (DIC), ammonium
(NH4+), nitrite (NO2
-), nitrate (NO3-) and phosphate (PO4
3-)) measurements, a large core
measuring 300 mm and 150 mm in diameter was used. A smaller core 300 mm and 44 mm
in diameter were used for measuring denitrification and dissimilatory nitrate to ammonium
(DNRA) flux rates. All the cores were filled with sediments to a depth of around 100 mm.
Without disturbing the sediments inside, the cores were filled with bottom water taken from
approximately 1 m above the sediment in the harbour and then stored in a tub filled with
bottom water prior to transfer to the laboratory. Measurements of bottom water temperature,
salinity and DO concentration were also taken using a YSI 6600 V2 Multi Parameter Water
Quality Sonde with a YSI 650 MDS logger (YSI Incorporated, Ohio, USA).

19
Table 1 Name and code, with coordinates of each sampling site. To avoid confusion, the site names
and codes used in this study are identical to the ones used in the FFEMP.
Site Name Site Code Coordinates (GDA 94)
X Y
World Heritage Site 1 WH1 375844.8 5303913.08
World Heritage Site 2 WH2 370224 5309960.28
Central Harbour Site 1 CH1 366536.4 5314142
Central Harbour Petuna PET3 362733.8 5313568.72
Central Harbour Tassal TSC 364678 5315867
Central Harbour East CHE 366930 5318194
Central Harbour Site 2 CH2 361896.3 5310351.61
Central Harbour North CHN 361224 5321325
King River KR1 361454.8 5325884.75
Sediment-water nutrient fluxes
The sediment cores of each sampling site were first immersed in a plexiglass tank
filled with bottom water drawn from the sampling site. Site water was used to emulate local
conditions of the sediment-water interface. The top of the cores were left open and stirred
overnight in a temperature controlled water bath, which is used to maintain in situ water
temperature, to equilibrate. Each core was stirred at a rate adequate to allow mixing of the
water column inside the cores as well as to prevent resuspension of the sediments. All
incubations were conducted in the dark, to reflect the dark tannin waters of the harbour.
Once the cores were sealed to begin incubation, 130 ml of water samples were taken for
dissolved nutrients (NH4+, NO2
-, NO3- and filterable reactive phosphorus (measured as
PO43-)) and DIC analyses using plastic syringes. All samples were filtered through a 0.45
µm filter (Minisart-plus; Sartorius AG, Goettigen, Germany). Dissolved nutrient samples
were then stored in 50 ml polyethylene vials and immediately frozen until analysis. Samples
for DIC were kept in 12 ml glass vials (Exetainer; Labco, High Wycombe, UK) and
preserved with 20 µl of Mercuric (II) chloride and refrigerated until analysis.

20
Simultaneously, DO concentration and pH were measured using HACH LDO101
(HACH, Colorado USA) optical DO and pH probe. The cores were left to incubate until the
O2 was lowered by 10 – 20 % as described in Dalsgaard et al. (2000). Incubation periods for
the sampled sites were between 11 and 24 hours and water samples were collected 4 times
over the incubation period. The fluxes of each analyte were calculated based on the change
in concentration over time, while taking into consideration the water volume inside the cores
and surface area of the sediment (Dalsgaard et al., 2000), and were corrected for any
replacement of water.
At the end of the nutrient flux incubation, a 25 µm tip O2 micro-electrode (Unisense
A/S, Aarhus, Denmark) was used to obtain O2 concentration profiles starting from 20 mm
above the sediment surface. The micro-electrode was then lowered into the sediment and at
every 0.5 mm depth O2 saturation and voltage were recorded once the signal settled. The
measurements were stopped when O2 saturation reached 0%. Two incubation cores from
each site were used for microprofiling.
All nutrient samples (NH4+, NO2
-, NO3- and PO4
3-) were analysed by the Water
Studies Centre (WSC, Monash University) using flow injection analysis (FIA) (Lachat
Quikchem 8000 Flow injection Analyser, spectrophotometric detector). All nutrient analyses
followed the procedures in Standard Methods for Water and Wastewater (APHA 2005). DIC
was analysed based on the Coulorometric method using a LI-7000 CO2/H2O gas analyzer
(LI-COR Biosciences, Lincoln, NE, USA).
Denitrification and dissimilatory nitrate reduction to ammonium (DNRA)
Denitrification incubations were carried out simultaneously with the sediment-water
nutrient incubations. Denitrification was measured using the isotope pairing technique
described by L. P. Nielsen (1992) whereby the rates were calculated from the accumulation

21
of labelled N2 after the addition of labelled 15NO3- in the cores. At the start of the incubation,
a 15 ml water sample was taken prior to the addition of 15NO3-. The water overlying the
sediment in the cores were left to mix for ~ 1 minute before another 15 ml water sample was
taken to determine the initial concentration of 15N-NO3-. The cores were then capped for
incubation (i.e. to allow 15NO3- to diffuse towards the denitrification zone and reach
equilibrium). The measurements of 15 NO3- were carried out as a time series, with incubation
times similar to that of the nutrient flux. Each time DO measurements and water samples
were taken, one core was sacrificed by adding ZnCl2 to the cores then homogenising them
by stirring gently with a glass rod. These cores were left to settle for approximately 1 min
before a water sample was taken to calculate N2. These samples were preserved in a 12 ml
glass vials (Exetainer; Labco, High Wycombe, UK) containing 250 µl of ZnCl2 50% w:v
until analysis. The isotope pairing technique is now widely used to measure denitrification
rates (e.g. K. Nielsen et al., 1995; Sundbäck et al., 2004; F. Wang et al., 2003), however,
like most experiment methods there are several assumptions whereby 1) the 15NO3- must be
mixed homogeneously with the 14NO3- in the sediment, 2) the rate of denitrification does not
change as a result of the 15NO3- addition, 3) the isotope fractionation should be neglected
and 4) the 15NO3- in the overlying water must be able to diffuse into the denitrification zone
(Nielsen, 1992). To verify these assumptions, a concentration series experiment was
conducted with the addition of 0.2, 0.4 and 0.6 mL of 15NO3- (0.05 mol L-1 15NO3
-; 98%+,
Cambridge Isotope Laboratories) to the water column of nine cores. The values of
denitrification were found to be constant at all concentrations. As a result, 0.2 mL of 15NO3-
was used to obtain denitrification rates.
To determine DNRA rates, a sample for 15N-NH4+ was collected at the end of
denitrification incubations. The rates were calculated based on a linear increase in the

22
amount of 15N-NH4+ produced during the incubation over time as described in Roberts et al.
(2012).
Sediment properties
At the end of the nutrient flux incubation, the upper 3 cm of sediment were collected
from two cores for sediment porosity, isotopic carbon (δ13C), isotopic nitrogen (δ15N), total
organic carbon (TOC) content, total nitrogen (TN) content measurements and particle size
distribution using a 60 ml cut-off syringe. Sediment porosity was determined from weight
loss after oven-drying samples at 105°C to a constant weight. Particle size distribution was
determined using laser diffraction, i.e by measuring the distribution pattern of scattered light
emitted from the dispersed sediment sample using a Saturn Digisizer 5200 (Micromeritics
Instrument Corp., USA). The median diameter (D50) for particle size was determined.
Samples for TOC and TN contents and isotopic composition were finely ground prior to
analysis, and the sample for TOC analysis was acidified with a dilute HCl solution to
dissolve solid carbonates. All samples were analysed at the Water Studies Centre, Monash
University on an ANCA GSL2 elemental analyser interfaced to a Hydra 20-22 continuous-
flow isotope ratio mass-spectrometer (Sercon Ltd., UK). TOC and TN content were
expressed as the percentage dry weight of sediment (% d.w.). The precision of TOC and TN
content based on replicate analyses (SD for n=5) of the same sample was 0.5 µg. The
analytical precision for stable isotope analysis was ± 0.1‰ for δ13C and ± 0.2‰ for δ15N
(SD for n=5). Stable isotope data were expressed in delta connotation (δ13C and δ15N). δ13C
and δ15N were calculated from the relative difference between the isotopic ratio within the
sample and the isotopic ratio of Vienna Pee Dee Belemnite standard for C and atmospheric
N2 for N.

23
Macrofauna
Benthic macrofaunal samples were collected from each nutrient flux incubation core
at the end of the incubation period. Sediments were sieved through a 1 mm sieve and the
material retained on the sieve was preserved with buffered 10 % formalin for at least 48
hours before being rinsed and preserved in 70% ethanol. Macrofauna was sorted from the
detritus under a dissecting microscope, identified and enumerated.
Statistical analyses
To identify which environmental predictors best explain each benthic flux, best
subsets multiple regression analyses was used. The average value of the replicates for each
predictor variable (porosity, δ13C, δ15N, TOC, TN, C/N molar ratio, bottom water dissolved
oxygen (BDO), depth, grain size and faunal abundance) were analysed against each benthic
flux. All explanatory variables were included in the initial multiple regression analysis.
Multi-collinearity issues were identified using correlation coefficients between the predictor
variables and by calculating the variance inflation factor (VIF). VIF >10 indicates multi-
collinearity (Quinn & Keough, 2002). δ13C was found to be correlated with δ15N (R = 0.80)
while porosity was correlated with TOC (R = 0.77), TN (R = 0.81) and C/N molar ratio (R =
0.71). Grain size was also correlated with BDO (R = 0.81) and depth (R = -0.75). Therefore,
separate models were employed, each one containing one of the collinear predictors until the
best subset model was identified using corrected Akaike’s information criterion (AICc).
Normality of the residuals and homogeneity of variance was checked using the graphical
method described by Quinn and Keough (2002) and collinearity of the retained predictor
variables in the final models were verified again.
The multivariate analyses of benthic fluxes were performed using principal
component ordination (PCO) to determine the relationship of the samples to each other

24
(ordination) in multidimensional space. PCO was chosen because it is flexible while
maintaining its functionality to project points onto axes that minimise residual variation in
the space of the resemblance measure chosen (Anderson et al., 2008). Prior to the analysis,
homogeneity of each variable was assessed using draftsman plots and all data except for O2
fluxes required transformation. All flux data were then “normalised” as a standardisation
routine in PRIMER v6 (PRIMER-E, United Kingdom), (Clarke & Gorley, 2006). A vector
plot was overlaid to determine which fluxes were driving the differences among sites.
A distance-based linear model (DistLM) using stepwise selection, AICc, 9999 n
permutations and a significance level of α = 0.05 was used to identify which environmental
variables best explained the observed variation in benthic fluxes. The predictor variables
used in DistLM were identical to those used in the multiple regression. Before any of the
predictor variables were added to the model, draftsman plots of each predictor variable were
used to detect skewness and check for collinearity. TOC and TN contents were highly
correlated (R > 0.95). To determine which variable would be excluded, an initial run of the
model with all the environmental variables included was undertaken. Based on marginal
tests in DistLM, the p-value for TOC content was larger than TN content, therefore the latter
variable was retained for possible inclusion in the model. Through addition of each predictor
variable, sequential testing examined the statistical contribution of each variable to the
explained variation and this was presented as a result of the DistLM. Distance-based
redundancy analysis (dbRDA) was used to visualise the results of the DistLM. PCO and
DistLM analyses were both performed using the software package PRIMER v6

25
Results
Water parameters
Bottom water temperatures ranged from 13.6 to 14.5 °C. The temperatures were
generally similar throughout the harbour with an average temperature of 14.3 °C (± 0.2 °C),
except at CHN and KR1 where temperatures dropped below 14 °C. Salinity readings around
central harbour sites and KR1 ranged from 30.4 to 31.1 ppt, while salinity was slightly lower
at CHN (29.4 ppt). At WH1 the water was brackish, with salinity reading of 18.2 ppt.
Bottom water dissolved oxygen (BDO) concentrations were highest at sites CHN and WH1,
whereas sites located around the central harbour had lower DO concentrations, ranging from
1.1 to 2.2 mg/L.
Table 2 Bottom water characteristics at sampling sites in Macquarie Harbour in November 2012.
Site Depth (m) Temperature (°C) Salinity (ppt) DO (mg/L)
WH1 7 14.3 18.2 5.5
WH2 30 14.5 31.1 1.1
CH1 40 14.3 31.1 2.1
PET3 18 14.1 30.4 1.2
TSC 32 14.3 31.0 2.2
CHE 18 14.3 30.6 1.8
CH2 35 14.3 31.0 1.9
CHN 13 13.6 29.4 3.5
KR1 33 13.9 31.1 2.5
Sediment description
The elemental composition and stable isotopic results for each sampling site are
shown in Figure 4. Carbon signatures (δ13C) were similar across sites, ranging from -27.04 ±
0.01 to 28.22 ± 0.86 ‰. Nitrogen signature (δ15N) was lowest in the upper estuary (WH1) at
1.6 ± 0.01 ‰ and increased to 4.6 ± 0.16 ‰ in the lower estuary. There appeared to be a

26
similar pattern in the distribution of total organic carbon (TOC) and total nitrogen (TN)
content throughout the harbour. TOC and TN content were lowest at the site closest to the
mouth (CHN) whereas sites located in the middle of the harbour generally had higher TOC
and TN content. Sediment in the upper estuary had C/N molar ratios (23.69 ± 7.53) similar
to those in the mid estuary (20.88 ± 0.23 – 24.08 ± 0.86), whereas the C/N molar ratio was
low at CHN (15.93 ± 0.23) compared to other sites.
Figure 4 δ13C, δ15N, C/N molar ratio, TOC and TN content from the top 3 cm of sediments taken in
Macquarie Harbour. Error bar indicates standard deviation of the mean of 2 samples taken from two
separate cores.

27
Sediment porosities were generally similar across sites, with the exception of WH1
and CHN as shown in Table 3. Sediment porosity was low at the southernmost site, WH1
(0.58 ± 0.00) increasing towards the central harbour with values ranging from 0.71 ± 0.05 to
0.82 ± 0.03 before decreasing again in the northern reaches of the harbour at CHN (0.37 ±
0.05). Highest porosity was at KR1 with 0.84 ± 0.02. A similar pattern was observed for
median grain size. Median grain size value was higher at WH1 (44.40 ± 18.16 µm) and
CHN (18.63 ± 10.28 µm) compared to sites WH2, CH1, PET3, TSC, CHE and CH2 in mid
estuary (ranging from 6.74 ± 0.44 to 11.54 ± 0.12). Oxygen penetration depth (OPD) was
highest at WH1 and CH2 at 3.0 ± 1.0 mm while other sites ranged from 1.0 ± 0.5 mm to 2.5
± 10.5 mm.
Table 3 Average porosity, median grain size and oxygen penetration depth (OPD). Error (±)
indicates standard deviation of the mean of 2 samples taken from two separate cores.
Site Porosity Median grain size (µm) OPD (mm)
WH1 0.58 ± 0.00 44.40 ± 18.16 3.0 ± 1.0
WH2 0.76 ± 0.08 10.48 ± 0.34 1.5 ± 0.0
CH1 0.81 ± 0.03 7.69 ± 0.98 2.0 ± 0.0
PET3 0.81 ± 0.02 11.54 ± 0.12 2.5 ± 0.5
TSC 0.82 ± 0.03 9.47 ± 0.95 2.5 ± 0.0
CHE 0.79 ± 0.00 6.85 ± 0.05 2.0 ± 1.0
CH2 0.71 ± 0.05 6.74 ± 0.44 3.0 ± 1.0
CHN 0.37 ± 0.05 18.63 ± 10.28 No data
KR1 0.84 ± 0.02 8.68 ± 1.05 1.0 ± 0.5
Benthic flux rates
The calculated fluxes across the sediment-water interface at all sites are shown in
Figure 5. Oxygen (O2) flux rates ranged from -2.98 ± 1.57 to -17.22 ± 1.10 mmol m-2 d-1.
Most sites in the middle of the harbour (WH2, CH1, PET3, TSC, CHE, CH2) showed lower
O2 consumption rates, notably WH2 (-2.98 ± 1.57 mmol m-2 d-1), CHE (-4.09 ± 2.76 mmol

28
m-2 d-1) and CH1 (-4.25 ± 1.87 mmol m-2 d-1) compared with WH1 (-17.22 ± 1.10 mmol m-2
d-1) in the upper reaches of the harbour and CHN (-13.84 ± 3.67 mmol m-2 d-1) closest to the
mouth of the harbour. The highest dissolved inorganic carbon (DIC) efflux was at KR1
(40.24 ± 7.91 mmol m-2 d-1), with a flux rate three time higher compared to the other sites.
Aside from KR1, DIC efflux rates ranged from 3.78 ± 1.3 to 13.16 ± 7.05 mmol m-2 d-1.
Uptake of PO43- was high at CHN (-0.035 ± 0.02 mmol m-2 d-1), whereas the uptake rates of
PO43- at the other sites ranged from -0.002 ± 0.01 to -0.017 ± 0.00 mmol m-2 d-1.
There was a large efflux of ammonium (NH4+) at KR1 (2.01 ± 0.37 mmol m-2 d-1);
five times higher compared to the other sites. More generally, the efflux of NH4+ ranged
from 0.09 ± 0.05 to 0.35 ± 0.13 mmol m-2 d-1 except at CHN where there was an uptake of -
0.17 ± 0.10 mmol m-2 d-1. There were no changes in nitrite (NO2-) concentrations at sites
WH1, WH2, CH1 and TSC. At the other five sites where NO2- concentrations were detected,
KR1 had the highest efflux of NO2- (0.04 ± 0.01 mmol m-2 d-1) followed by CHE and PET3
whereas CH2 had the highest uptake at 0.02 ± 0.00 mmol m-2 d-1 followed by CHN. For
nitrate (NO3-) fluxes, sediment uptake occurred at all sites except at WH1, where the efflux
rate was 0.030 ± 0.08 mmol m-2 d-1. Highest NO3- uptake rate was at KR1 (-0.409 ± 0.02
mmol m-2 d-1) while the lowest was at CHN (-0.0043 ± 0.09 mmol m-2 d-1).
Total denitrification rates ranged from 0.055 to 0.215 mmol m-2 d-1. From the total
denitrification rates, uncoupled nitrification-denitrification (Dw) was lowest at KR1 (0.007
mmol m-2 d-1) and highest at CHE (0.084 mmol m-2 d-1), whereas coupled nitrification-
denitrification (Dn) ranged from 0.019 to 0.157 mmol m-2 d-1. The rate of dissimilatory
nitrate reduction to ammonium (DNRA) varied among sites, but the lowest rate was
recorded at CH2 and the highest at KR1.

29
Figure 5 Flux rates of O2, DIC, PO4
3-, NH4+, NO2-, NO3
- and denitrification during incubations of
sediments taken from the control sites. All data are presented in mmol m-2 d-1. Error bars indicate
standard deviation of the mean (n= 3 or 4). Total denitrification rates are the sum of uncoupled (Dw)
and coupled nitrification-denitrification (Dn) rates.
Macrofauna
Macrofauna data are shown in Table 4. Twenty different taxonomic groups were
identified, although the samples were dominated by annelids. The site located at the lower

30
reaches of the harbour (CHN) had the highest diversity of macrofauna, with identified
individuals coming from 9 different taxonomic groups, while CH2 had the highest
abundance with 22 individuals.
Table 4 Summary of benthic fauna identified. The data represents the total number of individuals
collected from 4 sediment cores of each sampling sites. The average and standard deviation of each
site are also shown.
Family WH1 WH2 CH1 PET3 TSC CHE CH2 CHN KR1
Phoxocephalidae 0 0 1 0 0 0 5 0 0
Cirolanidae 0 1 0 0 0 0 0 1 0
Anthuridae 0 0 0 0 0 0 0 1 0
Nebaliidae 0 0 0 1 0 0 0 0 0
Ostracoda (Class) 0 0 0 0 1 0 0 2 0
Chiridotidae 0 0 0 0 0 0 0 1 0
Hydrobiidae 2 0 0 0 0 0 0 0 0
Lucinidae 0 0 0 0 0 0 0 1 0
Ungulinidae 0 0 0 0 0 1 0 0 0
Thyasiridae 0 0 0 0 1 0 0 1 0
Nemertea
(Phylum) 0 0 0 0 0 0 1 0 0
Flabelligeridae 0 1 0 0 0 0 0 0 0
Goniadidae 1 0 0 0 0 0 0 0 0
Sabellidae 0 0 0 0 0 0 0 3 0
Maldanidae 7 0 0 0 0 0 0 0 0
Orbiniidae 6 0 0 0 0 1 1 0 0
Spionidae 2 0 0 0 7 0 0 0 0
Terebellidae 0 0 1 2 3 0 15 6 0
Ampharetidae 0 1 0 0 0 0 0 0 0
Gobiidae 0 0 0 0 0 0 0 1 0
Total 18 3 2 3 12 2 22 17 0
Average 4.5 0.8 0.5 0.8 3.0 0.5 5.5 4.3 0
Standard dev. 3.7 0.1 0.1 0.5 1.2 0.6 2.5 2.6 0

31
Environmental drivers of benthic fluxes
The subset models which best explained each of the benthic fluxes are presented in
Table 5. The set of environmental variables could explain more than 45% of each benthic
flux rate, most notably BDO (70%). Respiration (measured as O2 uptake) strongly increased
with the increase in BDO concentration, δ15N and TOC content but decreased with
increasing depth. Respiration (measured as DIC release) also increased with increasing BDO
concentrations, δ15N and TOC content but decreased with faunal abundance. Increases in
PO43- release were associated with higher BDO concentrations and sediment TN content.
The release of NH4+ from the sediment was also positively correlated with increasing BDO,
TOC and δ15N but negatively correlated with total faunal abundance. Meanwhile, NO2- flux
rate increased with increasing BDO concentration, porosity and depth. NO3- flux rates were
positively correlated with increasing in median grain size and negatively correlated with the
C/N molar ratio of sediment organic matter.
Table 5 Results of multiple linear regression model (using stepwise procedure) determining the
environmental driver of each of the key benthic flux in Macquarie Harbour. Metric coefficient was
also presented. Where the metric coefficient is not presented for a given predictor variable, this
indicates that the particular variable was not retained in the model.
Flux Adj.
R2 p F δ13C δ15N TOC TN C:N Porosity BDO
Grain Size
Fauna Depth
O2 0.70 <0.001 21.19 a 3.72 a 1.02 b b b b 4.33 c c -0.16
NH4+ 0.66 <0.001 17.62 a 0.69 a 0.30 b b b b 0.75 c c -0.16
PO43- 0.52 <0.001 19.41 b 0.09 b b b 0.01 c c
NO2- 0.45 <0.001 10.32 b b b -0.01b 0.01 c c 0.001
NO3- 0.64 <0.001 31.25 b b -0.03 b c 0.01 c
DIC 0.59 <0.001 12.96 a 10.80 a 4.14 b b b b 13.10 c c -3.07
a, b, c Indicates that the variables are correlated. Only one variable from each group of collinear variables was
used in the model (selection explained in methods).
Spatial variability and the influence of environmental drivers on the suite of benthic
fluxes
PCO plot shows that the first two PCO axes explained 61.31% of the total variation
in the flux data with PCO1 explaining 37.2% of the total variance (Figure 6). The first two

32
axes of the dbRDA plot of predictor variables showed 65.69% variability in the fitted model
and 57.62% of total variation, which indicated that most of the relevant patterns in the model
were captured. The PCO plot showed that the fluxes at KR1, CHN differed from all other
sites, and that this was mostly driven by NO3-, NO2
- and NH4+. DNRA and DIC seemed to
have driven the separation between KR1 while total denitrification, Dn, and Dw compel all
the other sites (Table 6). The result for the best DistLM showed that all of the predictor
variables included in the model significantly driving the benthic flux rates except for
porosity (Figure 7, Table 7). C/N molar ratio, TN, depth, BDO, δ13C, δ15N, median grain
size and fauna together explained 87.7% of the variation in the fluxes. The vector plot for
DistLM showed that the driver of the fluxes at CHN was C/N molar ratio, BDO and depth
for KR1 and TN for all other sites. The dbRDA plot showed similar patterns to the benthic
fluxes PCO plot which indicates that the DistLM captured the overall patterns of the
variability.

33
Figure 6 Principal component analysis (PCO) plot showing the non-metric multivariate similarity
among replicated benthic fluxes of nine sites in Macquarie Harbour.
Table 6 The eigenvalue and eigenvector of the fluxes on the first five principal component axes.
PCO1 PCO2 PCO3 PCO4 PCO5
Eigenvalue 126.32 82.142 51.461 23.308 22.057
Individual % 37.15 24.16 15.14 6.86 6.49
Eigenvector
Denitrification -0.828 -0.444 -0.397 -0.044 -0.060
Dn -0.565 -0.606 -0.607 -0.398 -0.230
DNRA 0.848 0.118 0.085 0.163 -0.392
Dw -0.664 -0.176 0.288 0.436 0.136
PO43- -0.130 -0.624 -0.097 0.315 -0.318
DIC 0.631 -0.094 -0.326 0.099 -0.106
O2 -0.389 -0.265 0.602 -0.222 -0.346
NO3- -0.073 0.578 -0.472 0.220 -0.369
NH4+ 0.379 -0.560 -0.144 0.253 -0.054
NO2- 0.242 -0.473 0.372 -0.031 0.465

34
Figure 7 dbRDA plot of the DistLM based on environmental drivers fitted to the variation of the
benthic fluxes from nine sites in Macquarie Harbour.
Table 7 DistLM on the relation of environmental variables to the benthic fluxes from nine sites.
The variables is explained using stepwise sequential tests, AICc selection criterion, n = 35 and 9999
permutations.
Variable AICc SS(trace) Pseudo-F P
Percent
variation
explained
Cumulative
variation
explained
C:N molar 76.53 64.95 7.79 <0.001 19.10 19.10
TN 69.48 65.07 9.92 <0.001 19.14 38.24
Depth 64.66 39.94 7.28 <0.001 11.75 49.99
BDO 56.95 43.87 10.43 <0.001 12.90 62.89
δ13C 53.23 21.84 6.07 <0.001 6.42 69.32
δ15N 46.39 25.90 9.25 <0.001 7.62 76.93
Median grain
size 36.75 24.37 12.18 <0.001 7.17 84.10
Average fauna
abundance 31.38 12.29 7.65 <0.001 3.61 87.72
% explained variation out of
fitted model
% explained variation out of
total variation
Axis Individual Cumulative Individual Cumulative
1 41.05 41.05 36.01 36.01
2 24.64 65.69 21.61 57.62

35
3 16.31 82.00 14.31 71.93
4 6.52 88.53 5.72 77.35
5 5.96 94.49 5.23 82.88
6 3.85 98.34 3.38 86.26
7 1.66 100 1.46 87.71
Excluding KR1, the PCO and DistLM analyses were repeated to further investigate
the spatial variability and environmental drivers influencing overall flux rates. The PCO plot
shows that the first two PCO axes explained 55.32% of the total variance with 36.13% being
explained by the first PCO axis and 19.19% by the second axis (Figure 8). Total
denitrification dominated the first PCO axis (Table 8). DNRA and NO3- flux rates separate
CHN from the other sites. Meanwhile, DIC flux rates were different at WH1 compared to
the other rates from all other sites. Dw, NO2- and denitrification drove the separation
between CH1 and CH2 and all the other sites. The best DistLM results comprised a mix of
median grain size, C/N molar ratio, BDO concentration, δ13C, TN content, porosity and
faunal abundance (Figure 9, Table 9). Median grain size is the most likely environmental
variable driving the flux rates for WH1 and PET3. The differences in flux rates at WH2,
CHE and TSC seemed to be driven by C/N molar ratio and as for CH1 and CH2 its TN.

36
Figure 8 PCO plot showing the non-metric multivariate similarity among replicated benthic fluxes
of eight sites (excluding KR1) in Macquarie Harbour.
Table 8 The eigenvalue and eigenvector of the fluxes taken from only eight sites on the first five
principal component axes.
PCO1 PCO2 PCO3 PCO4 PCO5
Eigenvalue 108.39 57.578 44.188 26.559 23.876
Individual % 36.13 19.19 14.73 8.85 7.96
Eigenvector
O2 -0.367 0.448 -0.298 -0.532 0.352
NH4+ -0.396 -0.598 -0.347 0.075 -0.068
PO43- -0.553 -0.405 -0.183 0.113 0.397
NO2- -0.455 0.435 -0.180 0.569 0.289
NO3- 0.556 -0.248 0.273 0.230 0.356
DIC 0.274 -0.692 -0.190 0.015 -0.331
Dw -0.742 0.242 -0.209 0.052 -0.458
Dn -0.611 -0.439 0.567 -0.256 0.230
Denitrification -0.820 -0.333 0.521 -0.063 -0.035
DNRA 0.583 -0.298 -0.596 -0.163 0.176

37
Figure 9 dbRDA plot of the DistLM based on environmental drivers fitted to the variation of the
benthic fluxes from eight sites (excluding KR1).
Table 9 DistLM on the relation of environmental variables to the benthic fluxes from eight sites.
The variables is explained using stepwise sequential tests.
Variable AICc SS(trace) Pseudo-F P
Percent
variation
explained
Cumulative
variation
explained
Median grain
size 65.23 79.60 10.47 <0.001 26.54 26.54
C:N molar 62.35 34.91 5.27 <0.001 11.64 38.17
BDO 59.21 31.60 5.54 <0.001 10.53 48.70
δ13N 57.35 21.76 4.28 <0.001 7.25 55.96
TN 55.99 17.68 3.85 <0.001 5.89 61.85
Porosity 48.36 34.20 10.23 <0.001 11.40 73.25
Average fauna
abundance 44.02 18.29 6.79 <0.001 6.10 79.34

38
% explained variation out of
fitted model
% explained variation out of
total variation
Axis Individual Cumulative Individual Cumulative
1 43.90 43.90 34.84 34.84
2 20.31 64.22 16.12 50.95
3 14.17 78.39 11.25 62.20
4 9.58 87.97 7.60 69.80
5 8.52 96.50 6.76 76.57
6 2.97 99.47 2.36 78.92
7 0.53 100 0.42 79.34
Discussion
This study identified significant spatial variability in nutrient flux and benthic
respiration rates in Macquarie Harbour. Benthic fluxes often vary spatially in estuaries due
to the inherent hydrodynamic, biological and chemical complexity of these systems. When
seeking to understand the influence of any additional anthropogenic inputs to a system (such
as marine farming) it is important to understand the natural variability in order to
appropriately differentiate and manage any resultant impacts. The present study is the first
reported measure of benthic respiration and nutrient fluxes at the sediment-water interface in
Macquarie Harbour. The results clearly outline how the differences in the background
environmental conditions affect mineralisation processes and thereby provides information
that will be critical for effective ecosystem management in the harbour.
Sediment characteristics
In this study, the top 3 cm of sediment was sampled and homogenised for sediment
analysis. This depth was chosen as it is likely to integrate effects on sediment characteristics
in the harbour over the last ~ 5 to10 years. The sediments at the shallower locations in the
upper and lower parts of the harbour had a larger median grain size, probably due to high
energy riverine and marine forcings. In the deeper central region the sediments were

39
predominantly smaller in median grain size, most likely as a result of low turbulence and
physical forces allowing a greater level of settlement (Hart, 1995) and the breakdown of
sediment grains in the water column during sedimentation (Middelburg et al., 1993).
Teasdale et al. (2003) suggested that organic matter content of Macquarie Harbour
sediments increased from north to south. Untangling such a pattern in this study is difficult
because of differences in depth and the proximity to other sources of organic matter (e.g.
King River in the lower reaches of the harbour). However, given that the sites in the central
harbour are of similar depth (sites WH2, CH1, TSC and CH2) there does appear to be a
north to south pattern with decreasing levels of total organic carbon (TOC) and total
nitrogen (TN) from WH2 which is at the upper reaches of the harbour towards CH2 at the
lower part of the estuary.
The isotope signatures and C/N molar ratio indicate that the organic matter in the
sediments sampled were mainly terrestrial sourced, composed of vascular plants which
naturally have a low δ13C signature and high C/N (Bianchi, 2006). The lower δ13C
signatures were found at sites closer to the Gordon River (WH1 and WH2) and the values
increased across the harbour towards the lower reaches of the estuary. This pattern reflects
the contribution of marine or estuarine phytoplankton which are δ13C enriched (-18 to -24)
compared to the more depleted δ13C of terrigenous origin of organic matter (-26 to -30) and
freshwater phytoplankton (-24 to -30) at the lower reaches of the harbour (Bianchi, 2006).
δ15N also showed a gradient from north to south, with higher values close to the harbour
entrance and decreasing towards the upper reaches of the harbour. The spatial variation in
δ15N may have been caused by marine organic matter and organisms, which often have
higher δ15N values, brought in through tidal mixing (Finlay & Kendall, 2005). δ15N are also
found to be depleted in terrestrial organic matter (Cloern et al., 2002) which may be
attributed to intensive transformation of N in freshwater sediments (Finlay & Kendall, 2005;

40
Ostrom et al., 2002). C/N molar ratios of Macquarie Harbour sediments were also within the
range for vascular plants (20-500) except at the mouth of the harbour (CHN) were the value
was lower indicating a mix of vascular plants and plankton (Hedges et al., 1988). The
isotope signatures showed a gradient similar to that commonly observed in estuaries such as
the Huon estuary in Tasmania (CSIRO, 2000), the Schelde estuary (Middelburg &
Nieuwenhuize, 1998), and San Francisco bay (Cloern et al., 2002) with δ13C and δ15N values
increasing from the upper to the lower estuary.
Sediment respiration
Higher rates of oxygen consumption were measured in sediments taken from the
sites closest to the riverine and marine boundaries (i.e. CHN, KR1 and WH1). Meanwhile,
the sites located around central harbour (especially WH2, CH1, CHE and CH2) all had
lower oxygen consumption rates. These sites also had the lowest bottom water dissolved
oxygen concentrations, which may have implications for oxygen availability and the
resultant ability to instigate microbial aerobic respiration during mineralisation of organic
matter and oxidation reactions (Middelburg & Levin, 2009; Middelburg et al., 1993).
Murrell and Lehrter (2011) have previously identified that sediment oxygen consumption is
dependent on the availability of oxygen in the overlying water; with sediment oxygen
consumption being low when bottom water oxygen is low but increasing rapidly when the
overlying water is re-oxygenated. It is important to note that the oxygen consumption is not
only a function of respiration but will also occur as a result of chemical re-oxidation of
anaerobic metabolites such as iron (II) and hydrogen sulfide produced during anaerobic
respiration during low oxygen concentration periods. Studies have also shown that oxygen
consumption can be inversely proportional to the depth of the overlying water column
(Hopkinson & Smith, 2004) and that the deposition of organic matter to the sediment

41
depends on the depth of the overlying water (Middelburg et al., 1993). This suggests that at
greater depth, organic matter is more likely to be mineralised in the water column before
reaching the sediment, leaving more recalcitrant components which are more difficult to
decompose, which might also explain the low oxygen consumption rates.
Although oxygen consumption is widely proposed as the most effective way to
represent organic matter mineralisation (Glud, 2008; Lansard et al., 2008), in this study,
given evidence of anaerobic mineralisation in Macquarie harbour sediments, the flux of
dissolved inorganic carbon (DIC) gives a more complete picture of total sediment
mineralisation. In aerobic environments, the ratio of DIC production against oxygen
consumption, referred to as the respiratory quotient (RQ), is generally fairly close to 1
(Hopkinson & Smith, 2004). In this study, DIC/O2 ratios at the site near the marine
boundary (WH1), several of the mid-estuary sites CH1, CHE and King River site (KR1)
were well above 1 suggesting that some of the respiration was via anaerobic pathways. A
long residence time and associated low dissolved oxygen concentration are natural features
of Macquarie Harbour bottom waters (Cresswell et al., 1989; DPIPWE et al., 2011;
Koehnken, 1996), and this could result in an adaptation or shift in bacterial communities that
use other electron acceptors such as nitrate, manganese oxide, iron oxide and sulfate during
decomposition of organic matter (Middelburg & Levin, 2009). The bottom water dissolved
oxygen concentrations in the central harbour were either hypoxic (i.e. < 2.0 mg/L)
(Middelburg & Levin, 2009) or close to hypoxic at CH1 and TSC. Therefore the likelihood
of anaerobic respiration occurring at these sites is high. The three-fold increase in DIC
production compared to oxygen consumption at KR1 may indicate that anaerobic respiration
is prevalent at this site. It is important to note that although bottom water oxygen
concentrations are naturally low in the harbour, concentrations would appear to have
dropped even further in recent years compared to historical records (MHDOWG, 2014).

42
Dissolved oxygen concentrations recorded between 1994 and 2008 rarely fell below 2.5
mg/L. However since 2009 the concentration had been on a decline. Data collected from
2011 onwards together with this study suggest that the bottom water dissolved oxygen levels
are regularly hypoxic (< 2.0 mg/L) at sites greater than 15 m. The drop in dissolved oxygen
could be attributed to a number of factors including natural changes in the system (factors
such as variability in river flow, weather and tidal conditions) and anthropogenic changes
(i.e. the increase in, salmon aquaculture in the harbour) (MHDOWG, 2014). The current
data does not allow for attribution of cause.
Inorganic fluxes and transformation of nitrogen
The combination of bottom water dissolved oxygen concentration, quantity
(measured as TOC, TN) and quality (inferred from C/N molar ratio, δ13C and δ15N) of
organic matter and abundance of benthic fauna were significantly correlated to the rates of
ammonium regeneration in Macquarie Harbour. However, bottom water dissolved oxygen
concentration was the factor most clearly correlated with sediment ammonium release.
Ammonium was released from most of the sediment samples collected within
Macquarie Harbour. Efflux of ammonium suggests that the process of denitrification is
compromised in these sediments and a lower capacity for the conversion of ammonium to
nitrate via nitrification in the sediments is the most likely explanation of this finding. There
are a number of factors that could drive this response and the lower capacity for nitrification
in Macquarie Harbour sediments, these include the low bottom water oxygen concentrations,
low oxygen penetration depths or presence of sulfide (Caffrey et al., 1993; Joye &
Anderson, 2008; Kemp et al., 1990; Koike & Sørensen, 1988; Rysgaard et al., 1996). Low
bottom water oxygen concentration and penetration depth would also increase the potential
for anaerobic mineralisation where microbes would reduce nitrate to produce ammonium
43
through DNRA (Thamdrup, 2012). In the current study, the abundance of benthic fauna was
also found to influence the efflux of ammonium. Burrowing activities affect the depth of
oxygen penetration by increasing the size of the oxic surface area (Kristensen, 1988;
Kristensen & Holmer, 2001), thereby increasing mineralisation of organic matter and the
capacity for coupled nitrification-denitrification in the sediments. This could also potentially
be the explanation for the high efflux of ammonium at KR1 despite the higher bottom water
oxygen concentration. The effect of low oxygen penetration depth and the absence of
benthic fauna were probably key factors in the high efflux of ammonium at this site.
However, the fact that ammonium efflux was observed at most sites suggests that these
sediments may be inherently functioning close to their assimilatory capacity with respect to
denitrification and organic mineralisation and that in this particular system the water column
may play a key role in the denitrification process.
Because of the reduced capacity for sediment nitrification due to low oxygen
availability, both denitrification and DNRA processes in Macquarie Harbour may have
relied on nitrate sourced from the water column. Denitrification which requires sources of
nitrate from the overlying water column and/or through nitrification of ammonium in the
sediment (Jenkins & Kemp, 1984) is therefore limited by the amount of nitrate (Christensen
et al., 1990). In general within Macquarie Harbour 54 to 87% of nitrogen removal was from
coupled nitrification-denitrification, except at sites CHE and TSC where only 20% and 26%
of the denitrification were coupled. Coupling of the nitrification-denitrification processes
can be stimulated indirectly by higher concentration of oxygen and ammonium (Jäntti &
Hietanen, 2012). Despite the low oxygen penetration depth at KR1, coupled nitrification-
denitrification was found to account for 87% of the total denitrification rate, which also
means that a large proportion of the nitrate taken from the water column was for DNRA.
Nonetheless, the fact that there was between 13 to 80% uncoupled denitrification implies

44
that nitrate in the overlying water is an important source for denitrification in the harbour.
As coupled nitrification-denitrification is dependent on nitrate through sediment
nitrification, uncoupled denitrification will be directly proportional to the nitrate
concentration in the overlying water column, where denitrifying bacteria are reported to
rapidly respond to the increase in nitrate concentration (Cornwell et al., 1999; Kana et al.,
1998).. Several studies have reported the importance of water column nitrate for
denitrification in estuarine sediments (Lohse et al 1993; Nielsen et al 1995). The fact that
total ammonia nitrogen in the harbour has remained stable despite sediment efflux of
ammonium into the water column (see MHDOWG, 2014) also supports the assertion that
the release of ammonium from the sediment probably goes through nitrification in the water
column, with the resultant nitrate then being available for denitrification.
Previous studies by Carpenter et al. (1991) and Teasdale et al. (2003) have reported
the presence of sulfate-reducing bacteria within the harbour, with a strong smell of sulfide in
sediment collected from the harbour and high acid volatile sulfide (AVS) values reported
especially around King River. This is important as the presence of sulfide can influence N
transformation through inhibition of nitrification and denitrification while encouraging
DNRA (An & Gardner, 2002). High concentration of nitrate in the water column and sulfide
in sediments may favour the coupling of DNRA and sulfide oxidation by sulfate-reducing
bacteria (An & Gardner, 2002; Sayama, 2001; Thamdrup, 2012). If this is the case, it is
possible that the sulfide in Macquarie Harbour could influence the rate of denitrification and
DNRA, increasing the likelihood of nitrate reduction and further decreasing the
denitrification efficiency.

45
Phosphate flux
There was a general influx of phosphate in sediments of Macquarie Harbour.
Sedimentary phosphorus burial is the main phosphate removal pathway, hence, it is likely to
play a crucial role in regulating phosphorus availability in the water column and primary
productivity (Burdige, 2006). The burial of phosphorus is mainly controlled by oxygen
concentration and iron redox chemistry on the surface of the sediment (House, 2003; Kraal
et al., 2015; Middelburg & Levin, 2009). The influx of phosphate to sediments suggests that
diffusing phosphate from organic matter mineralisation or phosphate from the overlying
water column is most likely adsorbed by surficial iron or manganese oxides (Maher &
Devries, 1994; Nedwell et al., 1999). The adsorption of phosphate could also be linked to
oxygen concentration in the sediments. This may be the circumstance that cause a large
influx of phosphorus in sediments taken from CHN. One point of difference at this site is
that the sediments were coarser than at other locations. Therefore it may be hypothesised
that because of the nature of the sediment at this site, oxygen would be more rapidly
transported deeper into the sediment and that this could promote the binding of phosphate
through subsurface manganese and iron oxidation (Huettel et al., 2014; Huettel & Rusch,
2000).
Spatial variability and environmental drivers of benthic fluxes
Oxygen is important in instigating mineralisation of organic matter and the
subsequent recycling of nutrients in the sediment in Macquarie Harbour. This is because
bottom water dissolved oxygen was the variable that most consistently appeared to be
associated (albeit together with other variables) with predicting most of the flux responses.
In addition, different combinations of environmental variables would appear to explain each
of the benthic fluxes. The most effective combination of the environmental variables

46
measured in this study could explain between 45 to 70 % of the variability associated with
each flux. This means that there are other drivers not measured in this study that could
provide a further understanding of the variability in flux rates.
Sediment median grain size explained a large part of the variation (26.54 %) between
sites (not including KR1). Fine-grained sediments generally are less permeable than coarser
sediments such as sand, which also means that there is less advective oxygen supply in
sediments (Janssen et al., 2005). This can result in shallower oxygen penetration depths
compared to coarser sediment and will influence the rates of benthic processes (Cai &
Sayles, 1996; Huettel et al., 2014).
KR1 was clearly different from other sites of the harbour based on the large
differences in flux rates of ammonium, DIC and DNRA. Benthic mineralisation in KR1 was
predominantly anaerobic, as indicated by the relatively high RQ, ammonium efflux and
DNRA. There could be a number of reasons why this site appears to have shifted towards
anaerobic mineralisation, even with the higher oxygen concentration in the overlying water
compared to sites situated in the central harbour. Perhaps the high levels of metals,
particularly copper, present in the sediments and water column at this location are
influencing the sediment response (Teasdale et al., 1996). KR1 has been highly impacted in
the past by mining operations (Koehnken, 1996), with a large amount of dissolved copper
still entering Macquarie Harbour via the King River (Teasdale et al., 1996). High
concentrations of copper are known to be toxic to many bacteria (Nies, 1999), however,
Pavissich et al. (2010) found that excess levels of copper did not inhibit sulfate reduction in
sulfate-reducing bacterial communities from sediments with long-term exposure of copper
mining residues. The high anaerobic respiration rate measured at KR1 (despite higher
bottom water oxygen concentration) indicate that bacteria such as copper resistant sulfate-
reducing bacteria may be influencing the microbial community and changing the overall

47
community structure from one that is responsible for aerobic respiration. The high
concentrations of copper in this region of the harbour may have also had a major impact on
the abundance of macrofauna (which is on the whole very low to zero as shown in O'Connor
et al. (1996) and in this study), as previous studies have shown adverse impacts of copper on
many marine invertebrates (Morrisey et al., 1996; Neira et al., 2011; Rygg, 1985) and this in
turn could have an associated impact on bioturbation of the sediment. This observation is
consistent with that of previous studies in Macquarie Harbour (O'Connor et al., 1996;
Talman et al., 1996) where low abundance of benthic organisms were reported due to
sediment toxicity caused by copper (Teasdale et al., 2003). Any reduced bioturbation in this
region would in turn potentially reduce the amount of sediment exposed to oxygen, and this
is consistent with the observation of the low oxygen penetration depth at KR1. The different
benthic respiration and nutrient fluxes at KR1 compared to other sites around the harbour
demonstrated the sediments response towards a change in environmental condition.
Comparison with other estuaries
Macquarie Harbour’s unique physical characteristics limit the extent to which
benthic respiration and nutrient flux rates can be compared with other estuaries. According
to Edgar and Cresswell (1991) Macquarie Harbour shares similar physical and hydrological
characteristics to only one other estuary in Australia, which is the pristine Bathurst Harbour
in south western Tasmania. However, there have been no benthic nutrient studies done on
Bathurst Harbour for the purpose of comparison. Consequently in order to assess conditions
and relative performance of the benthic processes in this system the most appropriate
comparison may be with estuaries or fjords in other parts of the world that share similar
physical or hydrobiological characteristics, such as long residence time and restricted
exchange between the estuary and the open ocean.

48
The oxygen consumption rates measured in Macquarie Harbour were comparable to
the rates previously reported for Fanafjorden, Norway (Wassmann, 1984) and Lochs Creran,
Goil, Fyne and Linnhe, Scotland (Overnell et al., 1996) and ammonium flux rates were
comparable to those reported for Loch Creran (Table 10). These systems are physically
similar to Macquarie Harbour in that they have relatively deep basins with shallow sills and
long water residence time. Low bottom water dissolved oxygen concentrations were also a
feature in these systems especially in Loch Goil where oxygen levels could fall as low as 0.9
mg/L before bottom water renewal. Similar to Macquarie Harbour, higher oxygen
consumption rates as a result of the degradation of riverine organic matter were also
measured in the upper regions of the lochs (Overnell et al., 1996). Denitrification and
DNRA rates in Macquarie Harbour fell within the range observed in estuaries such as the
Gulf of Finland (Jäntti & Hietanen, 2012), where water exchange is restricted and highly
eutrophic and where bottom water dissolved oxygen concentration is reduced. Yet, even
though the benthic flux rates in these systems are comparable to that of Macquarie Harbour,
the physical and biological characteristics and the underlying driver of the flux rates in the
harbour may differ from other systems.

49
Table 10 Comparison of fluxes between Macquarie Harbour and other estuaries.
Location Depth (m) Flux (mmol m-2 d-1) Reference
O2 consumption
Loch Creran, Scotland 15 - 17 8.8 - 23.6 Nickell et al., 2003
Loch Goil, Scotland 44 - 86 15.1 - 23.6 Overnell et al., 1996
Loch Fyne, Scotland 38 -130 10.7 - 20.4 Overnell et al., 1996
Loch Etive, Scotland 26 - 123 8.0 - 52.3 Overnell et al., 1996
Loch Linnhe, Scotland 72 -150 7.2 - 19.0 Overnell et al., 1996
100 10.3 - 18.4 Overnell et al., 1996
Fanafjorden, Norway 60 - 90 5.3 -10.8 Wassman, 1984
Macquarie Harbour, Australia 7 - 40 2.98 - 17.22 This study
Ammonium Nitrate
Loch Creran, Scotland 15 - 17 1.29 - 1.40 0.11 - 0.16 Nickell et al., 2003
Loch Linnhe, Scotland 100 0 - 1.5 -0.3 - 0.25 Overnell et al., 1995
Macquarie Harbour, Australia 7 - 40 0.09 - 2.01 -0.41 - 0.004 This study
Denitrification DNRA
Gullmar Fjord, Baltic Sea 1 - 15 0.04 - 0.36 - Sundbäck, 2004
Baffin Bay, US 1.8 - 2.2 0.4 - 1.63 0.48 - 1.4 An & Gardner, 2002
Laguna Madre, US 0.8 - 0.9 0.2 - 0.98 0.9 - 3.6 An & Gardner, 2003
Gulf of Finland, Baltic Sea 60 - 83 0.038 - 1.619 0.033 - 1.06 Jäntti & Hietanen, 2012
Macquarie Harbour, Australia 7 - 40 0.055 - 0.215 0.009 - 0.425 This study

50
Conclusion
The results of this study demonstrated that the Macquarie Harbour sediments are a
source of ammonium but a sink for nitrate. Other than coupled nitrification-denitrification,
uncoupled denitrification in the sediments seemed to be an important pathway for removal
of nitrogen from the overlying water column. The bottom water ammonium and nitrate
concentrations would appear to have remained relatively stable over time (see MHDOWG,
2014) and it is hypothesised that the ammonium released from the sediments is most likely
being oxidised into nitrate in the water column and absorbed into the sediments for
uncoupled denitrification.
Oxygen concentration in the overlying water was one of the most significant factors
in determining the individual nutrient and respiration flux rates in Macquarie Harbour. The
residence time, and thus renewal and condition of Macquarie Harbour bottom water is
influenced by several factors, such as regulated river discharge from the Gordon river dam,
weather and tidal conditions (MHDOWG, 2014). Likewise, the supply of organic matter and
the concomitant oxygen demand during mineralisation will also influence dissolved oxygen
in the bottom waters. The specific role of each of these factors in contributing to the recent
decline in dissolved oxygen concentration remains unclear but irrespective of the drivers the
results of this study suggest that changing bottom water dissolved oxygen conditions will
affect sediment biogeochemistry in the harbour.

51
Chapter 3: Sediment response to organic enrichment in
Macquarie Harbour

52
Abstract
This study provide the first assessment of the effects of organic enrichment from fish
farming on benthic respiration and nutrient cycling in Macquarie Harbour. We compared
flux rates at the fish cages, 50 m away from cages and control sites. The flux rates were
elevated under the cages as a result of organic enrichment from farming activities. DIC/O2
ratios especially at the cages indicate that mineralisation was mostly through anaerobic
pathways. Sediment characteristics indicated that the fish farming footprint may extend
beyond 50 m, however the flux rates at the 50 m sites were not markedly different than the
control sites. This suggests that the deposition of organic matter is highly localised. Directly
below the cages, denitrification was largely dependent on nitrate sourced from the overlying
water column which differs from the control sites where denitrification relied mostly on
nitrate sourced from the nitrification of ammonium in the sediments. The response towards
fallowing and stocking of the fish cages varied considerably amongst the different leases
which showed that other factors may play a significant role in the processing of organic
matter.
Introduction
In recent years, the demand for seafood has increased as a result of human
population growth and declining wild fish stocks (Diana, 2009; Duarte et al., 2009). In
2012-2013, aquaculture production in Australia accounts for 35% of Australian fisheries and
aquaculture production volume. Over the past decade (2004 -2013), salmonid aquaculture in
Tasmania has increased its production by 152% to 42 978 tonnes and has become
Australia’s most valuable fisheries product (Stephan & Hobsbawn, 2014).

53
The expansion of salmonid aquaculture is contingent on ensuring environmental
sustainability. Cage culture can release wastes to the surrounding environments as a result of
uneaten feed, fish faeces and excretion (X. Wang et al., 2012). The accumulation of faecal
waste and uneaten fish feed can lead to impacts on the benthic environment (Holmer &
Kristensen, 1992; Wu, 1995). Several of the reported impacts are high oxygen demand,
elevated nutrient regeneration, production of toxic gases and changes in benthic macrofauna
communities (Black et al., 2008; Holmer et al., 2005; Wu, 1995).
The highly labile organic matter is rapidly mineralised by bacteria either through
aerobic or anaerobic mineralisation. The increase in bacterial activity causes rapid oxygen
consumption in the sediment which consequently decreases the oxic zone and increases the
anoxic zone where anaerobic processes such as denitrification, manganese reduction, iron
reduction and sulfate reduction occur (Glud, 2008; Rysgaard et al., 2001; Sørensen et al.,
1979). Anaerobic mineralisation around fish farms tends to dominate the mineralisation
process. This is evident as highly reduced sediment conditions under fish farms are well
known to appear as black sediment which is from the formation of iron sulfide as a result of
iron and sulfate reduction accompanied by a strong smell of hydrogen sulfide and Beggiatoa
mats (Findlay & Watling, 1997; Hansen et al., 1990; Hargrave et al., 1993; Holmer &
Kristensen, 1992; Karakassis et al., 2002).
High oxygen consumption can not only cause a shift in mineralisation pathways but
also pose as a risk for hypoxia or anoxia. Such decrease in oxygen concentration could
potentially alter nitrogen and phosphorus cycling (Conley et al., 2009; Diaz & Rosenberg,
1995; Sundby et al., 1992). For nitrogen, reduced oxygen concentrations increases the
release of ammonium produced via mineralisation since nitrification is inhibited (Cai &
Sayles, 1996; Herbert, 1999) and dissimilatory nitrate reduction to ammonium (DNRA) is
enhanced (Joye & Anderson, 2008). As a consequence of reduced sediment nitrification,
54
denitrification, the crucial process that permanently removes nitrogen (Berelson et al., 1998;
Seitzinger, 1987), must rely on nitrate sourced from the water column i.e. uncoupled
nitrification-denitrification. Furthermore denitrification may be inhibited by the presence of
sulfide (An & Gardner, 2002) in highly reduced sediment conditions under cage aquaculture
(Bissett et al., 2009; Christensen et al., 2000). For phosphorus, iron bound phosphorus is
likely to be released under anaerobic conditions, thereby contributing to the accumulation of
phosphate produced through mineralisation of organic matter (Lukkari et al., 2008).
Nutrients released from salmon farming together with mineralisation and the release of
nutrients from locally deposited organic enrichment contributes to the broader source of
nutrients available for primary production.
The magnitude and extent of fish farming effects on the benthic environment also
varies depending on the hydrodynamics of the location, production volumes and farm
management practices (Crawford et al., 2002; Kalantzi & Karakassis, 2006; Pearson &
Black, 2001; Read & Fernandes, 2003). Footprint or zone of impact are often highly
localised given sinking velocities of feed and faeces. However, the size of the footprint is
influenced by hydrodynamics (Cromey et al., 2002). In an area that is poorly flushed with
low water current, greater accumulation of organic matter would be concentrated in a
smaller area (Brooks et al., 2002; Sarà et al., 2006). While the disturbances are highly
localised, the slow oxygen renewal due to poor flushing along with rapid mineralisation of
organic matter pose a higher risk for hypoxia when compared to a well flushed system. Thus
it is important that organic matter originating from farming activities are managed such that
the biological and chemical oxygen demand does not exceed the rate of oxygen renewal and
cause alterations in the major nutrient recycling pathways.
In Tasmania, the industry plans to double its production capacity by 2024 (Anon,
2015). In line with Tasmania’s need to increase production to meet demand, fish farming

55
has to be environmentally sustainable. Impacts from fish farming are of major concern to
both farm and environmental managers as it is directly related to fish and ecosystem (i.e.
eutrophication) health (Edgar et al., 2005). Management strategies such as fallowing is
therefore a common practice to allow sediments the opportunity to recover (Macleod et al.,
2006; McGhie et al., 2000). Fallowing is when fish cages are removed or left empty for a
period of time. Studies by Macleod et al. (2006) and Macleod et al. (2007) on salmon farms
located on the southeast of Tasmania have shown that the period for fallowing to be
effective depends on site-specific factors such as farm production, hydrodynamics and
impact levels. They found that the benthic environment underneath fish farms with similar
stocking levels and feed inputs responded differently during fallowing. Even though the
initial impact at a more sheltered area were greater than the exposed ones, the two areas
returned to similar levels following the same period of recovery and this is mostly due to
local hydrodynamics. The sheltered area was more resilient as it naturally received more
organic matter. Meanwhile, at the exposed area, wave and tidal disturbances may have
played a role in preventing speedy recovery. In Macquarie Harbour, the effectiveness of
fallowing is still not known. As it is a very different system to the salmon farms located on
the southeast of Tasmania in terms of residence time, hydrodynamic, and other physical and
biological attributes, the same management practices may not apply to the harbour.
Therefore, it is important to examine the response of the harbour’s benthic environment
towards fallowing.
This study provides the first assessment of the effects of organic enrichment from
fish farming on benthic respiration and nutrient cycling in Macquarie Harbour, comparing
the benthic nutrient flux rates at sites directly adjacent to cages with sites 50 m away and a
more distant control sites. To investigate temporal variation and the benthic response to
fallowing, the survey was conducted four times. The results are used to verify the extent of
56
the fish farming footprint in Macquarie Harbour and the effectiveness of management
strategies.
Materials and Methods
Study location
Detailed information on Macquarie Harbour can be found in the report by Koehnken
(1996). The tidal range in the area is not large (< 0.5 m; (Tong & Williamson, 1998)) and
the water column is strongly stratified (Cresswell et al., 1989) due to freshwater inputs from
the Gordon and King Rivers and constrictive entrance to the Southern Ocean at Hell’s Gate
(Tong & Williamson, 1998). The stratified water consists of three distinct layers: a brackish
surface layer, a bottom layer with low dissolved oxygen and high salinity, and an
intermediate layer which is a mix of the surface and bottom layer (Cresswell et al., 1989).
Macquarie Harbour is considered to be poorly flushed. Koehnken (1996) estimated that the
marine bottom water has a residence time of about 140 days while the freshwater in the
harbour has a residence time of about 70 days. The sediment of the study area is
predominantly silt as reported by Lucieer et al. (2009).
This study was conducted in the vicinity of three Atlantic salmon farming zones.
Information on the marine farming zones and management control is available in Macquarie
Harbour Marine Farming Development Plan (DPIPWE, 2012). Fish farming in Macquarie
Harbour commenced in the 1980’s and since then a total of 926 ha of maximum leasable
area has been approved for fish farming (DPIPWE, 2012). The location for sampling at the
fish farm sites in this study are around central harbour in Zone 4A (Liberty Point lease),
Zone 7 (Central lease) and Zone 8 (Gordon lease) (Figure 10). The average current velocities

57
of the entire water column are low around the fish farms ranging from 1.47 to 1.71 cm s-1
during summer and 2.66 to 4.07 cm s-1 during winter (DPIPWE, 2012).
Sampling design
In each of the three farming zones, sediments were collected under 2 fish cages (cage
1 and cage 2), 50 m away from cage 2 and at a control site (0.5 to 1 km away from cage 2).
The location of cage 2, 50 m and control sites were chosen to reflect a gradient of effects. It
is assumed that maximum impact will occur at the farms and decrease with distance away
from the farm. The control and 50 m sites were selected based on having similar depth and
sediment type to the farms. Sediments from all three study areas (Gordon, Central and
Liberty Point lease) were taken in November ’12 and January ’13 to investigate the gradient
of effects from fish farming activities. Additional samples from Central and Gordon leases
were then taken in May ’13 and Sep ’13 to investigate if there is any temporal differences
and sediment recovery associated with fallowing. During the survey period, sediments at the
Central lease were stocked in November and January and left to fallow in May and
September. At the Gordon lease, cage 1 was stocked the whole time while cage 2 was
fallowed in November, January and May then restocked in September. Depths of the
sampling sites ranged between 18 m and 37 m.

58
Figure 10 Map of sampling locations. Map only shows fish farming leases where sampling sites
were located.

59
Sample collection
A detailed description of the sampling methods are given in Chapter 2. In summary,
four replicate box cores with a Perspex liner were collected at each site. For measuring
nutrient fluxes the box core was sub sampled by gently placing 1 large core (300 mm x 150
mm diameter) into the sediments and the bottom immediately capped to prevent any
disturbance. For denitrification and DNRA, a sub sample was taken from each of the box
cores with a smaller sized core (300 mm x 44 mm diameter). The cores were filled with
bottom water collected from approximately 1 m above the sediment using a pump at each
sampling area before returning to the laboratory. The top 3 cm of the sediments from each
grab were also sampled with a cut off syringe and stored in sample bags (Nasco WHIRL-
PAK) for porosity and grain size analysis. Temperature, salinity and dissolved oxygen
concentration readings of bottom water at each sampling site were recorded for further
comparison of environmental conditions.
Sediment-water nutrient fluxes
As described in detailed in Chapter 2, sediment cores were first immersed in a
plexiglass tank filled with bottom water collected at each site and kept at in situ
temperatures. The next day, the cores were flushed with fresh site water and then sealed to
begin the incubation. Incubations were conducted in the dark to reflect in situ dark
conditions due to the dark tannin rich surface layers. Dissolved oxygen measurements and
water samples for dissolved nutrient (ammonium (NH4+), nitrite (NO2
-), nitrate (NO3-) and
filterable reactive phosphorus (measured as PO43-)) and dissolved inorganic carbon (DIC)
were taken 3 or 4 times in a time series. Plastic syringes were used to collect water samples
which were then filtered through a 0.45 µm filter (Minisart-plus; Sartorius AG, Goettigen,
Germany) then stored in 50 ml polyethylene vials. All nutrient samples were immediately
60
frozen until analysis. Samples for DIC were kept in 12 ml glass vials (Exetainer; Labco,
High Wycombe, UK) and preserved with 20 µl of Mercuric (II) chloride and refrigerated
until analysis. The length of incubation was determined by the total lowering rate of oxygen
concentrations by 10 – 20 % of air saturation (Dalsgaard et al., 2000). The flux of each
analyte was calculated using linear regression of 3 to 4 data points.
All nutrient samples were analysed by the Water Studies Centre (WSC, Monash
University) using flow injection analysis (FIA) (Lachat Quikchem 8000 Flow injection
Analyser, spectrophotometric detector). DIC was analysed based on Coulorometric method
using a LI-7000 CO2/H2O gas analyzer (LI-COR Biosciences, Lincoln, NE, USA).
Denitrification and dissimilatory nitrate reduction to ammonium (DNRA)
Rates of denitrification were measured using isotope pairing technique (L. P.
Nielsen, 1992) as described by Dalsgaard et al. (2000). This method was used to allow
calculation of both coupled and uncoupled nitrification-denitrification. Prior to incubation,
samples were taken before and after the addition of 200 µL of labelled 15NO3- to calculate
the accumulation of 15N-NO3-. The cores were then capped for incubation by allowing the
15NO3- to diffuse towards the denitrification zone and reach equilibrium. The measurements
of N2 were carried out as a time series and each time one core was sacrificed by adding 1 ml
of 50% ZnCl2 into the cores then homogenised by stirring gently with a glass rod. These
cores were left to settle for before samples were taken then preserved in glass vials
containing 250 µl of ZnCl2 50% w:v until analysis.
To determine DNRA rates, samples for 15N-NH4+ were collected from the last
remaining core at the end of the denitrification incubations. The rates were calculated based
on the linear increase in the amount of 15N-NH4+ produced during the incubation over time
as described in Roberts et al. (2012).

61
Sediment properties
At the end of the nutrient flux incubation, the upper 3 cm of sediments were
collected from two cores using a 60 ml cut-off syringe for sediment porosity, isotopic carbon
(δ13C), isotopic nitrogen (δ15N), total organic carbon (TOC) content, total nitrogen (TN)
content and particle size distribution (PSD) measurements. Sediment porosity was
determined from weight loss after oven-drying samples at 105°C to a constant weight. The
median grain size (D50) and percentage of particles from the total within the size range for
silt/clay (<40 µm) were determined from particle size distribution analysis using laser
diffraction method in Saturn Digisizer 5200 (Micromeritics Instrument Corp., USA).
Samples for TOC and TN contents and isotopic composition were finely ground and treated
to remove inorganic carbon which were then sent to analysis on an ANCA GSL2 elemental
analyser interfaced to a Hydra 20-22 continuous-flow isotope ratio mass-spectrometer
(Sercon Ltd., UK) at the Water Studies Centre.
Statistical analyses
Permutational multivariate analysis of variance (PERMANOVA) was first conducted
to verify that the control sites used in this experiment were not significantly different from
areas further way from the impact of fish farming activities. Since PERMANOVA performs
well for balanced designs (Anderson & Walsh, 2013), three sites located within central
harbour (WH2, CHE, CH1; see Chapter 2) and the three sites used as controls for this
experiment (CH2, TSC and PET 3) were tested for differences using the type of sites as a
factor. As the factor only contained 2 groups, a pair-wise test was used for comparison. This
analysis was based on Euclidean distances of untransformed and normalised benthic flux
data. Type III sum of squares and unrestricted permutation of raw data using 999
permutations were applied (Anderson et al 2008).
62
Univariate analysis
A randomised complete block design (RCBD) analysis of variance (ANOVA) was
used to determine significant differences in rates of benthic processes between the cage, 50
m and control sites (response variable vs. distance from source of impact) and between each
sampling period (response variable vs. sampling times). RCBD was used to reduce spatial
effects among the farming areas on the factors distance and time. Because cage 2, the 50 m
and control sites were effectively aligned in a transect, for the purpose of having a balanced
design, cage 1 from all 3 fish farming area were left out of the ANOVA analysis. Instead,
data obtained from cage 1 and cage 2 from all lease area were compared in a descriptive
manner.
As initial analysis demonstrated a significant distance by time interaction, and as
such, RCBD was used to analyse each individual factor separately. The fixed factors were
distance and sampling time with farms as a random blocking factor. To determine the effect
of distance from the source of impact on the response variables, analysis was performed on
the measurements taken in November and January at the 3 farm leases, while the temporal
effect was analysed with measurements taken in November, January, May and September at
sites located at the Central and Gordon leases. Assumptions were verified using Levene’s
test for homogeneity of variance and Shapiro-Wilks test and graphical method by plots of
residuals against predicted values for normality of residuals (Quinn & Keough, 2002). The
data was transformed when the assumptions were violated and the analysis repeated.
Statistical analyses were performed using SAS® software (University Edition, SAS Institute
Inc.).
Multivariate analysis
Canonical analysis of principal coordinates (CAP) was also performed to look at the
relationships of the rates of the benthic processes (response) with environmental variables

63
(predictor). For this analysis, the average value for each environmental variable and benthic
flux rate were used. Data used in this analysis includes all available information for cage 1,
cage 2, 50 m and control sites. Sites containing missing information were taken out of the
analysis. Prior to the analysis, homogeneity of each variable was assessed using draftsman
plot and all data except for coupled nitrification-denitrification (Dn) and total denitrification
were transformed. After transformation, the data was also “normalised” as a standardisation
routine in PRIMER v6 (Clarke & Gorley, 2006). Both PERMANOVA and CAP analyses
were performed using the software package PRIMER v6 and PERMANOVA+ (PRIMER-E,
United Kingdom). To look at the relationship between selected environmental variables and
fluxes, scatter plots and Pearson correlation were used to present the correlation.
Results
The control sites (CH2, TSC and PET3) in this experiment were not significantly
different from sites further away from the fish farming areas (P-perm = 0.52).
Sediment characteristics and bottom water dissolved oxygen concentration
All of the sediments were classified as silt, with grain sizes less than <40 µm (Table
11). Median grain size at the lease sites did not differ markedly but the percentages of
silt/clay were found to be lower at the fish cages (

64
Table 11). Porosity of the sediments were higher in November compared to other
months. However, there was no pattern with distance from the fish cages in any of the areas.
Bottom water dissolved oxygen (BDO) concentrations were generally higher in
November and January compared to May and September. In May and September, BDO
concentrations at Central and Gordon leases dropped to levels below < 1.0 mg/L. BDO
concentration varied from around 0.61 to 1.2 mg/L. No obvious trend was observed with
distance from the cage sites at all farm leases.
The carbon (δ13C) signatures generally decreased with distance from the fish cages
(Figure 2). At the fish cages, δ13C values were higher (-23.76 to -26.17 ‰) compared to both
sites 50 m away (-25.55 to -27.31 ‰) and control sites (-26.86 to -27.89). The same trend
was observed for nitrogen (δ15N) signatures. At the 50 m and control sites, most of the δ15N
values were <5 ‰, whereas the cages had values ranging from 5.16 to 7.45 ‰. The total
organic carbon (TOC) and total nitrogen (TN) contents from surficial sediments showed a
similar pattern to that of the isotope signature values, and were generally higher at the cage
sites, this trend was particularly obvious at the Central lease (Figure 12). At the 50 m site,
TOC and TN contents were markedly lower than at the cage sites, but still higher than the
levels at the control sites (Figure 12). At the Gordon and Liberty Point leases, TOC contents
did not vary as much as it did at the Central lease, with values ranging from 0.07 to 0.11 %
and 0.09 to 0.11 % respectively. TN content was slightly elevated at the cage sites but
decreased with distance.
C/N molar ratios at all control sites were higher than at 50 m and cage sites, with
values ranging between 19.26 and 23.87. At the 50 m sites, the ratios varied between 9.53
and 14.80, except at Liberty Point where the value was higher (19.75) compared to the 50 m
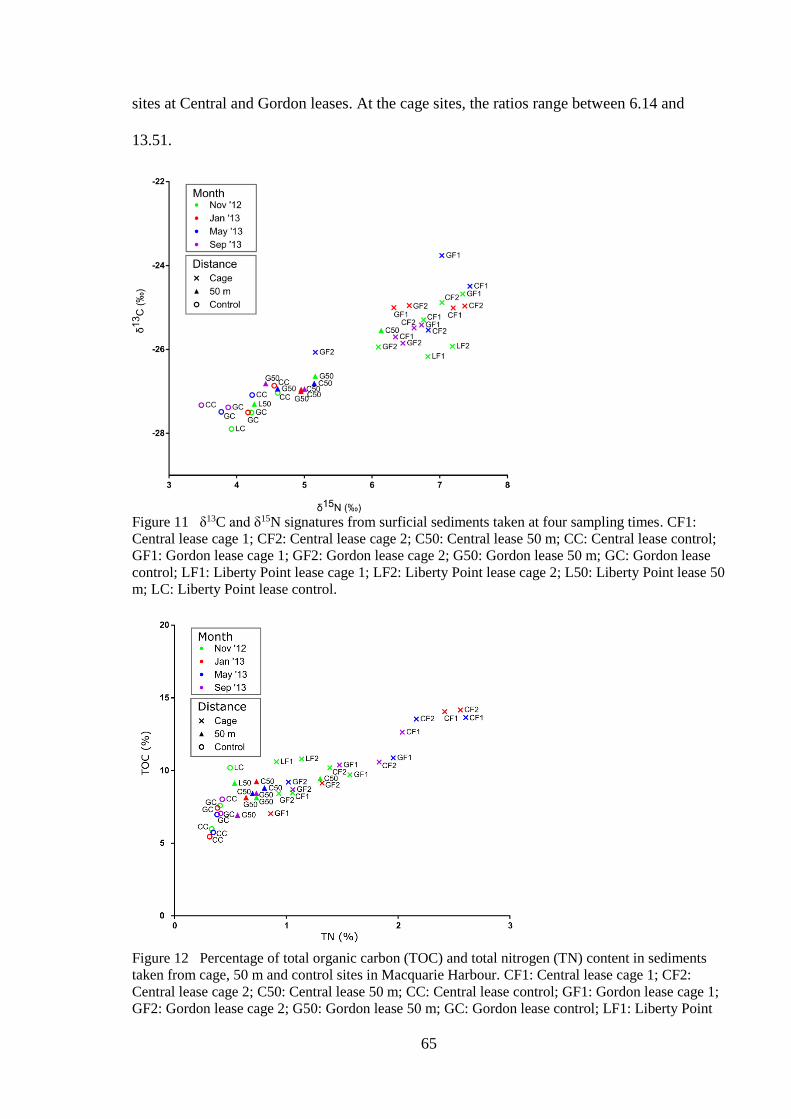
65
sites at Central and Gordon leases. At the cage sites, the ratios range between 6.14 and
13.51.
Figure 11 δ13C and δ15N signatures from surficial sediments taken at four sampling times. CF1:
Central lease cage 1; CF2: Central lease cage 2; C50: Central lease 50 m; CC: Central lease control;
GF1: Gordon lease cage 1; GF2: Gordon lease cage 2; G50: Gordon lease 50 m; GC: Gordon lease
control; LF1: Liberty Point lease cage 1; LF2: Liberty Point lease cage 2; L50: Liberty Point lease 50
m; LC: Liberty Point lease control.
Figure 12 Percentage of total organic carbon (TOC) and total nitrogen (TN) content in sediments
taken from cage, 50 m and control sites in Macquarie Harbour. CF1: Central lease cage 1; CF2:
Central lease cage 2; C50: Central lease 50 m; CC: Central lease control; GF1: Gordon lease cage 1;
GF2: Gordon lease cage 2; G50: Gordon lease 50 m; GC: Gordon lease control; LF1: Liberty Point

66
lease cage 1; LF2: Liberty Point lease cage 2; L50: Liberty Point lease 50 m; LC: Liberty Point lease
control.
Figure 13 Differences in C/N molar ratio and porosity among sites. Error bar on each point
represent standard deviation with n=2.

67
Table 11 Sediment characteristics (bottom water dissolved oxygen concentration (BDO), grain size
and depth) of sediments taken from 3 different farm leases in Macquarie Harbour.
Distance Month BDO
(mg/L)
Grain
Size
(µm)
Silt/Clay
(%)
Depth
(m)
BDO
(mg/L)
Grain
Size
(µm)
Silt/Clay
(%)
Depth
(m)
Central Gordon
Cage
Nov 1.70
5.94 84.40
36 1.60
8.89 92.30
36
Jan 2.60 36 2.30 36
May 0.40 35 0.98 31
Sep 0.46 32 0.55 31
Cage
Nov 1.10
15.12 81.30
26 1.30
10.49 93.60
36
Jan 1.20 26 2.40 36
May 1.02 25 0.93 33
Sep 0.59 25 0.56 33
50m
Nov 1.30
10.79 90.50
26 1.30
11.01 93.90
35
Jan 1.90 26 2.10 35
May 1.09 25 0.83 35
Sep 0.90 25 0.21 35
Control
Nov 1.90
6.74 98.80
35 2.20
9.47 97.20
32
Jan 3.30 35 2.70 32
May 1.61 37 0.60 33
Sep 0.70 37 0.72 33
Liberty Point
Cage Nov 0.90
12.56 91.50 18
Jan 0.63 18
Cage Nov 0.80
12.19 91.30 20
Jan 0.61 20
50m Nov 0.80
11.03 94.50 18
Jan 0.62 18
Control Nov 1.20
11.54 97.20 18
Jan 0.64 18

68
Benthic flux rates
There were no significant differences between the different sampling times at either
the cage, 50 m or control sites for sediment oxygen (O2), nitrite (NO2-), nitrate (NO3
-),
uncoupled nitrification-denitrification (Dw), coupled nitrification-denitrification (Dn), total
denitrification and dissimilatory nitrate to ammonium (DNRA) fluxes (Table 12 and Table
13). In November, O2 flux did not differ significantly with distance from the fish cages (-
6.99 to -28.63 mmol m-2 d-1). However in January, O2 consumption at the fish cages (-18.37
to -70.80 mmol m-2 d-1) were significantly higher than that at either the 50 m (-3.91 to -24.42
mmol m-2 d-1) and control sites (-3.98 to -11.03 mmol m-2 d-1), notably at the Central lease (

69
Table 14). Similar patterns of response were observed at the Central and Gordon
leases for dissolved inorganic carbon (DIC) and phosphate (PO43-) in January. DIC fluxes
were significantly higher at the cage sites than at other stations, with flux rates ranging
between 171.64 and 372.67 mmol m-2 d-1. The 50 m (9.80 to 26.17 mmol m-2 d-1) and
control sites fluxes (5.37 to 7.75 mmol m-2 d-1) were not significantly different. Fluxes of
DIC and PO43- were consistently higher at the cage sites than elsewhere in May and
September, even though there were not significantly different between sampling times. DIC
fluxes in November did not differ significantly with distance from the cages while PO43-
efflux from the sediment to the water column was significantly higher at the cage sites. In
fact PO43- fluxes at the 50 m and control sites were mostly directed from the water column
into the sediment.
The release of NH4+ from the sediment was significantly different between the cage,
50 m and control sites, both in November and January whereas NO2- fluxes did not differ
between the sites over this sampling period. At the control sites, NO3- uptake rates were
significantly lower than at either the cage or 50 m sites, which did not differ significantly
from each other. In November, denitrification and DNRA rates were only measured at the
Gordon and Liberty Point leases and were similar at that time. Denitrification and DNRA
rates measured in January were also not significantly different between sites, but
denitrification rates appeared to decrease with distance from cages. Denitrification, based on
Dw was higher at the cage and 50 m sites compared to the controls, where the rates
suggested Dn. There was also a site specific difference; with rates of DNRA being higher at
the cage site at Central lease, while the DNRA rates at the Gordon and Liberty Point were
similar at 50 m and cage sites.

70
Figure 14 Benthic flux rates of oxygen (O2), dissolved inorganic carbon (DIC), phosphate (PO4
3-),
ammonium (NH4+), nitrite (NO2
-) and nitrate (NO3-). Each point represent average values and error
bar for standard deviation of four replicates. Positive values indicates release from sediment and
negative values indicates uptake by sediment.

71
Figure 15 Denitrification and dissimilatory nitrate reduction to ammonium (DNRA) rates measured
in Macquarie Harbour. Dw represents the process of uncoupled nitrification-denitrification and Dn
represents coupled nitrification-denitrification. Error bar on each bar and point indicates standard
deviation.
Table 12 Results of one-factor ANOVA of RCBD on the sampling times at cage and 50 m sites
from Central and Gordon leases. Significance level used were p-value <0.05.
Variable Cage 50m
Transformation P-value Transformation p-value
O2 log(x) 0.1543 x 0.3219

72
DIC log(x+0.1) 0.0661 x1/3 0.4257
PO43- log(x+1) 0.055* log(x) 0.2344*
NH4+ x 0.093 x 0.8724
NO2- x1/3 0.9137 x 0.4892
NO3- x 0.7052* x 0.3641
Dw x 0.2388 x 0.8301
Dn x 0.9858 x 0.4416
Denitrification x 0.6132 x 0.6732
DNRA x 0.2907 x 0.9139
*Indicates that normality of residuals analysed using Shapiro-Wilks test was not met
Table 13 continued Results of one-factor ANOVA of RCBD on the sampling times at control sites
from Central and Gordon leases. Significance level used were p-value <0.05.
Variable Control
Transformation p-value
O2 log(x+0.1) 0.2698
DIC x 0.4555
PO43- log(x+0.1) 0.7164*
NH4+ log(x+0.05) 0.1457
NO2- log(x+0.03) 0.5485*
NO3- x 0.5502*
Dw x 0.6879
Dn x 0.7566
Denitrification x 0.6911
DNRA x 0.558
*Indicates that normality of residuals analysed using Shapiro-Wilks test was not met.

73
Table 14 Results of one-factor ANOVA of RCBD on distance using measurements taken in
November and January from Central, Gordon and Liberty Point leases. Significance p-values (<0.05)
are shown in bold.
Month Variable Transformation p-value Tukey
Nov O2 log(-x) 0.0617
DIC log(x) 0.0568
PO43- x+0.51/3 0.0100* Cage 50m Control
NH4+ log(x+0.1) 0.0253 Cage, 50m, Control
NO2- None 0.0772
NO3- x1/3 0.0003 Cage 50m, Control
Jan O2 log(-x) 0.0170 Cage 50m Control
DIC log(x) 0.0007 Cage, 50m Control
PO43- x1/3 0.0004 Cage, 50m Control
NH4+ log(x+1.5) 0.0118* Cage, 50m, Control
NO2- log(x+0.1) 0.1333*
NO3- x+0.51/3 0.0009* Cage 50m, Control
Dw x 0.3071
Dn x 0.8097
Denitrification x 0.3071
DNRA x 0.2562 *Indicates that normality of residuals analysed using Shapiro-Wilks test was not met
DIC flux was strongly correlated with both NH4+ (Pearson R = 0.9673, P < 0.05) and
PO43- (R = 0.8187, P < 0.05) (Figure 16). The relationship between DIC and NH4
+ was not
so clear at the 50 m (R = 0.6268, P > 0.05) and control sites (R = 0.4500, P > 0.05),
compared to the fluxes at the cage sites (R = 0.9519, P < 0.05). The correlation between DIC
and PO43- was also stronger at the cage sites (R = 0.7388, P < 0.05), but the fluxes at the 50
m and control sites were not significantly correlated. DIC was positively correlated with
DNRA (R = 0.6687, P < 0.05) and negatively correlated with O2 flux (R = -0.7403, P <
0.05).

74
Figure 16 Relationship between DIC relative to NH4+ and PO4
3-. The Pearson correlation coefficient
(r) is given in the plot.
Comparison between cages
The fish farming leases had different stocking and fallowing periods during the study
period. The O2 consumption rate at both cage sites within the Central lease decreased during
fallowing (Figure 14). In January, at cage 1, O2 consumption rate decreased when compared
to the consumption rate in November even when the cage was stocked. In contrast, O2
consumption rate increased two-fold at cage 2 in January compared to November.
Observation of the other fluxes indicate that when the cages were stocked DIC, PO43- and
NH4+ flux rates were higher compared to fallowing period while the NO3
- flux rate
decreased.
At the Gordon lease, O2, DIC, NH4+ and NO3
- flux rates at cage 1 all increased
during fallowing period and decreased after restocking (Figure 14). There was no obvious
pattern in these nutrients at the stocked cage 2 with the exception of O2 and NO3- flux rates
which decreased with time. Benthic flux rates at Liberty Point’s cage 2 generally increased
after stocking, except for O2 which decreased from November to January. Meanwhile, fluxes
at cage 1 declined during fallowing in January except for PO43- and NH4
+.

75
Exploring relationships between fluxes and environmental variables
The CAP result shows that there were very strong and significant correlations
between the fluxes data cloud (based on Euclidean distances) and the measured
environmental variables (P= 0.0001). The first canonical correlation was high (δ1 = 0.9718),
while the second canonical correlation was δ2 = 0.7321 (Figure 17). The first 2 PCO axes
explain 94.45% of the total variability in the resemblance matrix. The CAP analysis clearly
separated the cages, 50 m and control sites. C/N molar ratio had the highest canonical
eigenvector value, indicating that this variable had the largest effect on the multivariate
distribution (CAP1). Percentage of silt/clay and porosity were more strongly correlated with
the sample site distribution (correlated with CAP2). Observation of the multivariate pattern
showed no clear temporal differences.
Figure 17 CAP analysis of variation in flux measurements of sediment samples collected from cage,
50 m and control sites at Central, Gordon and Liberty Point leases. Vectors represents correlations of
environmental variables to the variation in the benthic fluxes.
-0.4 -0.2 0 0.2 0.4
CAP1
-0.4
-0.2
0
0.2
0.4
CA
P2
Normalise
Resemblance: D1 Euclidean distance
Distance*MonthCtrl-N
Cage-N
50m-N
Cage-J
50m-J
Ctrl-J
Cage-M
50m-M
Cage-S
50m-S
Ctrl-S
%siltclay
δ13 (‰)
15N (‰)%C
%N
C:N molar
Porosity
BDO
Grain Size
Depth

76
Scatter plots (Figure 18) of C/N molar ratio, TOC and TN content relative to DIC and
NH4+ reveal strong inverse correlations between these variables, and distinct separation of
sites with distance away from the cage. Smaller C/N molar ratios were correlated to higher
DIC and NH4+ fluxes, while higher OC and TN levels in the sediment were correlated with
higher DIC and NH4+ loads.
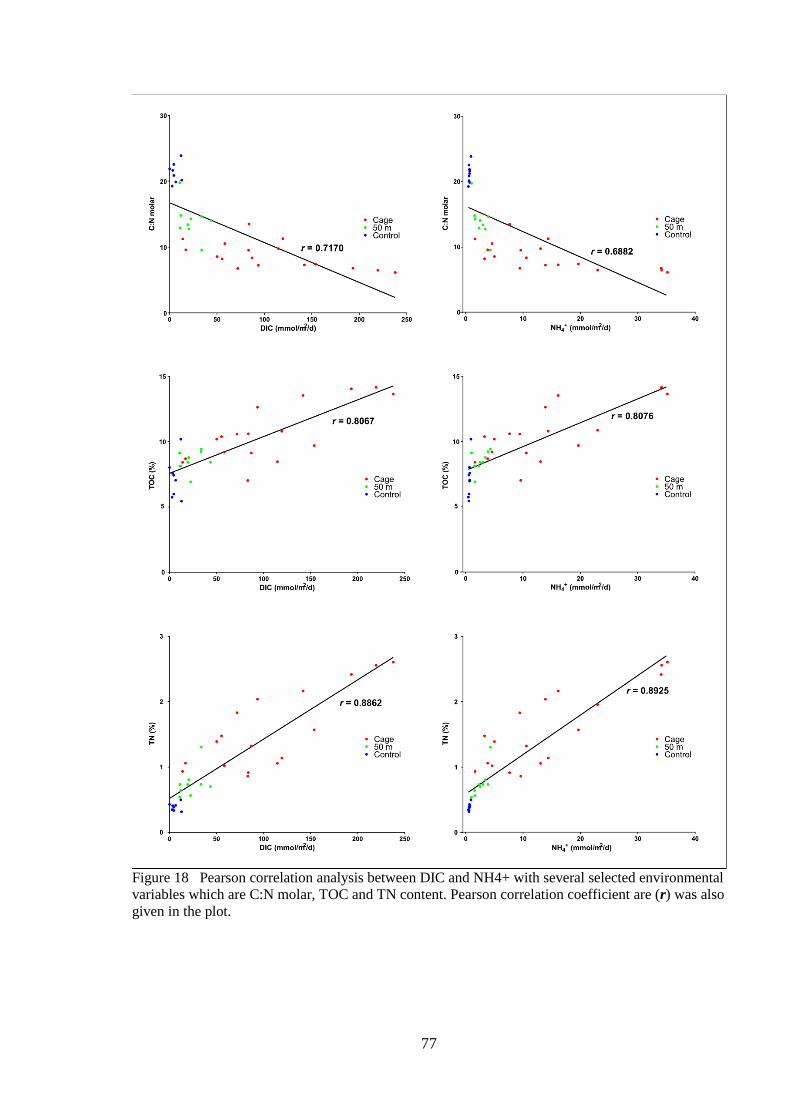
77
Figure 18 Pearson correlation analysis between DIC and NH4+ with several selected environmental
variables which are C:N molar, TOC and TN content. Pearson correlation coefficient are (r) was also
given in the plot.

78
Discussion
Variability in sediment characteristics
There was a clear effect of farming at cage sites in Macquarie Harbour based on all
of the measures of organic enrichment assessed in this study; with the result observed being
broadly consistent with that previously reported from other salmon farming regions in the
southeast of Tasmania (Macleod et al., 2004). However, there were subtle differences in
many of the individual measures of organic enrichment that provide an understanding on the
small scale variability within the selected study sites (leases).
Previous studies have reported marked differences in the spatial extent of organic
enrichment associated with fish farming; Karakassis et al. (1998) and McGhie et al. (2000)
found that the farthest effects were only 20 to 25 m away from the fish cages, whereas
Yokoyama et al. (2006) and Sarà et al. (2006) found effects up to 300 m and 1000 m from
the cages respectively. There may be a number of reasons for these differences, including
but not limited to, production intensity, water depth and current velocities. Areas with low
current velocities tend to limit the range of organic matter deposition, for example the
depositional footprint of waste material in the Gulf of Castellammare (a location with low
flow; mean velocity of current ~12 cm s-1) was less than 100 m away from fish cages (Sarà
et al., 2006). In Macquarie Harbour, the flow rate around the farm sites was between 1.47 to
4.07 cm s-1 all year round, and there was a deposition footprint with measures of organic
enrichment (TOC, δ13C, TN, δ15N, C/N molar ratio) at 50 m to some extent higher than the
levels at control sites but markedly lower than at the cage sites. Whilst the full extent of
dispersal of material from farm origin in Macquarie Harbour is still not clear, given the low
current velocities it might be expected that the impacts would be relatively constrained, i.e.
to within 100 m.

79
In the current study the sediments close to the fish cages were clearly enriched with
both carbon (TOC, δ13C) and nitrogen (TN, δ15N) and had low C/N molar ratios, especially
at Central lease. This study showed a marked decrease in TOC content with distance away
from the farm, resulting in a clear “footprint”. In many studies sedimentation rate has been
proposed as an important measure of the likely impact associated with fish farming as this
can provide an understanding of the overall load to the sediments but it is important to note
that sedimentation of carbon is generally spatially constrained compared to nitrogen (Sarà et
al., 2006; Schendel et al., 2004) and may not be a good indicator of the actual dispersal of
organic matter resulting from fish farming activities.
The isotopic signatures clearly suggested that the organic enrichment at the fish
cages were derived from fish farming waste. The levels of δ13C and δ15N at the fish cages
were clearly marine based and were consistent with δ13C and δ15N levels previously reported
for fish feed used in Macquarie Harbour (i.e. -19.7 ± 0.2 ‰ and 7.4 ± 0.2 ‰ respectively
(Abrantes et al., 2010)). This contrasted strongly with the sediments at the control sites
which had more terrestrial signature. These findings are in agreement with similar studies
from Tasmania (McGhie et al., 2000), Europe (Holmer et al., 2007; Sarà et al., 2006) and
Asia (Yokoyama et al., 2006) which also showed marked increases in enrichment under or
close to cages and defined the materials as fish farm in origin. Consequently isotopic
signatures may be a useful measure if determination of source or causality is the priority.
The results of the CAP analysis suggest that the C/N molar ratios could be a useful
indicator of the organic enrichment footprint from fish farming in Macquarie Harbour. The
C/N molar ratios were strongly correlated with DIC and ammonium flux rates. At the
control sites the C/N molar ratios were generally above 19, whilst at the cage sites at the
Central and Gordon leases the C/N molar ratios were much lower (between 6.14 to 10.52)
and although slightly increased at the 50 m sites the ratio was still only between 12.74 and

80
14.79. Other studies have also suggested that C/N molar ratio might be indicative of impact,
and found similar C/N molar ratios under the net cages (7.5 to 9.0) in Kolding Fjord,
Denmark (Holmer & Kristensen, 1992) and in Loch Creran, Scotland (8.08) (Nickell et al.,
2003). However, it is important to note that there were temporal differences in the C/N
molar ratio response, with the distinction between the cage and 50 m sites only evident in
the months of January, May and September, but not in November.
Benthic nutrient processing
When looking at the actual ecological effects of fish farming in Macquarie Harbour
it was clear that the higher organic content at the fish cages caused significant increases in
oxygen flux rate and production of DIC compared to 50 m and control sites. Oxygen
consumption rates were six times higher at the cage sites compared to the controls. This is
due to the labile fish farming waste being rapidly mineralised (Valdemarsen et al., 2009).
Enhancement of benthic flux rates beneath fish farms has been well documented in
temperate coastal regions (Bissett et al., 2006; Christensen et al., 2003; Christensen et al.,
2000; Hall et al., 1990; Hall et al., 1992; Hargrave et al., 1993; Holmer & Kristensen, 1992;
Nickell et al., 2003; Papageorgiou et al., 2010). This enhancement reflects the activity of the
microbial community in assimilating the additional organic material and is a good thing
provided the assimilative capacity is not overwhelmed.
Oxygen consumption is a useful indicator of environmental condition as it is an
important ecological process, the oxygen regime will define the biological function of the
sediments. The greatest increase in oxygen consumption rate in Macquarie Harbour seemed
to be localised under the fish cages - oxygen flux rates were up to 6 times higher at the fish
cages - rates at the 50 m sites appeared to be slightly elevated, but were not significantly
higher than at the control sites. However, oxygen flux rate alone may not fully capture

81
carbon mineralisation as anaerobic mineralisation can occur when oxygen is limited. DIC
flux rates gave a better insight into total carbon oxidation in Macquarie Harbour as it is a
measurement of both aerobic and anaerobic mineralisation (Hopkinson & Smith, 2004;
Valdemarsen et al., 2009). DIC flux rate relative to oxygen consumption ratio has been used
to identify the dominant mineralisation pathway, with a DIC/O2 ratio of <1 indicating
predominantly aerobic mineralisation and a DIC/O2 ratio of >1 suggesting anaerobic
mineralisation (Holmer et al., 2003); Cathalot et al 2012). The DIC/O2 ratio in sediments
beneath fish cages in Macquarie Harbour was generally >2 which indicates that anaerobic
mineralisation was dominant. The highest DIC production compared to oxygen consumption
was at Cage 2 on Liberty Point lease in January (ratio = 9.3). Anaerobic mineralisation was
not limited to the sediments beneath the fish cages and actually appeared to be quite
common throughout the harbour (Chapter 2). Sediment from the 50 m station as well as
some of the control sites also had DIC/O2 ratios of >1. Other studies have also reported the
presence of sulfate reducing bacteria in Macquarie Harbour (Carpenter et al. (1991). The
fact that low oxygen conditions were identified throughout the harbour has conflicting
implications for interactions with fish farming: whilst it means that anaerobic conditions are
not foreign to the system, there is the potential to place additional stress on what might be
considered an already stressed system.
Denitrification is the principal means of removing nitrogen for marine and coastal
systems; nitrogen is a key concern with fish farming as it is a major input and has the
potential to drive eutrophication. Consequently, measures of denitrification and how that
might vary within a system are important as they provide an understanding of the system’s
capacity to cope with fish farming inputs and therefore will provide important information
for management. Although denitrification rates appeared higher at the fish cages (mean =
0.64 mmol m-2 d-1) and 50 m (mean = 0.42 mmol m-2 d-1) compared to control sites (mean =
82
0.16 mmol m-2 d-1), unfortunately due to the replication level these differences were not
significant, and rates did not differ over time. Denitrification rates at Macquarie Harbour
were similar to those observed from Horsens Fjord, Denmark (0.02 to 4.00 mmol m-2 d-1)
(Christensen et al., 2000), and Tasman Bay (0.72 to 1.11 mmol m-2 d-1) and Beatrix Bay,
New Zealand (0.19 to 0.26 mmol m-2 d-1) (Christensen et al., 2003): all similar areas where
fish farming is undertaken. Whilst previous studies have shown that organic enrichment
seemed to stimulate denitrification activity (Caffrey et al., 1993; Christensen et al., 2000),
increasing organic matter inputs, particularly at the fish cages, could reduce denitrification
rate, as nitrification is restricted by the lack of oxygen (Henriksen & Kemp, 1988).
Eventually, nitrate sourced through nitrification, and from the overlying water column
would decrease over time as it is taken up via the denitrification process or reduced as a
result of competition with DNRA process, thus decreasing the efficiency of nitrogen
removal (Caffrey et al., 1993) and (Christensen et al., 2000). This could be the case at Cage
2 on the Central lease where higher organic content and rapid mineralisation in January may
have led to a reduction in denitrification and elevated DNRA rate. Whilst the effect on
denitrification in this study is not statistically conclusive, it must be acknowledged that this
may be a factor of the experimental constraints and therefore should not be ignored. Despite
the higher denitrification rate, the efficiency of denitrification is actually lower at the cage
sites because the rate of nitrogen removed when compared to the rate of nitrogen returning
to the water column (efflux of ammonium) is much lower.
At the control sites, denitrification rates were low and the process was depending
more on nitrate from the sediments via nitrification (coupled nitrification-denitrification)
rather than on nitrate from the water column (also commonly referred to as uncoupled
nitrification-denitrification) which coincides with lower organic loading. The greater uptake
of nitrate by the sediments at the cage and 50 m sites corresponds suggests that

83
denitrification in these organically enriched sites is more dependent on nitrate from the
overlying water rather that the nitrate produced through the process of nitrification in the
sediment. The higher uncoupled nitrification-denitrification rates over coupled nitrification-
denitrification rate in the sediment at both the fish cages and 50 m sites could also reflect a
reduction in diffusion distance for nitrate between the overlying water column and the
anoxic denitrification zone in the sediments (Christensen et al 1989; Christensen et al 2000)
due to the reduction in oxygen penetration depth from enhanced consumption of oxygen
(Cai & Sayles, 1996). It is also possible that the ammonium released from the sediments is
converted to nitrate in the water column via nitrification and this in turn stimulates
uncoupled nitrification-denitrification in the sediment.
Ammonium effluxes were significantly higher in sediments taken from the fish cages
than the controls. The flux rates of ammonium have been shown to be highly correlated with
DIC production and oxygen consumption, as rapid mineralisation occurs during organic
loading (Findlay & Watling, 1997). The increase in ammonium efflux may also reflect that
nitrification processes were inhibited due to lack of oxygen. Other than that, DNRA which
produces ammonium may be stimulated by the presence of sulfides (An & Gardner, 2002;
Joye & Anderson, 2008). Higher rates of DNRA compared to denitrification under fish
cages were observed by Christensen et al. (2000). In Macquarie Harbour, this observation
was noted at Central lease but not at the Gordon and Liberty Point leases; this may be
attributed to the lower organic enrichment levels at Gordon and Liberty Point and may
reflect the different mineralisation rates at these sites compared to Central lease. The level of
ammonium efflux associated with farm inputs in Macquarie Harbour was comparable with
levels observed in salmon farming elsewhere (Nickell et al., 2003; Norði et al., 2011).
Ammonium is of particular interest in relation to eutrophication as it is readily taken up by
phytoplankton and therefore has the potential to drive ecological change. The potential for

84
adverse effects would probably be limited by the low primary productivity previously
reported for Macquarie Harbour (Edgar et al., 1999).
It has been suggested that organic enrichment can also modify the phosphorus cycle
(Adrieux-Loyer et al 2014) and as a result changes in phosphate flux might provide an
indication of farming impact. Aquaculture activities tend to increase the amount of
phosphorus into the sediment through feed (Holby & Hall 1991; Wu 1995; Wang et al
2012). Phosphate is controlled by sediment mineralisation (Holmer et al 2003) and under
oxic conditions, phosphate from the overlying water column and sediments will bind with
Fe(OH)3 causing an uptake of phosphate, which would appear to be the situation at the
control sites and most of the 50 m sites. However, under anoxic conditions Fe(OH)3
reduction occurs and the available Fe2+ binds to sulfides derived from sulfate reduction to
form FeS and FeS2, thereby reducing the adsorption sites for phosphate (Sundby et al 1992;
Andrieux Loyer et al 2014). Given that fish farming activity will result in highly reducing
(sulfidic) conditions it is likely that iron will be limited and any excess phosphorus would be
released, this could then be available to enhance primary productivity. In the current study
phosphate fluxes were elevated at the cage sites but the impact of this is not known.
Whilst there were some clear differences in the sediment condition and nutrient
processing at the farm, 50 m and control sites, there was little evidence of any major
temporal differences in sediment processes with a couple of notable exceptions at the cage
sites. The insignificant temporal differences particularly at the control sites indicates that the
bottom water condition was relatively stable at these sites and most likely reflecting the
condition throughout the harbour. The most notable temporal differences was the nutrient
flux rates under cage 2 on Central lease which were higher in January and this could be due
to the different stages of farming activity such as fallowing or stocking.

85
Benthic recovery following fallowing
Fallowing is the key mechanism used by farmers to manage the condition of the
sediments beneath their farms. In the Southeast of Tasmania the fallowing period before
restocking after each production cycle is generally about 3 months (Macleod et al., 2006).
However, during this study period the regime in Macquarie Harbour is still being
established, some cages have been left fallowed for considerably longer than 3 months. This
study looked at the differences in benthic response associated with fallowing and stocking in
Macquarie Harbour with a view to providing some understanding of how different regimes
affected sediment performance and whether there was any variation within the harbour.
There were different stocking/ fallowing regimes at each of the study sites. When
samples were collected in November and January the cages at Central lease were stocked,
summer being the peak season for salmon growth (Battaglene et al., 2008), and when
samples were collected in May and September the cages were fallowed. In contrast Gordon
lease was stocked in September and fallowed when samples were collected in November to
January and Liberty point was stocked in November and fallowed in January. Central lease,
which is closer to the lower estuary, presented the expected response during stocked and
fallowed period with the benthic flux rates increasing at both cages over the production
cycle and decreasing during the fallowing period (hence the sediments showed signs of
recovery). A similar pattern was also observed at the Liberty Point lease. The effect of
fallowing at the Gordon lease was less clear. Benthic flux rates at Cage 2 (Gordon lease)
increased during fallowing but decreased when the cage was stocked. Surprisingly, Cage 1
(Gordon lease) benthic nutrient fluxes declined when it was apparently stocked. Based on
benthic flux rates, the benthic response during fallowing differed between the Central and
Gordon leases.

86
These differences in benthic response associated with fallowing and stocking in
Macquarie Harbour could be attributed to bottom water dissolved oxygen concentration
throughout the year and/or hydrodynamics such as current flow and velocities which
differed between the leases. This has the potential to influence the stocking/ fallowing
response, there was an overall decrease in benthic flux rates during May and September in
the Central and Gordon sites that could be a result of the bottom water dissolved oxygen
concentrations being lower than in November and January. This reasoning is in line with
findings presented in a recent report looking specifically at changes in bottom water
dissolved oxygen in Macquarie Harbour (e.g. MHDOWG, 2014). Whilst, these interactions
are not clear and more work is needed to establish the most appropriate fallowing regimes
for sites in Macquarie Harbour it is clear that fallowing improved benthic conditions at
Central lease and therefore that fallowing still should be considered as a beneficial
management practice.
Conclusion and broader implications
This study has provided the first assessment of how the sediments response to fish
farming in Macquarie Harbour. The responses were similar to other benthic environments
receiving organic enrichment from farming activities but the response is also dependent on
the environment where farming takes place. In Macquarie Harbour, the long residence time
may present challenges in terms of oxygen availability and subsequently nutrient cycling.
As renewal of bottom water dissolved oxygen is slow, the increase in biological and
chemical oxygen demands may pose a risk for hypoxia; a condition that has been observed
in recent years.

87
As oxygen demand in the organic enriched sediments increases and oxygen
concentrations decrease, processes such as nitrification are likely to be inhibited. The results
indicate that this will cause a shift from coupled nitrification-denitrification to uncoupled
nitrification-denitrification. This demonstrates the importance of uncoupled nitrification-
denitrification in Macquarie Harbour as a pathway for the removal of nitrogen from the
system, especially in areas receiving higher organic loading. However, it must be noted that
the rate of nitrogen returning to the water column under the cages exceeds the rate of
removal through denitrification and the future implication of this is still unknown.
The variability in terms of the response towards fallowing and stocking and the
unknown causes of this suggest that further investigation is required to understand the
drivers of sediment function under the cages which could improve farming management
practices in terms of stocking and fallowing regimes in Macquarie Harbour.

88
Chapter 4: Discussion
89
General Discussion
A great deal of our understanding of benthic nutrient processes is derived from
studies undertaken in northern hemisphere temperate estuaries which by large differ from
the estuary in this study. Firstly, Macquarie Harbour has dark tannin water and as a result
benthic primary production is likely to be low due to limited light penetration (Edgar et al.,
1999). Secondly, due to a shallow entrance at the lower reaches of the harbour, water
residence time is long (DPIPWE et al., 2011; Koehnken, 1996). Together with water column
stratification and other physical and biological characteristics, this makes Macquarie
Harbour a rather unique estuary, more akin to a fjord system.
In this study, spatial variation in important benthic nutrient cycling processes and the
potential environmental drivers in Macquarie Harbour were initially investigated (Chapter
2). Comparable to many other studies, dissolved oxygen (DO) was found to be important in
regulating benthic nutrient cycling in the harbour and was most likely the primary driver of
spatial variation in benthic respiration and nutrient fluxes. In areas where bottom water DO
levels are particularly low, anaerobic respiration is an important pathways for organic matter
mineralisation. Moreover, the low DO levels in the sediments appear to inhibit sediment
nitrification (Caffrey et al., 1993; Joye & Anderson, 2008) in the harbour. As a
consequence, much of the ammonium produced following the mineralisation of organic
matter is released back into the water column.
Despite, the reduction in sediment nitrification, denitrification was recorded
throughout the harbour. The uptake of nitrate into sediments across the study sites clearly
demonstrated that the removal of nitrogen from the system via denitrification requires nitrate
to be sourced from the water column in the low bottom water oxygen environment; this is
commonly referred to as uncoupled nitrification-denitrification. Nitrification of ammonium

90
in the water column is hypothesised as the source of this nitrate (Cornwell et al., 1999;
Herbert, 1999; Rysgaard et al., 1994). Importantly though, not all nitrate taken up by the
sediment is being used for denitrification. Dissimilatory nitrate reduction to ammonium
(DNRA), another process in the nitrogen cycling occurring in Macquarie Harbour
sediments, also competes with denitrification for nitrate (An & Gardner, 2002) and this is
probably due to the presence of sulfides (An & Gardner, 2002; Joye & Anderson, 2008).
This process contributes to the production of ammonium. Another observation made in this
study is that the sediments in the harbour generally adsorb phosphate.
The rapid growth of the aquaculture industry in Macquarie Harbour has led to the
need for sustainable development to ensure that both industry and environment provide long
term economic gain and environmental protection. Understanding the response of Macquarie
Harbour sediments to organic enrichment was the next objective of this study (Chapter 3).
Waste from fish farming such as uneaten feed and fish faeces are inevitably deposited onto
the sediment (Pearson & Black, 2001; X. Wang et al., 2012) causing high levels of total
carbon and nitrogen in the sediments as seen in this study. As shown in the conceptual
diagram of Macquarie Harbour (Figure 19) such high and labile organic loading onto the
sediment lead to elevated benthic respiration, especially through anaerobic pathways. As
oxygen is most likely to be rapidly consumed by bacteria, nitrification efficiency is further
reduced in areas of enrichment, thus leading to a greater release of ammonium into the water
column. This is commonly observed in sediments under the influence of organic loading
from fish farms (Hall et al., 1992; Hargrave et al., 1993; Holmer et al., 2005). Denitrifying
bacteria must then heavily rely on nitrate from the water column to remove excess nitrogen
from the sediments Figure 19. Although denitrification rates were observed to increase in
farm sediments, the proportion of nitrogen mineralised that is denitrified is significantly
lower in farm sediments given the much higher rates of respiration and ammonium release.

91
Figure 19 Conceptual diagram showing the benthic flux rates of oxygen (O2), dissolved inorganic
carbon (DIC), ammonium (NH4+), nitrate (NO3
-), denitrification, and phosphate (PO43-) across
Macquarie Harbour. All rates are presented in mmol m-2 d-1. All measurements were taken from
November survey. To represent the cage and 50 m sites flux rates, the measurements from all six
cage sites and three 50 m sites were averaged respectively.

92
The interesting finding in Macquarie Harbour is that despite the release of
ammonium from sediments, particularly at the enriched sediments, environmental
monitoring of the harbour showed no evidence of increased ammonium concentration in the
overlying bottom waters over the period of rapid industry expansion (see MHDOWG,
2014). The most probable explanation is that the ammonium released from the sediments
may be converted to nitrate in the water column via nitrification where oxygen availability is
higher than in the sediments. Similarly, there has been no observable increase in nitrate
concentrations in bottom waters over this period. Given the limited mixing and long
residence time of bottom waters and the lack of light for primary production, denitrification
in sediments may be responsible for removing the nitrogen, and thus buffering the system to
the increased supply of nutrients to bottom waters due to farming. This remains to be tested
and greater replication of process measurements in space and time are required.
This study has also shown that the effect of organic loading often extends to 50 m
from farmed cages, however to what extent enrichment and benthic response extends
beyond 50 m remains unknown. In this study, the sediment response to a decrease in organic
enrichment during fallowing was also investigated. There were changes in the flux rates
during fallowing that were consistent with expectations (i.e lower rates of respiration and
release), but not at all sites. This suggests that there are other factors, such as bottom water
DO levels during fallowing, that regulates the benthic processing of organic matter.

93
Conclusion
The harbour wide survey gave background flux rates and insights to some of the
benthic processes occurring in the sediments in Macquarie Harbour while surveys at the fish
farm sites showed the sediment response towards organic loading. Dissolved oxygen was
identified as the key driver to most of the benthic processes in the sediments. The constant
increase in biological and chemical oxygen demand in the water column and sediment may
increase the chances for developing persistent hypoxia (Rabalais, 2009) when the harbour
has already experiencing periodic hypoxia in recent years (Chapter 2 and Chapter 3).
This different sediment response towards the increase and decrease in organic
enrichment at different areas of the harbour would require further investigation to fully
understand the driver of this differences and the implication towards farm management. And
given the importance of dissolved oxygen to the benthic processes such as nitrogen cycling,
environmental managers have to ensure that the benthic oxygen demand does not exceed the
rate of oxygen renewal in the harbour.

94
References
Abrantes, K. G., Semmens, J. M., Lyle, J. M., & Nichols, P. D. 2010. Spatial management
of reef fisheries and ecosystems: Understanding the importance of movement
Tasmanian Aquaculture and Fisheries Institute, University of Tasmania and Fisheries
Research, CSIRO and NRM Craddle Coast. 1-55 pp.
Aller, R. C. 1994. The effect of biogenic irrigation intensity and solute exchange on
diagenetic reaction rates in marine sediments. Chemical Geology: 114: 331-345.
Alongi, D. M. 1998. Coastal ecosystem processes. Boca Raton: CRC Press.
An, S., & Gardner, W. S. 2002. Dissimilatory nitrate reduction to ammonium (DNRA) as a
nitrogen link, versus denitrification as a sink in a shallow estuary (Laguna
Madre/Baffin Bay, Texas). Marine Ecology Progress Series 237: 41-50.
Anderson, M. J., Gorley, R. N., & Clarke, K. R. 2008. PERMANOVA+ for PRIMER: Guide
to software and statistical methods: PRIMER-E, Plymouth, UK.
Anon. 2015, 2015, July 15. Tasmanians salmon growers tell Senate inquiry in Hobart their
environmental impact is localised ABC News. Retrieved from
http://www.abc.net.au/news/2015-07-15/senate-inquiry-into-tasmanian-salmon-
farms-to-begin-in-hobart/6620034
Barbier, E. B., Hacker, S. D., Kennedy, C., Koch, E. W., Stier, A. C., & Silliman, B. R.
2011. The value of estuarine and coastal ecosystem services. 81(2): 169-193.
Battaglene, S., Carter, C., Hobday, A. J., Lyne, V., & Nowak, B. 2008. Scoping study into
adaptation of the Tasmanian salmonid aquaculture industry to potential impacts of
climate change National Agriculture & Climate Change Action Plan: Implementation
Programme. 84 pp.
Belle, S., & Nash, C. 2008. Better management practices for net-pen aquaculture. In C. S.
Tucker & J. Hargreaves (Eds.), Environmental Best Management Practices for
Aquaculture. Ames, Iowa, Blackwell Publishing.
Berelson, W. M., Heggie, D., Longmore, A., Kilgore, T., Nicholson, G., & Skyring, G.
1998. Benthic nutrient recycling in Port Phillip Bay, Australia. Estuarine, Coastal
and Shelf Science 46: 917-934.
Bianchi, T. S. 2006. Biogeochemistry of Estuaries: Oxford University Press, USA.

95
Bissett, A., Bowman, J. P., & Burke, C. 2006. Bacterial diversity in organically-enriched
fish farm sediments. FEMS Microbioly Ecology 55(1): 48-56.
Bissett, A., Cook, P. L. M., Macleod, C., Bowman, J. P., & Burke, C. 2009. Effects of
organic perturbation on marine sediment betaproteobacterial ammonia oxidizers and
on benthic nitrogen biogeochemistry. Marine Ecology Progress Series: 392: 317-
332.
Black, K. D., Hansen, P. K., & Holmer, M. 2008. Salmon Aquaculture dialogue: Working
group report on benthic impacts and farm siting. 54 pp.
Blackburn, T. H., & Henriksen, K. 1983. Nitrogen cycling in different types of sediments
from Danish waters. Limnology and Oceanography 28(3): 477-493.
Boynton, W. R., & Kemp, W. M. 2008. Chapter 18 - Estuaries. In D. G. Capone, D. A.
Bronk, M. R. Mulholland & E. J. Carpenter (Eds.), Nitrogen in the Marine
Environment (2nd Edition). San Diego, Academic Press. 809-866.
Brooks, K. M., Mahnken, C., & Nash, C. 2002. Environmental effects associated with
marine netpen waste with emphasis on salmon farming in the Pacific northwest. In
R. R. Stickney & J. P. McVey (Eds.), Responsible Marine Aquaculture. 159-203.
Burdige, D. J. 2006. Geochemistry of Marine Sediments: Princeton University Press.
Caffrey, J. M., Sloth, N. P., Kaspar, H. F., & Blackburn, T. H. 1993. Effect of organic
loading on nitrification and denitrification in a marine sediment microcosm. FEMS
Microbiology Ecology 12(3): 159-167.
Cai, W.-J., & Sayles, F. L. 1996. Oxygen penetration depths and fluxes in marine sediments.
Marine Chemistry 52(2): 123-131.
Canfield, D. E. 1993. Organic Matter Oxidation in Marine Sediments. In R. Wollast, F.
Mackenzie & L. Chou (Eds.), Interactions of C, N, P and S Biogeochemical Cycles
and Global Change, Springer Berlin Heidelberg. Vol. 4, 333-363.
Carpenter, P. D., Butler, E. C. V., Higgins, H. W., Mackey, D. J., & Nichols, P. D. 1991.
Chemistry of trace elements, humic substances and sedimentary organic matter in
Macquarie Harbour, Tasmania. Australian Journal of Marine and Freshwater
Research 42: 625-654.
96
Christensen, P. B., Glud, R. N., Dalsgaard, T., & Gillespie, P. 2003. Impacts of longline
mussel farming on oxygen and nitrogen dynamics and biological communities of
coastal sediments. Aquaculture 218(1-4): 567-588.
Christensen, P. B., Nielsen, L. P., Sørensen, J., & Revsbech, N. P. 1990. Denitrification in
nitrate-rich streams: Diurnal and seasonal variation related to benthic oxygen
metabolism. Limnology and Oceanography 35(3): 640-651.
Christensen, P. B., Rysgaard, S., Sloth, N. P., Dalsgaard, T., & Schwaerter, S. 2000.
Sediment mineralization, nutrient fluxes, denitrification and dissimilatory nitrate
reduction to ammonium in an estuarine fjord with sea cage trout farms. Aquatic
Microbial Ecology 21(1): 73-84.
Clarke, K. R., & Gorley, R. N. 2006. PRIMER v6: User Manual/Tutorial.: PRIMER-E,
Plymouth,.
Cloern, J. E. 2001. Our evolving conceptual model of the coastal eutrophication problem.
Marine Ecology Progress Series 210: 223-253.
Cloern, J. E., Canuel, E. A., & Harris, D. 2002. Stable carbon and nitrogen isotope
composition of aquatic and terrestrial plants of the San Francisco Bay estuarine
system. Limnology and Oceanography 47(3): 713-729.
Conley, D. J., Carstensen, J., Vaquer-Sunyer, R., & Duarte, C. M. 2009. Ecosystem
thresholds with hypoxia. Hydrobiologia 629(1): 21-29.
Cook, P. L. M., Wenzhofer, F., Glud, R. N., Janssen, F., & Huettel, M. 2007. Benthic solute
exchange and carbon mineralization in two shallow subtidal sandy sediments: Effect
of advective pore-water exchange. Limnology and Oceanography 52(5): 1943-1963.
Cornwell, J. C., Kemp, W. M., & Kana, T. M. 1999. Denitrification in coastal ecosystems:
methods, environmental controls, and ecosystem level controls, a review. Aquatic
Ecology 33(1): 41-54.
Cowan, J. L. W., Pennock, J. R., & Boynton, W. R. 1996. Seasonal and interannual patterns
of sediment-water nutrient and oxygen fluxes in Mobile Bay, Alabama (USA):
regulating factors and ecological significance. Marine Ecology Progress Series 141:
229-245.
Crawford, C. M., Mitchell, I. M., & Macleod, C. 2002. Evaluation of techniques for
environmental monitoring of salmon farms in Tasmania. In C. Gardner (Ed.),

97
Tasmanian Aquaculture and Fisheries Institute Technical Report Series. Vol. 8, 134
pp.
Cresswell, G. R., Edwards, R. J., & Barker, B. A. 1989. Macquarie Harbour, Tasmania -
seasonal oceanographic surverys in 1985. Papers and Proceedings of the Royal
Society of Tasmania 123: 63-66.
Cromey, C. J., Nickell, T. D., & Black, K. D. 2002. DEPOMOD—modelling the deposition
and biological effects of waste solids from marine cage farms. Aquaculture 214(1–
4): 211-239.
CSIRO, H. E. S. T. 2000. Huon Estuary Study: Environmental research for integrated
catchment management and aquaculture. Project No 96/284 CSIRO Division of
Marine Research, Marine Laboratories, Hobart. 302 pp.
Dalsgaard, T., Nielsen, L. P., Brotas, V., Viaroli, P., Underwood, G., Nedwell, D.,
Sundbäck, K., Rysgaard, S., Miles, A., Bartoli, M., Dong, L., Thornton, D. C. O.,
Ottosen, D. M., Castaldelli, G., & Risgaard-Petersen, N. 2000. Protocol handbook
for NICE - Nitrogen Cycling in Estuaries: a project under the EU research
programme: Marine Science and Technology (MAST III). Silkeborg, Denmark:
National Environmental Research Institute.
Diana, J. S. 2009. Aquaculture production and biodiversity conservation. BioScience 59(1):
27-38.
Diaz, R. J., & Rosenberg, R. 1995. Marine benthic hypoxia: A review of its ecological
effects and the behavioural responses of benthic macrofauna. In A. D. Ansell, R. N.
Gibson & M. Barnes (Eds.), Oceanography and marine biology - an annual review.
Vol. 33, 245-303.
Diaz, R. J., & Rosenberg, R. (2008, 15 August 2008). Spreading dead zones and
consequences for marine ecosystems. Science, 321, 926-929.
DPIPWE. 2012. Macquarie Harbour Marine Farming Development Plan October 2005:
Water and Marine Resources Division. 29 pp.
DPIPWE, Operations, T., Group, H. A., & Aquaculture, P. 2011. Addendum to the
environmental impact statement to accompany the draft amendment No. 1 to the
Macquarie Harbour Marine Farming Development Plan October 2005. In P.

98
Department of Primary Industries, Water, and Environment (Ed.), Hobart, Tasmania.
498 pp.
Duarte, C. M., Holmer, M., Olsen, Y., Soto, D., Marbà, N., Guiu, J., Black, K. D., &
Karakassis, I. 2009. Will the Oceans Help Feed Humanity? BioScience 59(11): 967-
976.
Edgar, G. J., Barrett, N. S., & Graddon, D. J. 1999. A classification of Tasmanian estuaries
and assessment of their conservation significance using ecological and physical
attributes, population and land use (Vol. 2). Taroona, Tasmania: Marine Research
Laboratories, Tasmanian Aquaculture and Fisheries Institute, University of
Tasmania.
Edgar, G. J., & Cresswell, G. R. 1991. Seasonal changes in hydrology and the distribution of
plankton in the Bathurst Harbour estuary, southwestern Tasmania, 1988-89. Papers
and Proceedings of the Royal Society of Tasmania: 61-72.
Edgar, G. J., Macleod, C., Mawbey, R., & Shields, D. 2005. Broad-scale effects of marine
salmonid aquaculture on macrobenthos and the sediment environment in
southeastern Tasmania. Journal of Experimental Marine Biology and Ecology
327(1): 70-90.
Eyre, B. D. 1998. Transport, retention and transformation of material in Australian estuaries.
Estuaries 21(4A): 540-551.
FAO. 2014. The state of world fisheries and aqauculture Rome. 223 pp.
Findlay, R. H., & Watling, L. 1997. Prediction of benthic impact for salmon net-pens based
on the balance of benthic oxygen supply and demand. Marine Ecology Progress
Series 155: 147-157.
Finlay, J. C., & Kendall, C. 2005. Stable isotope tracing of temporal and spatial variability
in organic matter sources to freshwater ecosystems. In R. Michener & K. Lajtha
(Eds.), Stable isotopes in ecology and environmental science, John Wiley & Sons.
283 - 333.
Gardner, W. S., McCarthy, M. J., An, S., Sobolev, D., Sell, K. S., & Brock, D. 2006.
Nitrogen fixation and dissimilatory nitrate reduction to ammonium (DNRA) support
nitrogen dynamics in Texas estuaries. Limnology and Oceanography 51(1): 558-
568.

99
Glud, R. N. 2008. Oxygen dynamics of marine sediments. Marine Biology Research 4(4):
243-289.
Glud, R. N., Gundersen, J. K., Roy, H., & Jorgensen, B. B. 2003. Seasonal dynamics of
benthic O-2 uptake in a semi-enclosed bay: Importance of diffusion and faunal
activity. Limnology and Oceanography 48(3): 1265-1276.
Hall, P. O. J., Anderson, L. G., Holby, O., Kollberg, S., & Samuelsson, M. O. 1990.
Chemical fluxes and mass balances in a marine fish cage farm. I. Carbon. Marine
Ecology Progress Series 61(1-2): 61-73.
Hall, P. O. J., Holby, O., Kollberg, S., & Samuelsson, M. O. 1992. Chemical fluxes and
mass balances in a marine fish cage farm . IV. Nitrogen. Marine Ecology Progress
Series 89(1): 81-91.
Hansen, P. K., Ervik, A., & Pittman, K. 1990. Effects of organic waste from marine fish
farms on the seabottom beneath the cages. International Council for the Exploration
of the Sea: 13.
Hargrave, B. T., Duplisea, D. E., Pfeiffer, E., & Wildish, D. J. 1993. Seasonal changes in
benthic fluxes of dissolved oxygen and ammonium associated with marine cultured
Atlantic salmon. Marine Ecology Progress Series 96(3): 249-257.
Hart, B. S. 1995. Delta Front Estuaries. In G. M. E. Perillo (Ed.), Geomorphology and
Sedimentology of Estuaries. Amsterdam; New York Elsevier Science.
Hedges, J. I., Clark, W. A., & Cowie, G. L. 1988. Organic matter sources to the water
column and surficial sediments of a marine bay. Limnology and Oceanography
33(5): 1116-1136.
Heilskov, A. C., & Holmer, M. 2001. Effects of benthic fauna on organic matter
mineralization in fish-farm sediments: importance of size and abundance. Ices
Journal of Marine Science 58(2): 427-434.
Henriksen, K., & Kemp, M. W. 1988. Nitrification in estuarine and coastal marine
sediments. In T. H. Blackburn & J. Sorensen (Eds.), Nitrogen cycling in coastal
marine environments, John Wiley & Sons Ltd.
Herbert, R. A. 1999. Nitrogen cycling in coastal marine ecosystems. FEMS Microbiology
Reviews 23(5): 563-590.

100
Holmer, M., Duarte, C. M., Heilskov, A., Olesen, B., & Terrados, J. 2003. Biogeochemical
conditions in sediments enriched by organic matter from net-pen fish farms in the
Bolinao area, Philippines. Mar Pollut Bull 46(11): 1470-1479.
Holmer, M., & Kristensen, E. 1992. Impact of marine fish cage farming on metabolism and
sulfate reduction of underlying sediments. Marine Ecology Progress Series 80(2-3):
191-201.
Holmer, M., Marba, N., Diaz-Almela, E., Duarte, C. M., Tsapakis, M., & Danovaro, R.
2007. Sedimentation of organic matter from fish farms in oligotrophic Mediterranean
assessed through bulk and stable isotope (δ13C and δ15N) analyses. Aquaculture
262(2-4): 268-280.
Holmer, M., Wildish, D., & Hargrave, B. T. 2005. Organic enrichment from marine finfish
aquaculture and effects on sediment biogeochemical porocesses. 5M: 181-206.
Hopkinson, C. S., & Smith, E. M. 2004. Estuarine respiration - an overview of benthic,
pelagic and whole system respiration. In P. A. del Giogio & P. B. Williams (Eds.),
Respiration in Aquatic Ecosystem, Oxford Univ. Press.
House, W. A. 2003. Factors influencing the extent and development of the oxic zone in
sediments. Biogeochemistry 63(3): 317-334.
Howarth, R., Anderson, D., Cloern, J., Elfring, C., Hopkinson, C., Lapointe, B., Malone, T.,
Marcus, N., McGlathery, K., Sharpley, A., & Walker, D. 2000. Nutrient Pollution of
Coastal Rivers, Bays, and Seas. Issues in Ecology (7): 1-15.
Howarth, R., Chan, F., Conley, D. J., Garnier, J., Doney, S. C., Marino, R., & Billen, G.
2011. Coupled biogeochemical cycles: eutrophication and hypoxia in temperate
estuaries and coastal marine ecosystems. Frontiers in Ecology and the Environment
9(1): 18-26.
Howarth, R., & Marino, R. 2006. Nitrogen as the limiting nutrient for eutrophication in
coastal marine ecosystems: Evolving views over three decades. Limnology and
Oceanography 51(1, part 2): 364-376.
Howarth, R., Marino, R., Lane, J., & Cole, J. J. 1988. Nitrogen fixation in freshwater,
estuarine, and marine ecosystems. 1. Rates and importance. Limnology and
Oceanography 33(4, part2): 669-687.

101
Huettel, M., Berg, P., & Kostka, J. E. 2014. Benthic exchange and biogeochemical cycling
in permeable sediments. Annual Review of Marine Science 6: 23-51.
Huettel, M., & Rusch, A. 2000. Transport and degradation of phytoplankton in permeable
sediment. Limnology and Oceanography 45(3): 534-549.
Hulth, S., Aller, R. C., Canfield, D. E., Dalsgaard, T., Engstrom, P., Gilbert, F., Sundback,
K., & Thamdrup, B. 2005. Nitrogen removal in marine environments: Recent
findings and future research challenges. Marine Chemistry 94(1-4): 125-145.
Jäntti, H., & Hietanen, S. 2012. The effects of hypoxia on sediment nitrogen cycling in the
Baltic Sea. Ambio 41(2): 161-169.
Jenkins, M. C., & Kemp, W. M. 1984. The coupling of nitrification and denitrification in
two estuarine sediments. Limnology and Oceanography 29(3): 609-619.
Jensen, M. H., Lonstein, E., & Sorensen, J. 1990. Benthic NH⁺₄ and NO⁻₃ flux following
sedimentation of a spring phytoplankton bloom in Aarhus Bight, Denmark. Marine
Ecology Progress Series 61: 87-96.
Jørgensen, B. B. 1983. Processes at the sediment-water interface. In B. Bolin & R. B. Cook
(Eds.), The major biogeochemical cycles and their interactions, J. Wiley & Sons.
Vol. Scope 21, 477-509.
Joye, S. B., & Anderson, I. C. 2008. Nitrogen cycling in coastal sediment. In D. G. Capone,
D. A. Bronk, R. M. Margaret, Margaret R. & E. J. Carpenter (Eds.), Nitrogen in the
marine environment, Academic Press, 2008.
Kalantzi, I., & Karakassis, I. 2006. Benthic impacts of fish farming: meta-analysis of
community and geochemical data. Mar Pollut Bull 52(5): 484-493.
Kana, T. M., Sullivan, M. B., Cornwell, J. C., & Groxzkowski, K. M. 1998. Denitrification
in estuarine sediments determined by membrane inlet mass spectrometry.
Limnology and Oceanography 43(2): 334-339.
Karakassis, I., Tsapakis, M., & Hatziyanni, E. 1998. Seasonal variability in sediment
profiles beneath fish farm cages in the Mediterranean. Marine Ecology Progress
Series 162: 243-252.
Karakassis, I., Tsapakis, M., Smith, C. J., & Rumohr, H. 2002. Fish farming impacts in the
Mediterranean studied through sediment profiling imagery. Marine Ecology
Progress Series 227: 125-133.

102
Kemp, W. M., & Boynton, W. R. 1984. Spatial and temporal coupling of nutrient input to
estuarine primary production : The role of particulate transport and decomposition.
Bulletin of Marine Science (35): 242-247.
Kemp, W. M., Sampou, P., Caffrey, J. M., Mayer, M., Henriksen, K., & Boynton, W. R.
1990. Ammonium recycling versus denitrification in Chesapeake Bay sediments.
Limnology and Oceanography 35(7): 1545-1563.
Kennish, M. J. 1994. Pollution in estuaries and coastal marine waters. Journal of Coastal
Research: 27-49.
Koehnken, L. 1996. Macquarie Harbour-King River study : technical report: Dept. of
Environment & Land Management, Hobart, TAS.
Koike, I., & Sørensen, J. 1988. Nitrate reduction and denitrification in marine sediments. In
T. D. Blackburn & J. Sørensen (Eds.), Nitrogen cycling in coastal marine
environments, John Wiley & Sons Ltd, Chichester.
Kraal, P., Burton, E. D., Rose, A. L., Kocar, B. D., Lockhart, R. S., Grice, K., Bush, R. T.,
Tan, E., & Webb, S. M. 2015. Sedimentary iron–phosphorus cycling under
contrasting redox conditions in a eutrophic estuary. Chemical Geology 392: 19-31.
Kristensen, E. 1988. Benthic fauna and biogeochemical processes in marine sediments:
Microbial activities and fluxes. In T. H. Blackburn & J. Sørensen (Eds.), Nitrogen
cycling in coastal marine environments. New York, John Wiley & Sons Ltd. 275-
299.
Kristensen, E. 2000. Organic matter diagenesis at the oxic/anoxic interface in coastal marine
sediments, with emphasis on the role of burrowing animals. Hydrobiologia 426(1-
3): 1-24.
Kristensen, E., & Holmer, M. 2001. Decomposition of plant materials in marine sediment
exposed to different electron acceptors (O2, NO3−, and SO42−), with emphasis on
substrate origin, degradation kinetics, and the role of bioturbation. Geochimica et
Cosmochimica Acta 65(3): 419-433.
Lansard, B., Rabouille, C., Denis, L., & Grenz, C. 2008. In situ oxygen uptake rates by
coastal sediments under the influence of the Rhône River (NW Mediterranean Sea).
Continental Shelf Research 28(12): 1501-1510.

103
Levin, L. A., Boesch, D. F., Covich, A., Dahm, C., Erséus, C., Ewel, K., Kneib, R. T.,
Moldenke, A., Palmer, M. A., Snelgrove, P., Strayer, D., & Weslawski, J. M. 2001.
The function of marine critical transition zones and the importance of sediment
biodiversity. Ecosystems 4(5): 430-451.
Lucieer, V., Lawler, M., Pender, A., & Morffew, M. 2009. Seamap Tasmania - Mapping the
Gaps. pp.
Lukkari, K., Leivuori, M., & Hartikainen, H. 2008. Vertical distribution and chemical
character of sediment phosphorus in two shallow estuaries in the Baltic Sea.
Biogeochemistry 90(2): 171-191.
Macleod, C. K., Crawford, C. M., & Moltschaniwskyj, N. A. 2004. Assessment of long term
change in sediment condition after organic enrichment: defining recovery. Mar
Pollut Bull 49(1-2): 79-88.
Macleod, C. K., Moltschaniwskyj, N. A., & Crawford, C. M. 2006. Evaluation of short-term
fallowing as a strategy for the management of recurring organic enrichment under
salmon cages. Mar Pollut Bull 52(11): 1458-1466.
Macleod, C. K., Moltschaniwskyj, N. A., Crawford, C. M., & Forbes, S. E. 2007. Biological
recovery from organic enrichment: some systems cope better than others. Marine
Ecology Progress Series 342: 41-53.
Maher, W. A., & Devries, M. 1994. The release of phosphorus from oxygenated estuarine
sediments Chemical Geology 112(1-2): 91-104.
McGhie, T. K., Crawford, C. M., Mitchell, I. M., & O'Brien, D. 2000. The degradation of
fish-cage waste in sediments during fallowing. Aquaculture 187(3-4): 351-366.
MHDOWG. (2014). Macquarie Harbour Dissolved Oxygen Working Group Confidential
Report. from http://dpipwe.tas.gov.au/sea-fishing-aquaculture/marine-farming-
aquaculture/macquarie-harbour-environmental-and-fish-health-monitoring-review
Middelburg, J. J., & Levin, L. A. 2009. Coastal hypoxia and sediment biogeochemistry.
Biogeosciences Discuss. 6(2): 3655-3706.
Middelburg, J. J., & Nieuwenhuize, J. 1998. Carbon and nitrogen stable isotopes in
suspended matter and sediments from the Schelde Estuary. Marine Chemistry 60(3–
4): 217-225.

104
Middelburg, J. J., Vlug, T., Jaco, F., & van der Nat, W. A. 1993. Organic matter
mineralization in marine systems. Global and Planetary Change 8(1-2): 47-58.
Morrisey, D. J., Underwood, A. J., & Howitt, L. 1996. Effects of copper on the faunas of
marine soft-sediments: An experimental field study. Marine Biology 125(1): 199-
213.
Murrell, M. C., & Lehrter, J. C. 2011. Sediment and lower water column oxygen
consumption in the seasonally hypoxic region of the Louisiana continental shelf.
Estuaries and Coasts 34(5): 912-924.
Nedwell, D., Jickells, T., Trimmer, M., & Sanders, R. 1999. Nutrients in estuaries.
Advances in Ecological Research Estuaries 29: 43-92.
Neira, C., Mendoza, G., Levin, L., Zirino, A., Delgadillo-Hinojosa, F., Porrachia, M., &
Deheyn, D. D. 2011. Macrobenthic community response to copper in Shelter Island
Yacht Basin, San Diego Bay, California. Mar Pollut Bull 62(4): 701-717.
Nguyen, H. K., Kristensen, E., & Lund-Hansen, L. C. 2012. Benthic metabolism and
nitrogen transformations affected by fish cage farming in the tropical Nha Phu
estuary (Vietnam). Marine and Freshwater Research 63(10): 887.
Nickell, L. A., Black, K. D., Hughes, D. J., Overnell, J., Brand, T., Nickell, T. D., Breuer,
E., & Martyn Harvey, S. 2003. Bioturbation, sediment fluxes and benthic community
structure around a salmon cage farm in Loch Creran, Scotland. Journal of
Experimental Marine Biology and Ecology 285–286(0): 221-233.
Nielsen, K., Nielsen, L. P., & Rasmussen, P. 1995. Estuarine nitrogen retention
independently estimated by the denitrification rate and mass balance methods: a
study of Norsminde Fjord, Denmark. Marine Ecology Progress Series 119: 275 -
283.
Nielsen, L. P. 1992. Denitrification in sediment determined from nitrogen isotope pairing.
FEMS Microbiology Ecology 9(4): 357-361.
Nies, D. H. 1999. Microbial heavy-metal resistance. Applied Microbiology and
Biotechnology 51(6): 730-750.
Nixon, S. W. 1995. Coastal marine eutrophication - A definition, social causes, and future
concerns. Ophelia 41: 199-219.

105
Nixon, S. W., Ammerman, J. W., Atkinson, L. P., Berounsky, V. M., Billen, G., Boicourt,
W. C., Boynton, W. R., Church, T. M., Ditoro, D. M., Elmgren, R., Garber, J. H.,
Giblin, A. E., Jahnke, R. A., Owens, N. J. P., Pilson, M. E. Q., & Seitzinger, S. P.
1996. The fate of nitrogen and phosphorus at the land sea margin of the North
Atlantic Ocean. Biogeochemistry 35(1): 141-180.
Nizzoli, D., Bartoli, M., Cooper, M., Welsh, D. T., Underwood, G. J. C., & Viaroli, P. 2007.
Implications for oxygen, nutrient fluxes and denitrification rates during the early
stage of sediment colonisation by the polychaete Nereis spp. in four estuaries.
Estuarine, Coastal and Shelf Science 75(1-2): 125-134.
Norði, G. á., Glud, R. N., Gaard, E., & Simonsen, K. 2011. Environmental impacts of
coastal fish farming: carbon and nitrogen budgets for trout farming in
Kaldbaksfjørður (Faroe Islands). Marine Ecology Progress Series: 431: 223-241.
O'Connor, N. A., Cannon, F., Zampatti, B., Cottingham, P., & Reid, M. 1996. A pilot
biological survey of Macquarie Harbour, western Tasmania (Vol. Supervising
Scientist Report No. 113): Supervising Scientist, Barton, ACT.
Ostrom, N. E., Hedin, L. O., von Fischer, J. C., & Robertson, G. P. 2002. Nitrogen
transformations and NO3- removal at a soil-stream interface: A stable isotope
approach. Ecological Applications 12(4): 1027-1043.
Overnell, J., Harvey, S. M., & Parkes, R. J. 1996. A biogeochemical comparison of sea loch
sediments. Manganese and iron contents, sulphate reduction and oxygen uptake
rates. Oceanologica Acta 19(1): 41-55.
Paerl, H. W., Valdes, L. M., Peierls, B. L., Adolf, J. E., & Harding, L. W., Jr. 2006.
Anthropogenic and climatic influences on the eutrophication of large estuarine
ecosystems. Limnology and Oceanography 51(1): 448-462.
Papageorgiou, N., Kalantzi, I., & Karakassis, I. 2010. Effects of fish farming on the
biological and geochemical properties of muddy and sandy sediments in the
Mediterranean Sea. Marine Environmental Research 69(5): 326-336.
Pavissich, J. P., Silva, M., & Gonzalez, B. 2010. Sulfate reduction, molecular diversity, and
copper amendment effects in bacterial communities enriched from sediments
exposed to copper mining residues. Environmental Toxicology and Chemistry
29(2): 256-264.
106
Pearson, T. H., & Black, K. D. 2001. The environmental impacts of marine fish cage
culture. In K. D. Black (Ed.), Environmental impacts of aquaculture. Boca Raton,
FL, CRC Press. 1–31.
Quinn, G. P., & Keough, M. J. 2002. Experimental Design and Data Analysis for Biologists:
Cambridge University Press.
Rabalais, N. N. 2009. Hypoxia. In J. H. Steele, S. A. Thrope & K. K. Turekian (Eds.),
Elements of Physical Oceanography: A derivative of the Encyclopedia of Ocean
Sciences, Elsevier Science. 306-314.
Rabalais, N. N., Turner, R. E., & Wiseman, W. J. 2002. Gulf of Mexico hypoxia, aka "The
dead zone". Annual Review of Ecology and Systematics 33: 235-263.
Read, P., & Fernandes, T. 2003. Management of environmental impacts of marine
aquaculture in Europe. Aquaculture 226(1-4): 139-163.
Roberts, K. L., Eate, V. M., Eyre, B. D., Holland, D. P., & Cook, P. L. M. 2012. Hypoxic
events stimulate nitrogen recycling in a shallow salt-wedge estuary: The Yarra River
estuary, Australia. Limnology and Oceanography 57(5): 1427-1442.
Roden, E. E., & Edmonds, J. W. 1997. Phosphate mobilization in iron-rich anaerobic
sediments: Microbial Fe(III) oxide reduction versus iron-sulfide formation. Archiv
Fur Hydrobiologie 139(3): 347-378.
Rygg, B. 1985. Effect of sediment copper on benthic fauna Marine Ecology Progress Series
25(1): 83-89.
Rysgaard, S., Fossing, H., & Jensen, M. M. 2001. Organic matter degradation through
oxygen respiration, denitrification, and manganese, iron, and sulfate reduction in
marine sediments (the Kattegat and the Skagerrak). Ophelia 55(2): 77-91.
Rysgaard, S., Risgaard-Petersen, N., & Sloth, N. P. 1996. Nitrification, denitrification, and
nitrate ammonification in sediments of two coastal lagoons in Southern France.
Hydrobiologia 329(1-3): 133-141.
Rysgaard, S., Risgaard-Petersen, N., Sloth, N. P., Jensen, K., & Nielsen, L. P. 1994. Oxygen
regulation of nitrification and denitrification in sediments. Limnology and
Oceanography 39(7): 1643-1652.
Ryther, J. H., & Dunstan, W. M. 1971. Nitrogen, phosphorus, and eutrophication in the
coastal marine environment. Science 171(3975): 1008-1013.

107
Sarà, G., Scilipoti, D., Milazzo, M., & Modica, A. 2006. Use of stable isotopes to investigate
dispersal of waste from fish farms as a function of hydrodynamics. Marine Ecology
Progress Series 313: 261-270.
Sayama, M. 2001. Presence of nitrate-accumulating sulfur bacteria and their influence on
nitrogen cycling in a shallow coastal marine sediment. Appl Environ Microbiol
67(8): 3481-3487.
Schendel, E. K., Nordstrom, S. E., & Lavkulich, L. M. 2004. Floc and sediment properties
and their environmental distribution from a marine fish farm. Aquaculture Research
35(5): 483-493.
Seitzinger, S. P. 1987. Nitrogen biogeochemistry in an unpolluted estuary - the importance
of benthic denitrification. Marine Ecology Progress Series 41(2): 177-186.
Seitzinger, S. P. 1990. Denitrification in aquatic sediments. In N. P. Revsbech & J. Sorensen
(Eds.), Denitrification in soil and sediment. New York, Plenum Press. 301-322.
Small, C., & Nicholls, R. J. 2003. A global analysis of human settlement in coastal zones.
Journal of Coastal Research 19(3): 584-599.
Sørensen, J., Jørgensen, B. B., & Revsbech, N. P. 1979. A comparison of oxygen, nitrate,
and sulfate respiration in coastal marine sediments. Microb Ecol 5(2): 105-115.
Stephan, M., & Hobsbawn, P. 2014. Australian fisheries and aquaculture statistics 2013
Fisheries Research and Development Corporation project 2010/208 ABARES,
Canberra, November. 115 pp.
Sundbäck, K., Linares, F., Larson, F., Wulff, A., & Engelsen, A. 2004. Benthic nitrogen
fluxes along a depth gradient in a microtidal fjord: The role of denitrification and
microphytobenthos. Limnology and Oceanography 49(4): 1095-1107.
Sundby, B., Gobeil, C., Silverberg, N., & Mucci, A. 1992. The phosphorus cycle in coastal
marine sediments. Limnology and Oceanography 37(6): 1129-1145.
Talman, S., O'Connor, N. A., Zampatti, B., & Cannon, F. 1996. Monitoring of benthic
invertebrates in Macquarie Harbour, western Tasmania: Supervising Scientist,
Barton, ACT.
Teasdale, P., Apte, S., Batley, G., & Ford, P. W. 1996. The behaviour of copper in
sediments and waters of Macquarie Harbour, western Tasmania: Supervising
Scientist, Barton, ACT.
108
Teasdale, P., Apte, S. C., Ford, P. W., Batley, G. E., & Koehnken, L. 2003. Geochemical
cycling and speciation of copper in waters and sediments of Macquarie Harbour,
Western Tasmania. Estuarine, Coastal and Shelf Science 57(3): 475-487.
Thamdrup, B. 2012. New pathways and processes in the global nitrogen cycle. Annual
Review of Ecology, Evolution, and Systematics 43(1): 407-428.
Tong, G. D., & Williamson, B. 1998. Mount Lyell remediation : modelling of the
hydrodynamics and chemistry of Macquarie Harbour, western Tasmania: Canberra,
ACT.
Trimmer, M., Nedwell, D. B., Sivyer, D. B., & Malcolm, S. J. 2000. Seasonal benthic
organic matter mineralisation measured by oxygen uptake and denitrification along a
transect of the inner and outer River Thames estuary, UK. Marine Ecology Progress
Series 197: 103-119.
Valdemarsen, T., Kristensen, E., & Holmer, M. 2009. Metabolic threshold and sulfide-
buffering in diffusion controlled marine sediments impacted by continuous organic
enrichment. Biogeochemistry 95(2-3): 335-353.
Voss, M., Baker, A., Bange, H. W., Conley, D., Cornell, S., Deutsch, B., Engel, A.,
Ganeshram, R., Garnier, J., Heiskanen, A., Jickells, T., Lancelot, C., McQuatters-
Gollop, A., Middelburg, J., Schiedek, D., Slomp, C. P., & Conley, D. P. 2011.
Nitrogen processes in coastal and marine ecosystems. In M. A. Sutton, C. M.
Howard., J. W. Erisman, G. Billen, A. Bleeker, P. Grennfelt, H. van Grinsven & B.
Grizzetti (Eds.), The European Nitrogen Assessment: Sources, Effects and Policy
Perspectives. Cambridge, United Kingdom, and New York, NY, USA Cambridge
University Press. 147-176.
Wang, F., Juniper, S. K., Pelegrı́, S. l. P., & Macko, S. A. 2003. Denitrification in sediments
of the Laurentian Trough, St. Lawrence Estuary, Québec, Canada. Estuarine,
Coastal and Shelf Science 57(3): 515-522.
Wang, X., Olsen, L. M., Reitan, K. I., & Olsen, Y. 2012. Discharge of nutrient wastes from
salmon farms: environmental effects, and potential for integrated multi-trophic
aquaculture. Aquaculture Environment Interactions 2(3): 267-283.
Wassmann, P. 1984. Sedimentation and benthic mineralization of organic detritus in a
Norwegian fjord. Marine Biology 83(1): 83-94.

109
Wu, R. S. S. 1995. The environmental impact of marine fish culture: Towards a sustainable
future. Mar Pollut Bull 31(4-12): 159-166.
Yokoyama, H., Abo, K., & Ishihi, Y. 2006. Quantifying aquaculture-derived organic matter
in the sediment in and around a coastal fish farm using stable carbon and nitrogen
isotope ratios. Aquaculture 254(1-4): 411-425.