unveiling the nanoscale heterogeneity controlled
TRANSCRIPT

Journal of the Mechanics and Physics of Solids 121 (2018) 432–446
Contents lists available at ScienceDirect
Journal of the Mechanics and Physics of Solids
journal homepage: www.elsevier.com/locate/jmps
Unveiling the nanoscale heterogeneity controlled deformation
of thermosets
Jérémy Chevalier a , ∗, Laurence Brassart c , Frédéric Lani a , Christian Bailly
b , Thomas Pardoen
a , Xavier P. Morelle
a , d , ∗
a Institute of Mechanics, Materials and Civil Engineering (iMMC), Université catholique de Louvain, Louvain-la-Neuve 1348, Belgium
b Institute of Condensed Matter and Nanosciences (IMCN), Université catholique de Louvain, Louvain-la-Neuve 1348, Belgium
c Department of Materials Science and Engineering, Monash University, Clayton, VIC 3800, Australia d Laboratoire de Sciences et Ingenierie de la Matière Molle, CNRS, ESPCI Paris, PSL Research University, 75005 Paris, France
a r t i c l e i n f o
Article history:
Received 11 May 2018
Revised 14 August 2018
Accepted 17 August 2018
Available online 18 August 2018
Keywords:
Deformation micro-mechanisms
Discrete and heterogeneous plasticity
Mesoscale modeling
STZ Dynamics
Glassy polymers
a b s t r a c t
The deformation behavior of polymer materials below their glass transition temperature
involves a complex intermingling of elasticity, of viscoplastic yielding with softening and
large strain hardening, and of significant rate, temperature and pressure dependency. Dur-
ing unloading, the response exhibits large non-linearity as well, combining forward and
backward creep. Even though the nature of the atomistic underlying mechanisms is rela-
tively well understood, a full picture of the interactions between the elementary distortion
mechanisms and their collective organization capturing the complexity of the macroscopic
behavior is still lacking. Here, we propose a mesoscale approach based on the heteroge-
neous activation of molecular level shear transformation zones and we show that it is
rich enough to unravel the physical origin of most aspects of the macroscopic viscoplas-
tic response. The study is based on a wide micro- and macro-mechanical test campaign
on a thermoset material. In addition to providing a full characterization of all macroscopic
properties, evidence of a complex rate reversal mechanism upon unloading is given. Other
experiments provide insights about the characteristic length scales at play. Compared to
existing continuum models involving typically more than 25 parameters, the present for-
malism is based on only 7 physical parameters while allowing quantitative predictions of
all the experimental data. The present approach opens new avenues for the prediction of
the mechanical response of a variety of polymer applications in confined state such as in
composites or in adhesive joints. It also offers a new line of thought to address the me-
chanics of polymers at small and intermediate length scales.
© 2018 Elsevier Ltd. All rights reserved.
1. Introduction
Amorphous polymers are one of the most ubiquitous materials in our current daily lives, ranging from simple kitchen-
ware made of polystyrene to advanced epoxy-based composite panels used in aircrafts and cars. The low density, low cost,
easy processability, and durability of glassy polymers make them versatile in terms of applications and attractive for struc-
tural solutions undergoing moderate loading levels. This attractive set of properties comes from their macromolecular nature
∗ Corresponding authors.
E-mail address: [email protected] (J. Chevalier).
https://doi.org/10.1016/j.jmps.2018.08.014
0022-5096/© 2018 Elsevier Ltd. All rights reserved.
J. Chevalier et al. / Journal of the Mechanics and Physics of Solids 121 (2018) 432–446 433
( Meijer and Govaert, 2005 ), that distinguishes them from hard structural materials like polycrystalline metallic alloys. Their
mechanical response in tension and compression shows a peculiar behavior, exhibiting post-yield strain softening, large
strain hardening with significant strain rate, temperature and pressure dependence, and strong non-linearity upon unload-
ing (e.g. Boyce et al. (1988) ; Fiedler et al. (2001) ; Gerlach et al. (2008) ; Morelle et al. (2017) ; Poulain et al. (2014) ). Over
the years, a number of (visco)elastic-viscoplastic constitutive models have been developed in an attempt to capture the full
spectrum of post-yield deformation phenomena of glassy polymers. Most of these models originate from the pioneer 1D
elastic-viscoplastic model of Haward and Thackray (1968) where the glassy polymer response is decomposed into (i) an in-
termolecular resistance contribution corresponding to the thermally-activated plastic flow, and (ii) a configurational entropy
resistance contribution, borrowed from rubber elasticity, to account for the large strains rehardening process due to finite
chain extension and alignement. If these models were successively refined and extended (e.g. Ames et al. (2009) ; Anand
et al. (2009) ; Anand and Gurtin (2003) ; Bergstrom and Boyce (2001) ; Boyce et al. (1988) ; Gudimetla and Doghri (2017) ;
Nguyen et al. (2016) ; Srivastava et al. (2010) ; Tervoort et al. (1996) ; Wu and Van Der Giessen (1993) ), they still typically
require a large number of phenomenological parameters (at least 20, and often many more) with limited physical basis.
For instance, even with recent models, a heuristic law is usually used to describe the post-yield softening (e.g. Poulain
et al. (2013) ), while the superposition of several kinematic hardening components is required to capture the experimentally-
observed strong non-linearity effects upon unloading ( Anand et al., 2009; Senden et al., 2010 ). Moreover, even the most
elaborate models do not rely on purely micro-mechanical ground to explain the origin of the complex macroscopic behav-
ior in the glassy state. Indeed, while a globally-accepted molecular deformation picture is available above T g , known as
the tube model ( Wang et al., 2013 ), the physical description of the deformation micro-mechanisms in the amorphous state
(below T g ) is still open to debate ( Budrikis et al., 2017 ). The present work aims at providing a possible generic answer for
the glassy regime behavior through a bottom-up mesoscale modeling approach, validated for the case of the RTM6 epoxy
resin.
Due to the lack of experimental observations available at the microscopic scale for amorphous polymers, the only clues
on the possible molecular resistance mechanisms involved in the glassy state were either : (i) suggested through molecular
yield theories developed in the late sixties by Ree and Eyring (1955) , Robertson (1966) , Bowden and Raha (1974) , Argon
(1973) , each assuming a different molecular rearrangement or conformational change (such as double kinks, dihedral flips
and twists, and disclination loops) as the possible carrier of local plasticity ; or (ii) unravelled via molecular dynamics (MD)
simulations (e.g. Chen and Schweizer (2011) ; Hoy and Robbins (2008) ; Jatin et al. (2013) ; Rottler (2009) ; Sundararaghavan
and Kumar (2013) ) confirming that several of the envisioned molecular rearrangements can indeed occur during plastic
flow. MD simulations also revealed the role played by nanoscale heterogeneities, and their dynamic evolution, in the mi-
crostructural state ( Ediger, 20 0 0; Falk and Langer, 1998 ). However, MD-based analysis is typically restricted to very short
time scales and to small material volumes, which limits its practical use with respect to real-life experimental conditions
or to the longer time scales associated with thermally-activated mechanisms. Moreover, while both approaches - molecular
yield theories and MD simulations - helped clarifying the atomistic elementary mechanisms of plasticity in glassy polymers,
a clear picture of how the interactions between these elementary events and their collective organization affect and explain
the macroscopic response of amorphous polymers is still lacking.
Regardless of the exact nature of the molecular rearrangements, it is now admitted that the flow behavior in glassy
polymers originates from the nucleation and cooperative interaction of localized conformational changes in the molecular
chains ( Argon, 2013; Malekmotiei et al., 2015 ). In particular, Oleynik (1989) experimentally observed through differential
scanning calorimetry of deformed glassy polymers that a major part of the energy stored during plastic deformation cannot
be attributed to conformational changes alone, but rather to the elastic interaction of these localized plastic events with
the surrounding matrix. Based on these pioneering observations, Hasan and Boyce (1995) were the first to demonstrate
that a model based on the thermally-activated nature and highly heterogeneous microstructural state of glassy polymer can
successfully predict their full viscoplastic behavior. Hence, discrete irreversible rearrangements, encompassing any kind of
glide, slip or shear-rotation of the polymer chains, along with their interaction with the microstructural surrounding, can be
considered as the elementary micro-mechanisms driving plasticity in glassy polymers ( Argon, 2013; Stachurski, 1997 ).
In the larger field of plasticity of amorphous materials, the concept of discrete plasticity events interacting through a
polarized stress field is not new (see e.g. Argon and Bessonov (1977) ; Argon (1973, 2013) ; Bowden and Raha (1974) ; G’Sell
(1986) ; Mangion et al. (1992) ). In particular, Argon (1979) proposed a framework, originally developed for metallic glasses,
based on atomic clusters of conformational changes, called ”Shear Transformation Zones” (STZs). The shear transformation
process is governed by an activation energy quantified by the increment of elastic energy stored in a STZ and its immediate
surrounding when it experiences a local transformation shear strain. The pioneering work by Argon (1979) has been widely
used as a basis for analyzing the dynamics of deformation in the field of metallic glasses. For instance, implementations of
extensions of the initial STZ framework were successful in modelling both the viscoplasticity and the impact of the thermo-
mechanical history in metallic glasses (e.g. Falk et al. (2004) ; Falk and Langer (1998) ; Langer (2008) ; Shi and Falk (2005) ),
or to capture the complex shear pattern observed experimentally ( Budrikis et al., 2017 ). Nonetheless, the concepts of local
rearrangements through short-range order in an atomic environment are also relevant in a macromolecular context ( Argon,
2013; Wang et al., 2014 ). Therefore, the STZ concept has recently been the subject of increasing attention in the field of
polymer glasses as well. Following the early extension to polymers by Argon et al. (1995) ; Bulatov and Argon (1994) ; Mott
et al. (1993) , more recent studies have used implementations similar to Argon’s STZ model in an attempt to measure the
STZ size ( Samadi-Dooki et al., 2016 ), to model the viscoplastic behavior in compression ( Voyiadjis and Samadi-Dooki, 2016 ),

434 J. Chevalier et al. / Journal of the Mechanics and Physics of Solids 121 (2018) 432–446
to capture the size effect observed in nanoindentation ( Voyiadjis et al., 2018 ) or to determine the impact of confinement on
the rheological properties ( Masurel et al., 2017; 2015 ).
In this work, inspired by the implementation elaborated by Harris et al. (2016) ; Homer and Schuh (2009) ; Li et al.
(2013) of Argon’s STZ model for metallic glasses, we have developed a mesoscale model for glassy polymers based on ran-
dom, heterogeneous activation of STZs. In this modelling framework, STZs first tend to initiate randomly in the material,
around regions with higher mobility or excess energy, and hence lower activation energy barrier. In a second stage, STZs
start interacting with each other, through the elastic field generated in their surroundings after activation. Due to the polar-
ized mechanical field, STZs tend to progressively activate in the form of larger clusters by joining with just-activated neigh-
boring STZs, eventually leading to local micro shear band propagation, building strong backstress in the material. Thanks to
its conceptual simplicity, the model requires the identification of only seven parameters, out of which five are not directly
obtained from experimental data. The model is calibrated and validated based on a large experimental dataset obtained on
the RTM6 epoxy resin, a highly cross-linked epoxy resin widely used in aeronautic and space applications as a matrix for
fiber reinforced composites. Experimental results include the compression response under varying strain rates and temper-
atures, including loading and unloading, as well as creep tests at different levels of applied load ( Morelle, 2015; Morelle
et al., 2017 ).
We show here that the proposed formalism is rich enough to predict the full stress-strain response and to quantitatively
reproduce all the complex deformation phenomena associated with glassy polymers mechanical response, including post-
yield strain softening and non-linear unloading behavior, without relying on any viscoelastic or plastic ad hoc continuum
assumptions. One key feature of our mesoscale model is the generation of large backstress as a result of the interactions
between randomly generated STZs. This allows, among other things, the prediction of successive backward and forward
creep upon partial unloading, also called rate-reversal phenomenon. The small number of ingredients used to predict a
large range of phenomena supports the relevance of the physically proposed micro-mechanism, opening many avenues to
address intermediate scale mechanical phenomena and bridging atomistic and continuum models.
The outline of this paper is the following. The model is presented first, including the formulation of the energy barrier,
the addings specific to the present application on thermosets, the FE implementation and the identification of the model
parameters. Section 3 combines the results in terms of validation and parameters study with the discussion about the mech-
anisms unravelled by the STZ based simulations. Section 4 provides additional experimental data confirming the predicted
heterogeneous deformation pattern.
2. Modeling framework
A STZ is a small volume of material which can undergo a thermally-activated, stress-induced change of configuration
involving a shear transformation strain �ε ∗i j
( Fig. 1 c). The underlying molecular mechanism is left unspecified, and can be a
dihedral flip, a crankshaft, a chain slip, etc. The transformation is stable, leading to a permanent deformation and can only
be reversed if an energy barrier is overcome again, which is unlikely by pure thermal activation. In two dimensions, we
assume that the transformation strain is purely deviatoric, with maximum engineering shear strain γ 0 and shear angle ω,
respectively ( Fig. 1 c). In the following, we will refer to ω as the direction of activation, for simplicity.
The energy barrier for the transformation of a STZ is a material parameter that varies with local temperature, mechani-
cal and microstructural state. Following Argon (1979) , the amplitude �F 0 of the energy barrier can be approximated by the
elastic energy change associated with the shear transformation of a single spherical inclusion in an infinite elastic matrix,
using Eshelby’s solution ( Eshelby, 1957 ). The expression of �F 0 includes three contributions: (i) �F shear corresponds to the
matrix strain energy associated with the shear deformation of the STZ, (ii) �F dil corresponds to the matrix strain energy
associated with the effective temporary dilation ε v , eff necessary to activate a STZ, and (iii) �F coh is a cohesion term asso-
ciated with the shearing of an unconstrained STZ, with ˆ τ the intrinsic inter-molecular shear resistance. This energy barrier
writes:
�F 0 (T , σn ) = �F shear + �F dil + �F coh =
7 − 5 ν
30 ( 1 − ν) μ(T ) γ 2
0 0 +
2 ( 1 + ν)
9 ( 1 − ν) μ(T ) ε 2 v , eff0 +
1
2
ˆ τγ0 0
with ε v , eff = ε v
(1 − β
σn
E(T )
). (1)
In Eq. (1) , T is the absolute temperature, ν is the Poisson ratio, μ( T ), 0 ( T ) and E ( T ) are respectively the temperature-
dependent shear modulus, activation volume and Young’s modulus, and ɛ v is the temporary activation dilation in the absence
of stress. Compared to Argon’s original expression, the effective temporary dilation ε v , eff has been introduced in order to
account for the pressure dependence of the transformation. The effect of a pre-existing volumetric strain on the energy
barrier is accounted for through the term β σn E(T )
, with σ n the stress normal to the transformation shear strain direction (see
Fig. 1 c), and β a positive fitting parameter. Hence, σ n / E ( T ) either reduces or increases the effective, tem porary volumetric
strain required for transformation, depending on the sign of σ n . Note that the effective tem porary dilation does not depend
explicitly on the hydrostatic stress, but only on the normal stress. Our results indicate that this additional dependency can
describe the asymmetry between the tension and compression response, in agreement with experimental observations. This
is demonstrated by Fig. 2 e and 2f in SI. The temporary dilation is a transient state, only accounted for in the calculation of
the energy barrier �F and it does not translate into an actual volumetric strain in the model.
0
J. Chevalier et al. / Journal of the Mechanics and Physics of Solids 121 (2018) 432–446 435
Fig. 1. Schematic representation of the Shear Transformation Zone (STZ) modeling framework. A STZ is defined as a molecular cluster of polymer chains
able to undergo a thermally-activated, stress-induced change of conformation. In the present FE framework, it is modelled as a central element and all the
neighboring elements sharing a common node with it, as illustrated by the STZs A, B and C in grey. (a) A 2D plane-strain FE triangular mesh coupled to a
KMC algorithm is used to describe the STZs interactions, mediated by their neighboring elastic field, and occuring at the mesoscale in a glassy polymer. (b)
Upon applied external loading, at each time increment, each STZ is assessed to check if it has enough thermo-mechanical energy for a forward activation
leading to (c) a deviatoric deformation of γ 0 in the local direction ω of maximum shear stress. After several activations, each STZ has an accumulated
strain orientation defined by θ .
In addition to the elastic energy associated with the transformation, the current microstructural state (i.e. local molecular
mobility) and the chain stretching inside a given STZ are considered to have a direct influence on the amplitude of the
energy barrier. In order to describe these effects, the following expression for an effective energy barrier, �F eff, was adopted,
generalizing Eq. (1) :
�F eff = �F shear + ( �F dil + �F coh ) g( f v ) + H(λ) cos ( 2(ω − θ ) ) , (2)
where f v , called the local “free volume” content, is a phenomenological parameter characterizing the local excess energy or
chain mobility, λ is a measure of the polymer chain elongation, and the angles ω and θ respectively give the angle of the
maximum shear stress τmax within the STZ domain and the averaged orientation of its accumulated transformation shear
strain (see Fig. 1 a and 1c). The functions g ( f v ) and H ( λ) will be described in more details later.
The expression for the rate of STZ activation ˙ s is borrowed from the transition state theory developed by Ree and Eyring
(1955) and follows Argon (1979) :
˙ s = ν0 exp
(−�F eff − τmax 0 γ0 / 2
k B T
), (3)
where ν0 is the attempt frequency, taken as equal to the Debye frequency and k B is the Boltzmann constant. The term
τmax 0 γ0 / 2 is the mechanical energy supply that drives the transformation.
The kinetics of STZ activation is governed by a time-dependent Kinetic Monte Carlo (KMC) algorithm ( Dawnkaski et al.,
1995 ). The algorithm determines whether a STZ is activated during a small time increment �t , based on the following
probability of activation P act :
P act =
˙ s �t. (4)
436 J. Chevalier et al. / Journal of the Mechanics and Physics of Solids 121 (2018) 432–446
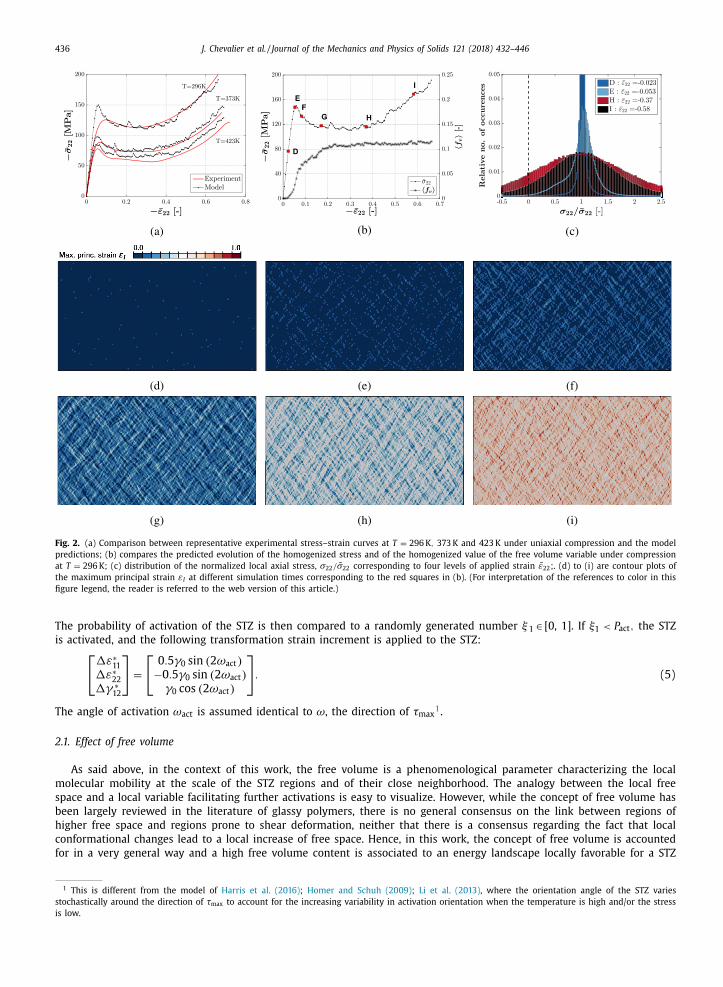
Fig. 2. (a) Comparison between representative experimental stress–strain curves at T = 296 K , 373 K and 423 K under uniaxial compression and the model
predictions; (b) compares the predicted evolution of the homogenized stress and of the homogenized value of the free volume variable under compression
at T = 296 K ; (c) distribution of the normalized local axial stress, σ22 / ̄σ22 corresponding to four levels of applied strain ε̄ 22 ;. (d) to (i) are contour plots of
the maximum principal strain εI at different simulation times corresponding to the red squares in (b). (For interpretation of the references to color in this
figure legend, the reader is referred to the web version of this article.)
The probability of activation of the STZ is then compared to a randomly generated number ξ 1 ∈ [0, 1]. If ξ1 < P act , the STZ
is activated, and the following transformation strain increment is applied to the STZ: [
�ε ∗11
�ε ∗22
�γ ∗12
]
=
[
0 . 5 γ0 sin ( 2 ω act ) −0 . 5 γ0 sin ( 2 ω act )
γ0 cos ( 2 ω act )
]
. (5)
The angle of activation ω act is assumed identical to ω, the direction of τmax 1 .
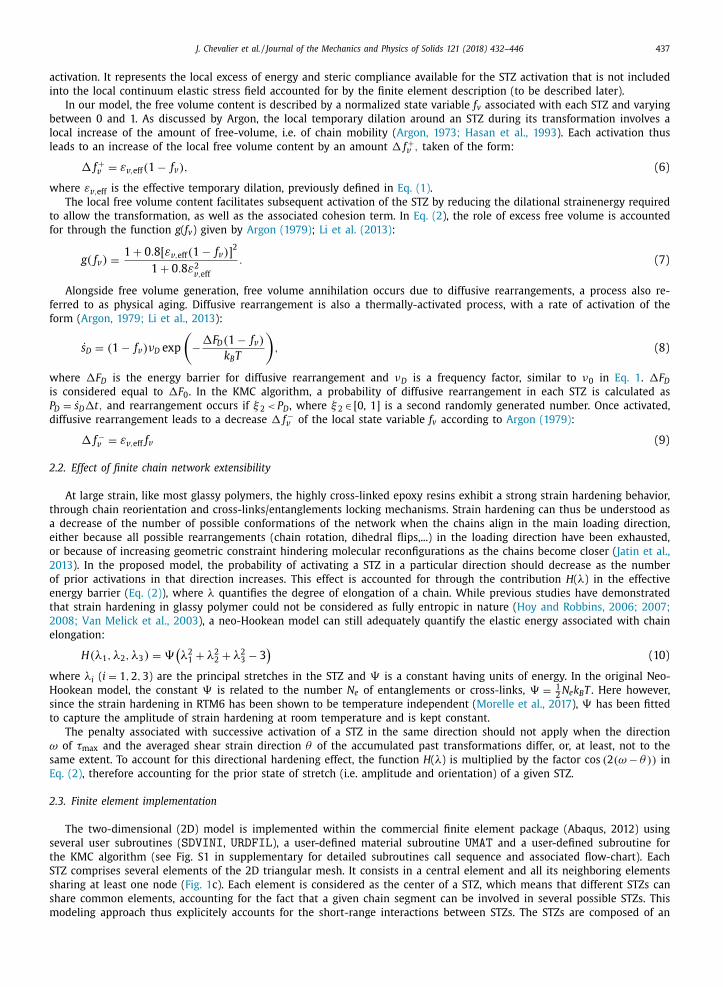
2.1. Effect of free volume
As said above, in the context of this work, the free volume is a phenomenological parameter characterizing the local
molecular mobility at the scale of the STZ regions and of their close neighborhood. The analogy between the local free
space and a local variable facilitating further activations is easy to visualize. However, while the concept of free volume has
been largely reviewed in the literature of glassy polymers, there is no general consensus on the link between regions of
higher free space and regions prone to shear deformation, neither that there is a consensus regarding the fact that local
conformational changes lead to a local increase of free space. Hence, in this work, the concept of free volume is accounted
for in a very general way and a high free volume content is associated to an energy landscape locally favorable for a STZ
1 This is different from the model of Harris et al. (2016) ; Homer and Schuh (2009) ; Li et al. (2013) , where the orientation angle of the STZ varies
stochastically around the direction of τmax to account for the increasing variability in activation orientation when the temperature is high and/or the stress
is low.
J. Chevalier et al. / Journal of the Mechanics and Physics of Solids 121 (2018) 432–446 437
activation. It represents the local excess of energy and steric compliance available for the STZ activation that is not included
into the local continuum elastic stress field accounted for by the finite element description (to be described later).
In our model, the free volume content is described by a normalized state variable f v associated with each STZ and varying
between 0 and 1. As discussed by Argon, the local temporary dilation around an STZ during its transformation involves a
local increase of the amount of free-volume, i.e. of chain mobility ( Argon, 1973; Hasan et al., 1993 ). Each activation thus
leads to an increase of the local free volume content by an amount � f + v , taken of the form:
� f + v = ε v , eff( 1 − f v ) , (6)
where ε v , eff is the effective temporary dilation, previously defined in Eq. (1) .
The local free volume content facilitates subsequent activation of the STZ by reducing the dilational strainenergy required
to allow the transformation, as well as the associated cohesion term. In Eq. (2 ), the role of excess free volume is accounted
for through the function g ( f v ) given by Argon (1979) ; Li et al. (2013) :
g( f v ) =
1 + 0 . 8 [ ε v , eff( 1 − f v ) ] 2
1 + 0 . 8 ε 2 v , eff
. (7)
Alongside free volume generation, free volume annihilation occurs due to diffusive rearrangements, a process also re-
ferred to as physical aging. Diffusive rearrangement is also a thermally-activated process, with a rate of activation of the
form ( Argon, 1979; Li et al., 2013 ):
˙ s D = ( 1 − f v ) νD exp
(−�F D ( 1 − f v )
k B T
), (8)
where �F D is the energy barrier for diffusive rearrangement and νD is a frequency factor, similar to ν0 in Eq. 1 . �F Dis considered equal to �F 0 . In the KMC algorithm, a probability of diffusive rearrangement in each STZ is calculated as
P D = ˙ s D �t, and rearrangement occurs if ξ 2 < P D , where ξ 2 ∈ [0, 1] is a second randomly generated number. Once activated,
diffusive rearrangement leads to a decrease � f −v of the local state variable f v according to Argon (1979) :
� f −v = ε v , eff f v (9)
2.2. Effect of finite chain network extensibility
At large strain, like most glassy polymers, the highly cross-linked epoxy resins exhibit a strong strain hardening behavior,
through chain reorientation and cross-links/entanglements locking mechanisms. Strain hardening can thus be understood as
a decrease of the number of possible conformations of the network when the chains align in the main loading direction,
either because all possible rearrangements (chain rotation, dihedral flips,...) in the loading direction have been exhausted,
or because of increasing geometric constraint hindering molecular reconfigurations as the chains become closer ( Jatin et al.,
2013 ). In the proposed model, the probability of activating a STZ in a particular direction should decrease as the number
of prior activations in that direction increases. This effect is accounted for through the contribution H ( λ) in the effective
energy barrier ( Eq. (2) ), where λ quantifies the degree of elongation of a chain. While previous studies have demonstrated
that strain hardening in glassy polymer could not be considered as fully entropic in nature ( Hoy and Robbins, 20 06; 20 07;
2008; Van Melick et al., 2003 ), a neo-Hookean model can still adequately quantify the elastic energy associated with chain
elongation:
H(λ1 , λ2 , λ3 ) = �(λ2
1 + λ2 2 + λ2
3 − 3
)(10)
where λi ( i = 1 , 2 , 3 ) are the principal stretches in the STZ and � is a constant having units of energy. In the original Neo-
Hookean model, the constant � is related to the number N e of entanglements or cross-links, � =
1 2 N e k B T . Here however,
since the strain hardening in RTM6 has been shown to be temperature independent ( Morelle et al., 2017 ), � has been fitted
to capture the amplitude of strain hardening at room temperature and is kept constant.
The penalty associated with successive activation of a STZ in the same direction should not apply when the direction
ω of τmax and the averaged shear strain direction θ of the accumulated past transformations differ, or, at least, not to the
same extent. To account for this directional hardening effect, the function H ( λ) is multiplied by the factor cos ( 2 ( ω − θ ) ) in
Eq. (2) , therefore accounting for the prior state of stretch (i.e. amplitude and orientation) of a given STZ.
2.3. Finite element implementation
The two-dimensional (2D) model is implemented within the commercial finite element package (Abaqus, 2012) using
several user subroutines ( SDVINI , URDFIL ), a user-defined material subroutine UMAT and a user-defined subroutine for
the KMC algorithm (see Fig. S1 in supplementary for detailed subroutines call sequence and associated flow-chart). Each
STZ comprises several elements of the 2D triangular mesh. It consists in a central element and all its neighboring elements
sharing at least one node ( Fig. 1 c). Each element is considered as the center of a STZ, which means that different STZs can
share common elements, accounting for the fact that a given chain segment can be involved in several possible STZs. This
modeling approach thus explicitely accounts for the short-range interactions between STZs. The STZs are composed of an
438 J. Chevalier et al. / Journal of the Mechanics and Physics of Solids 121 (2018) 432–446
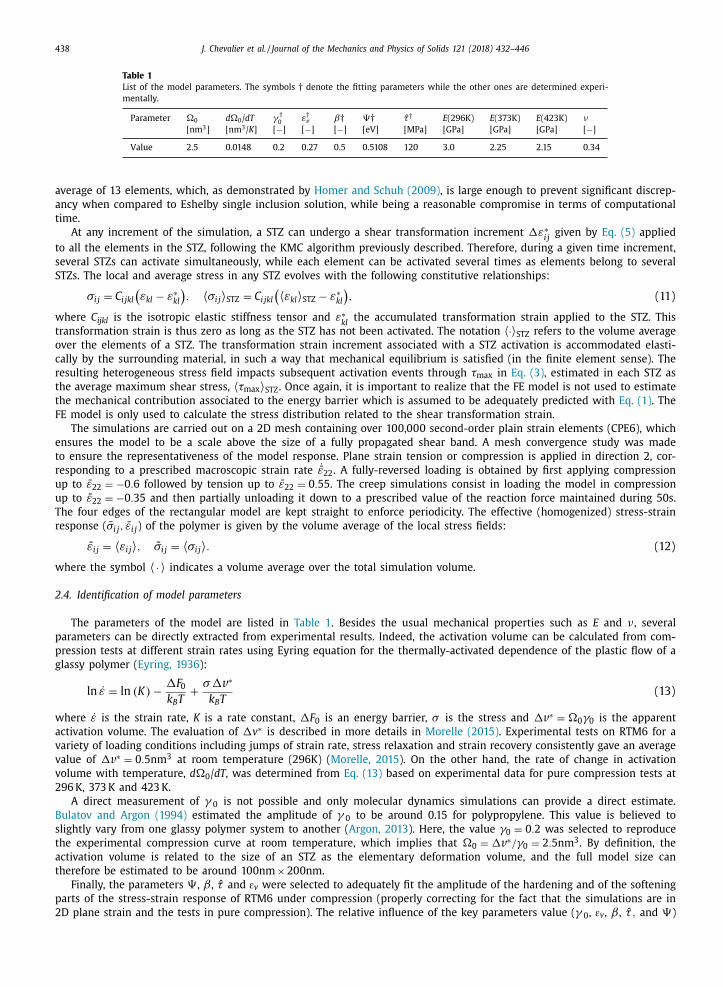
Table 1
List of the model parameters. The symbols † denote the fitting parameters while the other ones are determined experi-
mentally.
Parameter 0 d 0 / dT γ † 0
ε † v β† �† ˆ τ † E (296K) E (373K) E (423K) ν
[nm
3 ] [nm
3 / K ] [ −] [ −] [ −] [eV] [MPa] [GPa] [GPa] [GPa] [ −]
Value 2.5 0.0148 0.2 0.27 0.5 0.5108 120 3.0 2.25 2.15 0.34
average of 13 elements, which, as demonstrated by Homer and Schuh (2009) , is large enough to prevent significant discrep-
ancy when compared to Eshelby single inclusion solution, while being a reasonable compromise in terms of computational
time.
At any increment of the simulation, a STZ can undergo a shear transformation increment �ε ∗i j
given by Eq. (5) applied
to all the elements in the STZ, following the KMC algorithm previously described. Therefore, during a given time increment,
several STZs can activate simultaneously, while each element can be activated several times as elements belong to several
STZs. The local and average stress in any STZ evolves with the following constitutive relationships:
σi j = C i jkl
(ε kl − ε ∗kl
), 〈 σi j 〉 STZ = C i jkl
(〈 ε kl 〉 STZ − ε ∗kl
), (11)
where C ijkl is the isotropic elastic stiffness tensor and ε ∗kl
the accumulated transformation strain applied to the STZ. This
transformation strain is thus zero as long as the STZ has not been activated. The notation 〈·〉 STZ refers to the volume average
over the elements of a STZ. The transformation strain increment associated with a STZ activation is accommodated elasti-
cally by the surrounding material, in such a way that mechanical equilibrium is satisfied (in the finite element sense). The
resulting heterogeneous stress field impacts subsequent activation events through τmax in Eq. (3) , estimated in each STZ as
the average maximum shear stress, 〈 τmax 〉 STZ . Once again, it is important to realize that the FE model is not used to estimate
the mechanical contribution associated to the energy barrier which is assumed to be adequately predicted with Eq. (1) . The
FE model is only used to calculate the stress distribution related to the shear transformation strain.
The simulations are carried out on a 2D mesh containing over 10 0,0 0 0 second-order plain strain elements (CPE6), which
ensures the model to be a scale above the size of a fully propagated shear band. A mesh convergence study was made
to ensure the representativeness of the model response. Plane strain tension or compression is applied in direction 2, cor-
responding to a prescribed macroscopic strain rate ˙ ε̄ 22 . A fully-reversed loading is obtained by first applying compression
up to ε̄ 22 = −0 . 6 followed by tension up to ε̄ 22 = 0 . 55 . The creep simulations consist in loading the model in compression
up to ε̄ 22 = −0 . 35 and then partially unloading it down to a prescribed value of the reaction force maintained during 50s.
The four edges of the rectangular model are kept straight to enforce periodicity. The effective (homogenized) stress-strain
response ( ̄σi j , ε̄ i j ) of the polymer is given by the volume average of the local stress fields:
ε̄ i j = 〈 ε i j 〉 , σ̄i j = 〈 σi j 〉 . (12)
where the symbol 〈 · 〉 indicates a volume average over the total simulation volume.
2.4. Identification of model parameters
The parameters of the model are listed in Table 1 . Besides the usual mechanical properties such as E and ν , several
parameters can be directly extracted from experimental results. Indeed, the activation volume can be calculated from com-
pression tests at different strain rates using Eyring equation for the thermally-activated dependence of the plastic flow of a
glassy polymer ( Eyring, 1936 ):
ln ˙ ε = ln ( K ) − �F 0 k B T
+
σ�v ∗
k B T (13)
where ˙ ε is the strain rate, K is a rate constant, �F 0 is an energy barrier, σ is the stress and �v ∗ = 0 γ0 is the apparent
activation volume. The evaluation of �v ∗ is described in more details in Morelle (2015) . Experimental tests on RTM6 for a
variety of loading conditions including jumps of strain rate, stress relaxation and strain recovery consistently gave an average
value of �v ∗ = 0 . 5 nm
3 at room temperature (296K) ( Morelle, 2015 ). On the other hand, the rate of change in activation
volume with temperature, d 0 / dT , was determined from Eq. (13) based on experimental data for pure compression tests at
296 K, 373 K and 423 K.
A direct measurement of γ 0 is not possible and only molecular dynamics simulations can provide a direct estimate.
Bulatov and Argon (1994) estimated the amplitude of γ 0 to be around 0.15 for polypropylene. This value is believed to
slightly vary from one glassy polymer system to another ( Argon, 2013 ). Here, the value γ0 = 0 . 2 was selected to reproduce
the experimental compression curve at room temperature, which implies that 0 = �v ∗/γ0 = 2 . 5 nm
3 . By definition, the
activation volume is related to the size of an STZ as the elementary deformation volume, and the full model size can
therefore be estimated to be around 100nm × 200nm.
Finally, the parameters � , β , ˆ τ and ɛ v were selected to adequately fit the amplitude of the hardening and of the softening
parts of the stress-strain response of RTM6 under compression (properly correcting for the fact that the simulations are in
2D plane strain and the tests in pure compression). The relative influence of the key parameters value ( γ , ɛ v , β , ˆ τ , and �)
0
J. Chevalier et al. / Journal of the Mechanics and Physics of Solids 121 (2018) 432–446 439
on the effective stress-strain response of the computational model can be found in Fig. S2 in SI, where it is compared to a
representative experimental compression curve at room temperature at a true strain rate of 0 . 01 s −1 from which they were
identified.
3. Results and discussion
In order to validate the model with the set of parameters identified above, the predictions of the FE simulations were
compared to different experimental results with increasing degree of complexity: (i) the large strain post-yield response
under compressive (monotonic) loading at different temperatures; (ii) the non-linear unloading behavior and Bauschinger
effect associated with fully-reversed loading; and (iii) the forward creep, backward creep, and intermediate rate-reversal
phenomena observed when the applied force is held constant after different levels of unloading. In each case, the micro-
mechanical origin of the observed macroscopic phenomena is discussed based on the model mesoscopic description of the
STZs dynamics.
3.1. Large strain response under compression
The effect of temperature on the uniaxial compression response is illustrated in Fig. 2 a for T = 296 K , 373 K and 423 K,
and for an applied strain rate of 0 . 01 s −1 . The curve corresponding to T = 296 K was used to identify the model parameters,
while the other two curves are model predictions. The numerical results show that the temperature dependence of RTM6
mechanical response is properly predicted based on the experimentally-identified temperature dependence of the activation
volume and mechanical properties (i.e. E , μ). While the softening and hardening parts of the curves are perfectly captured by
the model, the pre-yield non-linearity and the yield stress are respectively under- and overestimated. These discrepancies,
which tend to vanish at higher temperature, will be discussed in more details in a later section.
Fig. 2 a also shows the evolution of the homogenized free volume state variable 〈 f v 〉 during a compression at T = 296 K
at a strain rate of 0 . 01 s −1 . The free volume progressively increases in the first stages of the simulation, before abruptly
rising to reach a plateau where an equilibrium is established between free volume creation through STZ activation and free
volume annihilation by diffusive rearrangements. The sudden free volume accumulation coincides with the onset of strain
softening and highlights an increasing STZ activation rate.
Fig. 2 d–i show the distribution of maximum principal strains εI at the integration points of the FE model, corresponding
to various loading stages (indicated by the red squares in Fig. 2 b) during a plane strain compression test at rate ˙ ε̄ = 0 . 01 s −1
and T = 296 K. Prior to the onset of yielding ( Fig. 2 d), the homogenized response is linear elastic even though some STZs
have already been activated, as evidenced by the heterogeneous strain pattern. At these early stages of loading, the per-
turbation of the local stress field within an activated STZ prevents a subsequent activation. However, the localized stresses
are progressively erased by the increasing number of neighboring which are being activated, making the STZs once again
susceptible to additional activation. The effective yield point is attained when the randomly scattered clusters of STZs reach
a critical size and start propagating into micro- shear bands that can interact ( Fig. 2 e). At this stage, the stress and strain
fields become polarized in bands oriented in the maximum shear stress direction, leading to strain localization and to soft-
ening ( Fig. 2 f and g). At larger applied strain, the rate of activation within the shear bands progressively decreases as the
hardening contribution starts to dominate, significantly reducing further STZ activations, and hence building stress again in
the band leading to the progressive re-hardening stage ( Fig. 2 h and i).
Fig. 2 c describes – for the same simulation – the distribution of the normalized axial stress σ22 / ̄σ22 at integration points,
for four levels of applied deformation. Unsurprisingly, in the linear elastic stage ( ̄ε 22 = −0 . 023 , letter D in Fig. 2 a and c),
the stress distribution is narrow, since the number of activated sites is low. However, in the post-yield softening regime
( ̄ε 22 = −0 . 37 , letter H in Fig. 2 a and c), the stress distribution significantly broadens, highlighting the strong increase of
activation rate associated with shear band propagation and the many different STZ activations associated with it. It is worth
noting that, already at this stage, a non-negligible portion of the material is subjected to an axial stress in the opposite
direction to the macroscopic loading one, as highlighted by the part of distribution on the left side of the dashed line in
Fig. 2 c, building strong back stresses in the material.
3.2. Non-linear unloading behavior and Bauschinger effect
Fig. 3 a shows the predicted mechanical response upon full unloading (where the applied load F = 0 at the end of the
test), after having applied compressive strains up to ε̄ 22 = −0 . 2 , −0 . 35 and −0 . 5 . The model captures relatively well the non-
linear unloading response, which is especially visible when unloading from ε̄ 22 = −0 . 5 . A comparison with the experiment
is provided in Fig. S3 in SI, which shows experimental curves obtained in pure compression up to different strain levels
followed by an unloading sequence. While the model captures the non-linear unloading response, it underestimates the
amplitude of the strain recovered upon unloading.
In order to unravel in more details the dynamics of the STZ deformation process, Fig. 3 b shows the instantaneous distri-
bution of STZ angles of activation ω act at the three different stages of unloading at ε̄ 22 = −0 . 35 (illustrated by the colored
squares in Fig. 3 a), whereas Fig. 3 c gives the distribution of ω, the orientation of τmax , at the same stages. At the begin-
ning of unloading ( ̄σ = −109 . 0 [MPa] in black in Fig. 3 b and c), the local stress field is still very much polarized in the
22
440 J. Chevalier et al. / Journal of the Mechanics and Physics of Solids 121 (2018) 432–446
Fig. 3. (a) Shows the predicted unloading stress strain curves after having applied compressive strains up to ε̄ 22 = −0 . 2 , −0 . 35 and −0 . 5 ; (b) plots the
instantaneous distribution of the STZ angles of activation ω act at three stages of unloading (highlighted by the colored squares on (a)) while (c) plots the
distribution of the angle ω corresponding to τ max at the same unloading stages following the compression up to ε̄ 22 = −0 . 35 .
Fig. 4. (a) The black dots curve shows the model response after a fully reversed loading from compression up to ε̄ 22 = −0 . 6 to tension down to ε̄ 22 = 0 . 55 ,
while the red stars curve corresponds to a monotonic tensile loading; (b) illustrates the highly heterogeneous distribution of ε22 after the first compression
stage of the fully-reversed loading, for ε̄ 22 = 0 . (For interpretation of the references to color in this figure legend, the reader is referred to the web version
of this article.)
compression direction, and thus still favors forward activation. As a result, the distribution of activation angles is narrow
and centered around 45 °, the maximum shear angle under pure compression. At the intermediate unloading stage (in red
in Fig. 3 b and c), the distribution of ω starts shifting towards a bimodal distribution, with a second peak of distribution
emerging around −45 ◦. As a consequence, the instantaneous angle of activation distribution also widens. Indeed, during
unloading, the magnitude of the local stress σ 22 decreases, concurrently decreasing the number of STZ activations in the
forward direction. At the same time, a non-negligible portion of the material is already subjected to a stress of the opposite
sign due to strong back stresses in the material (even prior to the beginning of unloading, as shown in Fig. 2 c). As the load
is reversed, these zones quickly become susceptible to backward activation, initiating the non-linearity in the unloading re-
sponse. At the final loading stage (in blue in Fig. 3 b and c), the distribution of angles of activation is centered around −45 ◦,which is the angle of activation in tension.
Fig. 4 a shows the model response for a fully-reversed cyclic loading: the sample is subjected to compression up to
ε̄ 22 = −0 . 6 and is then loaded in tension up to ε̄ 22 = 0 . 55 . The model predicts a strong Bauschinger effect with a yield stress
in tension much lower than in compression. The key feature for explaining the strong Bauschinger effect upon unloading and
reversed compression-tension loading lies in the explicit modeling of discrete plasticity events with specific directionality,
and associated induced stress and strain field heterogeneity, as evidenced by the blue data in Fig. 3 b and c. Moreover, the
tensile part of the curve (i.e. for ε̄ 22 > 0 ) essentially recovers the tensile large strain behavior of the pristine material, in red
in Fig. 4 a. A notable difference is the absence of upper yield and intrinsic strain softening in the tensile part of the fully
reversed loading. This effect can be explained by a typical mechanically-induced rejuvenation effect, correctly accounted for
by the model. Indeed, even though the applied strain ε̄ 22 is brought back to zero after the first compression step (black
circle in Fig. 4 a), the local stress and strain distributions are still very heterogeneous in the material, as illustrated by the
contour plot of ε22 in Fig. 4 b, in parallel with a non-zero homogenized free-volume content 〈 f v 〉 > 0.
Considering this impact of the stress and strain field heterogeneity on the amplitude of the stress drop prior to strain
softening provides an explanation for the overestimation of the yield stress previously mentioned when comparing the
experimental results and the model response under axial compression at T = 296 K in Fig. 2 a. The initial state of the
model is unrealistically considered as homogeneous, like if it had been aged during an infinitely long time. The stress drop
J. Chevalier et al. / Journal of the Mechanics and Physics of Solids 121 (2018) 432–446 441
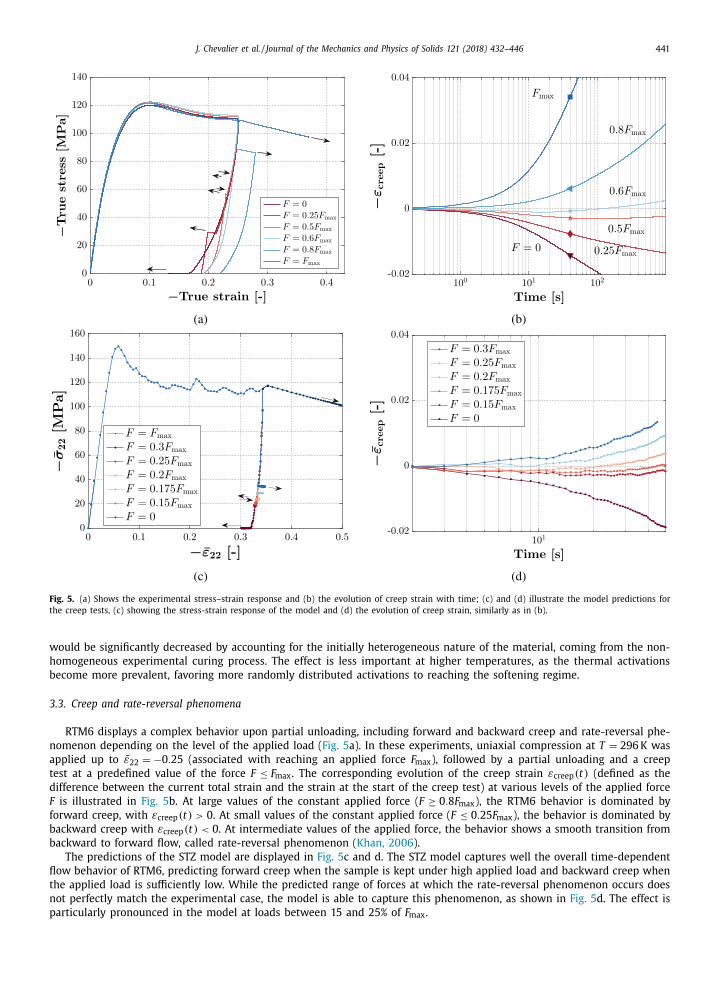
Fig. 5. (a) Shows the experimental stress–strain response and (b) the evolution of creep strain with time; (c) and (d) illustrate the model predictions for
the creep tests, (c) showing the stress-strain response of the model and (d) the evolution of creep strain, similarly as in (b).
would be significantly decreased by accounting for the initially heterogeneous nature of the material, coming from the non-
homogeneous experimental curing process. The effect is less important at higher temperatures, as the thermal activations
become more prevalent, favoring more randomly distributed activations to reaching the softening regime.
3.3. Creep and rate-reversal phenomena
RTM6 displays a complex behavior upon partial unloading, including forward and backward creep and rate-reversal phe-
nomenon depending on the level of the applied load ( Fig. 5 a). In these experiments, uniaxial compression at T = 296 K was
applied up to ε̄ 22 = −0 . 25 (associated with reaching an applied force F max ), followed by a partial unloading and a creep
test at a predefined value of the force F ≤ F max . The corresponding evolution of the creep strain ε creep (t) (defined as the
difference between the current total strain and the strain at the start of the creep test) at various levels of the applied force
F is illustrated in Fig. 5 b. At large values of the constant applied force ( F ≥ 0 . 8 F max ), the RTM6 behavior is dominated by
forward creep, with ε creep (t) > 0 . At small values of the constant applied force ( F ≤ 0 . 25 F max ), the behavior is dominated by
backward creep with ε creep (t) < 0 . At intermediate values of the applied force, the behavior shows a smooth transition from
backward to forward flow, called rate-reversal phenomenon ( Khan, 2006 ).
The predictions of the STZ model are displayed in Fig. 5 c and d. The STZ model captures well the overall time-dependent
flow behavior of RTM6, predicting forward creep when the sample is kept under high applied load and backward creep when
the applied load is sufficiently low. While the predicted range of forces at which the rate-reversal phenomenon occurs does
not perfectly match the experimental case, the model is able to capture this phenomenon, as shown in Fig. 5 d. The effect is
particularly pronounced in the model at loads between 15 and 25% of F max .

442 J. Chevalier et al. / Journal of the Mechanics and Physics of Solids 121 (2018) 432–446
Fig. 6. (a) Shows in parallel, for a creep test at F = F max , the normalized evolution of the instantaneous number of STZ activations N act / N act, max ( N act, max
being the maximum value of N act encountered during the creep test) and the evolution of the mean angle of activation 〈 ω mathrmact 〉 ; (b) shows histograms
of the instantaneous STZ angles of activation at three stages of a creep test at F = 0 .
The rate of both forward creep and backward creep decreases with time. Fig. 6 a illustrates the decrease of the instan-
taneous number of activations N act with time during a creep test at F = F max . The rate of STZ activation in the forward
direction progressively plummets as the finite network stretchability function reduces the rate of activation of STZs despite
the fact that their stress state still promotes activation in the forward loading direction, as evidenced by the mean angle of
activation 〈 ω act 〉 that remains close to 45 °. In the case of creep at F = 0 , the back stresses, generated by the heterogeneous
nature of plastic deformation and that are responsible for the backward flow, progressively vanish as the local stress field
self-equilibrates with no more external force to favor one direction over another. This is illustrated in Fig. 6 b where the tran-
sition from a distribution of instantaneous STZ activation orientation centered around −45 ◦ in the first stages of the creep
test evolves toward a fully balanced distribution at the end of the test. While a non-zero probability of further forward or
backward plastic event always remains, the probability of a net flow in one direction strongly decreases with time once the
external force vanishes. This is in agreement with experimental observations for RTM6, as an infinitely long time would be
required to entirely recover the applied strain.
The competition between backward and forward flow responsible for the rate-reversal phenomenon in creep experiments
can now be addressed through their respective activation kinetics. As already shown in Fig. 3 b and 6 b, there is a direct
relationship between the backward or forward nature of a strain increment and the average angle of activation 〈 ω act 〉 during
the corresponding time increment. The correlation is such that positive creep strain increments (i.e. backward direction) are
directly linked to an average angle of activation in the tensile direction (i.e. 0 < ω act ≤ −45 ◦), and vice versa (see Fig. S4 in
SI). Hence, the associated mechanism for rate-reversal is the occurrence of activations in the backward direction, prior to the
subsequent activations in the forward direction. The backward activations are due to the back stresses generated during the
loading and partial unloading phases. These tend to dominate over forward activations in the first instants of creep, as most
of the back stresses have just been created, the driving force is important due to the short scale freshly perturbated local
stress field while forward activations come from a more diffused effect of the overall compressive stress level operating over
the entire sample. The amount of backward creep obtained prior to forward creep is thus proportional to the amplitude of
the back stresses and the number of zones subjected to a stress σ 22 in the tensile direction.
4. Characteristic length scale and link with microscopic observations
The ability of the STZ model to predict the mechanical behavior of RTM6 provides a physical insight on the role of
elementary plastic events on the plastic behavior of glassy polymers. However, a direct experimental evidence of the afore-
mentioned mechanisms remains elusive. While micro and macro-clusters of shear bands have already been observed for
bulk flat specimens ( Bowden and Jukes, 1968; Kramer, 1974 ) and at the tip of notches ( Ishikawa et al., 1981; Narisawa et al.,
1982 ), the scale of a few STZs or even a single shear band has never been explored outside in-silico MD simulations. This
section will not provide a definitive experimental proof of the physical existence of STZ in RTM6 but shows experimental
results obtained at the micro- and nano-scale level which highlight the presence of heterogeneous deformation patterns at
the scale considered by the model.
Fig. 7 a, b and c show electron micrographs at three different levels of magnification from a compression in-situ test on
a unidirectional (UD) carbon fiber reinforced composite made with RTM6 as matrix. The specimens have been coated by a
thin gold layer prior to analysis. The three micrographs show strain localization in the matrix under the form of thin shear

J. Chevalier et al. / Journal of the Mechanics and Physics of Solids 121 (2018) 432–446 443
Fig. 7. (a)–(c) are scanning electron micrographs showing strain localization under the form of shear bands during the compression of a UD composite
with RTM6 as a matrix at three different levels of magnification; (d) shows the DMT modulus distribution obtained by AFM over a 0.5 × 0.5 μm
2 zone on
the surface of an undeformed specimen and a specimen compressed up to ε̄ = −0 . 5
bands. The exact width of the shear bands is difficult to estimate but is certainly below 100 nm. The small cracks at the
specimen surface, particularly visible in Fig. 7 b and c, are the result of local failure induced by the large shear strain in
the localization bands and their opening has then led to a broadening with respect to the initial shear bands thickness.
Examples of heavily sheared matrix can be seen in the top and the bottom right of Fig. 7 d, highlighted by the red circles,
where pixel wide shear bands are observed.
Fig. 7 d shows Atomic Force Microscopy (AFM) histograms of the Dejarguin–Muller–Toropov (DMT) modulus Derjaguin
et al. (1975) measured over a 0.5 μm
2 zone, obtained on a specimen of RTM6 before and after deforming the specimen up
to ε̄ = −0 . 5 in uniaxial compression. As described in Bahrami et al. (2015) , even in an undeformed epoxy resin, whose curing
degree is over 95%, AFM mapping reveals a heterogeneity in terms of modulus distribution, as shown in black in Fig. 7 d. The
width and shape of the distribution confirms that even before large deformation the mechanical landscape already includes
heterogeneities. Considering the relative smoothness of the distribution, these heterogeneities must be significantly smaller
than the side of the mapped surface (500 nm). More importantly, Fig. 7 d also shows that the DMT modulus distribution
significantly broadens after deforming the specimen up to ε̄ = −0 . 5 . The observed increase in heterogeneities within RTM6
after deformation is thus in good agreement with the STZ model predictions of Fig. 2 c, confirming our working hypothesis
that deformation micro-mechanisms in the glassy state are strongly heterogeneous and occur at a length scale well below
100 nm .
5. Conclusion
A model has been developed to describe and predict the viscoplastic behavior of epoxy resins, based on the framework
of STZ dynamics. The identification and validation of the model was performed based on a vast experimental campaign per-
4 4 4 J. Chevalier et al. / Journal of the Mechanics and Physics of Solids 121 (2018) 432–446
formed on the RTM6 epoxy resin. By explicitly describing the discrete elementary plastic events, the highly heterogeneous
nature of plastic flow in glassy polymers at the mesoscale can be captured, including the micro shear band nucleation and
propagation. The model relies on a Eyring-type equation for the rate of activation of the STZs, with a microstructural and
thermo-mechanical dependent activation energy. The main findings of this work can be summarized as follows:
• The yield stress is reached when STZ clusters reach a critical size and start interacting.
• The post-yield softening is the consequence of the propagation of these STZ clusters in the form of micro shear bands.
• Rehardening is attributed to the increasing difficulty to activate a STZ multiple times in the same direction, accounting
for the finite stretchability of a highly cross-linked polymer network.
• The temperature dependence of the activation volume is sufficient to capture the temperature dependent mechanical
response of RTM6.
• The non-linearity upon unloading and associated Bauschinger effect can be explained by the early STZ activations in the
opposite direction occurring at the early stages of unloading, due to the strong back stresses built in the material during
the loading phase.
• Forward and backward creep, and the rate-reversal phenomenon, are the result of the back stress-generated competition
between backward and forward activations kinetics of STZs.
The proposed approach offers an alternative to complex phenomenological constitutive models, reducing the number
of parameters from more than twenty to seven, while bridging the gap between atomistic and continuum mechanics ap-
proaches by providing the missing ingredients for seamless scale transition. Moreover, its mesoscale character enables the
modelling of the behavior of locally confined polymer under heterogeneous stress fields, such as bulk polymer subjected
to (nano-)indentation, or an epoxy matrix confined between carbon fibers in a composite material, where homogenization-
based approaches are not applicable. In this regard, effort s are currently devoted to an extension of the model to 3D. Finally,
the proposed model can be used to identify the numerous parameters of phenomenological constitutive models, which
remain unavoidable for the simulation of large components.
Acknowledgements
The financial support of the Fonds de la Recherche Scientifique de Belgique (FNRS) is acknowledged through the FNRS
doctoral fellowship of XPM and the FRIA doctoral fellowship of JC. XPM also acknowledges the financial support of the
Belgian American Educational Foundation (Cabeaux-Jacobs 2015). The authors would like to thank P.P. Camanho for fruitful
discussions during the course of this work. Computational resources have been provided by the supercomputing facilities
of the Université catholique de Louvain (CISM/UCL) and the Consortium des Equipements de Calcul Intensif en Fédération
Wallonie Bruxelles (CECI) funded bythe Fonds de la Recherche Scientifique de Belgique (FRS-FNRS).
Supplementary material
Supplementary material associated with this article can be found, in the online version, at doi: 10.1016/j.jmps.2018.08.014 .
References
Ames, N.M., Srivastava, V., Chester, S.a., Anand, L., 2009. A thermo-mechanically coupled theory for large deformations of amorphous polymers. part II:
applications. Int. J. Plast. 25 (8), 1495–1539. doi: 10.1016/j.ijplas.20 08.11.0 05 . Anand, L., Ames, N.M., Srivastava, V., Chester, S.a., 2009. A thermo-mechanically coupled theory for large deformations of amorphous polymers. part I:
formulation. Int. J. Plast. 25 (8), 1474–1494. doi: 10.1016/j.ijplas.20 08.11.0 04 . Anand, L. , Gurtin, M.E. , 2003. A theory of amorphous solids undergoing large deformations, with application to polymeric glasses. Int. J. Solids Struct. 40,
1465–1487 . Argon, A., Bessonov, M., 1977. Plastic deformation in polyimides, with new implications on the theory of plastic deformation of glassy polymers. Philos.
Mag. 35 (4), 917–933. doi: 10.1080/14786437708232634 .
Argon, A., Bulatov, V., Mott, P., Suter, U., 1995. Plastic deformation in glassy polymers by atomistic and mesoscopic simulations. J. Rheol. 39 (2), 377–399.doi: 10.1122/1.550728 .
Argon, A.S., 1973. A theory for the low-temperature plastic deformation of glassy polymers. Philos. Mag. 28 (4), 839–865. doi: 10.1080/14786437308220987 .Argon, A.S. , 1979. Plastic deformation in metallic glasses. Acta Metall. 27, 47–58 .
Argon, A.S., 2013. The physics of deformation and fracture of polymers. Cambridge University Press, Cambridge doi: 10.1017/CBO9781139033046 . Bahrami, A., Morelle, X., Hng Minh, L., Pardoen, T., Bailly, C., Nysten, B., 2015. Curing dependent spatial heterogeneity of mechanical response in epoxy
resins revealed by atomic force microscopy. Polymer 68, 1–10. doi: 10.1016/j.polymer.2015.04.084 .
Bergstrom, J., Boyce, M., 2001. Constitutive modeling of the time-dependent and cyclic loading of elastomers and application to soft biological tissues. Mech.Mater. 33 (9), 523–530. doi: 10.1016/S0167-6636(01)0 0 070-9 .
Bowden, P., Jukes, J., 1968. The plastic yield behaviour of polymethylmethacrylate. J. Mater. Sci. 3 (2), 183–190. doi: 10.10 07/BF0 0585487 . Bowden, P., Raha, S., 1974. A molecular model for yield and flow in amorphous glassy polymers making use of a dislocation analogue. Philos. Mag. 29 (1),
149–166. doi: 10.1080/14786437408213560 . Boyce, M.C., Parks, D.M., Argon, A.S., 1988. Large inelastic deformation of glassy polymers. part I: rate dependent constitutive model. Mech. Mater. 7 (1),
15–33. doi: 10.1016/0167-6636(88)90 0 03-8 .
Budrikis, Z., Castellanos, D.F., Sandfeld, S., Zaiser, M., Zapperi, S., 2017. Universal features of amorphous plasticity. Nat. Commun. 8 May, 1–10. doi: 10.1038/ncomms15928 .
Bulatov, V.V. , Argon, A.S. , 1994. A stochastic model for continuum elasto-plastic behavior : I . Numerical approach and strain localization. Model. Simul.Mater. Sci. Eng. 2, 167–184 .
Chen, K., Schweizer, K.S., 2011. Theory of yielding, strain softening, and steady plastic flow in polymer glasses under constant strain rate deformation.Macromolecules 44 (10), 3988–40 0 0. doi: 10.1021/ma20 0436w .
J. Chevalier et al. / Journal of the Mechanics and Physics of Solids 121 (2018) 432–446 445
Dawnkaski, E., Srivastava, D., Garrison, B., 1995. Time dependent monte carlo simulations of h reactions on the diamond 001(21) surface under chemicalvapor deposition conditions. J. Chem. Phys. 102 (23), 9401–9411. doi: 10.1063/1.468808 .
Derjaguin, B., Muller, V., Toporov, Y., 1975. Effect of contact deformations on the adhesion of particles. J. Colloid Interface Sci. 53 (2), 314–326. doi: 10.1016/0021-9797(75)90018-1 .
Ediger, M.D. , 20 0 0. Spatially heterogeneous dynamics in supercooled liquids. Annu. Rev. Phys. Chem. 51, 99–128 . Eshelby, J. , 1957. The determination of the elastic field of an ellipsoidal inclusion, and related problems. Proc. R. Soc. Part A 241 (1226), 376–396 .
Eyring, H., 1936. Viscosity, plasticity, and diffusion as examples of absolute reaction rates. J. Chem. Phys. 4 (4), 283–291. doi: 10.1063/1.1749836 .
Falk, M., Langer, J., Pechenik, L., 2004. Thermal effects in the shear-transformation-zone theory of amorphous plasticity: comparisons to metallic glass data.Phys. Rev. E - Stat. Nonlinear Soft Matter Phys. 70 (1 1), 011507–1–011507–11. doi: 10.1103/PhysRevE.70.011507 .
Falk, M.L., Langer, J.S., 1998. Dynamics of viscoplastic deformation in amorphous solids. Phys. Rev. E - Stat. Nonlinear Soft Matter Phys. 57 (6), 16. doi: 10.1103/PhysRevE.57.7192 .
Fiedler, B., Hojo, M., Ochiai, S., Schulte, K., Ando, M., 2001. Failure behavior of an epoxy matrix under different kinds of static loading. Compos. Sci. Technol.61 (11), 1615–1624. doi: 10.1016/S0266-3538(01)0 0 057-4 .
Gerlach, R., Siviour, C., Petrinic, N., Wiegand, J., 2008. Experimental characterisation and constitutive modelling of RTM-6 resin under impact loading.Polymer 49 (11), 2728–2737. doi: 10.1016/j.polymer.2008.04.018 .
G’Sell, C. , 1986. Plastic deformation of glassy polymers: constitutive equations and macromolecular mechanisms. In: Proceedings of the Seventh Interna-
tional Conference on the Strength of Metals and Alloys (ICSMA 7). Montreal, Canada, pp. 1943–1982 . Gudimetla, M., Doghri, I., 2017. A finite strain thermodynamically-based constitutive framework coupling viscoelasticity and viscoplasticity with application
to glassy polymers. Int. J. Plast. 98, 197–216. doi: 10.1016/j.ijplas.2017.08.001 . Harris, M.B., Watts, L.S., Homer, E.R., 2016. Competition between shear band nucleation and propagation across rate-dependent flow transitions in a model
metallic glass. Acta Mater. 111, 273–282. doi: 10.1016/j.actamat.2016.03.066 . Hasan, O.A. , Boyce, M.C. , 1995. A constitutive model for the nonlinear viscoelastic viscoplastic behavior of glassy polymers. Polymer Eng. Sci. 35 (4), 331 .
Hasan, O.A., Boyce, M.C., Li, X.S., Berko, S., 1993. An investigation of the yield and postyield behavior and corresponding structure of poly(methyl methacry-
late). J. Polym. Sci. Part B Polym. Phys. 31 (2), 185–197. doi: 10.1002/polb.1993.090310207 . Haward, R., Thackray, G., 1968. The use of a mathematical model to describe isothermal stress-strain curves in glassy thermoplastics. Proc. R. Soc. Lond. A:
Math. Phys. Eng. Sci. 302 (1471), 453–472. doi: 10.1098/rspa.1968.0029 . Homer, E.R., Schuh, C.A., 2009. Mesoscale modeling of amorphous metals by shear transformation zone dynamics. Acta Mater. 57 (9), 2823–2833. doi: 10.
1016/j.actamat.2009.02.035 . Hoy, R., Robbins, M., 2006. Strain hardening of polymer glasses: effect of entanglement density, temperature, and rate. J. Polymer Sci. Part B Polymer Phys.
44 (24), 3487–3500. doi: 10.1002/polb.21012 .
Hoy, R., Robbins, M., 2007. Strain hardening in polymer glasses: limitations of network models. Phys. Rev. Lett. 99 (11). doi: 10.1103/PhysRevLett.99.117801 . Hoy, R.S., Robbins, M.O., 2008. Strain hardening of polymer glasses: entanglements, energetics, and plasticity. Phys. Rev. E Stat. Nonlinear Soft Matter Phys.
77 (3), 1–14. doi: 10.1103/PhysRevE.77.031801 . 0709.0769 Ishikawa, M., Ogawa, H., Narisawa, I., 1981. Brittle fracture in glassy polymers. J. Macromol. Sci. Part B 19 (3), 421–443. doi: 10.1080/00222348108015312 .
Jatin, Sudarkodi, V., Basu, S., 2013. Investigations into the origins of plastic flow and strain hardening in amorphous glassy polymers. Int. J. Plast. 56,139–155. doi: 10.1016/j.ijplas.2013.11.007 .
Khan, F., 2006. Loading history effects on the creep and relaxation behavior of thermoplastics. J. Eng. Mater. Technol. Trans. ASME 128 (4), 564–571.
doi: 10.1115/1.2345448 . Kramer, E., 1974. The stress-strain curve of shear-banding polystyrene. J. Macromol. Sci. Part B 10 (1), 191–202. doi: 10.1080/00222347408219404 .
Langer, J., 2008. Shear-transformation-zone theory of plastic deformation near the glass transition. Phys. Rev. E Stat. Nonlinear Soft Matter Phys. 77 (2).doi: 10.1103/PhysRevE.77.021502 .
Li, L., Homer, E.R., Schuh, C.A., 2013. Shear transformation zone dynamics model for metallic glasses incorporating free volume as a state variable. ActaMater. 61 (9), 3347–3359. doi: 10.1016/j.actamat.2013.02.024 .
Malekmotiei, L., Samadi-Dooki, A., Voyiadjis, G.Z., 2015. Nanoindentation study of yielding and plasticity of poly(methyl methacrylate). Macromolecules 48
(15), 5348–5357. doi: 10.1021/acs.macromol.5b01064 . Mangion, M.B.M., Cavaillé, J.Y., Perez, J., 1992. Plastic mechanical response of amorphous polymers. Philos. Mag. A 66 (5), 773–796. doi: 10.1080/
01418619208201589 . Masurel, R., Gelineau, P., Cantournet, S., Dequidt, A., Long, D., Lequeux, F., Montes, H., 2017. Role of dynamical heterogeneities on the mechanical response
of confined polymer. Phys. Rev. Lett. 118 (4). doi: 10.1103/PhysRevLett.118.047801 . Masurel, R.J., Cantournet, S., Dequidt, A., Long, D.R., Montes, H., Lequeux, F., 2015. Role of dynamical heterogeneities on the viscoelastic spectrum of poly-
mers: a Stochastic continuum mechanics model. Macromolecules 48 (18), 6690–6702. doi: 10.1021/acs.macromol.5b01138 .
Meijer, H., Govaert, L., 2005. Mechanical performance of polymer systems: the relation between structure and properties. Prog. Polymer Sci. 30 (8–9),915–938. doi: 10.1016/j.progpolymsci.20 05.06.0 09 .
Morelle, X. , 2015. Mechanical characterization and physics-based modeling of a highly-crosslinked epoxy resin. Université catholique de Louvain Ph.D.dissertation .
Morelle, X., Chevalier, J., Bailly, C., Pardoen, T., Lani, F., 2017. Mechanical characterization and modeling of the deformation and failure of the highlycrosslinked rtm6 epoxy resin. Mech. Time Depend. Mater. 21 (3), 419–454. doi: 10.1007/s11043- 016- 9336- 6 .
Mott, P., Argon, A., Suter, U., 1993. Atomistic modelling of plastic deformation of glassy polymers. Philos. Mag. A Phys. Condens. Matter Struct. Defects Mech.Prop. 67 (4), 931–978. doi: 10.1080/01418619308213969 .
Narisawa, I., Murayama, T., Ogawa, H., 1982. Internal fracture of notched epoxy resins. Polymer 23 (2), 291–294. doi: 10.1016/0032- 3861(82)90319- 6 .
Nguyen, V.-D., Lani, F., Pardoen, T., Morelle, X., Noels, L., 2016. A large strain hyperelastic viscoelastic–viscoplastic-damage constitutive model based on amulti-mechanism non-local damage continuum for amorphous glassy polymers. Int. J. Solids Struct. 96, 192–216. doi: 10.1016/j.ijsolstr.2016.06.008 .
Oleynik, E., 1989. Plastic deformation and mobility in glassy polymers. Prog. Colloid Polymer Sci. 80, 140–150. doi: 10.1007/BFb0115425 . Poulain, X., Benzerga, A., Goldberg, R., 2014. Finite-strain elasto-viscoplastic behavior of an epoxy resin: experiments and modeling in the glassy regime.
Int. J. Plast. 62, 138–161. doi: 10.1016/j.ijplas.2014.07.002 . Poulain, X., Kohlman, L., Binienda, W., Roberts, G., Goldberg, R., Benzerga, A., 2013. Determination of the intrinsic behavior of polymers using digital image
correlation combined with video-monitored testing. Int. J. Solids Struct. 50 (11–12), 1869–1878. doi: 10.1016/j.ijsolstr.2013.01.041 .
Ree, T., Eyring, H., 1955. Theory of non-Newtonian flow. i. solid plastic system. J. Appl. Phys. 26 (7), 793–800. doi: 10.1063/1.1722098 . Robertson, R.E. , 1966. Theory for the plasticity of glassy polymers. J. Chem. Phys. 44 (10), 3950–3956 .
Rottler, J. , 2009. Fracture in glassy polymers : a molecular modelling perspective. J. Polym. Sci. Part B Polym. Phys. 1–19 . Samadi-Dooki, A., Malekmotiei, L., Voyiadjis, G., 2016. Characterizing shear transformation zones in polycarbonate using nanoindentation. Polymer 82, 238–
245. doi: 10.1016/j.polymer.2015.11.049 . Senden, D., Van Dommelen, J., Govaert, L., 2010. Strain hardening and its relation to Bauschinger effects in oriented polymers. J. Polymer Sci. Part B Polymer
Phys. 48 (13), 1483–1494. doi: 10.1002/polb.22056 .
Shi, Y., Falk, M., 2005. Strain localization and percolation of stable structure in amorphous solids. Phys. Rev. Lett. 95 (9). doi: 10.1103/PhysRevLett.95.095502 .Srivastava, V., Chester, S.a., Ames, N.M., Anand, L., 2010. A thermo-mechanically-coupled large-deformation theory for amorphous polymers in a temperature
range which spans their glass transition. Int. J. Plast. 26 (8), 1138–1182. doi: 10.1016/j.ijplas.2010.01.004 . Stachurski, Z. , 1997. Deformation mechanisms and yield strength in amorphous polymers. Prog. Polymer Sci. 22 (3), 407–474 .

446 J. Chevalier et al. / Journal of the Mechanics and Physics of Solids 121 (2018) 432–446
Sundararaghavan, V., Kumar, a., 2013. Molecular dynamics simulations of compressive yielding in cross-linked epoxies in the context of argon theory. Int. J.Plast. 47, 111–125. doi: 10.1016/j.ijplas.2013.01.004 .
Tervoort, T., Klompen, E.J., Govaert, L.E., 1996. A multi-mode approach to finite, three-dimensional, nonlinear viscoelastic behavior of polymer glasses. J.Rheol. 40 (5), 779. doi: 10.1122/1.550755 .
Van Melick, H., Govaert, L., Meijer, H., 2003. On the origin of strain hardening in glassy polymers. Polymer 44 (8), 2493–2502. doi: 10.1016/S0032-3861(03)00112-5 .
Voyiadjis, G., Malekmotiei, L., Samadi-Dooki, A., 2018. Indentation size effect in amorphous polymers based on shear transformation mediated plasticity.
Polymer 137, 72–81. doi: 10.1016/j.polymer.2018.01.006 . Voyiadjis, G.Z., Samadi-Dooki, A., 2016. Constitutive modeling of large inelastic deformation of amorphous polymers: free volume and shear transformation
zone dynamics. J. Appl. Phys. 119 (22). doi: 10.1063/1.4953355 . Wang, S.-q. , Cheng, S. , Lin, P. , Li, X. , 2014. A phenomenological molecular model for yielding and brittle-ductile transition of polymer glasses. J. Chem. Phys.
141, 1–19 . Wang, S.-Q., Wang, Y., Cheng, S., Li, X., Zhu, X., Sun, H., 2013. New experiments for improved theoretical description of nonlinear rheology of entangled
polymers. Macromolecules 46 (8), 3147–3159. doi: 10.1021/ma300398x . Wu, P., Van Der Giessen, E., 1993. On improved network models for rubber elasticity and their applications to orientation hardening in glassy polymers. J.
Mech. Phys. Solids 41 (3), 427–456. doi: 10.1016/0 022-5096(93)90 043-F .