u.s. dairy at a global crossroads
TRANSCRIPT

ww
w.er
s.usda.gov
Want to learn more about U.S. and international dairy markets? Visit our website at www.ers.usda.gov.
You can also find additional information about ERS publications, databases, and other products at our website.
Visit Our Website To Learn More!
National Agricultural LibraryCataloging Record:
The U.S. Department of Agriculture (USDA) prohibits discrimination in all its programs and activities on the basis of race, color, national origin, age, disability, and, where applicable, sex, marital status, familial status, parental status, religion, sexual orientation, genetic information, political beliefs, reprisal, or because all or a part of an individual's income is derived from any public assistance program. (Not all prohibited bases apply to all programs.) Persons with disabilities who require alternative means for communication of program information (Braille, large print, audiotape, etc.) should contact USDA's TARGET Center at (202) 720-2600 (voice and TDD).
To file a complaint of discrimination write to USDA, Director, Office of Civil Rights, 1400 Independence Avenue, S.W., Washington, D.C. 20250-9410 or call (800) 795-3272 (voice) or (202) 720-6382 (TDD). USDA is an equal opportunity provider and employer.
U.S. dairy at a global crossroads. (Economic research report (United States. Dept. of Agriculture. Economic Research Service) ; no.28)
1. Dairy products industry—United States. 2. International trade. 3. Competition—United States. 4. Agricultural price supports—United States. 5. Dairy products industry—United States—Foreign ownership. I. Blayney, Don P. II. United States. Dept. of Agriculture. Economic Research Service. III. Title.
HD9275.U62
Cover photo: Fred Gale

United StatesDepartmentof Agriculture
www.ers.usda.gov
A Report from the Economic Research Service
EconomicResearchReport Number 28 U.S. Dairy at a Global
Crossroads
Don Blayney, Mark Gehlhar, Chris Hilda Bolling,Keithly Jones, Suchada Langley, Mary AnneNormile, and Agapi Somwaru
November 2006
Abstract
Current dynamics in world dairy markets and the potential for global and domestic tradepolicy reform are bringing the U.S. dairy sector to a new crossroads as it faces competi-tive forces from outside its borders. Those forces—demand for new products byconsumers in industrialized countries, changes in technology, rapid economic growth inemerging developing countries, particularly in Asia, and the increasing role of multina-tional firms in domestic and global dairy markets—are leading to increased dairyconsumption, more opportunities for dairy product trade, and foreign direct investmentbenefiting both U.S. consumers and producers. As global demand for milk and newdairy products expands, the roles of policies that support prices are diminishing, whilethe roles of flexibility and innovation aimed at improving competitiveness are growing.
Keywords: International dairy markets, dairy trade, dairy policy, tariffs, productionquotas, foreign direct investment, cheese, butter, dry milk powders
Acknowledgments
Appreciation is extended to Neil Conklin, Mary Bohman, Barry Krissoff, and JanetPerry (USDA, ERS) for their support of the project and review comments. The authorsextend thanks for review comments to Andrew Novakovic (Cornell University), AllanRae (Massey University), Ronald Knutson (Texas A&M University), Alejandro Reca(Rabobank), Art Coffey (USDA, FAS), Milton Madison (USDA, FSA), and HowardMcDowell (USDA, AMS). Finally, special thanks are extended to John Weber andWynnice Pointer-Napper (USDA, ERS) for editorial and design assistance.

Special Acknowledgment
This report represents one of the last professional contributions of ChrisBolling, who passed away in April 2006. Chris was an agricultural econo-mist with USDA, ERS. She will be remembered by her colleagues at ERSand in the agricultural economics profession for her work in the area offoreign direct investment in agriculture, the Brazilian agriculture sector, andthe economics of the processed food sector.
iiU.S. Dairy at a Global Crossroads / ERR-28
Economic Research Service/USDA

Contents
Summary . . . . . . . . . . . . . . . . . . . . . . . . . . . . . . . . . . . . . . . . . . . . . . . . . . .iv
Introduction . . . . . . . . . . . . . . . . . . . . . . . . . . . . . . . . . . . . . . . . . . . . . . . . .1
Characteristics of Milk Products and Emerging Consumer Trends . . . . . . . . . . . . . . . . . . . . . . . . . . . . . . . . . . . . . . . . . .2Consumer Preferences and Differences in Per Capita Consumption . . . .2New Dairy Products and Targeting Consumer Segments . . . . . . . . . . . .5Technology-Driven Ingredients . . . . . . . . . . . . . . . . . . . . . . . . . . . . . . . .7
World Dairy Production and Trade Trends . . . . . . . . . . . . . . . . . . . . . . .9Major Trade Flows in Global Dairy . . . . . . . . . . . . . . . . . . . . . . . . . . . . .9Shifts in the Direction of Trade Driven by Growth in Demand . . . . . . .10
Globalization of the Dairy Industry: Firms,Foreign Direct Investment, and Partnerships . . . . . . . . . . . . . . . . . .12Attractiveness of U.S. Dairy Market . . . . . . . . . . . . . . . . . . . . . . . . . . .12New Zealand’s Involvement in U.S. Dairy
and Global Partnerships . . . . . . . . . . . . . . . . . . . . . . . . . . . . . . . . . . .13European Investment in U.S. Dairy . . . . . . . . . . . . . . . . . . . . . . . . . . . .15
The Interface Between Domestic Dairy Policies and Dairy Trade . . . .16Dairy-Trading Nations With Significant Domestic Support . . . . . . . . .16Dairy-Trading Nations With Little Domestic Support . . . . . . . . . . . . . .19
Dairy Policy Changes and the U.S. Dairy Sector . . . . . . . . . . . . . . . . . .20Dairy Policy and Modeling Issues . . . . . . . . . . . . . . . . . . . . . . . . . . . . .20Impacts From the PEATSim Model . . . . . . . . . . . . . . . . . . . . . . . . . . . .22Impacts From UWWDM . . . . . . . . . . . . . . . . . . . . . . . . . . . . . . . . . . . .22Why the Results Differ . . . . . . . . . . . . . . . . . . . . . . . . . . . . . . . . . . . . . .23
U.S. Dairy Competing in a New Decade . . . . . . . . . . . . . . . . . . . . . . . . .24
References . . . . . . . . . . . . . . . . . . . . . . . . . . . . . . . . . . . . . . . . . . . . . . . . . .25
Appendix A–World Production and Trade by Countryand Product . . . . . . . . . . . . . . . . . . . . . . . . . . . . . . . . . . . . . . . . . . . . .30
Appendix B–Model Descriptions . . . . . . . . . . . . . . . . . . . . . . . . . . . . . . .32
Appendix tables . . . . . . . . . . . . . . . . . . . . . . . . . . . . . . . . . . . . . . . . . . . . .36
iiiU.S. Dairy at a Global Crossroads / ERR-28
Economic Research Service/USDA
Summary
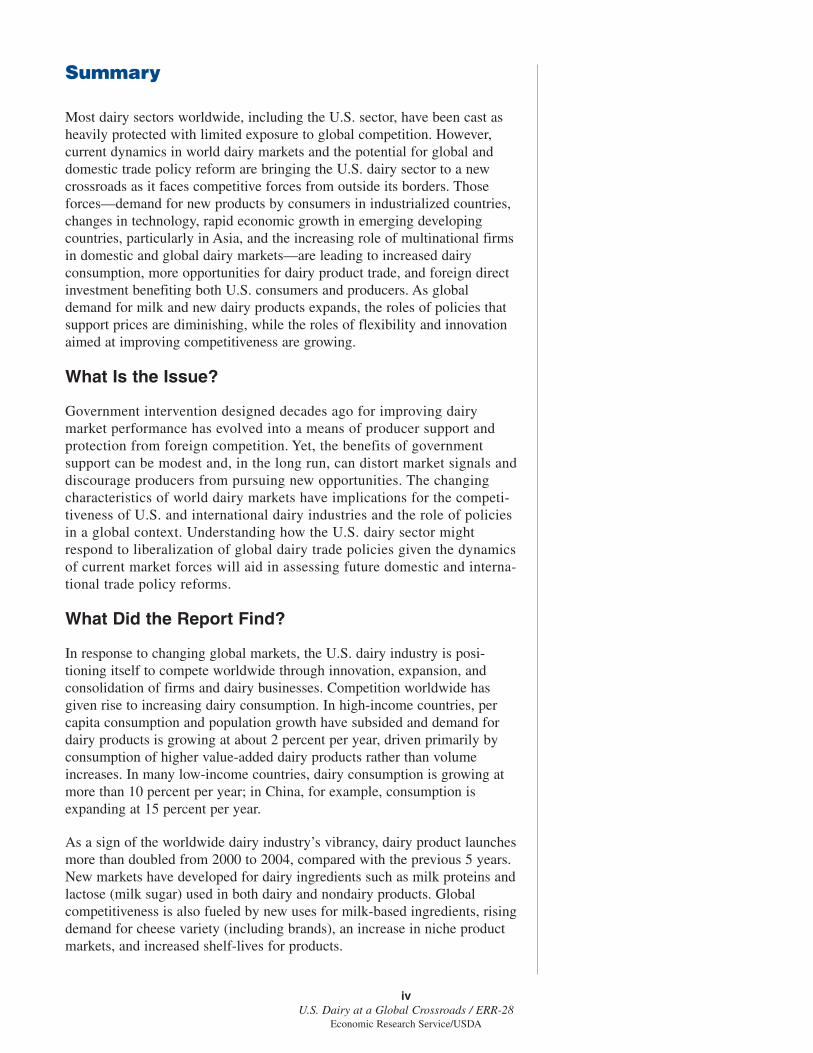
Most dairy sectors worldwide, including the U.S. sector, have been cast asheavily protected with limited exposure to global competition. However,current dynamics in world dairy markets and the potential for global anddomestic trade policy reform are bringing the U.S. dairy sector to a newcrossroads as it faces competitive forces from outside its borders. Thoseforces—demand for new products by consumers in industrialized countries,changes in technology, rapid economic growth in emerging developingcountries, particularly in Asia, and the increasing role of multinational firmsin domestic and global dairy markets—are leading to increased dairyconsumption, more opportunities for dairy product trade, and foreign directinvestment benefiting both U.S. consumers and producers. As globaldemand for milk and new dairy products expands, the roles of policies thatsupport prices are diminishing, while the roles of flexibility and innovationaimed at improving competitiveness are growing.
What Is the Issue?
Government intervention designed decades ago for improving dairymarket performance has evolved into a means of producer support andprotection from foreign competition. Yet, the benefits of governmentsupport can be modest and, in the long run, can distort market signals anddiscourage producers from pursuing new opportunities. The changingcharacteristics of world dairy markets have implications for the competi-tiveness of U.S. and international dairy industries and the role of policiesin a global context. Understanding how the U.S. dairy sector mightrespond to liberalization of global dairy trade policies given the dynamicsof current market forces will aid in assessing future domestic and interna-tional trade policy reforms.
What Did the Report Find?
In response to changing global markets, the U.S. dairy industry is posi-tioning itself to compete worldwide through innovation, expansion, andconsolidation of firms and dairy businesses. Competition worldwide hasgiven rise to increasing dairy consumption. In high-income countries, percapita consumption and population growth have subsided and demand fordairy products is growing at about 2 percent per year, driven primarily byconsumption of higher value-added dairy products rather than volumeincreases. In many low-income countries, dairy consumption is growing atmore than 10 percent per year; in China, for example, consumption isexpanding at 15 percent per year.
As a sign of the worldwide dairy industry’s vibrancy, dairy product launchesmore than doubled from 2000 to 2004, compared with the previous 5 years.New markets have developed for dairy ingredients such as milk proteins andlactose (milk sugar) used in both dairy and nondairy products. Globalcompetitiveness is also fueled by new uses for milk-based ingredients, risingdemand for cheese variety (including brands), an increase in niche productmarkets, and increased shelf-lives for products.
ivU.S. Dairy at a Global Crossroads / ERR-28
Economic Research Service/USDA

Globalization has tended to emphasize the strength of multinational dairyfirms. As international dairy companies recognize the prospects fordemand growth around the world, they are repositioning themselves toproduce and sell milk and milk products from multiple locations. Foreigninvestors find the United States, with its large domestic market, particu-larly attractive for this purpose. Foreign companies such as Nestlé,Unilever, Bongrain SA, and the Fonterra Co-op Group now have a signif-icant presence in the U.S. market.
The three dominant dairy trading areas today, as in the past, are the Euro-pean Union (EU), Australia, and New Zealand. Australia and New Zealand,both with low-cost milk production and industries actively involved in inter-national marketing, are prominent suppliers to the Asian markets for cheeseand dry milk powders. The EU focuses on nearby traditional markets andNorth America, mainly exporting premium cheese. Product differentiationand consumer preferences play major roles in shaping global dairy productdemand and trade flows. For example, all high-income countries import EUcheese. The largest dairy trade flow worldwide is cheese from the EU to theUnited States, even though milk production costs in the EU are higher thanin the United States.
Dairy policies still influence the flow of products globally. For individualcountries, providing an adequate supply of milk to satisfy domestic marketneeds is often the first priority. Thus, domestic dairy policies and programsare generally mechanisms to promote milk production, but in some casesthey promote surplus production above domestic needs. Those surpluses areavailable for export and, in some countries, such as in the EU, Canada, andthe United States, they have been subsidized. Additionally, almost all coun-tries have trade policies in place that impede dairy imports.
Based on two independent simulation models, global liberalization ofdairy policies would lead to increases in world market prices and thevalue of dairy product trade. For the United States, the effect wouldreduce dairy sector production by less than 2 percent. However, theseresults do not reflect recent globalization of the industry—new products,growing demand in emerging developing countries such as China andIndia, technological innovation, and the increasing role of multinationalfirms in domestic and global dairy markets. If the U.S. dairy sectorcontinues to make gains in efficiency as it has in recent years, particu-larly with an open trading system, U.S. dairy producers and manufac-turers could benefit from trade liberalization. Accordingly, U.S.consumers and producers would benefit from greater access to marketsand higher international prices accompanying trade liberalization.
How Was the Study Conducted?
The study was conducted in two parts. First, we performed a comprehensiveanalysis of changing global dairy markets. International data sources wereused to examine patterns in dairy consumption, production, trade, foreigndirect investments and evolving firm-level partnerships. Second, we usedtwo formal trade models to measure the impacts of hypothetical dairy tradeand domestic policy reforms. The first model, the Partial Equilibrium Agri-
vU.S. Dairy at a Global Crossroads / ERR-28
Economic Research Service/USDA

culture Trade Simulator, explicitly captures the effects of interactions withnondairy agricultural sectors. The second model, the University ofWisconsin World Dairy Model, characterizes milk and dairy products inconsiderable detail and incorporates detailed specifications of dairy tradeand domestic policies.
viU.S. Dairy at a Global Crossroads / ERR-28
Economic Research Service/USDA

In the early 1900s, dairy markets suffered from chronic imbalances inmilk supplies and demands and had limited means for fresh productstorage and long-distance transportation. This situation presented fewmarketing opportunities for dairy products beyond local sales of milk orbutter. The associated price fluctuations from supply and demand imbal-ances made it difficult for dairy farmers to gauge long-term demand andlink that growth to projected expansion. As a result, government inter-vention was deemed necessary because, left alone, dairy markets oftenfailed both farmers and consumers. Governments used various mecha-nisms to smooth out the imbalances, such as production quotas anddirect government purchases of surplus products. Today, advancementsin technology and supply chain management have helped resolve manyof the marketing issues that plagued the dairy industry in the past. Forexample, farm milk can now be transported hundreds of miles thenprocessed and packaged into a variety of fresh or storable products thatcan be shipped to overseas markets.
Over the decades, government intervention historically designed forimproving domestic market performance has evolved into producer supportand protection from foreign competition. Yet, the benefits of governmentsupport can be modest and, in the long run, can distort market signals anddiscourage producers from pursuing new opportunities. An earlier study byUSDA’s Economic Research Service (ERS) found that the measurable effectof U.S. dairy programs on producer returns over the past 20 years increasedthe farm price by only 1 percent and had a limited impact on the financialviability of dairy farms. That study focused primarily on U.S. producers andon domestic policy. This study addresses the economic dynamics of globaldairy markets, the effects of international dairy policies, and the implica-tions for the competitiveness of U.S. and international dairy industry.Understanding how the U.S. dairy sector is changing in response to globalmarket forces will help assess future U.S. domestic and international tradepolicy reform.
1U.S. Dairy at a Global Crossroads / ERR-28
Economic Research Service/USDA
U.S. Dairy at a GlobalCrossroads
Don Blayney, Mark Gehlhar, Chris Hilda Bolling,Keithly Jones, Suchada Langley, Mary
Anne Normile, and Agapi Somwaru
Introduction

Characteristics of Milk Products andEmerging Consumer Trends
International dairy commerce cannot be viewed as a global commoditymarket, such as that for oil or steel, where a country’s supply of thecommodity can satisfy demands anywhere in the world. Instead, the globaldairy market comprises many interrelated dairy product markets that vary ingeographic scope from narrow to global depending on the product. As themanagement focus of the dairy industry becomes more global, with nationaland multinational companies competing in nearly every region, manyproduct markets are also becoming more global. Still, consumers of milkand dairy products across regions exhibit widely varying preferences fortaste, convenience, nutrition, wholesomeness, and packaging.
Dairy products range from fairly standardized goods, such as milk, butter,and nonfat dry milk powder, to multivariety, multiflavored products, such asspecialty cheeses, fermented drinks, and milk protein fractions used in foodand beverage items. Some dairy product markets are local or national, whileothers are global (table 1). Products such as fresh milk, yogurt, and cheeseare intended for direct consumption. Dairy products are also consumed indi-rectly as ingredients in other foods, such as pizza, snack bars, and bakeryproducts. Nonfood uses range from nutriceuticals to industrial applications.
Consumer Preferences and Differences inPer Capita Consumption
Variations in consumer demand for milk-based products around the globedifferentiate localized markets when products are not traded globally orregionally. Variations in consumer preferences reflect economic status, culi-nary practices, and eating habits of different households. Income levels andthe availability and cost of milk are key factors behind differences in dairyproduct consumption throughout the world (fig. 1). For example, high trans-portation costs and local preferences limit the international market forfermented milk drinks and yogurts.
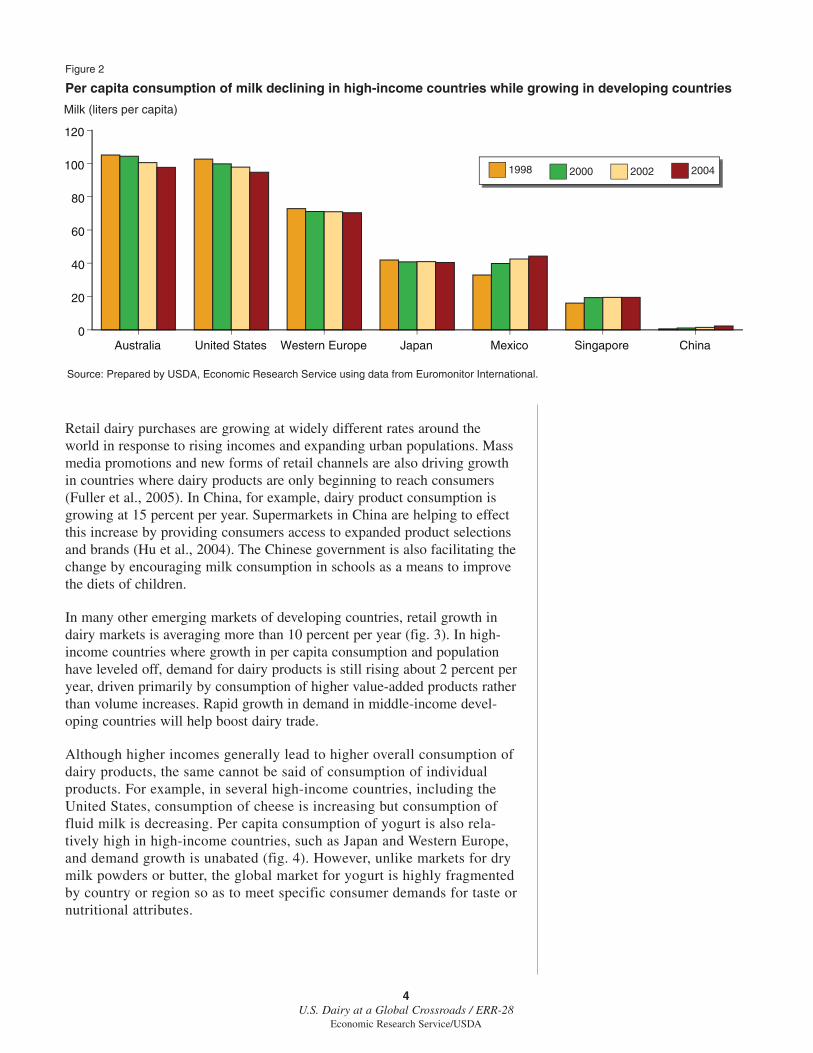
Per capita consumption of fluid milk is growing rapidly in many middle-income countries, particularly in Latin America. Per capita milk consump-tion in Mexico now exceeds that in Japan (fig. 2), but consumption of dairyproducts in Latin America remains less than half of that in the United Statesand Western European countries. Dairy products in general, including drymilk powders, remain luxury goods for many consumers in low- and somemiddle-income countries.
Major differences in consumption patterns for dairy products can exist evenwithin a country or region for a variety of reasons, including ethnic andcultural factors. This is particularly true in Europe where, for example,Finland has a noticeably higher proportion of per capita liquid milk consump-tion to per capita cheese consumption. France and Greece have a higherproportion of consumption of soft-type cheeses than the rest of the EU.Although it has grown steadily over the last three decades, per capitaconsumption of cheese in the United States remains lower than that in the EU.
2U.S. Dairy at a Global Crossroads / ERR-28
Economic Research Service/USDA

3U.S. Dairy at a Global Crossroads / ERR-28
Economic Research Service/USDA
Table 1
Dairy products and their characteristics
General category Specific products Geographic market Consumption/primary use Quality attributes
Fluid milk Fresh whole milk Local or national Direct consumption FreshnessUHT milk (rarely traded) Shelf stability
Regional
Fresh milk products Cultured milk National or regional Direct consumption FreshnessYogurt
Ice cream Artisanal / bulk National or regional Flavor/texture
Milk powders Whole milk powders Global (heavily traded) Direct consumption Reconstituted milk flavorNonfat dry milk Food or feed ingredient Shelf stability
Butter fats Cream National or regional Direct consumption Shelf stability(small trade) or ingredient Freshness
Butter Global (heavily traded)Butter oil
National or regional Direct consumption
Nonfat component Milk protein concentrates Global Food ingredient FunctionalityWhey proteins
Lactose Pharmaceutical useCasein
Cheese Fresh cheese National or regional Direct consumption FreshnessProcessed cheese (traded among Shelf stability
Natural aged cheese high-income countries) Flavor/aroma/texture
Source: USDA, Economic Research Service.
Figure 1
Per capita consumption of liquid milk and cheese
Cheese (kg per capita)
Source: Prepared by USDA, Economic Research Service using data from International Dairy Federation.
0
20
40
60
80
100
120
140
160
180
0 5 10 15 20 25 30
Liquid milk (kg per capita)
Finland
United States
Poland
South Africa
China
Argentina
United KingdomEuropean Union
Greece
France
Lithuania
Australia
Mexico
Retail dairy purchases are growing at widely different rates around theworld in response to rising incomes and expanding urban populations. Massmedia promotions and new forms of retail channels are also driving growthin countries where dairy products are only beginning to reach consumers(Fuller et al., 2005). In China, for example, dairy product consumption isgrowing at 15 percent per year. Supermarkets in China are helping to effectthis increase by providing consumers access to expanded product selectionsand brands (Hu et al., 2004). The Chinese government is also facilitating thechange by encouraging milk consumption in schools as a means to improvethe diets of children.
In many other emerging markets of developing countries, retail growth indairy markets is averaging more than 10 percent per year (fig. 3). In high-income countries where growth in per capita consumption and populationhave leveled off, demand for dairy products is still rising about 2 percent peryear, driven primarily by consumption of higher value-added products ratherthan volume increases. Rapid growth in demand in middle-income devel-oping countries will help boost dairy trade.
Although higher incomes generally lead to higher overall consumption ofdairy products, the same cannot be said of consumption of individualproducts. For example, in several high-income countries, including theUnited States, consumption of cheese is increasing but consumption offluid milk is decreasing. Per capita consumption of yogurt is also rela-tively high in high-income countries, such as Japan and Western Europe,and demand growth is unabated (fig. 4). However, unlike markets for drymilk powders or butter, the global market for yogurt is highly fragmentedby country or region so as to meet specific consumer demands for taste ornutritional attributes.
4U.S. Dairy at a Global Crossroads / ERR-28
Economic Research Service/USDA
Figure 2
Per capita consumption of milk declining in high-income countries while growing in developing countries
Source: Prepared by USDA, Economic Research Service using data from Euromonitor International.
Milk (liters per capita)
Australia United States Western Europe Japan Mexico Singapore China0
20
40
60
80
100
120
1998 200420022000

New Dairy Products and TargetingConsumer Segments
Protected industries are generally thought to have less incentive to invest inproduct innovation and technologies. Dairy industries, despite the protectionof trade barriers, do not fit that mold as evidenced by the number of newproduct launches. To remain competitive, firms in the dairy industry mustconstantly entice and retain new consumers as food preferences change.Rising demand for nondairy substitutes—products made from grains, soy,rice, nuts, and oils and fats that can be seen as substitutes for dairy-based
5U.S. Dairy at a Global Crossroads / ERR-28
Economic Research Service/USDA
Figure 3
Average annual retail growth in dairy products, 1998-2004
Annual percent growth
Source: Prepared by USDA, Economic Research Service using data from Euromonitor International.
Western Europe
North America
Thailand
Africa and Middle East
Eastern Europe
Latin America
Philippines
Indonesia
China
0 2 4 6 8 10 12 14 16
Figure 4
Per capita consumption of yogurt is rising faster in high-income regions
Source: Prepared by USDA, Economic Research Service using data from Euromonitor International.
Kg per capita
WesternEurope
Japan United States Latin America Africa andMiddle East
0
2
4
6
8
10
12
14
16
1998 200420022000

products—is one force sparking the drive to retain market share. New dairyproducts worldwide more than doubled in number between 1995-99 and2000-04 (fig. 5).
Dairy product marketing by multinational firms, such as Nestlé (Switzer-land), Arla Foods (Denmark-Sweden), Danone (France), Lactalis (France),Unilever (Netherlands-U.K.), and Kraft Foods (U.S.), increasingly acknowl-edges regional preferences and demographic factors to reach specificconsumers. For example, Nestlé launched a yogurt in Germany for babies,while Kraft launched the Manchego type of processed cheese in the UnitedStates to attract Hispanic consumers (app. table 1).
Foreign direct investment (FDI) in domestic dairy industries providesconsumers with access to goods produced by global firms. FDI in the U.S.market includes Nestlé’s and Unilever’s stakes in the ice cream industry,French involvement in the yogurt and cheese markets, and other Europeanbrands, such as Président cheese made in Wisconsin and California.Fonterra Co-op Group (Fonterra), a New Zealand dairy firm, exports U.S.milk powders worldwide. Fonterra partners with other dairy companies inAustralia, South America, and South Africa, enabling it to meet dairydemand in those countries with local milk supplies.
Marketing strategies for dairy products also emphasize the functionality ofcertain products to attract consumers. Milk for drinking is becoming adifferentiated product tailored to specific consumer tastes and preferences.Innovative manufacturers are capitalizing on the growing consumer aware-ness of the role that specific components of dairy foods play in humanvitality. This strategy has led firms to introduce such products as probioticmilks, yogurts, and fermented dairy drinks having health benefits derivingfrom “good” bacteria. Firms are also launching multiflavored milk drinks asa way to attract new consumers, especially young people.
6U.S. Dairy at a Global Crossroads / ERR-28
Economic Research Service/USDA
Figure 5
New dairy product introductions increasing at faster pace than all new food products
Source: Prepared by USDA, Economic Research Service using data from Datamonitor Productscan.
Percent
1990-94 1995-99 2000-0410.5
11.0
11.5
12.0
12.5
13.0
0
1
2
3
4
5
6
7
8
New dairy products (right axis)
Share of new dairy products among all new food product (left axis)
Number (thousands)

Technology-Driven Ingredients
The growing awareness of the many roles of specific milk components ishelping to boost demand for those components as ingredients. The dairyindustry is developing technologies to economically and efficiently extractand process these components of milk. Within the dairy ingredientcomplex—which includes fat, sugar (lactose), and proteins—proteins are thetargets of much of the research and development (see box “Milk Proteins:Economic Significance and Uses”). The growth in new markets for milkproteins exemplifies the transformation of milk from a commodity to avalue-added product tailored to meet specific consumer requirements.
Milk proteins are a major part of functional food product formulations, andtheir use is expected to grow (Gloy, 2004). The outlook for milk proteinmarkets is promising given current demand trends among both food proces-sors and consumers for protein ingredient specificity. For processors andmanufacturers, the confirmed functionality of ingredients, not perceived orintangible values, determines market values. Dairy-based ingredients havethe potential to evolve into truly global products traded in a world market,and pricing is likely to become highly competitive as this market matures.
7U.S. Dairy at a Global Crossroads / ERR-28
Economic Research Service/USDA
The rapid rise in the milk proteins market is the result of growth in demandfrom food processors. Processors require specialized ingredients for processedcheese, yogurt, bakery products, and nutritional foods, such as high-proteinsports drinks and energy bars. In the United States, imports of milk proteinconcentrates (MPC) have been encouraged in part by the higher price ofnonfat dry milk (NFDM), which is supported by the domestic price supportprogram. The U.S. International Trade Commission (ITC) found that thehigher support price for NFDM contributed to a higher return to NFDM thanto MPC. The ITC concluded that the current U.S. milk price support programcreated a disincentive to manufacture MPC in the United States.
Milk proteins were not considered a significant trade issue during the GeneralAgreement on Tariffs and Trade in the 1990s because the product was notcommercially viable in international markets. Since the mid-1960s, almost allcasein or MPC-related products supplied to manufacturers in the United Stateshave been imported. U.S. and Canadian milk producers are increasinglyconcerned about this trend, since MPC trade appears to circumvent WTOagreements (Bailey, 2003). MPCs may eventually threaten dairy supportprograms and lead to lower producer prices.
Although detailed data are limited, trade in whey products (dry whey, modifiedwhey products, and whey protein concentrate) shows substantial growth. Thesebyproducts of cheese production can offer almost all of the nutrition of skimmilk powder at a very low price. The emergence of this market has causedprices of whey protein concentrate to become a floor for international prices ofskim milk powder. Importers can readily shift from whey products to skimmilk powder as the price falls.
Milk Proteins: Economic Significance and Uses
Continued on page 8

8U.S. Dairy at a Global Crossroads / ERR-28
Economic Research Service/USDA
What Are Milk Proteins?
Milk proteins consist of a casein-type protein (fat soluble) and a whey protein(water soluble), a byproduct of cheesemaking. In the United States, commer-cial production of milk proteins has been almost entirely of whey proteinsbecause the casein-type protein is fully used in the production of naturalcheese. Within these two broad types, bovine milk contains 10 different milkproteins types differentiated by their unique amino acid profiles, each havingdifferent commercial applications and functional attributes but all being ofgenerally high food quality.
How Are Milk Proteins Manufactured?
Milk proteins are manufactured using ultra-filtration, a membrane separationtechnology that removes water, some lactose, and minerals from milk.Repeated passes through an ultra-filtration membrane alter the milk solidscomposition, increasing the protein percentage and reducing the percentage oflactose and other solids in the final product. MPC with protein content lessthan 70 percent is commonly used in frozen deserts, bakery, and confectioneryproducts. Lower protein MPC is also the form most commonly used in stan-dardizing cheese milk. The most common use of MPC with protein 70 percentor greater is in sports and nutrition drinks. These higher protein forms of MPCare not typically used in cheesemaking because of the higher cost. NFDM canbe used instead of MPC in most applications, but its suitability varies acrossproducts. NFDM, which contains lactose as well as milk proteins, does notsubstitute well in products where a more concentrated milk protein is required.MPC can be easily formulated to meet specific product requirements in therapidly growing sports/nutritional beverage and food market. Use of nonfat drymilk in these applications would require modification to elevate proteincontent and lower lactose content, likely through reconstitution and ultrafiltra-tion of NFDM.
How Are They Regulated?
Regulations on the use of MPC vary by country. In the United States, MPCmay not be used for cheeses with the U.S. Food and Drug Administration(FDA) standard of identity. However, some dairy manufactures have madechanges to accommodate MPC use in nonstandardized cheeses. Kraft FoodsInc. changed the product description on its American Singles from “Pasteur-ized Process Cheese Food,” which has the FDA standard of identity, to“Pasteurized Prepared Cheese Product,” which does not. MPC is listed as aningredient in Kraft American Singles. Dannon is now using MPC as a substi-tute in its low-calorie yogurts.
Of the whey protein types, lactoferrin has the widest range of bioactive propertiesand is used in health supplements and nutrition formulation, and as an antimicro-bial agent used to inhibit against foodborne pathogens. In 2003, FDA and USDAapproved the use of lactoferrin as a meat preservative.
Continued from page 7

World Dairy Production and Trade Trends
The share of global milk production entering world trade is low, at 7 percent,compared with shares of other farm commodities, such as wheat, coffee,soybeans, or bananas at 30 to 40 percent. Improved refrigeration and trans-portation technologies have made dairy trade more practicable than in earlieryears, though high costs are still a constraint. Almost every country producesmilk for local consumption, but production costs vary substantially due to suchfactors as labor costs, animal genetics, onfarm technology, and the availabilityof forages and water for livestock. Countries with a dairy surplus tend to bethose with relatively abundant, low-cost milk inputs for milk production andcomparatively small populations, such as New Zealand, the lowest cost majorproducer of milk in the world (fig. 6). Japan, Norway, and Switzerland arehigh-cost milk-producing countries largely due to their lack of land forgrowing dairy feeds. Poland, with an abundance of forage lands and lowwages, provides the most ideal conditions for milk production among all Euro-pean countries. Canada and the EU lie between the two cost extremes, as doesthe United States, where the changing structure of the dairy industry may leadto even lower average production costs.
Major Trade Flows in Global Dairy
Dairy-exporting countries are few relative to the number of dairy-importingcountries (fig. 7). The three dominant dairy-supplying areas today, as in thepast, are the EU, Australia, and New Zealand. Australia and New Zealand,both with low-cost milk production and industries actively involved in inter-national marketing, are prominent suppliers to the Asian markets for cheeseand dry milk powders. The EU focuses on nearby traditional markets andtrans-Atlantic trade with North America, mainly for cheese.
9U.S. Dairy at a Global Crossroads / ERR-28
Economic Research Service/USDA
Figure 6
Producer cost estimates of milk production at farm level, 2003
Source: Prepared by USDA, Economic Research Service using data from International Dairy Federation.
$U.S. / 100 kg
NewZealand
Poland India UnitedStates
EuropeanUnion
Canada Norway Switzerland Japan0
10
20
30
40
50
60
70

One would expect traded dairy products to flow from low-cost productionregions to higher cost regions. However, product differentiation and consumerpreferences play major roles in shaping dairy product demand and trade flows.All high-income countries, including major dairy producers like New Zealand,import EU cheese. The largest dairy trade flow worldwide is cheese from theEU to the United States, even though milk production costs in the EU arehigher than in the United States. Consumer preferences for differentiated prod-ucts provide suppliers incentives to make such generally higher priced productsavailable even in markets where lower cost alternatives exist.
Shifts in the Direction of Trade Driven byGrowth in Demand
Although international trade in dairy products has been viewed as a secondarymarket to dispose of surplus commodities, this impression is changing. Thegrowth and direction of global dairy trade depend more on the gaps betweendomestic milk production and dairy product demand in particular countries andthe rate at which that gap is growing. Rapid growth in milk-deficit countries isforcing exporting countries to reassess international market opportunities.
Whey products and milk protein concentrates are widely traded, but becausethey are relatively newer markets, the quantities traded are not as large asthose of other dairy products. Dry milk powders are high in demand, partic-ularly in tropical countries, for both commercial and home reconstitutioninto beverage milks—important products for feeding children. At one time,
10U.S. Dairy at a Global Crossroads / ERR-28
Economic Research Service/USDA
RussiaCanada
ChinaUnited States
Algeria Saudi Arabia Mexico
Egypt
Nigeria
Thailand
Belarus
Japan
Taiwan
New Zealand
Cheese
Cheese and butter
All
Powder milk and cheese
Powder milk
Predominant product
Arrow width = Value in million $US$750
$100Range
EuropeanUnion
Indonesia
Malaysia
Philippines
Australia
UnitedArabEmirates
Figure 7
Major global trade flows of dairy products in 2004
Source: Prepared by USDA, Economic Research Service using data from United Nations COMTRADE.

large centralized plants undertook commercial reconstitution using skimmilk powder alone, recombined with anhydrous milkfat, or combined withvegetable oil. Increasingly, commercial reconstitution has been decentral-ized and adapted to use whole milk powder. This shift was facilitated bywhole milk powder’s greater flexibility for reconstitution, less costly pack-aging that maintains acceptable flavor, and the lack of any price premiumbetween nonfat and whole milk powders.
The growing demand for milk in developing countries has affected tradepatterns. For example, in 1980, the EU was the single largest importer ofNew Zealand dairy products, accounting for 30 percent of the country’sexports; by 2004, that share had declined to 8 percent. Over the period,exports to the EU remained nearly unchanged, while exports to China andother developing countries spiked (fig. 8). In many of the countries trig-gering New Zealand’s shift in dairy trade, the storyline is the same: demandfor milk is outstripping the capacity of producers and processors to manu-facture and transport finished products to fast-growing urban populations
In some countries, per capita consumption of milk is rising but is stillextremely low, compared with the rest of the world. In China, milk productionhas risen but not at a rate sufficient to meet demand where it is needed themost. The lack of coordination between milk producers and dairy processors inChina remains a problem. As in other dairy-resource-scarce countries, themismatch between domestic supplies and demand fuels increases in imports.
In the previous two decades, the EU was the dominant supplier of dairy prod-ucts worldwide. Quotas and environmental restrictions, however, have limitedthe EU’s dairy production; moreover, its dairy manufacturing sector has tendedto focus on specialty cheeses exported and sold at premium prices. Australiaand New Zealand now control a growing share of world trade in dairy prod-ucts. This transformation in the ranks of top suppliers has also affected globaltrade flows.
11U.S. Dairy at a Global Crossroads / ERR-28
Economic Research Service/USDA
Figure 8
Developing countries driving exports of New Zealand dairy products
Source: Prepared by USDA, Economic Research Service using data from Statistics New Zealand.
U.S. dollars (billions)
1980 1985 1990 1995 2000 20050
0.5
1.0
1.5
2.0
2.5
3.0
3.5
4.0Other developing countries
EU
Japan
United States
Asian newly industrialized countries
Latin America
China and Southeast Asia

Globalization of the Dairy Industry: Firms, Foreign Direct Investment,
and Partnerships
A major challenge for participants in global dairy markets is responding tochanging local market conditions while competing for reliable supplies ofraw milk, dairy products, and, increasingly, dairy-based ingredients. Forexample, coordinating the supply of fluid milk and whole milk powders forfast-growing retail markets in China and Brazil requires considerablemanagement expertise, technology, and financial resources. Global linkagesamong dairy markets are formed not only by trade flows but also by theformation of management and financial linkages by dairy companies acrossregions. Multinational dairy companies are playing a growing role, with FDIand international partnerships linking milk producers and consumers incountries around the world.
Strategies are evolving that change the nature of competitiveness in dairymarkets. Strategic alliances, foreign partnerships, and FDI give companiesflexibility in specific regional markets. A major benefit of having interna-tional operations is reduced revenue risk from regional economic fluctua-tions and product price volatility. Multinationals also benefit from the abilityto achieve economies of scale in terms of production, distribution, andmarketing. At the same time, multinational firms must be flexible inadapting brands to suit local tastes and crafting sensible strategic alliancescombined with effective local market research.
Attractiveness of U.S. Dairy Market
Three characteristics of the U.S. dairy industry attract foreign investment,alliances, and partnerships: (1) the sheer size of the market and thedynamism of U.S. consumer demand; (2) the absence of supply controls forraw milk production; and (3) liberal foreign investment policies in theUnited States, compared with other high-income markets.
The U.S. consumer market for dairy products is one of the strongest in theworld, with high per capita income, freezers and refrigerators in mosthouseholds, and a broad range of cultures that enjoy a variety of dairy prod-ucts. The absence of production quotas also attracts investments in the U.S.dairy sector. At the same time, the long-term competitiveness of the U.S.dairy industry may be enhanced by investments from abroad—investmentsthat have been steadily growing over the past two decades. In 2000, largeforeign-owned proprietary firms had U.S. sales of $6.4 billion, accountingfor about 3 percent of U.S. dairy sales. By 2003, the stock of foreign directinvestment to the U.S. dairy industry amounted to $2 billion. Foreigncompanies now own $4.6 billion of assets in the U.S. dairy industry. Foreignfirms have a significant presence in various “less-tradable” product markets,such as ice cream (Unilever), and yogurt (Danone and Sodiaal).
Some of the most prominent global dairy manufacturers include Nestlé(Switzerland), Kraft Foods (U.S.), Dean Foods (U.S.), Groupe Danone(France), Parmalat (Italy), Sodiaal and Bongrain SA (both France), and
12U.S. Dairy at a Global Crossroads / ERR-28
Economic Research Service/USDA

Fonterra (New Zealand) (table 2). Each firm, regardless of its presence inparticular countries or markets, possesses a different level of expertise inconsumer marketing and branded products, research and development, milkprocessing and dairy product manufacturing, international trade, and milkproduction and distribution. Because they differ in specialization and loca-tions, these firms can mutually benefit from partnering.
New Zealand’s Involvement in U.S. Dairy and Global Partnerships
New Zealand is a formidable competitor in global dairy markets. Fonterra,its leading dairy firm and the world’s largest dairy product exporter withsales in 140 countries, has strengthened itself by forming a global networkof partnerships (fig. 9). A primary rationale for such partnerships is todevelop stable and secure supplies of milk, dairy products, and dairy-basedingredients using suppliers in other countries. Manufacturers wishing to usedairy ingredients to develop new products are likely to remain loyal to asupplier when they know customized ingredients are stable and readilyavailable, regardless of where they, the customer, are located.
In the United States, Fonterra entered into a 50/50 limited partnership,called DairiConcepts, with Dairy Farmers of America (DFA), the largestU.S. producer-owned dairy cooperative, to provide products, including milkprotein concentrates. DFA members expect this relationship to ultimatelylead to increased demand for their milk. In addition, Fonterra has an agree-ment with Dairy America to be the major exporter of its nonfat dry milk andreceives a commission on sales of the product. Dairy America is an associa-tion of seven U.S. producer-owned dairy cooperatives that markets 100percent of the milk powder produced by the member cooperatives: DairyFarmers of America, California Dairies, Land O’ Lakes, AgriMark, UnitedDairymen of Arizona, O-At-KA Milk producers, and Maryland and VirginiaMilk Producers. Dairy America’s arrangement with Fonterra combines
13U.S. Dairy at a Global Crossroads / ERR-28
Economic Research Service/USDA
Table 2
Global dairy market leaders, 2004
Company Country Sales Geographic presence
U.S. dollars (billions)
Nestlé Switzerland 17.5 GlobalDean Foods United States 7.6 U.S.Danone (Dannon) France 7.4 GlobalDairy Farmers of America United States 7.3 U.S.Fonterra New Zealand 7.3 GlobalArla Foods Denmark/Sweden 6.7 Europe/Middle EastLactalis France 6.5 Europe/North America/Middle EastUnilever Netherlands/United Kingdom 6.2 GlobalKraft Foods United States 5.5 GlobalParmalat Italy 5.3 GlobalRoyal Friesland Foods Netherlands 5.3 Europe/Asia/Latin AmericaBongrain France 4.8 GlobalMeiji Dairies Japan 4.2 East AsiaCampina Netherlands 4.1 Europe, East Asia, South AmericaMorinaga Milk Japan 4.0 East Asia
Source: Prepared by USDA, Economic Research Service using data from Euromonitor International.

Fonterra’s marketing services and a stable supply of U.S. nonfat dry milk,which benefits milk producers in both New Zealand and the United States.Similarly, Fonterra signed an agreement in 2004 with Argentina’s largestdairy cooperative, SanCor, to export milk powders and cheese.
Although New Zealand historically accounts for a significant share of nonfatdry milk in world trade, Fonterra is increasingly emphasizing productionand exports of whole milk powders to improve overall returns to NewZealand milk producers. By entering into agreements in other dairy-producing countries, Fonterra can effectively coordinate shipments of nonfatdry milk to international markets, potentially lessening price volatility andimproving returns to New Zealand milk producers, actions that would bemore difficult without such partnerships. In recent years when New Zealandhad shortfalls in milk production, Fonterra has been able to tap the U.S.market for nonfat dry milk to supply many East Asian markets.
14U.S. Dairy at a Global Crossroads / ERR-28
Economic Research Service/USDA
Figure 9
Global networks arising from partnerships among major dairy companies
Europe, Africa, and Asia North and South America
Dairy Farmers of AmericaArla Foods
Britannia Industries
Clover Industries
Nestlé
Largest European dairy cooperative (Scandinavian based)
Largest multinational supplying brands and distribution expertise
Largest South African dairy company
Leading dairy company in India affiliated with Danone (French based)
Joint venture—marketing distribution of branded products
Joint venture—marketing bulk ingredients in sub-Saharan Africa
Joint venture to market dairy products in India
World’s largest dairy exporting company
(New Zealand based)
Alliance with seven U.S dairy cooperatives
Largest U.S. dairy cooperative
Argentina’s largest dairy cooperative
Joint venture—first U.S. commercial operation for milk protein concentrates
Fonterra exports cheese and powders from Argentina
Federated marketing company—Fonterra exports U.S. nonfat dry milk
Joint venture—sourcing fresh milk from South America with ingredients from New Zealand
Arla Foods Fonterra
Britannia/Fonterra
Clover Fonterra Ingredients
DairiConcepts
Dairy Partners Americas
SanCor/Fonterra
Dairy America
SanCor
Fonterra
Source: Prepared by USDA, Economic Research Service.

Expansion to new markets is a principal motivation behind many ofFonterra’s recent alliances and partnerships. Fonterra established a jointventure with Britannia Industries to gain further access to the emergingdairy market in India. This joint venture combines Fonterra’s productionexpertise and marketing acumen with Britannia’s knowledge of the regionand distribution network. In addition to forming alliances with small localcompanies, Fonterra and other large firms target international expansionthrough large-scale strategic alliances between multinational partners. Inmany cases, large firms in partnerships benefit mutually through symbioticadvantages stemming from each other’s inherent capabilities and specializa-tion. Those relationships, however, are country or market specific; that is,firms that enter partnerships in one market can, at the same time, be rivalselsewhere. For example, Fonterra and Nestlé, rivals in other markets,formally established a 50/50 alliance—Dairy Partners Americas—to estab-lish joint dairy ventures in Latin American markets, initially includingArgentina, Brazil, Paraguay, Uruguay, and Venezuela. The joint venturecompanies in each country benefit from the partners’ logistical andmarketing resources.
European Investment in U.S. Dairy
Nestlé has been active in the United States for nearly a century but has onlyrecently moved into U.S. dairy products through recent purchases of well-known domestic dairy companies, such as Dreyers. Nestlé also formed ajoint venture, Ice Cream Partners, a General Mills subsidiary, whichincludes such popular brands as Haagen-Dazs and Drum Stick. Nestlé andUnilever, an Anglo-Dutch company, together account for 30 percent of theU.S. supermarket sales of ice cream. The U.S. dairy industry benefits fromthe presence of these global marketing giants through their expertise inmeeting the demands of consumers as well as their purchases of U.S. milkand its components.
Several French dairy firms have a significant and growing presence in theU.S. market. Fromageries Bel produces Kaukauna, a cold pack (Cheddar)cheese produced for the U.S. market. Sodiaal is a French cooperative thatpreviously made investments in U.S. butter processing plants, and Yoplaityogurt is one of the cooperative’s premier brands in the U.S. market.Bongrain has a strong presence in aseptic food products in North Americathrough a partnership with the Land O’ Lakes Dairy Group, supplyingcheese sauces, beverages, and puddings. Bongrain also sells a wide varietyof dairy products in the United States, such as ice cream, fluid milk, naturaland processed cheese, powered milk, and yogurt.
15U.S. Dairy at a Global Crossroads / ERR-28
Economic Research Service/USDA

The Interface Between Domestic DairyPolicies and Dairy Trade
For dairy industries in individual countries, the first priority is to provide anadequate supply of milk to satisfy domestic market needs, first the fluidmarket, and then manufactured product markets. Domestic dairy policiesand programs are generally mechanisms to promote milk production in acountry, but in some cases around the world they have promoted surplusproduction above domestic needs. Those surpluses are available for exportbut may also impede imports—for which they are termed trade distorting.By explicitly including agricultural trade and domestic agricultural supportpolicies in its negotiations, the Uruguay Round of the General Agreementon Tariffs and Trade (GATT) opened the door for several contentiousdebates during trade talks that often centered on domestic dairy policies andprograms. As evidenced by these discussions, firms interested in greaterinternational market participation may benefit from an assessment of theeffects of domestic dairy policies and programs as they interface with dairytrade policies.
As the global dairy industry continues to evolve, it is important to determinethose countries for which the interface between international dairy trade anddomestic dairy policy is an issue. Table 3 shows the top five countries orareas of the world for production, consumption, imports, and exports ofbutter, cheese, nonfat dry milk, and whole milk powder. Almost all countrieshave tariffs or tariff-rate quota (TRQ) systems in place and at least twocountries have both. The bottom line in the table identifies four countrieswith significant institutional structures, other than tariffs and TRQs, in placeto provide domestic dairy industry support: the EU, Canada, Japan, and theUnited States.
Dairy-Trading Nations With SignificantDomestic Support
With the exception of the EU, the four countries/regions where significantdomestic support for dairy is prevalent are not dominant players in interna-tional dairy product markets. The focus here is to provide a general descrip-tive outline of the key elements of current policy and programs; historicalinformation for each area can be found in other detailed sources. The detailsof many domestic dairy programs can be daunting and are available fromthe governmental agencies charged with their implementation and operation.References are cited for each country in the following sections.
The European Union (EU)
EU agricultural policy is embodied in the Common Agricultural Policy (CAP).Reforms of the CAP in 2003 significantly moved the EU toward using decou-pled direct payments (called single farm payments) to support agriculture. Thefundamental dairy policy components of the current CAP include a milkproduction quota and intervention programs for butter and nonfat dry milk. Thereforms called for reduction of both the butter and the nonfat dry milk inter-vention prices. The 25-percent reduction for butter prices is to be spread over 4
16U.S. Dairy at a Global Crossroads / ERR-28
Economic Research Service/USDA

years—a 7-percent reduction per year in 2005-07 and a 4-percent reduction in2008. For nonfat dry milk, the price reductions are uniform at 5 percent peryear from 2004 to 2006, reductions that actually did occur. A limit has beenestablished for annual intervention purchases of 30,000 tons of butter by 2008,starting from 70,000 tons in 2004 and reduced by 10,000 tons annually. TheEU will make direct payments, which may be coupled to milk production ornot, to cover lost revenues due to price reductions. Member states may makeadditional payments from a national budget provided by the EU. In 2008, dairypayments will be incorporated into the (noncommodity-specific) single farmpayment (Kelch and Normile, 2004).
The EU today is much different from that of 3 or 4 years ago and is farremoved from the original six-member Economic Community of 1967. InMay 2004, eight Central and Eastern European countries (Poland, Hungary,Czech Republic, Slovakia, Slovenia, Estonia, Latvia, and Lithuania), Malta,and Cyprus joined the EU-15 to form the EU-25 (Cochrane, 2004). With theaddition of the 10 new member states, the EU increased its population bynearly 30 percent and its arable land by nearly 40 percent. Other countriesare also scheduled for membership, including Romania and Bulgaria in2007. The ongoing changes in the EU will result in its having a larger pres-ence in global agricultural markets, but whether it will be an importing orexporting area for various products is to be determined.
17U.S. Dairy at a Global Crossroads / ERR-28
Economic Research Service/USDA
Table 3
Dairy trade and domestic dairy policy/programs, 2004
Top five nations in each category
Milk production European Union United States India Russia Brazil
Dairy products:
ProductionButter European Union United States New Zealand Russia UkraineCheese European Union United States Australia Brazil RussiaNonfat dry milk European Union United States New Zealand India AustraliaWhole milk powder European Union China New Zealand Brazil Argentina
ConsumptionButter European Union United States Russia Ukraine MexicoCheese European Union United States Russia Egypt CanadaNonfat dry milk European Union United States Mexico India JapanWhole milk powder China Brazil European Union Venezuela Russia
ExportsButter New Zealand European Union Australia Ukraine CanadaCheese European Union New Zealand Australia Ukraine United StatesNonfat dry milk New Zealand European Union United States Australia UkraineWhole milk powder New Zealand European Union Australia Argentina Philippines
ImportsButter Russia European Union Algeria Mexico CanadaCheese United States/Japan Russia European Union Mexico AustraliaNonfat dry milk Mexico Indonesia Philippines Thailand ChinaWhole milk powder China Venezuela Malaysia Mexico/Philippines Thailand
Domestic policy "coverage" European Union United States Canada Japan
Source: Prepared by USDA, Economic Research Service using data from USDA, Foreign Agricultural Service.

Canada
Canadian dairy policy rests first and foremost on the supply managementsystem implemented in the mid-1970s. All current programs are designedwith this system as the backdrop. Both the Federal and the ProvincialGovernments are involved in regulating milk markets.
Canada’s domestic production and marketing controls are intended to matchmilk supplies, classified as industrial or fluid, with estimated demand at anadministered price. The national production target for industrial milk, calledthe market sharing quota, is allocated to provinces largely based on histor-ical shares. An annual fluid milk quota is determined in each province. Thequotas are assigned in each province by marketing boards. The dairy quotasare tradable and have become a valuable asset for producers. The adminis-tered industrial milk and fluid milk prices are based on cost-of-productionestimates and other market information.
Canada has several other programs in place that address seasonality,domestic dairy product innovation, the marketing of dairy ingredients, andthe provision of milk components through a special use permit for use inmanufactured products. A revenue pooling system in place since 1996serves as a means for revenues from all milk sales, fluid and industrial,adjusted by several factors, to be used to establish blend prices forproducers. Canada also employs a purchase program for butter and skimmilk powder that establishes reference (support) prices for milk used inmanufactured products.
Canada implemented several TRQs for dairy products under the terms of theWorld Trade Organization (WTO) in 1994, the primary TRQ being forbutter. Approximately two-thirds of the butter TRQ is allocated to NewZealand (Canadian Dairy Commission, 2005).
Japan
Dairy policies in Japan emphasize self-sufficiency in milk and dairyproduct production through milk supply controls and direct producerincome support. There are two milk markets—one for drinking milk andone for manufacturing milk. The quantity of fluid milk is set by a nationalboard of designated milk producers and allocated to regional memberswho voluntarily accept their quota and face penalties if they exceed it.Manufacturing milk constitutes about 40 percent of total production (Bulland Roberts, 2001) and is subject to a formal quota system, except formilk to be used for cheese production. Quota participation is voluntary,and those who participate receive direct payments for milk producedwithin their quota and no payment for milk produced over their quota. Thedirect payment system replaced a deficiency payment system in 2001.Japan initiated an income stabilization program for milk producers in2001 to reduce the effects of dairy product price declines. The Agricultureand Livestock Industries Corporation, a state trade enterprise, is author-ized to stabilize dairy product prices by market intervention and stock-piling when necessary (Obara, Dyck, and Stout, 2005).
18U.S. Dairy at a Global Crossroads / ERR-28
Economic Research Service/USDA

United States
U.S. milk producers have received government support since the 1930s.Current domestic programs include milk price support, the Federal milkmarketing order system, and direct payments under the Milk Income LossContract (MILC) program. Dairy policies and programs have been modifiedto meet changing economic relationships over time, but underlying generalobjectives remain the same: ensure the orderly marketing of an adequatesupply of fresh wholesome milk to meet consumer demands at reasonableprices and provide adequate returns to milk producers (Manchester andBlayney, 2001).
WTO commitments in 1994 had immediate implications for the U.S. dairyindustry. Legislation in 1996 addressed meeting the WTO commitments andproposed fundamental changes in domestic dairy policies and programs that,if implemented, would reduce trade-distorting support. The Dairy ExportIncentive Program (DEIP), a program for subsidizing certain dairy productexports, was limited by WTO commitments, and the end of the pricesupport program was proposed. Milk price support never actually ended. Itwas revived in its more traditional “permanent” form in 2002, and a directpayment program for milk producers, MILC, was authorized with paymentsfirst made in 2003. The DEIP was continued still subject to the reducedlevels agreed to under the WTO.
Dairy-Trading Nations With Little Domestic Support
Most of the remaining countries that appear as major dairy product exportersor importers have few or no domestic dairy policies or programs (see table 3).Australia and New Zealand are long-time international dairy market partici-pants. New Zealand has not had significant agricultural support of any kindsince the mid-1980s. The Australian dairy industry generally has been moreprotected, but efforts to tie its agricultural industries to international marketshave led to domestic dairy policy changes—the most recent in 2000 when fluidmilk market pricing was reformed.
Countries such as Brazil and Argentina are relatively new participants in inter-national dairy-market exporting, and their long-term prospects are unknown.However, they are clearly recognized as potential key suppliers and have rela-tively unregulated domestic industries. Other importing and exporting relation-ships seem to be based on regional proximity and possibly former political ties.
Domestic dairy policies and programs in key trading areas or nations are still asignificant determinant of global dairy product flows. Dairy industry represen-tatives in the United States emphasize three major concerns in statementsregarding international dairy trade: (1) market access (including administrationof border measures), (2) export subsidies, and (3) change in existing domesticdairy support programs. Milk producers, processors, product manufacturers,and dairy marketing firms in other countries have generally expressed the sameconcern—but to different degrees. Assessments of dairy trade liberalizationoften posit complete elimination of domestic policies and programs, dairyborder measures, and export subsidies.
19U.S. Dairy at a Global Crossroads / ERR-28
Economic Research Service/USDA

Dairy Policy Changes and the U.S. Dairy Sector
The continued commitment of the United States to WTO agricultural tradeobjectives, including reduced domestic support for agriculture and freertrade, leads to the question: What do changes in dairy trade and domesticdairy policies and programs worldwide mean for the U.S. dairy sector? Weemployed two empirical agricultural trade models to derive estimates of theeffects of liberalization on the domestic dairy sector. The first model, thePartial Equilibrium Agriculture Trade Simulator (PEATSim), is a partialequilibrium commodity trade model with detailed crop and livestock sectorsthat captures interactions among dairy and nondairy sectors. The secondmodel, the University of Wisconsin World Dairy Model (UWWDM), is aspatial model of only dairy sectors.1
All economic models are stylized representations based on theoreticalassumptions and observed relationships that can not embody all of theeconomic complexities that might exist. The trade models used in this studyfit that mold—they do not capture all of the realities of modern foodmarkets. We noted some of these realities earlier: the strategies of interna-tional dairy companies and their decisions to invest in foreign marketsproviding economic returns to shareholders and farmers and the suppliesand demands for many different types of nontraditional milk products.Attempts to include these types of relationships in modeling efforts are intheir infancy. Nevertheless, the existing models can be used to estimate theeffects of trade liberalization on dairy industries with given technologies andmarket structures (including policies and programs).
PEATSim and UWWDM focus on trade in butter, cheese, and dry milkpowders. The UWWDM includes additional detailed product and policyrepresentation for countries in the UWWDM framework. As part of thegreater product detail, UWWDM includes milk component (fat, proteins,and skim solids) accounting as a step toward gaining more informationabout changing trade relationships related to ingredients. The two modelsare not connected—they represent two different ways of looking at dairytrade relationships and the potential effects of liberalized domestic dairypolicies and dairy trade policies. The use of the two different modelsprovides greater validation of the assessments of likely effects on key dairyindustry and trade variables under alternative policy scenarios.
Dairy Policy and Modeling Issues
Domestic dairy support instruments include intervention prices and otherforms of price support, direct producer payments, and production andmarketing quotas. Market access or border restrictions include tariffs andTRQs. Export subsidies for dairy products are important for some countriesas are domestic consumer subsidies as a means of disposing of surplus dairyproducts or increasing dairy product demand.
Tariffs on dairy products are well above the overall average agriculturaltariff level and are among the highest of all commodities. Gibson et al.(2001) calculated an average agricultural tariff level of 62 percent, with
20U.S. Dairy at a Global Crossroads / ERR-28
Economic Research Service/USDA
1Further details on both models areincluded in appendix B.

dairy tariffs averaging about 85 percent. The only product with a highertariff was unmanufactured tobacco at 90 percent. Gibson et al. also foundaverage over-quota tariffs for dairy products to be high at 128 percent, eventhough they were applied to only a few products. Countries with some ofthe highest over-quota tariffs on dairy products have relatively low in-quotatariffs. Japan had an in-quota dairy tariff of 10 percent but a 227-percentover-quota tariff; the corresponding U.S. rates were 12 and 43 percent.Import measures work in concert with domestic price support programs inmany countries, while some countries rely solely on tariffs to protect theirdairy sectors. Removal of import protection would likely have the mostsignificant effect of all policy reform measures because it would affect thelargest number of countries and would expose the domestic dairy markets ofpreviously protected countries to competition from lower priced imports.
The United States, the EU, and Canada all support the price of milk andsome dairy products. In these countries, multilateral liberalization wouldlikely lead to reductions in domestic milk prices, either directly throughdisciplines on domestic support or in response to increased imports in amore liberal trading regime. However, increased world prices resulting fromliberalization would offset some of the reductions in support. The EU andCanada limit milk output with milk production quotas, an action that rein-forces other price support measures by limiting surplus production.
When all domestic and border measures are included, dairy programsaccount for a large share of dairy producers’ revenue. In those countries forwhich this measure is calculated, the share of revenue provided by govern-ment programs ranges from 1 percent in New Zealand to 68 percent inJapan. How would dairy output in these countries respond to policy reformsthat simultaneously reduced price support and import protection and liftedrestrictions on production? Of the specific countries analyzed, the UnitedStates, the EU, and Canada currently have longstanding domestic programsfor dairy products.
The model scenarios defined here eliminate the longstanding export subsidyprograms of the United States, the EU, and Canada (table 4). Theseprograms offer a means of supporting domestic milk prices by removingsurplus milk, in the form of dairy products, from the domestic markets.Eliminating only export subsidies could put pressure on domestic marketprices or lead to accumulation of large government stocks. On the otherhand, extensive use of export subsidies depresses world market prices. Theirelimination would be expected to raise world dairy market prices and thusmitigate negative price impacts on countries that had relied extensively onthem. It is also assumed that both the EU and Canada would eliminateproduction quotas as the need to manage surplus production disappears withelimination of the other support programs.
The observed interactions among domestic and border policies highlight acommonly held view—border measures are essentially extensions ofdomestic dairy policies. To alter or eliminate one set without changing oreliminating the other could result in potentially adverse effects on govern-ment budgets.
21U.S. Dairy at a Global Crossroads / ERR-28
Economic Research Service/USDA

PEATSim and the UWWDM generate results for multiple countries and, inthe case of PEATSim, multiple commodities. We focus on the effects on theU.S. dairy industry of liberalizing only dairy sector policies and programs inall countries. The effects on milk production and milk prices are key indica-tors of interest as is the trade position of the U.S. in a scenario reflectingfull liberalization. Appendix tables contain selected results for the othercountries or regions as defined in the two models.
Impacts From the PEATSim Model
Based on the assumption that dairy policies and programs worldwide areeliminated, the PEATSim model results indicate the U.S. milk price fallsjust over 11 percent while milk production declines about 6 percent (app.tables 2-5). Production of butter, nonfat dry milk, whole dry milk, and otherdairy products decline, but cheese output expands slightly. World prices ofthe traded products included in the model—butter, cheese, nonfat dry milk,and whole dry milk—all increase. The largest percentage increase is forbutter, followed in descending order by cheese, whole dry milk, and nonfatdry milk. The United States maintains its trade position in most markets butslightly increases exports of nonfat dry milk. For more information on thePEATSim results, see Langley, Somwaru, and Normile (2006).
Impacts From UWWMD
The UWWDM framework provides results over a medium term (5 years)presented relative to a base scenario for each year. Impacts on price and
22U.S. Dairy at a Global Crossroads / ERR-28
Economic Research Service/USDA
Table 4
Dairy policies eliminated in liberalization scenarios, by country and product
Milk Butter Cheese Nonfat dry milk Whole dry milk Other dairy products
United States PS,PP T,TQ,X,PS T,TQ,X,PS T,TQ,X,PS T,TQ,X
European Union PS,Q T,TQ,X,PS,C T,TQ,X T,TQ,X,PS T,TQ,X T,TQ,X
Japan PP T,TQ T T,TQ
Canada PS,Q T,TQ,X T,TQ,X T,TQ,X T,TQ,X T,TQ,X
Mexico T T,TQ T,TQ T,TQ
Brazil T T T T
Argentina T T T T
China T T
Australia T T,TQ T T
New Zealand T T T T
South Korea T T,TQ
Rest of world T T T T T
T = TariffsTQ = Tariff rate quotasX = Export subsidiesPS = Price supportPP = Producer paymentsQ = Production/marketing quotaC = Consumer subsidies
Source: Prepared by USDA, Economic Research Service.

production are greater in the early years but decline in later years due toadjustments in milk production and product markets. Globally, multilateralfull liberalization of dairy trade policies results in lower domestic milkprices in distorted sectors, which benefits consumers at the expense ofproducers, increases milk production, and increases trade in dairy products(app. tables 6-8).
At the end of the simulation period, 2007, U.S. milk prices are about 4percent lower than the projected baseline price, and production is down justunder 2 percent. As noted in appendix B, these estimates are based on anassumption regarding the U.S. classified pricing system that may overesti-mate its effects. If so, they could be considered maximum estimates. In anycase, the results are modest. U.S. exports fall while imports rise—implyinga slightly larger net import position—but the changes in trade volume aresmall relative to the size of the U.S. dairy sector. The loss in exports is aresult of reduced milk production and elimination of U.S. export subsidies,even with their low volume limits.
A key feature of the UWWDM framework is its total welfare measurecomponent. This measure includes producer, consumer, and governmentcosts and benefits associated with dairy policy and trade liberalization. Thewelfare analysis shows that the U.S. economy gains from multilateral dairyliberalization, about $800 million, as a result of lower consumer and govern-ment costs offsetting lost producer benefits. The gains would be less if esti-mated effects on prices and production are smaller. For more information onthe results of the UWWDM framework, see Peng and Cox (2006).
Why the Results Differ
The two models that generate the empirical estimates represent alternativemodeling structures. The PEATSim model adapted for our analysis is a partialequilibrium, comparative static model while the UWWDM is a dynamicspatial model. Additionally, the models depend on a large number of “fixed”parameters, such as the supply and demand price elasticities for each countryor region identified in the model. Differences in the underlying structures andparameters partly determine the different quantitative estimates.
The selection of the base period also affects the quantitative findings. If thebase year selected is a year in which U.S. dairy prices are high, a periodwhen underlying domestic policies and programs would not be expected tobe having much effect, elimination of those policies and programs wouldnot be expected to have large impacts. The opposite is true for low dairyprice base years. The PEATSim model is based on 2001, a period of rela-tively higher milk prices than 2002, the base for UWWDM.
Percentage changes are simple summary statistics, but the base year issue isof some importance. A large percentage change applied to a high price maygenerate the same magnitude as a small percentage change applied to a lowprice. It is the consistency of the directions and interpretations of the effectsthat are key elements for evaluating the usefulness of the two models. Esti-mated sizes of effects are always subject to arguments—this is a facet of allempirical economic modeling.
23U.S. Dairy at a Global Crossroads / ERR-28
Economic Research Service/USDA

U.S. Dairy Competing in a New Decade
In either a domestic or a global sense, the U.S. dairy industry is comingunder greater pressure to compete more aggressively for a share of theconsumer’s food budget and for resources to keep the industry movingforward. Competition in the food industry is marked by offerings toconsumers of an ever-expanding array of products, including high-quality,nutritious, nondairy substitutes. To remain competitive, the U.S. dairyindustry is faced with assessing and responding to changing supply anddemand trends. Efficient farm-level milk production and use of that milk inhigh-demand products are keys to providing both producers and investorsadequate returns on their investments. Ensuring the development of well-coordinated supply chains will also help dairy firms and producers competein a global industry.
The operational structures of modern dairy firms and global supply chainsare becoming a new source of competitive advantage for the U.S. dairyindustry. Multinational firms are investing and partnering in the U.S. marketbecause of its sheer size, the dynamism of U.S. consumer demand, thesteady and reliable supply of raw milk, and foreign investment policiesconsidered to be more liberal than those in other high-income markets. Inthe U.S. market, multinationals can take advantage of economies of scale interms of production distribution and marketing. When companies havegreater flexibility to procure inputs and sell outputs in a more liberal tradingenvironment, returns to milk producers are improved.
Companies adjust their production and marketing strategies because ofmarket conditions and policy environment. Dairy policies can either facili-tate changes or prove to be a bottleneck as the dairy industry adapts to achanging environment.
On a global basis, dairy product demand and the dynamics of internationaltrade are changing—milk supply is becoming more constrained in someparts of the world and less so in other regions. This alone requires interna-tional dairy companies to reposition themselves in global markets. NewZealand, where the dairy industry is not protected through domesticsupport, is a leader in responding to changes in global demand and devel-oping new foreign markets and the production, processing, and marketingmechanisms to reach them. As long-term growth is less certain due todomestic resource constraints, the industry has responded by procuringdairy inputs elsewhere. Other lower cost milk-producing countries, such asthe United States, are benefiting in this environment. If subsidized exportsfrom countries with heavily protected dairy industries and import barrierswere reduced further, the U.S. dairy sector may benefit even more. More-over, the role and extent of U.S. dairy policy is less clear today than in thepast. The efforts of U.S. milk suppliers, processors, and product marketersto improve competitiveness depends more on innovation, flexibility, andinvestment than on policy support.
24U.S. Dairy at a Global Crossroads / ERR-28
Economic Research Service/USDA

References
Abbott, Philip, and B. Adair Morse. “Tariff Rate Quota Implementation andAdministration by Developing Countries,” Agricultural and ResourceEconomics Review, Volume 29/1, April 2000.
Abler, David, and David Blandford. “Dairy and Milk Supply Equations forWTO Model,” ERS Penn State Trade Modeling Project—ModelDocumentation, June 6, 2000,http://trade.aers.psu.edu/ documentation.cfm
Ackerman, Karen Z., and Praveen M. Dixit. An Introduction to StateTrading in Agriculture, Agricultural Economic Report Number 783.U.S. Department of Agriculture, Economic Research Service,November 1999.
Australian Dairy Corporation. Australian Dairy Industry in Focus, 2004.
Bailey, K. “MPC Imports Have Implications for the Dairy Industry,”Feedstuff, February 10, 2003.
Barichello, Richard S. “A Review of Tariff Rate Quota Administration inCanadian Agriculture,” Agricultural and Resource Economics Review,Volume 29/1, April 2000.
Blandford, David. A U.S. Perspective on the Current Round of AgriculturalTrade Negotiations, paper prepared for the course “European AgriculturalPolicy in Transformation,” held at Wageningen University, theNetherlands, September 2001.
Blayney, Don P., and James J. Miller. International Dairy Markets and theWTO, Outlook Report Number LDP-M-74, U.S. Department ofAgriculture, Economic Research Service, August 2000.
Blayney, Don P., and Richard Fallert. The World Dairy Market—Government Intervention and Multilateral Policy Reform. Staff ReportNumber AGES 9053, U.S. Department of Agriculture, EconomicResearch Service, August 1990.
Boughner, Devry S., Harry de Gorter, and Ian M. Sheldon. “The Economicsof Two-Tier Tariff-Rate Import Quotas in Agriculture,” Agricultural andResource Economics Review, Volume 29/1, April 2000.
Bull, Tim, and Ivan Roberts. Agricultural Trade Policies in Japan—TheNeed for Reform, ABARE Research Report Number 01.5, AustralianBureau of Agricultural and Resource Economics, 2001.
Bureau, Jean-Christophe, and Stefan Tangermann. “Tariff-Rate Quotas inthe EU,” Agricultural and Resource Economics Review, Volume 29/1,April 2000.
Burfisher, Mary E. (ed.). The Road Ahead: Agricultural Policy Reform inthe WTO—Summary Report, Agricultural Economic Report Number797, U.S. Department of Agriculture, Economic Research Service,January 2001.
25U.S. Dairy at a Global Crossroads / ERR-28
Economic Research Service/USDA

Burfisher, Mary E. (ed.) and others. Agricultural Policy Reform in the WTO—The Road Ahead, Agricultural Economic Report Number 802, U.S.Department of Agriculture, Economic Research Service, May 2001.
Canadian Dairy Commission. Canadian Dairy Commission Annual Report2004-2005, www.cdc-gccl.gc.ca.
Choi, Jung-Sup, and Daniel A. Sumner. “Opening Markets While MaintainingProtection: Tariff Rate Quotas in Korea and Japan,” Agricultural andResource Economics Review, Volume 29/1, April 2000.
Cochrane, Nancy. “A Historic Enlargement: Ten Countries Prepare To Join theEuropean Union,” Amber Waves, Volume 2, Issue 2, April 2004,www.ers.usda.gov/amberwaves/april04/featres/ahistoricenlargement.htm
Cochrane, Nancy (coord.) and others. Livestock Sectors in the Economies ofEastern Europe and the Former Soviet Union, Agricultural EconomicReport Number 798, U.S. Department of Agriculture, Economic ResearchService, February 2002.
Datamonitor, Productscan Database. www.productscan.com
de Gorter, Harry, and Ian M. Sheldon. “Issues in the Administration ofTariff-Rate Quotas in the Agreement on Agriculture in the WTO: AnIntroduction,” Agricultural and Resource Economics Review, Volume29/1, April 2000.
Dobson William, and Andrew Wilcox. How Leading International DairyCompanies Adjusted to Changes in World Markets, Babcock InstituteDiscussion Paper Number 2002-4, Babcock Institute for InternationalDairy Research and Development, http://babcock.cals.wisc.edu/down-loads/dp/2002-4.en.pdf
Euromonitor International. 2005 edition, www.euromonitor.com
European Commission, Directorate-General for Agriculture. The MeatSector in the European Union: Fact Sheet, 2004, http://europa.eu.int/comm/agriculture/publi/fact/meat/2004_en.pdf
Fuller Frank, Jikun Huang, Hengyun Ma, and Scott Rozzelle. “The RapidRise of China’s Dairy Sector: Factors Behind the Growth in Demand andSupply,” Working Paper Number 05-WP 394, Iowa State University,Center for Agricultural and Rural Development, 2005,www.card.iastate.edu/publications/DBS/PDFFiles/05Wp394.pdf
Gale, Fred (ed.). China’s Food and Agriculture: Issues for the 21st Century,Agriculture Information Bulletin Number 775, U.S. Department ofAgriculture, Economic Research Service, April 2002.
Gibson, Paul, John Wainio, Daniel Whitley, and Mary Bohman. Profiles ofTariffs in Global Agricultural Markets, Agricultural Economic ReportNumber 796, U.S. Department of Agriculture, Economic ResearchService, January 2001.
Gloy, Angela. “Milk Protein Fractions: Potential Market Utilization,”Dairy Policy and Innovation, Proceedings of the 11th AnnualWorkshop for Dairy Economists and Policy Analysts, Washington,DC, April 2004.
26U.S. Dairy at a Global Crossroads / ERR-28
Economic Research Service/USDA

Hu, D., Frank Fuller, and Tom Reardon. “The Impact of Rapid Developmentof Supermarkets on the Dairy Industry in China,” Chinese RuralEconomy, 7(Serial Number 235):12-18, 2004.
International Dairy Federation. Bulletin of the International DairyFederation, Number 391, 2004.
Jones, Elizabeth, and Jaclyn Y. Shend (eds.). Review of Agricultural Policiesin Europe and the Former Soviet Union, Agricultural Economic ReportNumber 733, U.S. Department of Agriculture, Economic ResearchService, June 1996.
Kelch, David R. (coord.) and others. The European Union’s CommonAgricultural Policy: Pressures for Change, International Agriculture andTrade Report Number WRS-99-2, U.S. Department of Agriculture,Economic Research Service, 1999.
Kelch, David, and Mary Anne Normile. CAP Reform of 2003-04, OutlookReport Number WRS-04-07, U.S. Department of Agriculture, EconomicResearch Service, August 2004.
Langley, S., D. Blayney, J. Stout, A. Somwaru, M. Normile, J. Miller and R. Stillman. Trade Liberalization in International Dairy Markets, paperpresented at the American Agricultural Economics Association AnnualMeetings, Montreal, Canada, July 27-30, 2003.
Langley, Suchada, Agapi Somwaru, and Mary Anne Normile. TradeLiberalization in International Dairy Markets: Estimated Impacts,Economic Research Report Number 16, U.S. Department of Agriculture,Economic Research Service, February 2006.
Liefert, William, and Johan Swinnen. Changes in Agricultural Markets inTransition Economies, Agricultural Economic Report Number 808, U.S.Department of Agriculture, Economic Research Service, February 2002.
Manchester, Alden C., and Don P. Blayney. Milk Pricing in the UnitedStates, Agriculture Information Bulletin Number 761, U.S. Department ofAgriculture, Economic Research Service, February 2001.
Meilke, Karle, and Sylvain Lariviere. The Problems and Pitfalls inModeling International Dairy Trade Liberalization, Working Paper,March 1999.
Miller, James J. Coping With a Changing World: The Outlook for Dairy,paper presented at USDA Agricultural Outlook Forum, Arlington,Virginia, February 2002.
Miller, James, Keithly Jones, and Donald Blayney. International DairyMarkets and Trade Reform, paper presented at 6th Economic ResearchService Ag. Issues Roundtable, Washington, DC, June 2001.
Normile, Mary Anne (coord.). Agriculture in the WTO, InternationalAgriculture and Trade Report Number WRS-98-4, U.S. Department ofAgriculture, Economic Research Service, December 1998.
Obara, Kakuyu, John Dyck, and Jim Stout. Dairy Policies in Japan, OutlookReport Number LDP-M-134-01, U.S. Department of Agriculture,Economic Research Service, August 2005.
27U.S. Dairy at a Global Crossroads / ERR-28
Economic Research Service/USDA

Peng, Fingjun, and Tom Cox. Impacts of Trade Liberalization on the U.S.Dairy Market, Contractor and Cooperator Report Number 21, U.S.Department of Agriculture, Economic Research Service, August 2006.
Pettit, Robert. Outlook for World Milk Powder Trade, presented at USDAAgricultural Outlook Forum, Arlington, Virginia, February 2002.
Podbury, Troy, Ivan Roberts, Apelu Tielu, and Benjamin Buetre.Agricultural Export Measures in WTO Negotiations, ABARE ResearchReport Number 01.12, RIRDC Publication Number 01/134, Canberra,Australia, 2001.
Roberts, Ivan, Troy Podbury, and Mike Hinchy. Reforming DomesticAgricultural Support Policies through the World Trade Organization,ABARE Research Report Number 01.2, RIRDC Publication No. 01/07,Canberra, Australia. 2001.
Rude, James, and Jean-Philippe Gervais. Trade Liberalization in SupplyManaged Sectors, CATRN Paper 2000-10, Canadian Agrifood TradeResearch Network, 2000.
Shaw, Ian, and Graham Love. Impacts of Liberalizing World Trade in DairyProducts, ABARE Research Report Number 01.4, Australian Bureau ofAgricultural and Resource Economics, 2001.
Simpson, James R. “Structural Adjustments May Influence Japanese DairyIndustry,” Feedstuff, Volume 64, Number 16, 2002.
Skully, David. “U.S. TRQs for Peanuts, Sugar, and Tobacco: HistoricalAllocation and Nondiscrimination,” Agricultural and ResourceEconomics Review, Volume 29/1, April 2000.
Skully, David. Economics of Tariff-Rate Quota Administration, TechnicalBulletin Number 893, U.S. Department of Agriculture, EconomicResearch Report, April 2001.
Statistics New Zealand. 2005.
Stout, James, and David Abler. ERS/Penn State Trade Model Documentation,http://trade.aers.psu.edu/pdf/ERS_Penn_State_Trade_Model_Documentation.pdf, updated October 2004.
United Nations. COMTRADE Database, http://unstats.un.org/unsd/comtrade
U.S. Department of Agriculture. Economic Effects of U.S. Dairy Policy andAlternative Approaches to Milk Pricing, USDA report to Congress, July2004, www.usda.gov/documents/newsreleases/dairyreport1.pdf
U.S. Department of Agriculture, Foreign Agricultural Service. Dairy:World Markets and Trade Circular, www.fas.usda.gov/dlp/circu-lar/2005/05-12Dairy/toc.htm
Wainio, John. “Canada’s Subsidized Dairy Exports: The Issue of WTOCompliance.” Agricultural Outlook, AGO-283, August 2001.
Washington, Andrew, A., and Richard L. Kilmer. The Derived Demand forImported Cheese into Japan by Country, paper presented at the 2001IATRC Conference, Auckland, New Zealand, 2001.
28U.S. Dairy at a Global Crossroads / ERR-28
Economic Research Service/USDA
Wei, Anning. The Dairy Industry in China, Food and Agricultural Research,Rabobank International, North East Asia Region, February 2000.
Wei, Anning. “WTO Shake-up for Chinese Dairy Industry,” AgWorld Vision,Volume 2, Number 1, 2002.
World Trade Organization. “The World Market for Dairy Products, 1997,”International Dairy Agreement, Third Annual Report, Geneva, Austria,1997.
29U.S. Dairy at a Global Crossroads / ERR-28
Economic Research Service/USDA

Appendix A—World Production and Trade by Country and Product
Global milk production is largely from cows (84 percent), but a growingshare of milk is produced from other animals, such as buffaloes, goats, andsheep. The quantity of milk produced by animals other than cows is notlarge, but cheese varieties produced from sheep and goats are traded interna-tionally, and their overall share of production has increased slightly since2000. From 2000 to 2004, total milk production grew about 6 percent, whilecow’s milk production grew somewhat less (app. tables 9-13). The countriesthat produce individual dairy products detailed in this section account forabout 78 percent of total world milk production.
Butter
The international butter market consists of two segments of roughly thesame size: anhydrous milkfat (AMF) and solid butter. Demand for, and tradein, both products has varied greatly in response to economic conditions inrecent years but has shown no clear-cut trends. Demand for AMF is foundprimarily in the relatively affluent countries of Asia and Latin America,which use it for commercial reconstitution of beverage milks and for suchproducts as ice cream. World butter production has remained fairly steadysince the implementation of the World Trade Organization’s (WTO)Uruguay Round Agreement on Agriculture (URAA) during 1986-94, thoughlower than pre-URAA quantities.
The major butter importers are Russia, the Middle East and North Africa,and the EU (for fixed negotiated amounts from New Zealand). In 1985,Oceania (Australia and New Zealand) exported less than 25 percent of theworld’s butter; by 2000, the region accounted for nearly half of the world’srecorded butter exports, with New Zealand shipping about two-thirds of thatamount. Significant additional trade in butter occurs among countries of theformer Soviet Union and Eastern Europe, but reliable data are unavailable.The EU is the only other large butter exporter, although its share is muchsmaller than it was before URAA implementation. The United Statesnormally is not a significant participant in the international butter market.
Cheese
World cheese production has grown by nearly 2 percent during the post-URAA period, with North America and Europe accounting for much of thegrowth in production and consumption. The international cheese marketcontinues to grow steadily, but slowly, in response to economic growth inLatin America, Westernization of diets in Asia, and the spread of pizzaconsumption to every part of the world. Cheese consumption in Asia hasmore than doubled since 1990, but it is still quite low.
World cheese exports grew only about 1 percent annually from 1994 to1999. Japan, the United States, the EU, and, sometimes, Russia are leadingmarkets. The Middle East and North Africa are key markets, particularly forsome cheese types. The EU remains the largest exporter of cheese, although
30U.S. Dairy at a Global Crossroads / ERR-28
Economic Research Service/USDA

its exports have fallen because of the WTO export subsidy disciplines. Allof Western Europe accounts for over half of world cheese exports, withmost of the remainder coming from Oceania. With growing milk produc-tion, New Zealand and Australia boosted cheese production and exportssubstantially as decreasing European exports created trade opportunities.
Dry milk powders
Most East and Southeast Asian countries import significant amounts of milkpowders. The more populous countries in the Middle East and North Africacontinue to be key markets, although import demand has not grown much.Many countries in Latin America import substantial quantities of milkpowders. Relatively rapid population growth in the region has boosted demand,although economic crises have led to erratic growth in import demand.
Milk powder export supplies consist of about equal amounts of skim milk andwhole milk powders. About four-fifths of milk powder exports come from theEU and Oceania. Lesser amounts come from Poland, Argentina, and (for skimmilk powder) the United States. U.S. export sales of skim milk powder havebeen generally lower in the 2000s than during the early 1990s.
31U.S. Dairy at a Global Crossroads / ERR-28
Economic Research Service/USDA

Appendix B—Model Descriptions
Partial Equilibrium Agriculture TradeSimulator (PEATSim)
The Partial Equilibrium Agriculture Trade Simulator (PEATSim) model(formerly known as the ERS-Penn State model) is an applied partial equilib-rium, multiple-commodity, multiregion model of agricultural policy andtrade (Abler et al., 2001; Stout and Abler, 2004). PEATSim is a gross-trademodel that accounts for exports and imports of each commodity in everyidentified region but does not identify them by origin or destination. Themodel is dynamic in that it allows for adjustment over time in crop and live-stock production, dairy processing, and oilseed crushing.
The model includes 12 countries or regions—the United States, the Euro-pean Union (EU-15), Japan, Argentina, Australia, Brazil, Canada, China,Mexico, New Zealand, South Korea, and the rest of the world (ROW). Itcovers 35 commodities (rice, wheat, corn, other coarse grains, soybeans,sunseed, rapeseed, peanuts, other oilseeds, cotton, sugar, soybean oil andmeal, sunseed oil and meal, rapeseed oil and meal, cottonseed oil and meal,peanut oil and meal, tropical oils, other oilseed oil, beef and veal, pork,poultry, raw milk, butter, cheese, nonfat dry milk, whole dry milk, fluidmilk, and other dairy products).1 Raw and fluid milk are included asnontraded commodities.
The model is different from other partial equilibrium trade models in that ithas explicitly incorporated a wide range of domestic and border policies inagriculture. The core set of policies for all countries includes specific and advalorem import and export taxes or subsidies, tariff-rate quotas (TRQ), andproducer and consumer subsidies. Other types of domestic policies andprograms are also included. For example, the U.S. model includes govern-ment support purchase prices, tariffs and TRQs, and export subsidies fordairy products and Milk Income Loss Contract (MILC) payments. TheJapan model includes tariffs and “markups,” such as for rice, wheat, andsugar. Compensation schemes for Japan and South Korea that pay producersfor declines in price relative to a reference price are also included. The EUmodel includes intervention prices (which entail government purchases andexport subsidies), tariffs, compensatory payments, acreage set-asides, andbase area bounds (which limit the area (acreage) of grains and oilseeds thatqualifies for payments), and production quotas for raw milk and sugar.2
Milk production quotas for Canada and the EU are included.
Model parameters come from various sources, including the EuropeanSimulation Model (ESIM), ERS baseline model projections, the Food andAgricultural Policy Simulator (FAPSIM), the Organisation for EconomicCo-operation (OECD) AGLINK model, and the SWOPSIM (Static WorldPolicy Simulation) model. Adjustments and restrictions were imposed onelasticities to satisfy requirements of economic theory, such as symmetryand homogeneity. The model can be used for comparative static ordynamic analyses.
32U.S. Dairy at a Global Crossroads / ERR-28
Economic Research Service/USDA
1Constraints on dairy productshares are imposed to preserve consis-tency of milk components.
2The model does not include limitson countries’ exports due to WTOexport subsidy commitments.

PEATSim is used here as a comparative static model incorporating anadjustment path to capture dynamic adjustments, except for capital—aquasi-fixed input that has no longrun equilibrium adjustment—and toprovide medium-term results. The analysis captures the marginal effects ofpolicy reforms across all countries. No productivity growth is taken intoaccount. The analysis does not account for shifts in supply functions overtime, reflecting cost-reducing technology adoption, nor the growth indemand driven by population and income. This point is crucial in inter-preting the model results. For example, productivity growth, if incorporatedinto the analysis, could have shown that a country with a capital-intensiveand technologically advanced dairy sector that is able to compete in anonsupported and nonprotected environment (such as the United States)may do well under trade liberalization.
The base year for the PEATSim dairy data is 2001, adjusted for the 2002farm bill and China’s WTO accession in the base model solution. Base datafor crops (area, yield, production, consumption, stocks, and trade) are fromthe 2000 crop year and are drawn from USDA and country sources,including the USDA production, supply, and demand (PS&D) database.3
Tariffs and TRQs are from the Agricultural Market Access Database(AMAD)4 and Gibson et al. (2001).
The model is a reduced-form model with production, consumption, andother behavioral variables represented by constant elasticity functions. Allcountries in the model are represented with similar structure, with differentparameters and values of variables in behavioral equations. For a netimporting country, dairy imports (and other commodity imports) are aresidual to equilibrate exports and imports. For a net exporting country,dairy exports (and other commodity exports) are a residual. For detailedinformation on the model structure, equations, sources, and methods, seeStout and Abler (2004).
The University of Wisconsin World DairyModel (2002)
The University of Wisconsin World Dairy Model (UWWDM) used for thisanalysis is an updated annualized version of a model developed to assessimpacts of changes in international dairy trade relationships. The updatedmodel contains updated supply and demand elasticities, explicit modeling ofthe EU CAP reforms starting in 2005, incorporation of Australia/NewZealand free trade, explicit US-Australia Free Trade Agreement information,and the United States MILC program, a target price deficiency paymentintroduced in 2002.
The model is a classic math-programming, spatial equilibrium model withadditional structure to address a spatial equilibrium in hedonic (characteristic)space. This hedonic spatial equilibrium model incorporates 24 regions, 9 dairyproducts, and 4 milk components (fat, casein, whey protein, and lactose) usingUnited Nations Food and Agriculture Organization (FAO) and OECD data-bases. All regions and markets are linked via transportation costs and tradepolicy distortions (export subsidies and/or import TRQs). Within- and over-quota tariffs, import quotas, and export subsidies are modeled using 2000
3Found at www.fas.usda.gov/psd4Found at AMAD database.
33U.S. Dairy at a Global Crossroads / ERR-28
Economic Research Service/USDA

GATT/WTO commitments for all developed economies. Developingeconomies continue to open access to their dairy markets until 2005, as speci-fied by the 1995 GATT/WTO agreement. The model provides a framework toanalyze hypotheses concerning the effects of liberalizing dairy trade throughmodifying both trade and domestic dairy policies and programs.
The 24 regions in the model are re-aggregated to 5 major regions in thesummary tables to provide better intuition as to the gainers and losers fromadditional world dairy sector liberalization:
� Developed economy, heavily protected dairy: EU-15, Japan, OtherWestern Europe;
� Developed economy, less heavily protected dairy: U.S. and Canada;
� Developed economy, competitive exporters: Oceania (Australia and NewZealand);
� Less developed economies, potentially competitive exporters: India,Other Eastern Europe, South America-South (Argentina, Uruguay andChile), China and Mongolia, Poland, and South Africa Republic;
� Less developed economies, net importers: Former Soviet Union, SouthAmerica-North (Brazil and Other South America), Other South Asia,Middle East, Rest of world, Mexico, North Africa, Central America &Caribbean, South/North Korea, South East Asia.
The UWWDM for this analysis uses the year 2002 as the base or referencepoint. The model is solved recursively (1 year at a time, with the previousyear solution as the starting point for the following year, with regional GDPand population (World Bank data) driven commodity demands and 5-yearmoving average supply growth rates (from FAO data) from 2002 to 2007).The following policy simulations were assessed relative to the 2002 basemodel:
� Full dairy sector (full) liberalization: All trade and domestic supportpolicies are removed starting in 2002 and simulated through 2007. Thefull liberalization combines two other scenarios: the free dairy trade(FDT) scenario and the no domestic support (NDS) scenario. The 2007simulation results, summarized as changes from the base scenario for2007 in appendix tables 6-8, provide quantitative estimates of the 2007impacts of full dairy sector liberalization.
� Free dairy trade: The second scenario (FDT) considers the elimination ofall trade distortions starting in 2000 through 2007. All export subsidiesand import TRQs (quotas, within- and over-quota tariffs) are eliminated.Domestic support policies are maintained as in the base scenario. Thisshould increase world trade, increase world market prices, and put con-siderable strain on several domestic support policies (intervention priceprogram costs, in particular) in the protected dairy sectors.
� No domestic support: The third scenario (NDS) eliminates all domesticsupport starting in 2002 through 2007. These measures include interven-tion/support prices for the EU (SMP), Canada (butter and SMP), and theUnited States (butter, SMP, cheese) as well as other countries; elimina-tion of classified pricing in the United States and Canada (modeled as a
34U.S. Dairy at a Global Crossroads / ERR-28
Economic Research Service/USDA

price wedge/premium for residual (fluid, soft and frozen) products overmanufactured products); and, production/marketing quotas in the EU andCanada. Modeling the classified pricing as defined can overstate itseffect. A sensitivity analysis on changes in only the U.S. price wedgeindicates that smaller effects do indeed appear when the wedge isreduced. Thus, the effects as originally modeled represent maximumimpacts. Still, they are modest for the United States.
The 2007 simulation results for the FDT and NDS scenarios as described inthis report, summarized as changes from the base scenario for 2007, arepresented in Peng and Cox (2006). Several of the key results are noted here.As the base year (2002) saw large U.S. costs via its intervention/pricesupport program (about $U.S. ~500M in SMP purchases) and targetprice/deficiency payment (MILC) program (about $U.S. 1.2B), domesticderegulation could have strong impacts on U.S. milk prices. Similarly, giventhe large levels of milk production quota rents in the EU and Canada (35percent and 40 percent of the domestic milk prices, respectively), elimina-tion of these policies sharply increases these countries’ competitiveness (nomilk production quota constraints at sharply reduced milk production costs)and, hence, sharply increases their milk production even while milk pricesand revenues drop. Note, this will lower prices in the protected dairyeconomies, hence lower world dairy prices, but not necessarily provideadditional access to competitive exports—unless over-quota tariffs becomeless prohibitive at these lower protected market prices. Additionally,increased milk production from the EU and Canada, potentially beyondtheir domestic consumption, will likely displace base level imports by theseprotected dairy sectors, and reduce potential export market growth opportu-nities for competitive exporters.
35U.S. Dairy at a Global Crossroads / ERR-28
Economic Research Service/USDA

36U.S. Dairy at a Global Crossroads / ERR-28
Economic Research Service/USDA
Appendix table 1
Major new product launches in global dairy markets, 2003-04Country/product market Brand name Company Product description
North America
U.S. / milk Land O'Lakes Dairy Ease 100% Dean Foods (under license) New national brand of Lactose Free Milk lactose-free milk
U.S. / cheese Kraft Singles Pasteurized Process Kraft Foods Processed Hispanic cheese;Cheese – Manchego individually wrapped slices
U.S. / cheese Stella Freshly Shredded Cheese – Saputo Cheese Shredded cheese in resealable3 Cheese European Blend, Natural Swiss plastic cups
U.S. / cheese Kraft Shredded Whole Milk Cheese – Kraft Foods New cheese varietyQueso Quesadilla
U.S. / yogurt Dannon Frusion Smoothies Danone Name change for Dannon Fruit 'n Yogurt Drink Frusion, package redesign with
new graphics
U.S. / yogurt Dannon Light n' Fit Carb Control Yogurt Danone Reduced carbohydrate sub-brand
Canada / milk Dairy Oh! George Weston Ltd Fortified milk
Mexico / yogurt Uva (grapefruit) Lala Regular drinking yogurt
Mexico / yogurt Activia Danone Probiotic yogurt
Europe
France / cheese Mini Babybel au Chèvre Fromageries Bel Unspreadable processed cheese; new goat cheese variant
France / fermented drinks Actimel allégé en sucre Danone Low-fat variant with reduced sugar content
France / yogurt Velouté Fruix Danone Fruited yogurt. New range with puréed fruit; six flavors
Germany / flavored drinks Müllermilch Lin Chi Molkerei Alois Müller Limited edition flavored milk drinks (exotic and fruity)
Germany / yogurt Alete Milch- und Fruchtminis Nestlé Deutschland AG Yogurt for babies
Germany / yogurt Onken Wellness Joghurt Onken GmbH Four new 1.5%-fat yogurt varieties, including aloe vera
Germany / fermented drinks Actimel Multifrucht Danone Multifruit flavored fermented dairy drinks
Italy / fermented drinks Crema Actidrink Müller Sold in 100 ml bottles
Italy / yogurt Danone Frutta Frullata Danone Fruit frappe yogurt
Netherlands / yogurt Vifit Calcimel Campina Melkunie Flavored yogurt with calcium
Sweden / yogurt Cultura Arla Foods Probiotic yogurt
U.K. / yogurt Munch Bunch Drinky Nestlé Fortified drinking yogurt for children, aimed at the lunchboxmarket
U.K. / yogurt Petit Filous Yoplait Child-oriented fromage frais product, with added calcium
South America
Argentina / yogurt Yogurisimo Stick Danone Argentina SA Yogurt on a stick
Argentina / cheese Adler Cabaña y Estancia Spreadable processed cheese, Santa Rosa SA in small pack sizes
Brazil / fluid milk Corpus Light Danone Fat-free long-life/UHT milk
Chile / flavored drinks Bliss Fresh Nestlé Chile SA Flavored milk drink with fruit juice
Chile / flavored drinks Leche Cultivada Descremada Parmalat Chile SA Nonfat sour milk drink
Colombia / fluid milk Avena con Canela La Alquería Productos Naturales Long-life/UHT RTD flavored ultrapasteurizada de Cajicá SA milk drink with extra cinnamon
Continued—

37U.S. Dairy at a Global Crossroads / ERR-28
Economic Research Service/USDA
Appendix table 1
Major new product launches in global dairy markets, 2003-04—ContinuedCountry/product market Brand name Company Product description
East Asia
China / flavored drinks Bright Wheat Shanghai Bright With added wheat and Diary Co Ltd chocolate
China / milk Bight Shu Shui Nai (Sleeping Milk) Inner Mongolia Mengniu Brand extension in fresh milk, Group claims to aid sleep
Hong Kong / flavored milk High-Calcium DHA chocolate milk Kowloon Dairy Flavored milk (focused on children under 10 years old)
India / flavored drinks Amul Chocolate Milk Gujarat Co-op Milk Flavored milk launched in the Marketing Federation Ltd South, aiming at regional
market
India / yogurt Amul Lassi Gujarat Co-op Milk Drinking yogurt launched in Marketing Federation Ltd West India, targeting a regional
market
Indonesia / fluid milk Mimi UHT milk Ultrajaya Milk Industry UHT milk targeting children, available in small sizes
Japan / yogurt Genso Mango Chichiyasu Mango-flavored yogurt
Japan / yogurt Meiji Probiotics Yogurt LG21 Meiji Dairies Corp Plain probiotic with reduced sugar
Taiwan / drinks milk Kuang Chuan I Love Milk Beer Kuang Chuan Dairy Co Ltd Flavored milk containing beer Yeast High Calcium yeast, vitamin B complex,
DNA and RNA
Source: Prepared by USDA, Economic Research Service using data from Euromonitor International 2005.
Appendix table 3
Changes in milk price and production with trade liberalization
Dairy reform only All sectors liberalized
Milk price Milk production Milk price Milk production
Percent
United States -11.4 -5.7 -8.8 -7.3EU -9.4 -3.2 -6.6 -4.3Japan -7.4 -1.8 -7.4 -3.1Canada -11.5 -2.9 -8.5 -3.4Mexico 14.2 3.5 20.7 3.9Brazil 4.2 1.1 8.6 0.7Argentina 27.1 6.3 31.1 5.5China 7.3 1.8 10.2 1.9Australia 34.1 7.7 37.3 7.3New Zealand 33.2 7.5 35.9 7.4South Korea -47.6 -14.8 -46.1 -14.9Rest of world 9.2 2.3 8.4 2.8
Source: USDA, Economic Research Service, simulated from PEATSim model.
Appendix table 2
Changes in world market prices of dairy products
Dairy reform only All sectors liberalized
Percent change from base
Butter 66.4 68.2Cheese 50.2 54.3Nonfat Dry Milk (NFDM) 13.2 14.2Whole Dry Milk (WDM) 24.0 26.4
Source: USDA, Economic Research Service, simulated from PEATSim model.

38U.S. Dairy at a Global Crossroads / ERR-28
Economic Research Service/USDA
Appendix table 4
Changes in dairy product export shares with dairy policy reform1
Butter Nonfat dry milk Cheese Other dairy products
Country Base Scenario Base Scenario Base Scenario Base Scenario
Percent
United States 0.8 0.8 11.8 12.2 2.8 2.2EU 16.6 2.1 23.3 17.5 54.1 54.2 28.3 48.5Japan 2.8 9.8Canada 1.7 2.0 3.4 3.4 1.9 1.7MexicoBrazilArgentina 1.3 2.3 2.4 2.8 2.3 3.9 27.3 16.3ChinaAustralia 22.9 27.5 24.7 27.3 17.0 17.6 41.6 25.2New Zealand 53.1 61.0 19.9 21.5 18.8 18.9South KoreaRest of world 3.6 4.3 14.6 15.2 3.1 1.4 0 0.11 Changes in export shares of whole dry milk are insignificant.Note: Blank cell indicates no significant share of commodity market.
Source: USDA, Economic Research Service, simulated from PEATSim model.
Appendix table 5
Changes in dairy product export shares with all commodity liberalization1
Butter Nonfat dry milk Cheese Other dairy products
Country Base Scenario Base Scenario Base Scenario Base Scenario
Percent
United States 0.8 0.9 11.9 12.4 2.8 2.2EU 16.2 0.7 23.5 18.0 54.5 54.9 27.9 47.1Japan 3.6 12.0Canada 1.7 2.1 3.4 3.4 1.9 1.7MexicoBrazilArgentina 1.2 2.0 2.2 2.4 2.1 3.4 27.0 15.6ChinaAustralia 23.0 27.7 24.6 27.1 16.9 17.5 41.4 24.8New Zealand 53.5 62.3 19.7 21.1 18.8 18.9South KoreaRest of world 3.6 4.4 14.7 15.5 3.1 1.4 0.1 0.5
1/ Changes in export shares of whole dry milk are insignificant.Note: Blank cell indicates no significant share of commodity market.
Source: USDA, Economic Research Service, simulated from PEATSim model.

39U.S. Dairy at a Global Crossroads / ERR-28
Economic Research Service/USDA
Appendix table 6
Effects on milk price and production from multilateral liberalization, 2007
Country Milk price change Milk production change
Percent
EU -54.7 11.6Japan -57.2 -21.5United States -4.1 -1.8Canada -51.7 8.8New Zealand 24.5 8.1Australia -3.5 -1.3South America-South (Argentina) 9.5 3.1
Source: USDA, Economic Research Service, from University of Wisconsin World Dairy Model.
Appendix table 7
Effects on dairy trade of multilateral liberalization, 2007
Country/region Exports Imports
Percent change
EU 24.8 -100.0Japan -- 95.2Australia -6.9 --New Zealand 30.3 --Canada -17.5 -35.2United States -5.9 62.9Mexico -- 16.0South America-North (Brazil) -- 134.9South America-South (Argentina) 66.7 --World 18.6 18.6
-- = not available due to insufficient trade.
Source: USDA, Economic Research Service, from University of Wisconsin World Dairy Model.
Appendix table 8
Welfare effects of multilateral liberalization, 2007
Country/region Total welfare change
Percent change from base
EU -2.3Japan 0.3Australia 2.2New Zealand 3.5Canada 0.7United States 0.8Mexico 2.3South America-North (Brazil) -0.9South America-South (Argentina) 1.0
Source: USDA, Economic Research Service, from University of Wisconsin World Dairy Model.

40U.S. Dairy at a Global Crossroads / ERR-28
Economic Research Service/USDA
Appendix table 9
Milk production in selected countries and regions, 20041
Country/Region Cows milk production Cows
1,000 metric tons 1,000 head
North AmericaCanada 7,885 1,057Mexico 9,874 6,800United States 77,477 9,010
Subtotal 95,236 16,867
South AmericaArgentina 9,250 2,000Brazil 23,317 15,200ChileColombiaPeru 0Venezuela
Subtotal 32,567 17,200
European Union (EU)EU-25 130,812 23,963
Eastern EuropeRomania 5,723 1,694
Former Soviet UnionRussia 32,000 11,200Ukraine 13,787 4,313
Subtotal 45,787 15,513
North AfricaEgyptAlgeria
Subtotal
South AsiaIndia 37,500 37,000
AsiaChina 22,606 5,466IndonesiaJapan 8,329 936KoreaMalaysiaPhilippinesTaiwanThailand
Subtotal 30,935 6,402
OceaniaAustralia 10,377 2,036New Zealand 15,000 3,920
Subtotal 25,377 5,956
Total selected countries 403,937 124,5951Source: Prepared by USDA, Economic Research Service using final estimates by USDA,Foreign Agriculture Service, December 2005.

41U.S. Dairy at a Global Crossroads / ERR-28
Economic Research Service/USDA
Appendix table 10
Whole dry milk production, consumption and trade data, 20041
Country/Region Production Consumption Imports Exports Ending stocks
1,000 metric tons
North AmericaCanada 0 0 0 0 0Mexico 0 35 35 0 0United States 19 22 3 0 1
Subtotal 19 57 38 0 1
South AmericaArgentina 260 86 1 177 25Brazil 420 435 21 16 11Chile 51 52 4 8 4Colombia 0 0 0 0 0Peru 0 0 0 0 0Venezuela 0 0 0 0 0
Subtotal 731 573 26 201 40
European Union (EU)EU-25 857 346 3 514 0
Eastern EuropeRomania
Former Soviet UnionRussia 90 109 25 6 0Ukraine 28 10 0 18 0
Subtotal 118 119 25 24 0
North AfricaEgyptAlgeria 0 140 161 0 30
Subtotal 0 140 161 0 30
South AsiaIndia 0 0 0 0 0
AsiaChina 832 898 91 25 0Indonesia 45 65 21 1 6Japan 0 0 0 0 0Korea 0 0 0 0 0Malaysia 0 0 0 0 0Philippines 0 17 45 28 0Taiwan 6 36 30 0 0Thailand 0 0 0 0 0
Subtotal 883 1,016 187 54 6
OceaniaAustralia 187 23 12 173 28New Zealand 658 1 2 669 53
Subtotal 845 24 14 842 81
Total selected countries 3,453 2,275 454 1,635 1581Source: Prepared by USDA, Economic Research Service using final estimates by USDA, Foreign Agriculture Service, December 2005.

42U.S. Dairy at a Global Crossroads / ERR-28
Economic Research Service/USDA
Appendix table 11
Nonfat dry milk production, consumption and trade data, 20041
Country/Region Production Consumption Imports Exports Ending stocks
1,000 metric tons
North AmericaCanada 88 56 2 16 41Mexico 170 338 168 0 25United States 638 621 1 231 232
Subtotal 896 1,015 171 247 298
South AmericaArgentina 35 19 0 18 4Brazil 110 112 4 2 0Chile 10 15 3 0 3Colombia 8 8 0 0 0Peru 8 8 0 1Venezuela
Subtotal 163 162 15 20 8
European Union (EU)EU-25 1,066 950 25 282 77
Eastern EuropeRomania
Former Soviet UnionRussia 125 170 65 20 0Ukraine 78 15 0 63 2
Subtotal 203 185 65 83 2
North AfricaEgypt 24 24 0 0Algeria 0 90 90 0 10
Subtotal 0 114 114 0 10
South AsiaIndia 235 231 15 10 14
AsiaChina 68 127 61 2 0Indonesia 0 115 125 12 10Japan 183 222 37 0 83Korea 25 31 4 0 7Malaysia 0 0 0 0 0Philippines 0 104 120 16 2Taiwan 0 17 17 0 0Thailand 0 0 0 0 0
Subtotal 276 616 364 30 102
OceaniaAustralia 203 20 2 187 5New Zealand 294 5 1 305 55
Subtotal 497 25 3 492 60
Total selected countries 3,336 3,298 772 1,164 5711 Source: Prepared by USDA, Economic Research Service using final estimates by USDA, Foreign Agriculture Service, December 2005.

43U.S. Dairy at a Global Crossroads / ERR-28
Economic Research Service/USDA
Appendix table 12
Cheese production, consumption and trade data, 20041
Country/Region Production Consumption Imports Exports Ending stocks
1,000 metric tons
North AmericaCanada 305 319 24 10 59Mexico 134 214 82 2 0United States 4,026 4,189 209 61 322
Subtotal 4,465 4,722 315 73 381
South AmericaArgentina 370 338 0 31 23Brazil 470 468 4 6 0ChileColombiaPeruVenezuela
Subtotal 840 806 4 37 23
European Union (EU)EU-25 6,430 6,021 106 515 0
Eastern EuropeRomania 26 25 3 4 5
Former Soviet UnionRussia 350 528 190 10 12Ukraine 224 133 3 94 2
Subtotal 574 661 193 104 14
North AfricaEgypt 455 459 9 5 0Algeria
Subtotal 455 459 9 5 0
South AsiaIndia
AsiaChinaIndonesiaJapan 35 254 219 0 15Korea 24 65 41 0 2MalaysiaPhilippinesTaiwanThailand
Subtotal 59 319 260 0 17
OceaniaAustralia 389 230 49 212 51New Zealand 308 28 2 289 29
Subtotal 697 258 51 501 80
Total selected countries 13,546 13,271 941 1,239 5201 Source: Prepared by USDA, Economic Research Service using final estimates by USDA, Foreign Agriculture Service, December 2005.

44U.S. Dairy at a Global Crossroads / ERR-28
Economic Research Service/USDA
Appendix table 13
Butter production, consumption and trade data, 20041
Country/Region Production Consumption Imports Exports Ending stocks
1,000 metric tons
North AmericaCanada 86 96 28 17 14Mexico 88 141 53 0 0United States 567 615 23 0 20
Subtotal 741 852 104 17 34
South AmericaArgentinaBrazil 75 75 1 1 0ChileColombiaPeruVenezuela
Subtotal 75 75 1 1 0
European Union (EU)EU-25 2,154 1,936 90 352 232
Eastern EuropeRomania 9 12 3 0 0
Former Soviet UnionRussia 270 437 170 5 15Ukraine 138 103 0 42 5
Subtotal 408 540 170 47 20
North AfricaEgypt 12 40 28 0 0Algeria 15 15 0 1
Subtotal 12 55 43 0 1
South AsiaIndia 2,600 2,608 10 2 0
AsiaChinaIndonesiaJapan 80 88 7 0 23KoreaMalaysiaPhilippinesTaiwan 11 11 0 0Thailand
Subtotal 80 99 18 0 23
OceaniaAustralia 132 60 9 75 8New Zealand 390 26 374 21
Subtotal 522 86 9 449 29
Total selected countries 6,601 6,263 448 868 3391 Source: Prepared by USDA, Economic Research Service using final estimates by USDA, Foreign Agriculture Service, December 2005.