u.s. department of energy’s vehicle technologies program · conservation of energy check soc...
TRANSCRIPT

U.S. Department of Energy’s Vehicle Technologies Program Update on US and Los Angeles EV and PHEV Demonstrations – China / US EV and Battery Technology Workshop @ UMass
Jim Francfort UMass Campus Center Boston, MA August 23-24, 2012 This presentation does not contain any proprietary or sensitive information

2
Outline • Participants • Goals • Testing experience • Data processes and data security • EV Project (Majority of presentation)
– Description and data parameters – Project status – Leaf, Volt, and EVSE benchmarking results
• Other electric drive vehicle research activities • Summary • Future work

3
Idaho National Laboratory (INL) • Eastern Idaho based U.S. Department of Energy (DOE)
Federal research laboratory • 890 square mile site with 4,000 staff • INL supports DOE’s strategic goal
– Increase U.S. energy security and reduce the nation’s dependence on foreign oil
• Multi-program DOE laboratory – Nuclear Energy – Energy Critical Infrastructure Protection – Homeland Security and Cyber Security – Advanced Vehicles and Battery Development – Fossil, Biomass, Wind, Geothermal and
Hydropower Energy
Wind
Bio-mass
Nuclear
Hydropower
Geothermal

4
AVTA Participants • INL manages the Advanced Vehicle Testing Activity’s
(AVTA) field testing of advanced technology light-duty vehicles for DOE’s Vehicle Technologies Program
• ECOtality provides testing support via a competitively bid NETL (National Energy Testing Laboratory) contract
• Test partners include electric utilities, Federal, state and local government agencies, private companies, and individual vehicle owners
• AVTA benchmarking supports DOE’s international petroleum reduction goals with – Canada – China – European Union

5
AVTA Goals • The AVTA goals
– Petroleum reduction and energy security – Benchmark technologies that are developed via DOE
research investments • Confuse people with facts via structured benchmark
testing • Provide benchmark data to DOE, National Laboratories
(ANL, NREL, ORNL, PNNL), Federal Agencies (DOD, DOI, DOT, EPA, USPS), technology modelers, R&D programs, vehicle manufacturers (via USCAR’s VSATT, EESTT, GITT), and target and goal setters
• Assist fleet managers, via Clean Cities, FEMP and industry gatherings, in making informed vehicle and infrastructure deployment and operating decisions
6
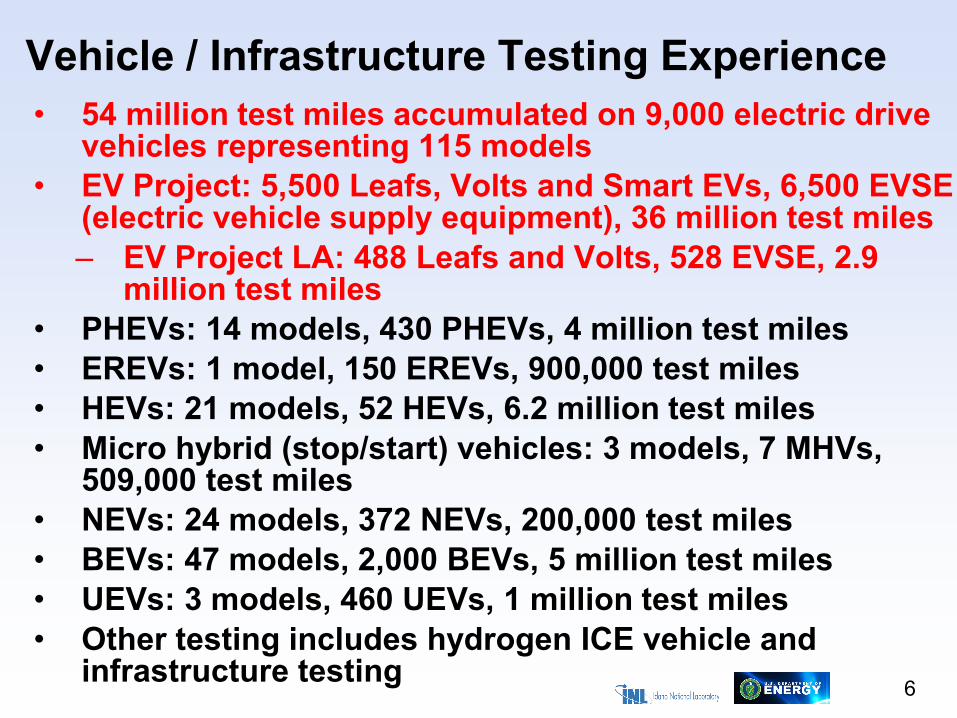
Vehicle / Infrastructure Testing Experience • 54 million test miles accumulated on 9,000 electric drive
vehicles representing 115 models • EV Project: 5,500 Leafs, Volts and Smart EVs, 6,500 EVSE
(electric vehicle supply equipment), 36 million test miles – EV Project LA: 488 Leafs and Volts, 528 EVSE, 2.9
million test miles • PHEVs: 14 models, 430 PHEVs, 4 million test miles • EREVs: 1 model, 150 EREVs, 900,000 test miles • HEVs: 21 models, 52 HEVs, 6.2 million test miles • Micro hybrid (stop/start) vehicles: 3 models, 7 MHVs,
509,000 test miles • NEVs: 24 models, 372 NEVs, 200,000 test miles • BEVs: 47 models, 2,000 BEVs, 5 million test miles • UEVs: 3 models, 460 UEVs, 1 million test miles • Other testing includes hydrogen ICE vehicle and
infrastructure testing

7
PHEVs
INL Vehicle/EVSE Data Management Process
INL Database
File server SQL Server data warehouse
Report generator
HICEVs
HEVs
BEVs & EREVs
EVSE & Chargers
INL Vehicle Data Management System
Parameters range check
Lame data check
Missing/empty parameter check
Conservation of energy check
SOC continuity
Transfer completion
Individual vehicle reports
Fleet summary Reports - Public
Focused technical analyses and
custom reports
Data quality reports
25 50 75 100 125 150 175 200 225 250 275 30
Trip Fuel Economy (mpg)
MPG vs. Trip Aggressiveness (Percent of trip above the 40% accelerator pedal position)
CD trips
CD/CS trips
CS trips
Log. (CD trips)
Log. (CD/CS trips)
Avg Hourly Vehicle Charging Demand
Time of Day
600-
659
700-
759
800-
859
900-
959
1000
-105
911
00-1
159
1200
-125
913
00-1
359
1400
-145
915
00-1
559
1600
-165
917
00-1
759
1800
-185
919
00-1
959
2000
-205
921
00-2
159
2200
-225
923
00-2
359
000
- 059
100-
159
200-
259
300-
359
400-
459
500-
559
Mon AM - Tues AM
Tue AM - Wed AM
Wed AM - Thu AM
Thu AM - Fri AM
Fri AM - Sat AM
Sat AM - Sun AM
Sun AM - Mon AM
0.1
0.2
0.3
0.4
0.5
0.6
0.7
0.8
Modeling and simulation input
Process Driven by Disclosure Agreements
8
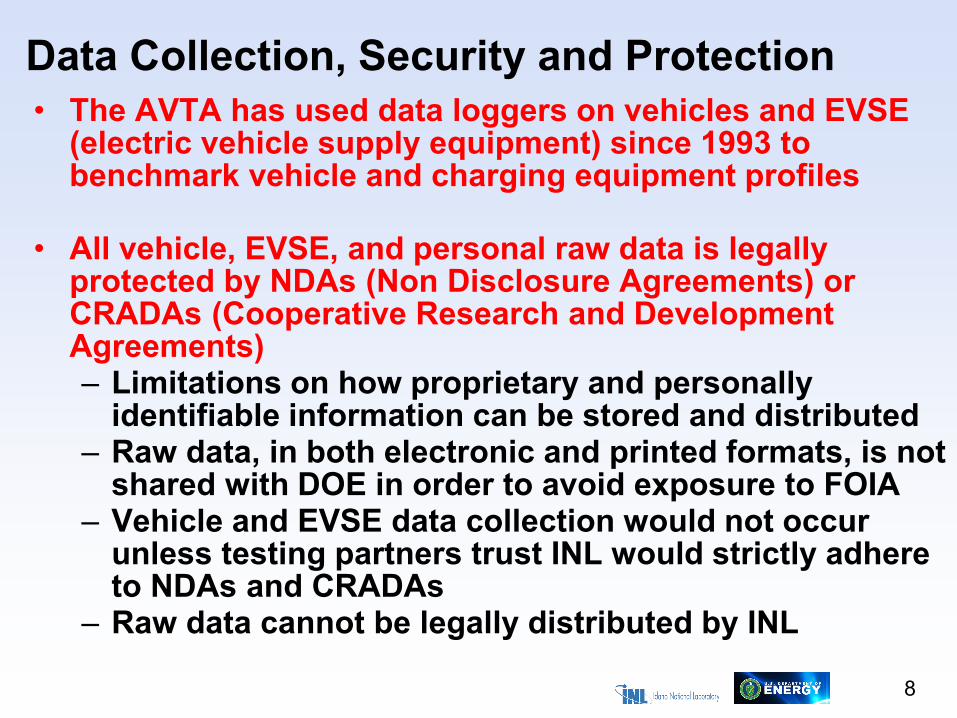
Data Collection, Security and Protection • The AVTA has used data loggers on vehicles and EVSE
(electric vehicle supply equipment) since 1993 to benchmark vehicle and charging equipment profiles
• All vehicle, EVSE, and personal raw data is legally protected by NDAs (Non Disclosure Agreements) or CRADAs (Cooperative Research and Development Agreements) – Limitations on how proprietary and personally
identifiable information can be stored and distributed – Raw data, in both electronic and printed formats, is not
shared with DOE in order to avoid exposure to FOIA – Vehicle and EVSE data collection would not occur
unless testing partners trust INL would strictly adhere to NDAs and CRADAs
– Raw data cannot be legally distributed by INL

9
EV Project Goal, Locations, Participants, and Reporting
• Goal: Build and study mature charging infrastructures and take the lessons learned to support the future streamlined deployment of grid-connected electric drive vehicles
• ECOtality is the EV Project lead, with INL, Nissan and Onstar/GM as the prime partners, with more than 40 other partners such as electric utilities
• EV Project reporting requires INL to blend three distinct data streams from ECOtality, Nissan and Onstar/GM
• 40 different EV Project reports are generated quarterly for the general public, DOE, ECOtality, project participants, industry, regulatory organizations, as well as per special requests
10
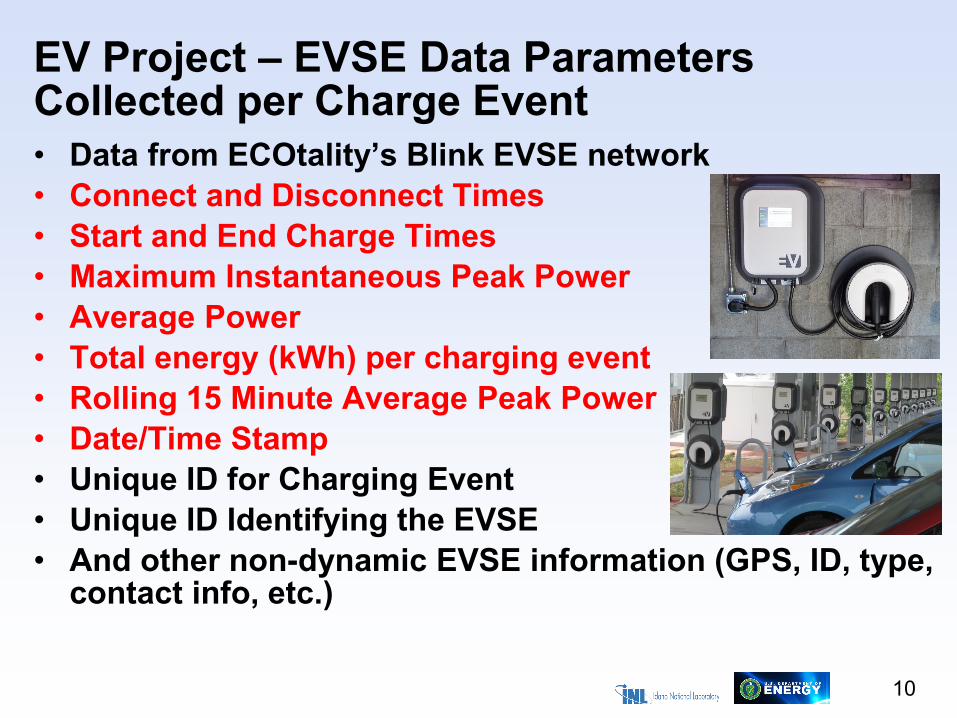
EV Project – EVSE Data Parameters Collected per Charge Event • Data from ECOtality’s Blink EVSE network • Connect and Disconnect Times • Start and End Charge Times • Maximum Instantaneous Peak Power • Average Power • Total energy (kWh) per charging event • Rolling 15 Minute Average Peak Power • Date/Time Stamp • Unique ID for Charging Event • Unique ID Identifying the EVSE • And other non-dynamic EVSE information (GPS, ID, type,
contact info, etc.)

11
EV Project – Vehicle Data Parameters Collected per Start/Stop Event • Data is received via telematics providers from Chevrolet
Volts and Nissan Leafs • Odometer • Battery state of charge • Date/Time Stamp • Vehicle ID • Event type (key on / key off) • GPS (longitude and latitude) • Recorded for each key-on and key-off event

12
EV Project – Vehicle Deployments / Miles • 5,177 vehicles reporting
data and growing • 4,500 Leafs (7/29) and
677 Volts (6/24) reporting data
• 36 million total miles • 112,000 test miles per
day
0
1,000
2,000
3,000
4,000
5,000
6,000
Nissan Leafs
Chevrolet Volts
Total Vehicles
EV Project Leafs and Volts Providing Data
0
5,000,000
10,000,000
15,000,000
20,000,000
25,000,000
30,000,000
35,000,000
40,000,000
Leaf Miles
Volt Miles
Total Miles
EV Project Vehicle Miles Reported
• First data set just received for ~300 Daimler Smart EVs

13
EV Project – EVSE Deployment and Use • As of 08/05/12, 6,535
total EVSE – 4,736 Residential
EVSE – 1,799 non-
Residential EVSE, includes DCFC
• 914,000 charge events • 3,150 charge events per
day • Data is continuously
back-filled
0
1,000
2,000
3,000
4,000
5,000
6,000
7,000
Residential EVSE
Non-Residential EVSE
Total EVSE
EV Project EVSE Providing Data
0100,000200,000300,000400,000500,000600,000700,000800,000900,000
1,000,000Residential Charge Events
Non-Residential Charge Events
Total Charge Events
EV Project EVSE Reported Number of Charge Events

14
EV Project – Total Charge Energy (MWh) • 8,239 MWh total
electricity charged – 7,728 MWh
residential – 510 MWh non-
residential • 29 MWh used for
charging per day
• Vehicle efficiency cannot be accurately calculated using total vehicle miles and total energy – Non-EV Project vehicles sometimes charge at EV
Project EVSE – EV Project vehicles may charge at 110V or other 240V
non-EV Project EVSE
0
1,000
2,000
3,000
4,000
5,000
6,000
7,000
8,000
9,000Residential Charging MWh
Non-Residential MWh
Total MWh
EV Project EVSE Reported Charging Energy

15
EV Project – Overview Report 2nd Quarter • Vehicles and charging infrastructure deployed 2nd
quarter 2012 and data received by INL • Charging infrastructure
– 6,319 units installed – 881,06 charging events – 7,513 AC MWh
• Vehicles – 4,322 Leafs – 676 Volts – 33 million miles
• Regional analyses are conducted and reported each quarter
• 2nd quarter 2012: 94 pages and 53,000 data values calculated for 4 public reports
0100200300400500600700800900
1,0001,1001,2001,300
PHX/ Tuscon
LA San Diego Wash DC San Fran Oregon Tenn Texas Wash St.
Number of Leafs, Volts & EVSE Reporting Data
EVSE Leafs Volts
16
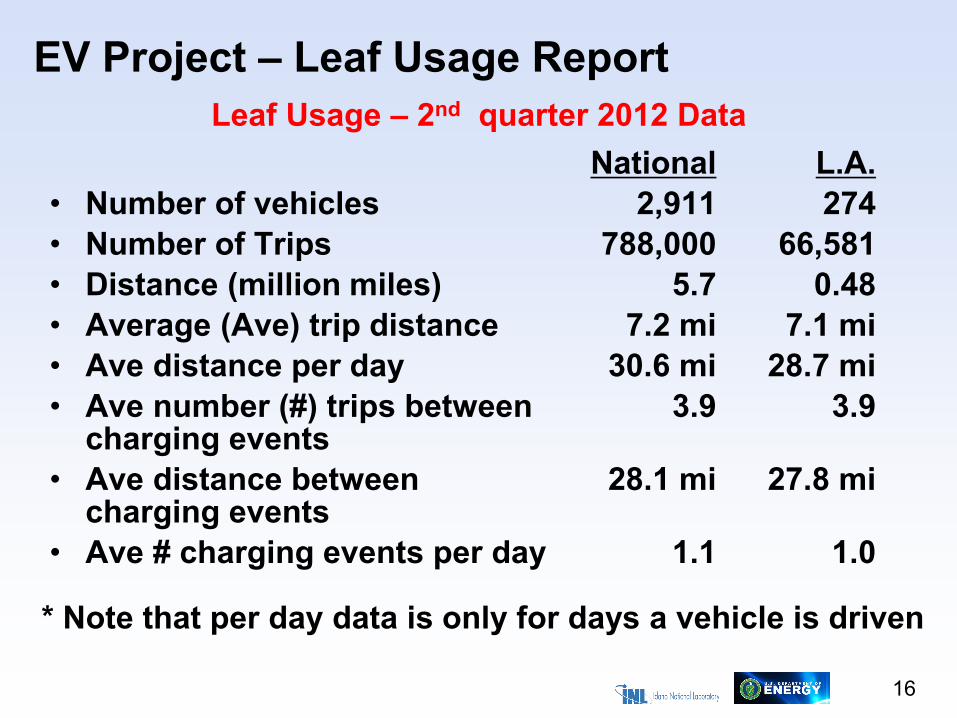
EV Project – Leaf Usage Report
• Number of vehicles • Number of Trips • Distance (million miles) • Average (Ave) trip distance • Ave distance per day • Ave number (#) trips between
charging events • Ave distance between
charging events • Ave # charging events per day
National 2,911
788,000 5.7
7.2 mi 30.6 mi
3.9
28.1 mi
1.1
L.A. 274
66,581 0.48
7.1 mi 28.7 mi
3.9
27.8 mi
1.0
* Note that per day data is only for days a vehicle is driven
Leaf Usage – 2nd quarter 2012 Data
17
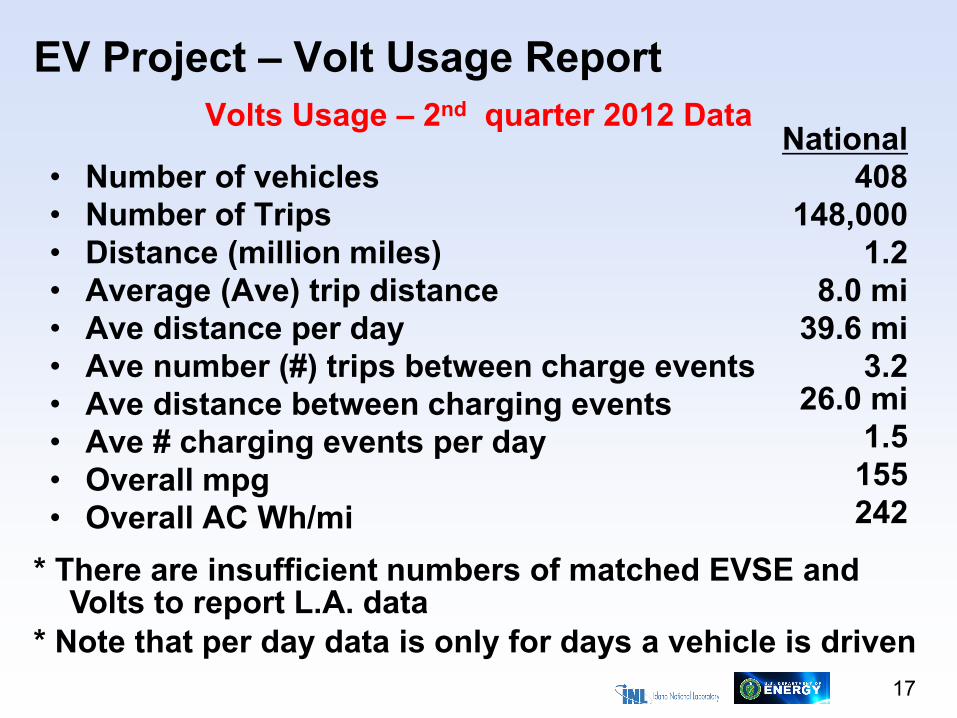
EV Project – Volt Usage Report
• Number of vehicles • Number of Trips • Distance (million miles) • Average (Ave) trip distance • Ave distance per day • Ave number (#) trips between charge events • Ave distance between charging events • Ave # charging events per day • Overall mpg • Overall AC Wh/mi
National 408
148,000 1.2
8.0 mi 39.6 mi
3.2 26.0 mi
1.5 155 242
* Note that per day data is only for days a vehicle is driven
Volts Usage – 2nd quarter 2012 Data
* There are insufficient numbers of matched EVSE and Volts to report L.A. data

18
EV Project – Leaf Usage Report (2nd ¼ 2012) • Leaf battery SOC before and after charge events by
home and non-home locations
National D
ata L.
A. D
ata

19
EV Project – Volt Usage Report (2nd ¼ 2012) • Volt battery SOC
before and after charge events by home and non-home locations

20
EV Project – Leaf Usage Report (2st ¼ 2012) • Regional variations in
charging behavior • LA has lower percent
of at home charging frequency and higher away from home charging frequency
• Data is also available for Volts
0%10%20%30%40%50%60%70%80%90%
100%Leaf Percentage Charging Locations
Home Charging Away Charging Unknown
National Data
21
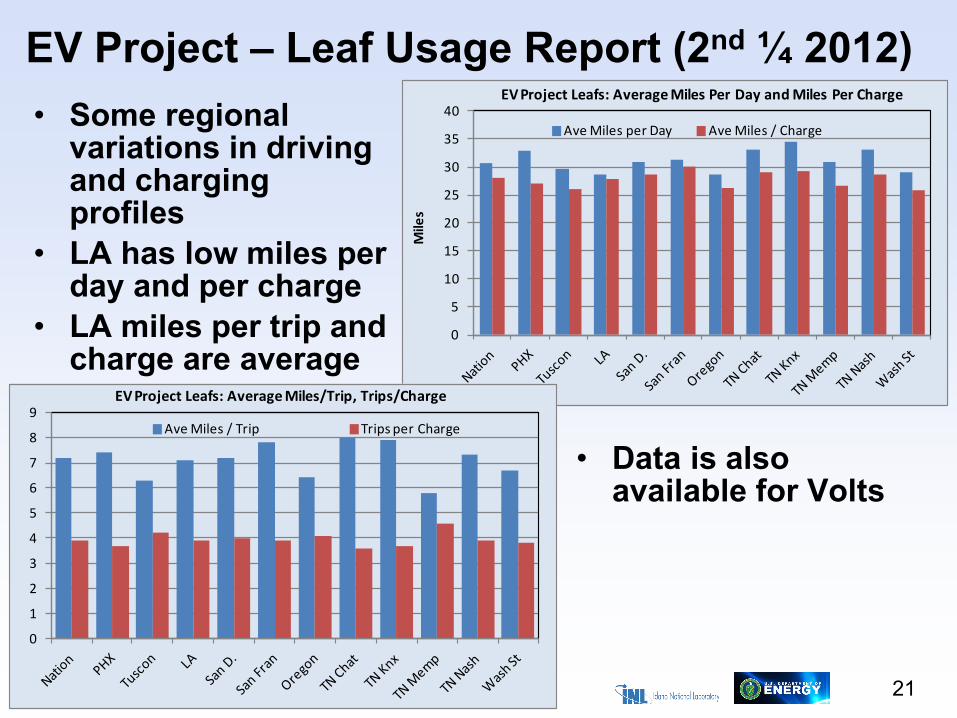
EV Project – Leaf Usage Report (2nd ¼ 2012) • Some regional
variations in driving and charging profiles
• LA has low miles per day and per charge
• LA miles per trip and charge are average
0
5
10
15
20
25
30
35
40
Mile
s
EV Project Leafs: Average Miles Per Day and Miles Per Charge
Ave Miles per Day Ave Miles / Charge
0
1
2
3
4
5
6
7
8
9EV Project Leafs: Average Miles/Trip, Trips/Charge
Ave Miles / Trip Trips per Charge
• Data is also available for Volts
22
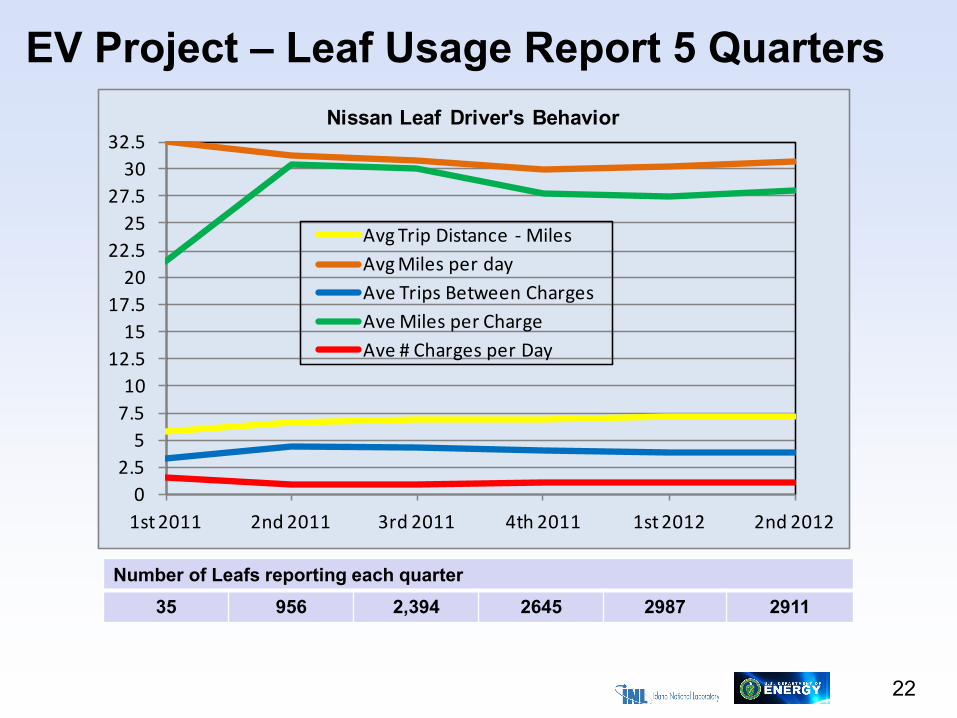
EV Project – Leaf Usage Report 5 Quarters
02.5
57.510
12.515
17.520
22.525
27.530
32.5
1st 2011 2nd 2011 3rd 2011 4th 2011 1st 2012 2nd 2012
Avg Trip Distance - MilesAvg Miles per dayAve Trips Between ChargesAve Miles per ChargeAve # Charges per Day
Nissan Leaf Driver's Behavior
Number of Leafs reporting each quarter 35 956 2,394 2645 2987 2911

23
EV Project – EVSE Infra. Summary Report • Graphs document
when EVSE have a vehicle connected during the 2nd quarter 2012
• National Data • Range of Percent of
Charging Units with a Vehicle Connected vs. Time of Day
• 4,821 total EVSE • 3,338 residential and
1,483 publicly available Level 2 EVSE

24
EV Project – EVSE Infra. Summary Report • Charging demand in
AC MW during the 2nd quarter 2012
• National data, all EVSE • Time of day kWh rates
are influencing charging start times as measured by AC MW demand
• Range of Aggregate Electricity Demand vs. Time of Day (AC MW)
• 4,821 total EVSE • 3,338 residential and
1,483 publicly available Level 2 EVSE
25
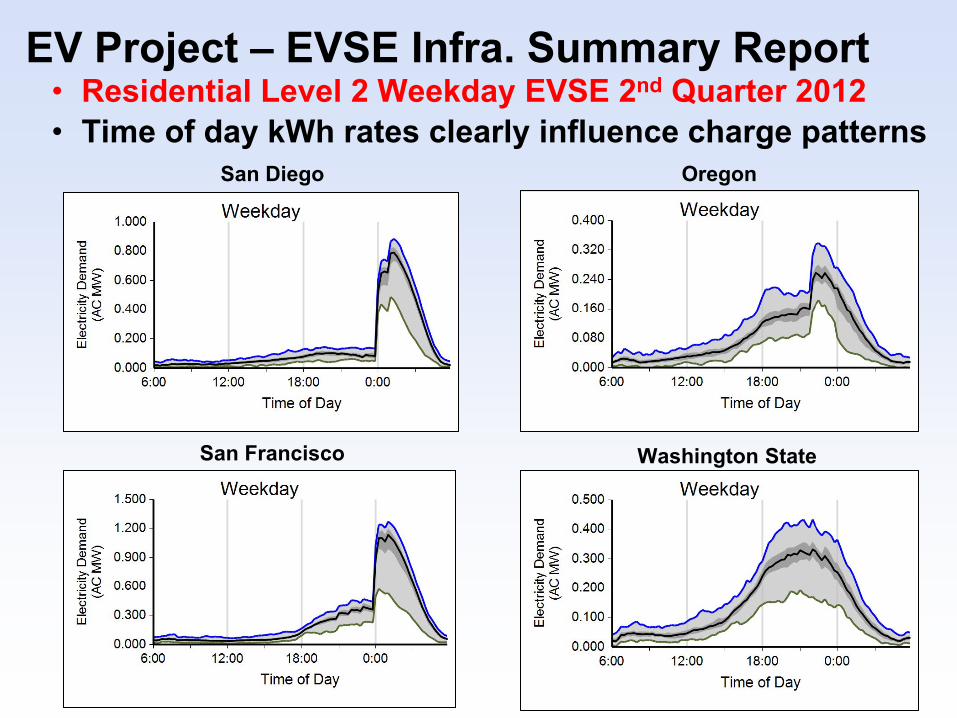
EV Project – EVSE Infra. Summary Report • Residential Level 2 Weekday EVSE 2nd Quarter 2012 • Time of day kWh rates clearly influence charge patterns
Washington State
Oregon
San Francisco
San Diego

26
EV Project – EVSE Infra. Summary Report • L.A. Residential and Non Residential Level 2 Weekday
EVSE 2nd Quarter 2012 LA Demand – AC MW LA Vehicle Connected

27
EV Project – EVSE Infra. Summary Report • 2nd quarter 2012 • Ave hours V connected R2 WD • Ave hours V connected R2 WE • Ave hours V drawing power R2 WD • Ave hours V drawing power R2 WE • Ave AC kWh/charge event R2 WD • Ave AC kWh/charge event R2 WE • Ave hours V connected P2 WD • Ave hours V connected P2 WE • Ave hours V drawing power P2 WD • Ave hours V drawing power P2 WE • Ave AC kWh/charge event P2 WD • Ave AC kWh/charge event P2 WE
11.9 hours 11.5 hours
2.6 hours 2.3 hours
9.6 AC kWh 8.2 AC kWh
4.8 hours 3.8 hours 2.3 hours 1.6 hours
7.9 AC kWh 5.6 AC kWh
• R: residential, P: public, WD: weekday, WE: weekend,
2: Level 2 EVSE, and V: vehicle
11.6 11.6 2.5 2.1 8.7 7.5 6.1 4.1 2.3 2.2 7.7 7.7
National
L.A.

28
EV Project – EVSE Infra. Summary Report • Percent of public EVSE deployed is increasing, now
representing 31% of all EVSE
0%
10%
20%
30%
40%
50%
60%
70%
80%
90%
100%
1st 2011 2nd 2011 3rd 2011 4th 2011 1st 2012 2nd 2012
Percent Res
Percent Pub
Percent Residential & Public EVSE of Total Number of EVSE

29
EV Project – EVSE Infra. Summary Report • Percent charge events and AC MWH use by residential
and public EVSE each reporting quarter • Public EVSE use (red & blue lines) is increasing • 10.8% charge events and 10.0% MWh 2nd quarter 2012
0%
10%
20%
30%
40%
50%
60%
70%
80%
90%
100%
1st 2011 2nd 2011 3rd 2011 4th 2011 1st 2012 2nd 2012
Percent Res AC MWH
Percent Pub AC MWH
Percent Res Charge Events
Percent Pub Charge Events
Percentage AC MWH & Charge Events - Public and Residential
30
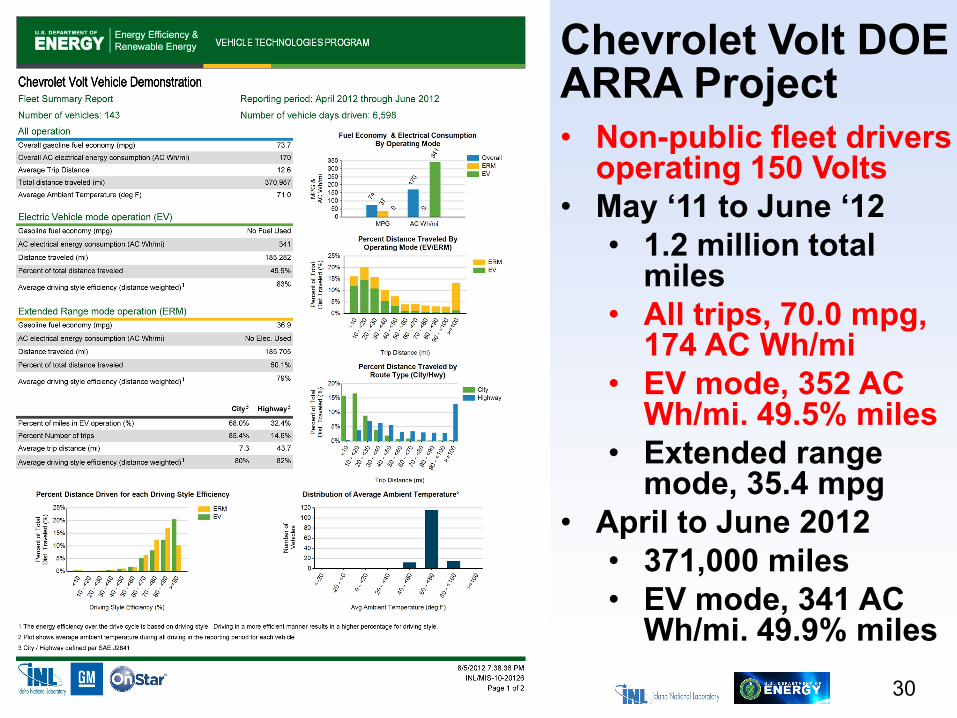
• Non-public fleet drivers operating 150 Volts
• May ‘11 to June ‘12 • 1.2 million total
miles • All trips, 70.0 mpg,
174 AC Wh/mi • EV mode, 352 AC
Wh/mi. 49.5% miles • Extended range
mode, 35.4 mpg • April to June 2012
• 371,000 miles • EV mode, 341 AC
Wh/mi. 49.9% miles
Chevrolet Volt DOE ARRA Project
31
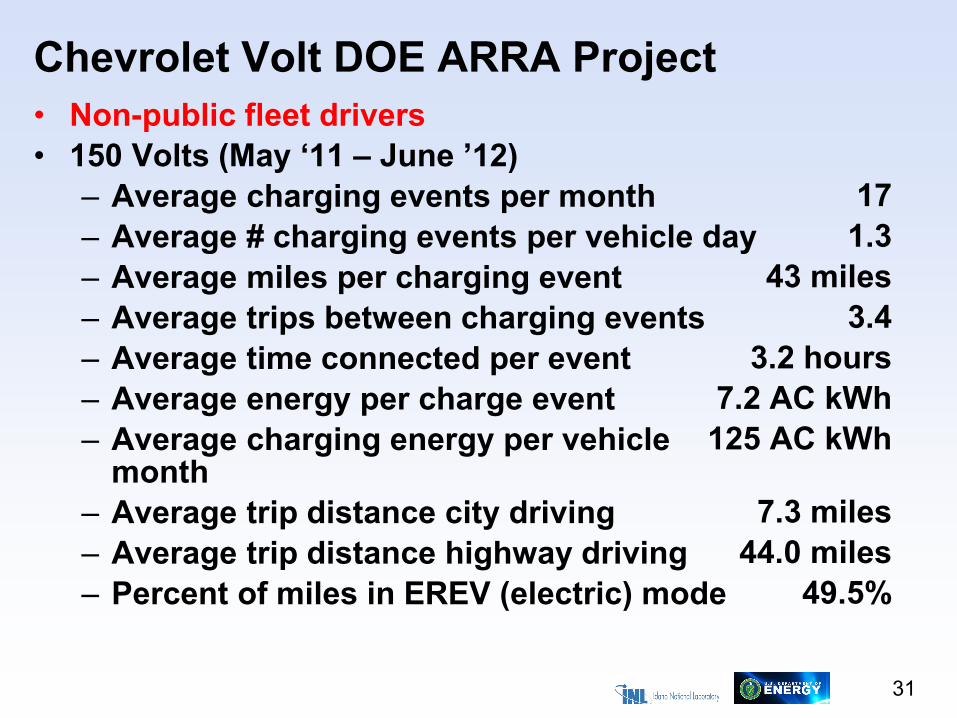
Chevrolet Volt DOE ARRA Project • Non-public fleet drivers • 150 Volts (May ‘11 – June ’12)
– Average charging events per month – Average # charging events per vehicle day – Average miles per charging event – Average trips between charging events – Average time connected per event – Average energy per charge event – Average charging energy per vehicle
month – Average trip distance city driving – Average trip distance highway driving – Percent of miles in EREV (electric) mode
17
1.3 43 miles
3.4 3.2 hours
7.2 AC kWh 125 AC kWh
7.3 miles
44.0 miles 49.5%

32
• 21 Ford Escape PHEVs • Fleet drivers • Nov 09 to July 12 • 529,000 test miles • All trips, 38 mpg, 100
AC & 68 DC Wh/mi • Charge Depleting (CD),
52 mpg & 163 DC Wh/mi. 29% of all miles
• Charge Sustaining (CS), 31 mpg. 28% of all miles
• Charging = 68% overall increase in mpg when comparing CD to CS trips
Ford Escape Adv. Research Vehicle
33
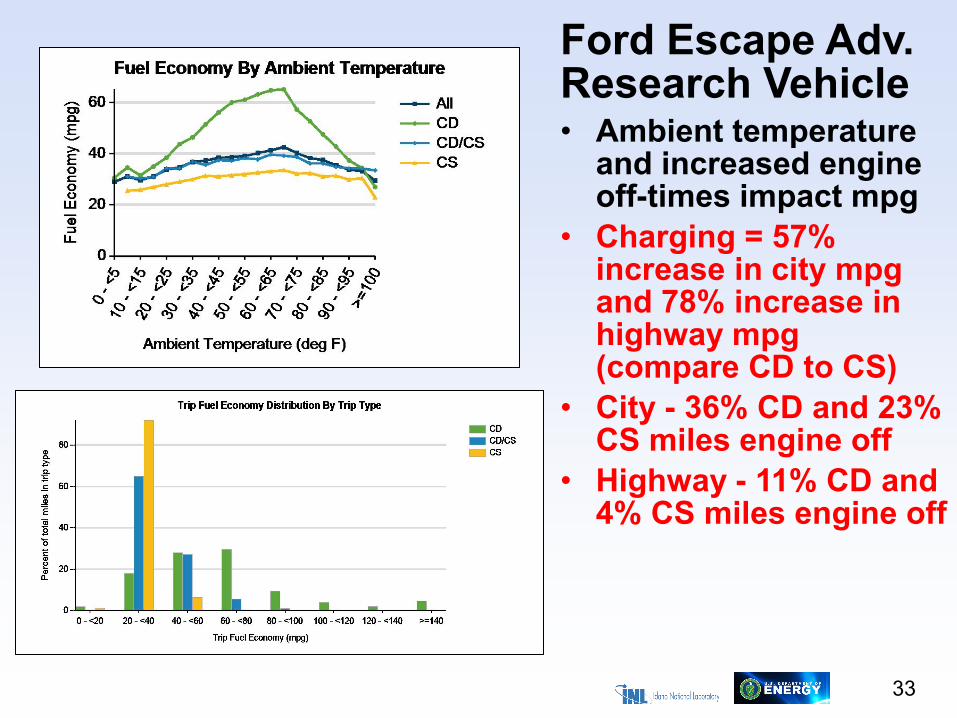
• Ambient temperature and increased engine off-times impact mpg
• Charging = 57% increase in city mpg and 78% increase in highway mpg (compare CD to CS)
• City - 36% CD and 23% CS miles engine off
• Highway - 11% CD and 4% CS miles engine off
Ford Escape Adv. Research Vehicle

34
• 109 Ram PHEVs • Fleet drivers • July 2011 to May 2012 • 815,000 test miles • All trips, 19 mpg, 100
AC & 69 DC Wh/mi. 44 DC Wh/mi captured by regenerative braking
• CD, 23 mpg & 210 DC Wh/mi
• CS, 17 mpg • Charging = 35% overall
increase in mpg when comparing CD to CS trips
Chrysler Ram PHEV Project

35
• Rams in fleet applications • Vehicle driving 16% time engine stopped • Vehicle stopped 23% time engine stopped • 64.1 miles per charge event • 7.0 trips per charge event • 0.89 charge events per vehicle day • 2.4 average hours per charge event • 6.4 AC kWh average energy / charge
Chrysler Ram PHEV Pickups
36
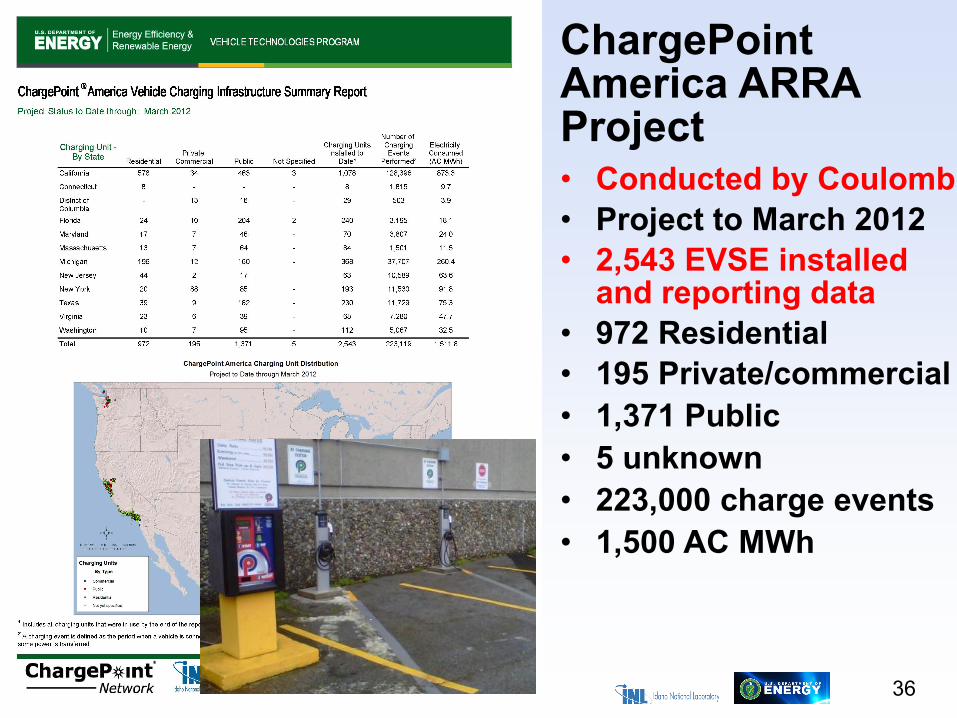
ChargePoint America ARRA Project • Conducted by Coulomb • Project to March 2012 • 2,543 EVSE installed
and reporting data • 972 Residential • 195 Private/commercial • 1,371 Public • 5 unknown • 223,000 charge events • 1,500 AC MWh

37
ChargePoint America ARRA Project • Feb & March 2012 data • 67,000 charge events • Percent time vehicle
connected • Residential 51% • Private/com 29% • Public 7%
• Percent time drawing power • Residential 16% • Private/com 9% • Public 4%
• EVSE data only

38
Additional PEV and Infrastructure Testing • Conducting testing of “dumb” and “smart” EVSE • Initiated wireless charging test program • Initiated field and lab DC Fast and Level 2 charging study
of impacts on battery life in 6 vehicles • Conducting first responders training program with the
National Fire Prevention Association and NHTSA • Battery mule test vehicle provides field testing of traction
battery packs at any power and efficiency level • 20 Quantum PHEV Escape conversions in benchmarking • Additional EVSE providers are also providing charging
data to INL

39
EV Project Summary To Date • EV Project vehicles connected much longer than needed
to recharge - opportunities to shift charging times • Significant residential Level 2 EV Project charging occurs
off-peak with charge-starts occurring at the midnight starts of super off-peak TOU kWh rates
• Significant opportunities to fully understand how the public uses public versus non-public infrastructure
• Revenue models for public charging are currently being introduced – impacts?
• Only about 30% of EV Project data collected to date • “Normal” research project process requires:
– Design and execute the project, data collection completed, data analyzed, and finally, reports issued at completion of experiment
• INL/ECOtality needs to completely collect all data before definitively reporting seasonal trends and behaviors
40
Future EV Project Data Analysis Subjects • Pricing elasticity – TOU rate influences? • Regional and seasonal demographics and charging
behaviors? • Density of residential and non-residential EVSE as input
to local micro distribution studies – transformer failures? • Charge control preferences – vehicle, Blink and web
based, and scheduled versus random? • Rich public versus non-rich public EVSE charging
behaviors? • Level 2 EVSE versus DCFC behaviors? • Travel corridor versus convenience charging at stores? • Length of vehicle ownership and miles per day / week /
charge? • Non-residential subcategories (public and work parking)? • Etc., etc., etc.?
41
More Information http://avt.inl.gov
This presentation will be posted in the publications
section of the above website
This work is supported by the U.S. Department of Energy’s EERE Vehicle Technologies Program
This presenter is very grateful for DOE’s support and the contributions of all the testing partners
Acknowledgement
INL/MIS-12-26977