us market overview & insights
TRANSCRIPT

US MARKET OVERVIEW & INSIGHTS
OFFSHOREWINDUS.ORG

BUSINESS NETWORK FOR OFFSHORE WIND
01 Not-for-Profit02 Focus on developing US offshore wind and its supply chain03 Provide: Information, Education, Introductions
OF
FSH
OR
EW
IND
US
.OR
G

US OSW STRUCTURE
STATESPolicy, market drivers, regulations
US BOEM / US BSEELeasing and approval of plans, regulators
PRIVATE DEVELOPERS / LEASEESAcquire lease rights and develop projects
OF
FSH
OR
EW
IND
US
.OR
G
BUSINESS NETWORK OSW

STATES DRIVE MARKET CREATIONRPS Policies Have Been One Key Driver for RE Generation Growth RPS requirements constitute roughly half of total U.S. RE growth since 2000
13
Growth in Non-Hydro Renewable Generation: 2000-2017
Notes: Minimum Growth Required for RPS excludes contributions to RPS compliance from pre-2000 vintage facilities, and from hydro, municipal solid waste, and non-RE technologies. This comparison focuses on non-hydro RE, because RPS rules typically allow only limited forms hydro for compliance.
• Total non-hydro RE generation in the U.S. grew by 332 TWh since 2000– Many factors contributed to that growth (tax credits,
other incentives, cost declines, etc.)
• RPS policies required 150 TWh increase over the same period (45% of total RE growth)– Not strict attribution: some of that would have
occurred without RPS
• RE growth outside of RPS’s associated with:– Voluntary green power markets, including corporate
procurement– Net metering– Economic utility purchases
332
150
0
50
100
150
200
250
300
350
2000
2001
2002
2003
2004
2005
2006
2007
2008
2009
2010
2011
2012
2013
2014
2015
2016
2017
TWh Actual Growth inU.S. Non-Hydro RE
Generation Since 2000
Minimum RequiredGrowth for RPS
OF
FSH
OR
EW
IND
US
.OR
G

OH
EMPIRE WIND (EQUINOR)
MAYFLOWER (EDPR/SHELL)
EQUINOR
VINEYARD WIND [800 MW]
REVOLUTION WIND (ØRSTED) [600 MW]
BLOCK ISLAND WF (ØRSTED) [30 MW]
SOUTH FORK (ØRSTED) [90–130 MW]
BAY STATE WIND (ØRSTED)
1
2
3
4
VINEYARD WIND
1. FAIRWAYS NORTH 3. HUDSON NORTH 2. FAIRWAYS SOUTH 4. HUDSON SOUTH
ATLANTIC SHORES (EDF/SHELL)
OCEAN WIND (ØRSTED)
GARDEN STATE OFFSHORE ENERGY (ØRSTED)
SKIPJACK WF (ØRSTED) [120 MW]
US WIND (MD) [248 MW]
DMME RESEARCH AREA
DOMINION
AVANGRID RENEWABLES
OAHU NORTH CALL AREA
MORRO BAY CALL AREA
HUMBOLDT CALL AREA
OREGON STATE UNIVERSITYWAVE ENERGY TEST SITE PROPOSED LEASE AREA
DIABLO CANYON CALL AREA
OAHU SOUTH CALL AREA
EAST COASTVineyard Wind [800 MW]
Block Island Wind Farm (Ørsted) [30 MW]
Revolution Wind (Ørsted) [600 MW]
South Fork (Ørsted) [90–130 MW]
Equinor
Mayflower (EDRP/Shell)
Vineyard Wind
Bay State Wind (Ørsted)
Fairways North / South
Hudson North / South
Empire Wind (Equinor)
Atlantic Shores (EDF/Shell)
Ocean Wind (Ørsted)
Garden State Offshore Energy (Ørsted)
Skipjack Wind Farm (Ørsted) [120 MW]
US Wind (MD) [248 MW]
DMME Research Area
Dominion
Avangrid Renewables
WEST COASTOregon State University Wave Energy Test Site
Proposed Lease Area
Humboldt Call Area
Morro Bay Call Area
Diablo Canyon Call Area
Oahu North Call Area
Oahu South Call Area
© 2019 BUSINESS NETWORK FOR OFFSHORE WIND ALL RIGHTS RESERVED
Information courtesy of BOEMboem.gov/Renewable-Energy/
Not to Scale
US OFFSHOREWIND MARKETBUSINESS NETWORK FOR OFFSHORE WIND
UNLEASED PRIMARY SECONDARY
LEASED
FINANCIAL MECHANISM SECURED

UNLEASED PRIMARY SECONDARY
LEASED
FINANCIAL MECHANISM SECURED
NC
VA
RI
DE
NJ
PA
NY
MA
CT
MD
U.S. OFFSHOREWIND MARKET
BUSINESS NETWORK FOR OFFSHORE WIND
FAIRWAYS NORTH 34FAIRWAYS SOUTH
HUDSON NORTHHUDSON SOUTH
12
1
2
4
3
MAYFLOWER (EDPR/SHELL)EQUINORVINEYARD WIND [800MW]
BAY STATE WIND (ØRSTED)VINEYARD WIND
REVOLUTION WIND FARM (ØRSTED) [600MW]
SOUTH FORK WIND FARM (ØRSTED) [90-130MW]BLOCK ISLAND WIND FARM (ØRSTED) [30MW]
EMPIRE WIND (EQUINOR)ATLANTIC SHORES (EDF/SHELL)OCEAN WIND (ØRSTED)GARDEN STATE OFFSHORE ENERGY (ØRSTED)SKIPJACK WIND FARM (ØRSTED) [120MW]US WIND (MD) [248MW]
DOMINIONDMME RESEARCH AREAAVANGRID RENEWABLES

0
2K
4K
6K
8K
10K
12K
14K
16K
18K
20K
22K
201920182017201620152014
Total Megawatts in the United States
30 MW 30 MW 456 MW
10,370 MW
20,970 MW
The trends of sum of Megawatts and sum of Megawatts for year
Meg
awat
ts
US MARKET PIPELINE GROWTHO
FFS
HO
RE
WIN
DU
S.O
RG

OF
FSH
OR
EW
IND
US
.OR
G
21 GW15US offshore wind lease areas equalling potential
2019/07/19
APPROVED / NY, MD, MA, CT, RI5.1 GW
PENDING / OH, MA, CT1,330—2990 MWs
COMPLETED / RIBlock Island Wind FarmAmerica’s first offshore wind farm
Massachusetts offshorewind price
6.5¢kWh
New Jersey offshorewind price
9¢kWh
Maryland offshorewind price
13¢kWh
by 203520 GW
present offtake agreements5 GW
invested4th quarter 2018
$1B
181,000 jobs by 2050

SUPPLY CHAIN CAPACITY
CHALLENGES
TurbineManufacture
Rotor
Nacelle
Tower
Foundations
Cables
OffshoreSubstation
OnshoreElectrical
Foundations
CablesTurbine
OffshoreSubstation
Operations
Maintenance
OnshoreElectrical
EnvironmentalSurvey
SeabedSurvey
Met Mast
DevelopmentServices
Other PlantManufacture
Installation &Commissioning
Operations &Maintenance
Development &Consenting
GRID AND TRANSMISSION
OF
FSH
OR
EW
IND
US
.OR
G
Royal IHC

OFFS
HOREW
INDUS.O
RG
OSW POLICY CHALLENGES
Grid and Transmission
Jones Act
Expiring ITC
Local Content
OFFS
HOREW
INDUS.O
RG
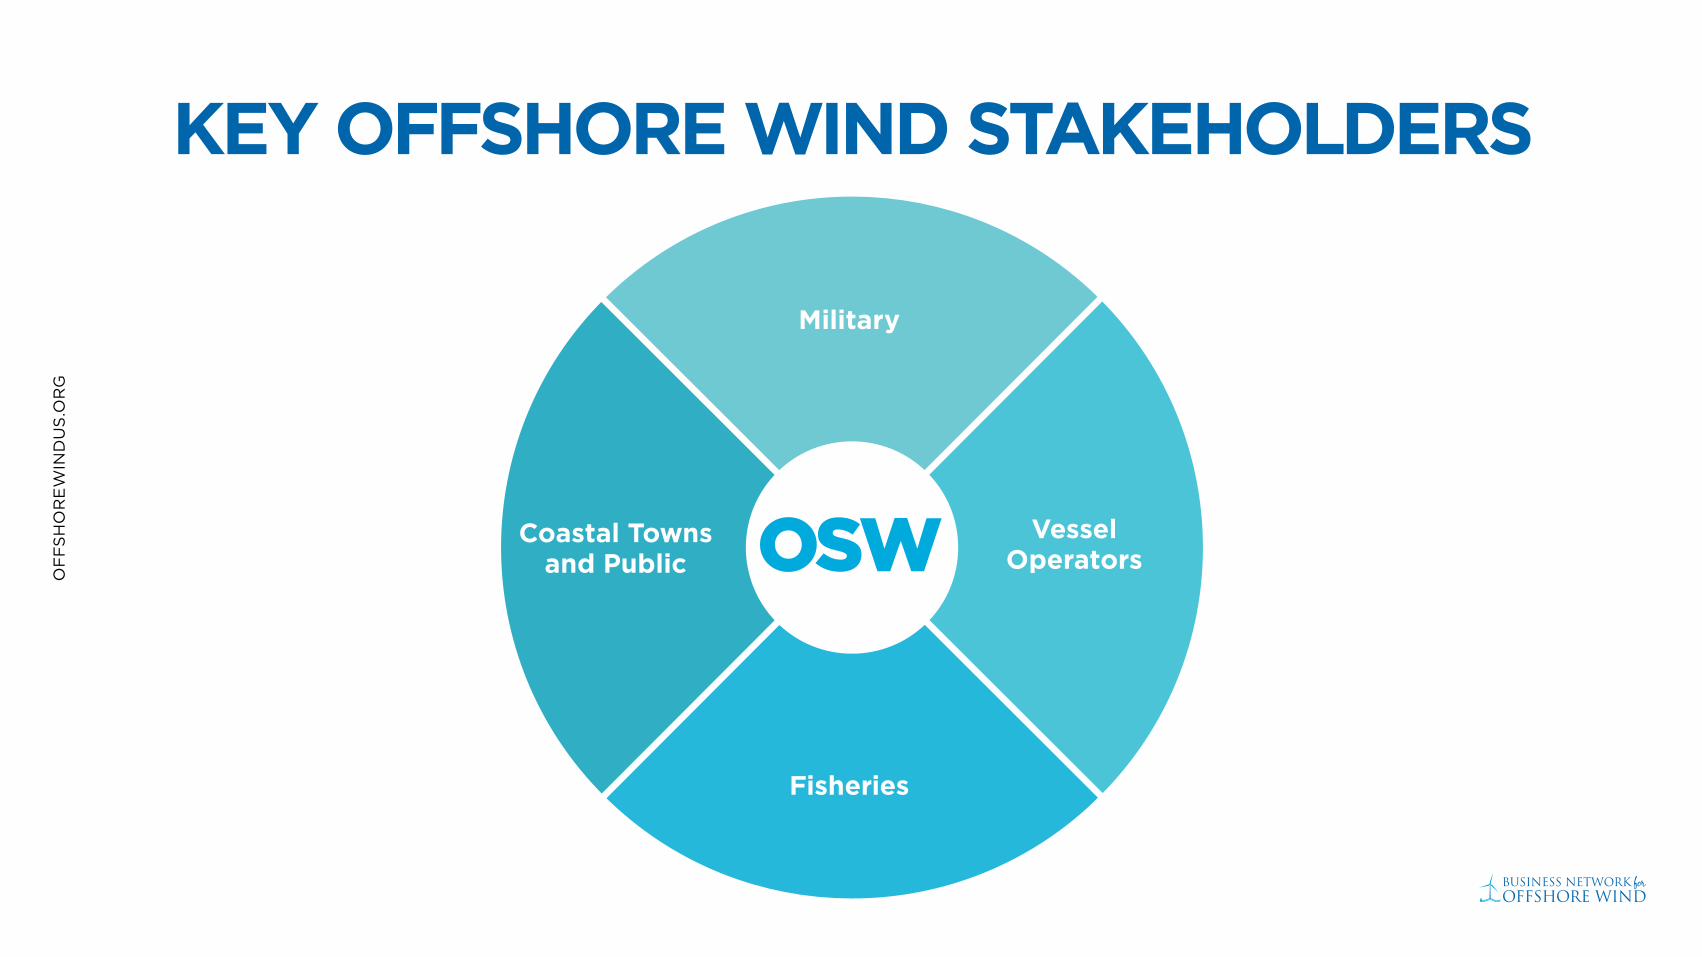
KEY OFFSHORE WIND STAKEHOLDERS
OSW
Military
VesselOperators
Fisheries
Coastal Townsand Public

whyoffshorewind.org
OFFS
HOREW
INDUS.O
RG
WHY OFFSHORE WIND? whyoffshorewind.org

LIZ BURDOCKPRESIDENT & CEOBUSINESS NETWORK FOR OFFSHORE [email protected] / 443.652.3242
offshorewindus.org
business network for offshore wind
@offshorewindus
business network for offshore wind
OF
FSH
OR
EW
IND
US
.OR
G