use of flame atomic absorption spectroscopy and ...use of flame atomic absorption spectroscopy and...
TRANSCRIPT

American Journal of Analytical Chemistry, 2013, 4, 348-359 http://dx.doi.org/10.4236/ajac.2013.47044 Published Online July 2013 (http://www.scirp.org/journal/ajac)
Use of Flame Atomic Absorption Spectroscopy and Multivariate Analysis for the Determination of Trace
Elements in Human Scalp
Sayo O. Fakayode*, Sri Lanka Owen, David A. Pollard, Mamudu Yakubu Department of Chemistry, Winston-Salem State University, Winston-Salem, USA
Email: *[email protected]
Received June 7, 2013; revised July 1, 2013; accepted July 11, 2013
Copyright © 2013 Sayo O. Fakayode et al. This is an open access article distributed under the Creative Commons Attribution Li- cense, which permits unrestricted use, distribution, and reproduction in any medium, provided the original work is properly cited.
ABSTRACT
The analysis of trace elements in human hair for use as biomarkers continues to generate considerable interest in envi- ronmental and bioanalytical studies, medical diagnostics, and forensic science. This study investigated the concentra- tions of essential and toxic elements (Fe, Mg, Ca, Cu, Zn, Cr, Cd, and Pb) using flame atomic absorption spectroscopy (FAAS) in human scalp hair obtained from subjects living in Forsyth County, North Carolina, USA. The influence of age, sex, race, and smoking habits on the levels of trace elements in the hair samples were also investigated. Addition- ally, analyses were subjected to a statistical, regression, and principal component analysis to evaluate inter-elemental association and possible pattern recognition in hair samples. Furthermore, Ca/Mg and Zn/Cu ratios, which are often used to evaluate the degree of Ca and Cu utilization in humans and as markers for various health related issues includ- ing, atherosclerosis, hypertension, insulin sensitivity, and pancreatic cancer, were calculated. The overall mean concen- trations of Fe (25 µg/g), Ca (710 µg/g), Mg (120 µg/g), Zn (190 µg/g), Cu (12 µg/g), and Cr (0.20 µg/g) were found in hair samples. The trace element concentrations varied widely in hair samples as demonstrated by large range of concen- trations obtained for each element. However, levels of Cd and Pb elements of <0.030 µg/g were detected in hair sample. In general, the levels of the trace elements in hair samples were poorly correlated. However, significant correlations were found between Ca and Mg (r = 0.840, p = 0.05). The levels of Fe, Ca, Mg, Zn, Cu, and Cr in hair samples and the calculated Ca/Mg and Zn/Cu ratios were found to be largely correlated with age, race, sex, and smoking habits. Keywords: Human Scalp Hair; Biomonitoring; Trace Element Concentration; Flame Atomic Absorption Spectroscopy;
Regression and Principal Component Analysis; Inter-Element Association
1. Introduction
Trace elements, including Fe, Ca, Mg, Zn, and Cu, play critical roles in proper human body development and me- tabolic activity [1-3]. For example, Fe is required in the diet for proper functioning of the liver and hemoglobin, a protein in humans primarily responsible for the transpor- tation and distribution of oxygen from the lungs to vari- ous human organs [3]. Iron is also a critical component of myoglobin, an oxygen storing heme protein residing in the cell and is responsible for the color of meat [4-7]. Iron deficiency may result in insomnia, stunted growth, decreased immune function and inhibition of hemoglobin synthesis, particularly in women and children, resulting in anemia [8,9]. Calcium and magnesium are necessary for effective teeth and bone structure development, fa-
cilitating transmission of nerves impulses, carbohydrate and protein metabolism, activation of various enzymatic reactions, and enhancement of the absorption of phospho- rus and vitamins [3]. Zinc and copper promote normal body metabolism, are critical in normal genetic expres- sion, and are essential co-enzymes, catalyzing various en- zymatic reactions [1,10]. These trace elements are requir- ed at certain concentrations which can be primarily ob- tained from sufficiently balanced diet and food supple- ments.
In contrast, heavy metals such as Pb and Cd are non essential elements and their presence in the human body can be harmful, with serious health consequences. For in- stance, health hazards, including reduction of child intel- ligence quotients, hypertension, depression, mental disor- ders, cancer diseases, and deoxyribonucleic acid damage *Corresponding author.
Copyright © 2013 SciRes. AJAC

S. O. FAKAYODE ET AL. 349
have been associated with heavy metals at high concen- trations [11-15]. Humans are often exposed to heavy me- tals through various routes, including the consumption of heavy metal contaminated foods or water, occupational exposure in working environments, lead paints, contami- nated toys, industrial activity, vehicular emissions, and environmental exposure [16-30]. The critical role of es- sential elements in normal metabolic activity and the po- tential negative health consequences of toxic heavy met- als necessitate the need for routine biomonitoring of the levels of trace metals elements.
Toward these efforts, various studies have utilized a wide range of human specimens including, human serum, blood, tissues, urine, and saliva as biomarkers for effec- tive biomonitoring of trace element concentrations [31- 35]. However, these biomarkers have some major draw- backs including, sample susceptibility to contamination, sample decomposition, and instability. Additionally, some human specimens may involve invasive sample collec- tion. Human scalp hair has lately become more prefer- able to the analysis of traditional human specimens be- cause many trace elements are more concentrated with longer residence times in hair compared to other human specimens. Besides, hair samples are easy to collect, non- invasive, easy to store, and relatively inexpensive. Thus, human hair samples have been effectively used as bio- markers for the determination of trace element concentra- tions in environmental and bioanalytical studies, clinical and medical diagnosis, occupational health, recreational and therapeutic use, and forensic science [36-56].
We hypothesized that the combined use of analytical spectroscopy, multivariate analysis, statistics, and human scalp hair can be utilized to map the level of essential and potentially toxic trace elements in human subjects. We also hypothesized that race would possibly influence the level of trace elements in the scalp hair of human sub- jects. Consequently, this study reports for the first time, a comprehensive and combined use of analytical spectros- copy, statistics, multivariate analysis, and human scalp hair as a biomarker for assessing trace element (Fe, Mg, Ca, Cd, Pb, Cu, Zn, and Cr) concentrations in human subjects. The study also reports for the first time, the in- fluence of race on the levels of trace element concentra- tions and the use of multivariate analysis for trace ele- ment pattern recognition in scalp hair of human subjects. Furthermore, the study reports for the first time the in- fluence of race, age, race, sex, on the Ca/Mg and Zn/Cu ratios (which are often used to evaluate the degree of Ca and Cu utilization in human and markers for various health related issues including, atherosclerosis, hyperten- sion, insulin sensitivity, and pancreatic cancer) in the scalp hair of human subjects.
2. Materials and Methods
2.1. Sample Collection and Sample Preparation
Human scalp hair samples were collected in three cities (Winston-Salem, Clemmons, and Kernersville) in For- syth County, North Carolina, USA. Forsyth County is 409.60 square miles in area, with a population of 350,670 [57]. Females and males account for 52% and 48%, re- spectively of the population. In addition, people under 18 years of age account for 24.6% of the sample population while those older than 18 years are make-up of 73.4% of the population in Forsyth County. The demographic racial composition of Forsyth County consists of Caucasians (majority 62.3%) and non-Caucasians (minority, 37.7%). Non-Caucasians were made up of African Americans, 26%; Hispanics, 11.9%; and Asians, 1.9%. Scalp hair sam- ples were collected from 125 participants using stainless steel scissors during regular haircut periods at various barber shops and beauty salons over a period of three weeks in June 2011. The sample population consists of 60 males and 65 females aged between 5 and 70 years old. In addition, the hair samples were collected from dif- ferent races and demographics consisting of Caucasian (n = 87) and non-Caucasians (n = 38). Non-Caucasians were made up of African Americans, Hispanics, and Asi- ans. Only eighteen of the people from whom hair sam- ples were collected declared themselves as tobacco pro- duct smokers while 107 identified themselves as non- smokers.
The collected hair samples were immediately placed in cleaned polyethylene plastic bags, properly labeled, and transported to a dust free laboratory, where the samples were sequentially washed with acetone and ethanol, and thoroughly rinsed with deionized water to remove phar- maceutical products, particulates, and other exogenous materials. The washed hair samples were subsequently dried in an oven at 90˚C for approximately 20 minutes and stored in pre-nitric acid washed Teflon sample con- tainers. Approximately 1.0 g of dried hair sample from each participant was accurately weighed and digested with 15 mL HNO3 (trace metal grade, purity, 99.999%) in a digestion flask. Hair sample digestions were initiated at relatively low temperatures to prevent a violent reac- tion until all the hair samples were fully dissolved in the nitric acid. The temperature was then subsequently in- creased until the solution turned pale yellow to ensure complete sample digestion. The nitric acid digested hair samples were filtered into a 25 mL volumetric flask us- ing a Whatman filter paper (ashless) and diluted to the mark with deionized water.
2.2. Calibration Curve, Trace Element Analysis, Method Validation, and Quality Assurance
Working range standard solutions used to construct cali-
Copyright © 2013 SciRes. AJAC

S. O. FAKAYODE ET AL.
Copyright © 2013 SciRes. AJAC
350
bration curves for each element were prepared by serial dilution of 1000 ppm standard stock solutions of each element purchased from Fisher Scientific. The calibration curve for each element was constructed by plotting the absorbance obtained from FAAS analysis of the standard solution versus the element concentration. The nitric acid digested hair samples were subjected to trace element analysis using a flame atomic absorption spectrophoto- meter (Shimadzu, AA-6300) using a pre-mixed burner air-acetylene flame. The flow rates of the fuel and oxi- dant gases were always carefully optimized for each me- tal analysis. Other routine instrumental checks and cali- brations were always performed on the spectrometer be-fore use to ensure the accuracy, reliability and consistent performance of the spectrometer. Each sample was ana- lyzed in triplicate and the averages of the trace element concentrations in the hair samples were calculated using the constructed calibration curves and listed in Table 1. All necessary precautions were also observed to ensure the accuracy of the results of this study. First, the acetone and ethanol used for the hair wash were of spectroscopic grade. Second, the highest purity HNO3 acid (purity, 99.999%) was used for the hair digestion and standard solution preparations. Also, all glassware including the sample containers, digestion flasks, and volumetric flasks were pre-soaked in 6M nitric acid for three days and tho- roughly rinsed with deionized water before use to re- move impurities and contaminants. Additionally, all trace element sample analyses were blank subtracted.
A recovery study was also performed for each metal to further evaluate the accuracy and reliability of the results of the heavy metal concentrations obtained in the analysis. The recovery study was performed by randomly spiking ten previously analyzed hair samples with a known con- centration of metal standard solution. The spiked samples were then subjected to HNO3 digestion and metal analy- sis procedures under the same experimental conditions as previously used for hair sample analysis. The recovery of the metals in the spiked samples was evaluated by com-
paring the known concentration of the spiked metal with the concentration detected using FAAS spectrometer.
2.3. Multivariate Analysis: Regression and Principal Component Analysis
Linear regression and multivariate principal component analysis for pattern recognition of the levels of the metals in human scalp hair was performed using chemometric software (The Unscrambler, CAMO Inc., 9.4).
3. Results and Discussion
3.1. Calibration Curves
Table 1 presents the results of the calibration curve pa- rameters constructed for the investigated trace elements in the hair samples. The table indicates the wavelength used for the AAS elemental analysis, the limits of detec- tion (LOD), and limits of quantitation (LOQ) of the trace elements analyzed. The LOD, which is defined as the minimum detectable amount of metal, was calculated us- ing the equation: LOD = 3 s/m; where s is the signal of the blank and m is the slope of the calibration curve. The limit of quantitation, defined as the lowest measurable concentration of analytes (trace elements in this study), was evaluated using the formula: LOQ = 10 s/m. The pa- rameters used to calculate LOQ were as previously de- fined for LOD. The high values of the correlation coeffi- cients (r) obtained in Table 1 demonstrate good linear correlation of the absorbance with trace element concen- trations.
3.2. Overall Trace Element Concentration in Hair Samples
The overall mean, maximum, and minimum of each trace element concentrations in hair samples are shown in Ta- ble 2. The trace of the element concentrations varied wide- ly in the hair samples as demonstrated by the large range of trace element concentrations. The order of the mean trace
Table 1. Linear regression equation, linear correlation coefficient (R) of calibration curves, wavelength of detection, limit of detection (LOD), and limit of quantitation (LOQ) obtained for each element.
Element Regression equation R Wavelength (nm) LOD (µg/g) LOQ (µg/g)
Fe y = 0.0040x + 0.0048 0.999 248.3 0.080 0.25
Cd y = 0.087x + 0.29 0.973 228.8 0.030 0.11
Ca y = 0.026x + 0.0014 0.999 422.7 0.010 0.040
Zn y = 0.080x + 0.77 0.922 213.9 0.030 0.13
Cu y = 0.092x + 0.055 0.999 309.93 0.030 0.12
Pb y = 0.0097x + 0.0029 0.998 283.3 0.030 0.10
Mg y = 0.060x + 1.6 0.998 285.2 0.050 0.16
Cr y = 0.0065x + 0.0048 0.981 357.9 0.050 0.16

S. O. FAKAYODE ET AL. 351
Table 2. Overall average of trace element concentration in human hair.
Concentration (µg/g)
Fe Ca Cd Zn Cu Mg C Pb
Average 25 710 <0.03 190 12 120 0.20 <0.030
Maximum 460 3900 <0.03 800 140 710 4.5 <0.030
Minimum 6.2 2.1 <0.03 0 0 0 0 <0.030
element concentrations in the hair sample is Ca > Zn > Mg > Fe > Cu > Cr. Overall mean concentrations of Ca (710 µg/g), Zn (190 µg/g), Mg (120 µg/g), Fe (25 µg/g), Cu (12 µg/g), and Cr (0.20 µg/g) were found in the hair samples. Similar trace element concentrations found in this study have been reported in human scalp hair in Pa- kistan, Russia, Spain, Tanzania, and China [36,47,52,55, 56]. The levels of Cd and Pb concentrations were below the detection limits (<0.030 µg/g) of the instrument in the hair samples. Unquestionably, the use of a more sensitive analytical instrument such as a graphite atomic absorp- tion or an inductively coupled plasma atomic spectrome- ter will be required for Cd and Pb detection at ultra-low concentrations.
3.3. Trace Element Concentration by Race and Sex
The populations were subdivided into two race categories, the Caucasians (majority) and Non-Caucasians (minority) comprising of African Americans, Hispanics, and Asians. The trace element concentrations by race and sex are shown in Tables 3 and 4, respectively. Overall mean levels of Fe (27 µg/g), Ca (750 µg/g), Mg (140 µg/g), Zn (200 µg/g), Cu (14 µg/g), and Cr (0.18 µg/g) were ob- tained in Caucasians. In contrast, corresponding mean levels of Fe (22 µg/g), Ca (631 µg/g), Mg (87 µg/g), Zn (163 µg/g), Cu (6.1 µg/g), Cr (0.24 µg/g) were obtained in non-Caucasians. To evaluate the differences between the mean trace element concentrations obtained in Cau- casians and non-Caucasians, the mean trace element con- centrations obtained for the two race categories were subjected to a statistical student t-test analysis. At a 90% confidence level, there were no significant differences (t < 1.645, p = 0.01) between the trace element concentra- tions obtained between Caucasians and non-Caucasians. However, at a 50% confidence level, there were signifi- cant differences between the mean concentration of Ca (tcal 0.84, ttab 0.674), Zn (tcal, 1.602, ttab 0.674), Cu (tcal, 1.50, ttab 0.674), and Mg (tcal = 1.574, ttab = 0.674) ob- tained in Caucasians and non-Caucasians.
Trace element concentrations were also found to be gender dependent. Generally, the mean levels of all trace elements were significantly higher in females compared
Table 3. Trace elements concentration by race.
Concentration (µg/g)
Fe Ca Cd Zn Cu Mg Cr Pb
Caucasian (n = 87)
Average 27 750 <0.030 200 14 140 0.18 <0.030
Maximum 460 3400 <0.030 820 140 710 3.7 <0.030
Minimum 6.9 34 <0.030 0 0 0 0 <0.030
Non-Caucasian (n = 38)
Average 22 631 <0.030 163 6.1 87 0.24 <0.030
Maximum 170 3900 <0.030 567 61 639 4.5 <0.030
Minimum 6.2 2.1 <0.030 0 0 0 0 <0.030
Table 4. Trace element concentration by sex.
Concentration (µg/g)
Fe Ca Cd Zn Cu Mg Cr Pb
Male (n = 60)
Average 18 330 <0.030 167 4.034 27 0.080 <0.030
Maximum 170 1900 <0.030 820 51.82 230 3.2 <0.030
Minimum 6.6 2.1 <0.030 0 0 0 0 <0.030
Female (n = 65)
Average 32 1100 <0.030 210 19 210 0.31 <0.030
Maximum 460 3900 <0.030 560 140 710 4.5 <0.030
Minimum 6.2 36 <0.030 0 0 0 0 <0.030
to males. The mean Fe level of 32 µg/g found in females was approximately twice the average level of Fe (17.80 µg/g) obtained in males. Also, the mean level of Mg (210 µg/g) obtained in females was 7 time higher than the cor- responding mean Mg (27) level found in males. Also, the mean levels of Zn (210 µg/g), Cu (19 µg/g), and Cr (0.31 µg/g) were considerably higher than the mean levels of Zn (170 µg/g), Cu (4.0 µg/g), and Cr (0.080 µg/g), re- spectively obtained in males. Interestingly, at the 90% confidence levels, the concentration of Fe, Ca, Zn, Cu, Mg, and Cr obtained in males were significantly and sta- tistically different (t > 1.645) from the corresponding level of Fe, Ca, Zn, Cu, Mg, and Cr obtained in females. At the 95% confidence level, the concentration of Ca (tcal, = 6.618, ttab 1.960), Zn (tcal, 2.047, ttab 1.960), Cu (tcal, 3.107, ttab 1.960), and Mg (tcal, 24, ttab 1.960) obtained in males were also considerably different from the corre- sponding level found in women, demonstrating the in- fluence of sex on the trace element concentration in hu- man subjects.
Copyright © 2013 SciRes. AJAC

S. O. FAKAYODE ET AL. 352
3.4. Effect of Smoking Habits on Trace Element Concentration
A summary of the levels of trace element concentrations found in the scalp hair of smokers and non-smokers are shown in Table 5. In general, the mean levels of Ca (550 µg/g) and Mg (77 µg/g) in smokers were less than the mean levels of Ca (740 µg/g) and Mg (130 µg/g) found in non-smokers. Also, the levels of Cu (2.5 µg/g), Zn (170 µg/g), and Cr (0.14 µg/g) found in smokers were relatively less than the corresponding levels of Cu (13 µg/g), Zn (190 µg/g), and Cr (0.21 µg/g) found in non- smokers. Other studies have reported similar low con- centrations of Ca, Mg, Cu, and Zn in smokers scalp hair compared to non-smokers in Poland [50]. However, at 95% confidence level, the mean level of Fe (40 µg/g) found in smokers in this study was statistically and sig- nificantly higher than the corresponding mean Fe level of 23 µg/g obtained in non-smokers (tcal 2.12, ttab 1.960).
3.5. Trace Element Concentration by Age
To evaluate the effect of age on trace element concentra- tion, the sample populations were subdivided into two age group categories. The first age group category con- sists of people between 1 - 20 years old (n = 29), while the second age group category is made up of people 21 years and older (n = 96). Table 6 shows the results of the trace element concentrations by age. The concentrations of Fe ranged between 6.9 µg/g and 220 µg/g in the 1 - 20 years old age group while the concentrations of Fe ranged between 6.155 µg/g and 460 µg/g in people 21 years and older. There was no significant difference be- tween the mean Fe level of 26 µg/g obtained in 1 - 20 years old age group and mean Fe level of 25 µg/g ob- tained in people 21 years and older. However, at the 95% confidence level, a considerably higher mean Ca con- centration of 800 µg/g was obtained in 21 people years Table 5. Effect of smoking habit of trace element concen- tration.
Concentration (µg/g)
Fe Ca Cd Zn Cu Mg Cr Pb
Smokers (n = 18)
Average 40 550 <0.030 170 2.5 77 0.14 <0.030
Maximum 460 1600 <0.030 600 13 330 1.5 <0.030
Minimum 7.5 2.1 <0.030 0 0 0 0 <0.030
Non-smokers (n = 107)
Average 23 740 <0.030 190 13 130 0.21 <0.030
Maximum 220 3900 <0.030 820 140 710 4.5 <0.030
Minimum 6.2 31 <0.030 0 0 0 0 <0.030
Table 6. Trace elements concentration by age group.
Concentration (µg/g)
Fe Ca Cd Zn Cu Mg Cr Pb
Age 1 - 20 (n = 29)
Average 26 400 <0.030 200 20 50 0.21 <0.030
Maximum 220 1300 <0.030 360 140 300 3.2 <0.030
Minimum 6.9 36 <0.030 37 0 0 0 <0.030
Age 21 and older (n = 96)
Average 25 800 <0.030 180 9.3 140 0.20 <0.030
Maximum 460 3900 <0.030 820 130 710 4.5 <0.030
Minimum 6.2 2.1 <0.030 0 0 0 0 <0.030
and older as compared to a relatively low average Ca level of 400 µg/g obtained in the 1 - 20 years old age group (tcal 2.686, ttab 1.965). In addition, the mean level of Mg (142.4 µg/g) in older people is significantly higher than the mean Mg level of 50.11 obtained in the 1 - 20 years old age group (tcal = 2.780, ttab = 1.965). In addition, the level of Cu (19.61 µg/g) found in 1 - 20 years old age group was considerably higher than the Cu (9.3 µg/g) found in people 21 years and older (tcal = 2.27, ttab = 1.965). In contrast, there was no statistical difference between mean levels of Zn (200 µg/g) mean levels of Zn (180 µg/g) found in people 21 years and older (tcal = 0.863, ttab = 1.965). Also, there was no significant dif- ferent between the mean level of Cr of 0.21 µg/g and 0.20 µg/g, respectively, obtained in the 1 - 20 years old age group and older people (tcal = 0.034, ttab = 1.965). Results of the trace element concentrations in this study are similar to the trace element concentrations reported in young people in Spain [55].
3.6. Ca/Mg and Zn/Cu Ratio
The ratios of Ca/Mg and Zn/Cu in hair samples are often used to evaluate Ca absorption and Cu utilization in hu- mans. The ratios are also used as markers for various health related issues including, atherosclerosis, hyperten- sion diabetics, insulin sensitivity, and pancreatic cancer. The utilization and absorption of Ca is highly dependent on Mg concentration (Toba et al., 1999). In general, a low Ca/Mg ratio is preferred for proper bodily function and Ca metabolism. An ideal normal Ca/Mg ratio of 2 in humans has been suggested. At elevated Mg concentra- tions, the absorption of Ca is severely hindered [58]. More importantly, a high Ca/Mg concentration ratio has been as- sociated with various health issues, including, atherosclero- sis and hypertension [59,60]. Additionally, Ca/Mg imba- lances may lead to other health related issues such as di- abetics and alterations in insulin sensitivity [61] necessi-
Copyright © 2013 SciRes. AJAC

S. O. FAKAYODE ET AL. 353
tating the need to critically evaluate the Ca/Mg ratio in humans. Table 7 shows the Ca/Mg ratio in the hair sam- ples to be 5.9. The calculated Ca/Mg ratio was also found to depend on age, sex, race, and smoking habits. Gener-ally, the Ca/Mg ratio in older people is less than the Ca/ Mg ratio found in younger people. Also, non-Caucasians have a relatively larger Ca/Mg ratio of 7.2 compared to a Ca/Mg ratio of 5.5 found in Caucasians. The Ca/Mg ratio (12) found in males was twice the corresponding Ca/Mg ratio of 5.1 found in females. Smoking also seems to in- fluence the Ca/Mg ratio. The Ca/Mg ratio (7.2) in smok- ers is larger than the Ca/Mg ratio of 5.8 found in non- smokers. Other studies have also reported similarly hi- gher Ca/Mg ratios in hair samples of smokers compared to non-smokers [50].
Accurate knowledge of Zn to Cu concentration ratios in humans is also of critical health importance because a high Zn/Cu ratio may influence the utilization of Cu, resulting in Cu deficiency in the body. For example, re- duced erythrocyte copper-zinc superoxide dismutase ac- tivity at elevated Zn plasma concentrations has been re- ported [62]. Additionally, elevated Zn concentrations have been linked to significant reductions in Cu plasma caeru- loplasmin, serious anemia, and alterations in immune re- sponses and serum lipids [63-65]. Besides, an increase in the Zn/Cu ratio has been observed in pancreatic cancer patients compared to healthy humans [66].
The Zn/Cu concentration ratios in hair samples by age group, sex, race, and smoking habit are presented in Ta- ble 7. A higher Zn/Cu concentration ratio of 69 was found in smokers compared to Zn/Cu ratio of 14 found in non-smokers. The Zn/Cu ratio of 20 found in older peo- ple was also significantly larger than the Zn/Cu ratio of 10 observed in younger people. However, Caucasians have relatively low Zn/Cu ratio (14) compared to the Zn/ Cu ratio of 27 found in non-Caucasians. Also, a female’s scalp hair contained a low Zn/Cu ratio of 11 compared
Table 7. Ca/Mg and Zn/Cu.
Category Ca/Mg ratio Zn/Cu ratio
Younger people (1 - 20 years age group)
8.1 10
Older people (older than 21 years age group)
5.6 20
Caucasian 5.5 14
Non-Caucasian 7.2 27
Smokers 7.2 70
Non-smokers 5.8 14
Males 12 40
Females 5.1 11
Overall 5.9 16
with a high Zn/Cu ratio of 40 found in male scalp hair samples.
3.7. Analytical Method Validation and Recovery Study
Commercial human hair trace element reference stan- dards were not readily available, consequently a spike re- covery was performed to evaluate the accuracy of the re- sults obtained from this study. The results of the recovery study performed for each metal analysis in the hair sam- ples are presented in Table 8. Overall, the percentage re- covery of the metal analysis in the hair samples ranged between 95% and 104%. The percent recovery obtained in this study falls within the normal acceptable range of 90% - 110% for a good recovery study. The high percen- tage recovery obtained from the study validates the accu- racy of the method and the reliability of the levels of me- tal concentration in this study. In addition, the obtained high recovery demonstrates insignificant loss or addition of metals to the hair samples during the sample prepara- tion, sample digestion or instrumental metal analysis pro- cedures.
3.8. Linear Regression and Principal Component Analysis
To further gain a better insight and understanding of the inter-element association of trace elements in the scalp hair samples, the levels of trace elements were subjected to a linear regression and principal component analysis (PCA). Table 9 presents the summary of the correlation coefficients (r) of the inter-element associations in the hair samples. Generally, the levels of the trace elements in hair samples were poorly correlated. However, signi- ficant correlations were found between Ca and Mg (r = 0.840, p = 0.05). Poor correlation between the levels of trace elements in hair suggests that there may be no par- ticular common source of the trace elements in the hair. Table 8. Recovery study for FAAS metal analysis in hair samples.
Metal % Recovery
Pb 96.0
Cd 94.6
Fe 97.8
Ca 102.4
Mg 98.1
Zn 95.2
Cu 104.1
Cr 102.4
Copyright © 2013 SciRes. AJAC

S. O. FAKAYODE ET AL. 354
Table 9. Correlation coefficient (r) values of the association between trace elements in human hair samples.
11 1 21 2 31 3 11 n nPC P X P X P X L P X= + + + +
Fe Ca Mg Zn Cu Cr
Fe 0.171 0.092 0.035 0.037 0.154
Ca 0.171 0.840 0.174 0.105 0.044
Mg 0.092 0.840 0.217 0.102 0.055
Zn 0.035 0.174 0.217 0.082 0.050
Cu 0.037 0.105 0.102 0.082 −0.042
Cr 0.154 0.044 0.055 0.050 −0.042
Diet, eating habits, and the use of food supplements var- ies widely among people; therefore, people may obtain the required trace elements from diverse sources, result- ing in the poor correlation of trace elements in hair sam- ples. Similar poor inter-element associations in hair sam- ples have also been observed and reported elsewhere [66].
Principal component analysis is a modern chemomet- ric approach often employed for pattern recognition in a complex data set. PCA is often used to obtain hidden information that is not apparent from a conventional data analysis. Detailed mathematical discussions and proce- dures of PCA have been widely reported [67-69] and is beyond the scope of this study. In brief, PCA is usually performed by transforming the original data set or matrix from the initial coordinate system made up of n-variables into a new orthogonal coordinate system. The new vari- able space is typically composed of a smaller number of orthogonal vectors known as principal components (PCs). For example, a set of data with n-variables (n = 6 in this study, corresponding to the number of trace ele- ments determined in hair samples) will require an n-di- mensional coordinate system, known as variable space to represent it. The most vital assumption of multivariate analysis is that the directions with maximum variance in a data set are associated with useful information. Conse- quently, the first principal component (PC1) is drawn through the variable space in the direction of the maxi- mum variance in of the original data set. The second principal component (PC2) is then drawn through the data set in the direction of the next largest variance, so that PC1 and PC2 are orthogonal to each other. The third principal component (PC3) is subsequently drawn so that PC1, PC2, and PC3 are all orthogonal to each other. Thus, PC1, PC2, and PC3 now represent a set of vari- ance-scaled eigenvectors that provide a new orthogonal coordinate system on which the original data set can be represented. The individual principal components can be calculated as shown in Equation (1). Each PC is a linear combination of the n-vectors that make up the original variable space.
(1)
where, PC1 is the first principal component and X1, X2, X3, … Xn, are the magnitudes of the levels of trace ele- ments in this study, and the coefficients (PIj) of the linear combination are called x-loadings. The coordinates of the data on the new PCs coordinate system (ti) are referred to as scores. The magnitude of the scores reveals the im- portance of PCi to that data point. Groupings of data points on the scores plot may reveal obscured structure in the data. Consequently, new insight is often gained as new relationships that were formerly obscured in the old coordinate system are revealed, allowing pattern recogni- tion in a data set. The use of PCA for data analysis is desirable because it often reduces the dimensionality of the data set to a much smaller value.
The results of the PCA shows that the first two PCs ac- counted for 98% of the variability in the levels of trace element in the hair samples. Therefore, two PCs (PC1 and PC2) are adequate to represent the data set. Equa- tions (2) and (3) show a mathematical expression for PC1, and PC2, respectively obtained from the hair ana- lysis in this study.
[ ] [ ] [ ][ ] [ ] [ ]
-3 -2
-2 -4
2 -5.165 6.477 0.979
1.659 0.195 2.770
PC e Fe e Ca Zn
e Cu Mg e Cr
= − +
+ + + (2)
[ ] [ ] [ ][ ] [ ] [ ]
-3 -2
-2 -4
2 -5.165 6.477 0.979
1.659 0.195 2.770
PC e Fe e Ca Zn
e Cu Mg e Cr
= − +
+ + + (3)
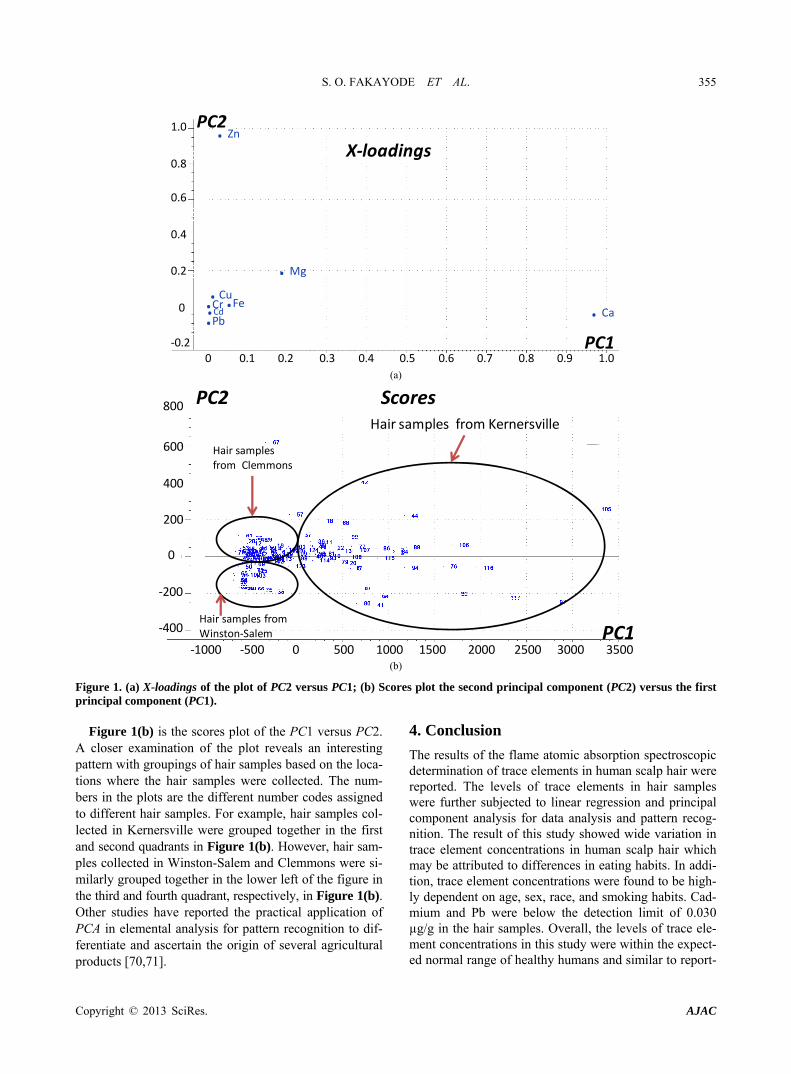
Figure 1(a) is the x-loading of the plot of PC1 versus the PC2. While all the trace elements are important, cal- cium and magnesium were found to be the most signi- ficant elements, contributing to the PC1, with x-loading values of 0.98 and 0.18, respectively. However, Zn and Mg were found to be the major contributors to PC2, with x-loading values of 0.98 and 0.20 respectively. It is very interesting to note that, the overall calculated Ca/Mg ratio value of 5.87 in Table 7 was similar to the corres- ponding x-loading Ca/Mg ratio of 5.3 obtained from PCA. However, the x-loading Zn/Cu ratio of 59 obtained from PCA was significantly larger than the corresponding overall Zn/Cu ratio value of 16.0 obtained in Table 7. These differences may be associated with a wider range of Zn/Cu ratio (69 - 10) obtained for different categories of people in Table 7. Nontheless, further critical obser- vation of the data revealed that the x-loading Zn/Cu ratio of 59 was similar to the average Zn/Cu ratio value of 54 obtained in smokers (69) and in men (40). With further study and more data analysis, the ratio of the x-loadings value of Ca/Mg and Zn/Cu from PCA can therefore be potentially used for rapid screening of calcium and cop- per utilization and for medical diagnosis of people for suseptiability to atherosclerosis, hypertension diabetics, insulin sensitivity, and pancreatic cancer.
Copyright © 2013 SciRes. AJAC
S. O. FAKAYODE ET AL.
Copyright © 2013 SciRes. AJAC
355
X-loadings
. Mg
PC1
. Ca
. Zn
. Cu.Fe.Cr.Pb.Cd
PC21.0
0.8
0.6
0.4
0.2
0
-0.20 0.1 0.2 0.3 0.4 0.5 0.6 0.7 0.8 0.9 1.0
A
(a)
800
600
400
200
0
-200
-400
-1000 -500 0 500 1000 1500 2000 2500 3000 3500
PC2 Scores
PC1
BHair samples from Kernersville
Hair samples from Clemmons
Hair samples fromWinston-Salem
(b)
Figure 1. (a) X-loadings of the plot of PC2 versus PC1; (b) Scores plot the second principal component (PC2) versus the first principal component (PC1).
4. Conclusion Figure 1(b) is the scores plot of the PC1 versus PC2. A closer examination of the plot reveals an interesting pattern with groupings of hair samples based on the loca- tions where the hair samples were collected. The num- bers in the plots are the different number codes assigned to different hair samples. For example, hair samples col- lected in Kernersville were grouped together in the first and second quadrants in Figure 1(b). However, hair sam- ples collected in Winston-Salem and Clemmons were si- milarly grouped together in the lower left of the figure in the third and fourth quadrant, respectively, in Figure 1(b). Other studies have reported the practical application of PCA in elemental analysis for pattern recognition to dif- ferentiate and ascertain the origin of several agricultural products [70,71].
The results of the flame atomic absorption spectroscopic determination of trace elements in human scalp hair were reported. The levels of trace elements in hair samples were further subjected to linear regression and principal component analysis for data analysis and pattern recog- nition. The result of this study showed wide variation in trace element concentrations in human scalp hair which may be attributed to differences in eating habits. In addi- tion, trace element concentrations were found to be high- ly dependent on age, sex, race, and smoking habits. Cad- mium and Pb were below the detection limit of 0.030 µg/g in the hair samples. Overall, the levels of trace ele- ment concentrations in this study were within the expect- ed normal range of healthy humans and similar to report-

S. O. FAKAYODE ET AL. 356
ed levels of trace element concentrations in healthy indi- viduals elsewhere. Future study will include comparative analysis and determination of trace element concentra- tions in human scalp hair of cancer, diabetics, and obe- sity patients. The results of these findings will be com- municated in future manuscripts.
5. Acknowledgements
The authors acknowledge financial support from Natio- nal Science Foundation HBCU-UP Award # HRD- 0927905, US Department of Education, Title III grant to Winston Salem State University.
REFERENCES [1] K. M. Hambidge, “Trace Elements in Human and Animal
Nutrition,” 5th Edition, Academic Press, San Diego, 1987.
[2] World Health Organization, “Trace Elements in Human Nutrition and Health,” WHO, Geneva, 1996.
[3] Institute of Medicine, “Food and Nutrition Board. Dietary Reference Intakes for Vitamin A, Vitamin K, Arsenic, Boron, Chromium, Copper, Iodine, Iron, Manganese, Mo- lybdenum, Nickel, Silicon, Vanadium and Zinc,” National Academy Press, Washington DC, 2001.
[4] M. Luno, P. Roncales and D. Djenane, “Beltran, Beef Shelf Life in Low O2 and High CO2 Atmospheres Containing Different Low CO Concentrations,” Meat Science, Vol. 55, No. 4, 2000, pp. 413-419. doi:10.1016/S0309-1740(99)00170-9
[5] M. Seyfert, R. A. Mancini, M. C. Hunt, J. Tang, C. Faust- man, “Influence of Carbon monoxide in Package Atmos- pheres Containing Oxygen on Color, Reducing Activity, and Oxygen Consumption of Five Bovine Muscles,” Meat Science, Vol. 75, No. 3, 2007, pp. 432-442. doi:10.1016/j.meatsci.2006.08.007
[6] D. Voet, J. G. Voet and C. W. Pratt, “Fundamentals of Biochemistry: Life at the Molecular Level,” 3rd Edition, John Wiley & Sons, Inc., Hoboken, 2008.
[7] J. Y. Jeong and J. R. Claus, “Color Stability and Rever- sion in Carbon Monoxide Packaged Ground Beef,” Meat Science, Vol. 85, No. 3, 2010, pp. 525-530. doi:10.1016/j.meatsci.2010.02.027
[8] H. Tapiero, L. Gate and K. D. Tew, “Iron: Deficiencies and Requirements,” Biomedicine & Pharmacotherapy, Vol. 55, No. 6, 2001, pp. 324-332. doi:10.1016/S0753-3322(01)00067-1
[9] S. Huang, Y. Yang, C. Cheng, J. Chen and C. Lin, “The Etiology and Treatment Outcome of Iron Deficiency and Iron Deficiency Anemia in Children,” Journal of Pedi- atric Hematology/Oncology, Vol. 32, No. 4, 2010, pp. 282-285. doi:10.1097/MPH.0b013e3181d69b2b
[10] N. Fabris and F. Mocchegiani, “Zinc, Human Diseases and Aging,” Aging Clinical and Experimental Research, Vol. 7, No. 2, 1995, pp. 77-93. doi:10.1007/BF03324297
[11] G. Vivoli, M. Bergomi, P. Borella, G. Fantuzzi and E.
Caselgrandi, “Cadmium in Blood, Urine and Hair Related to Human Hypertension,” Journal of Trace Elements and Electrolytes in Health and Disease, Vol. 3, No. 3, 1989, pp. 139-145.
[12] J. Schwartz, “Low-Level Lead Exposure and Children’s IQ: A Meta-Analysis and Search for a Threshold,” Envi- ronmental Research, Vol. 65, No. 1, 1994, pp. 42-55. doi:10.1006/enrs.1994.1020
[13] S. Tong, Y. E. von Schirnding and T. Prapamontol, “Envi- ronmental, Lead Exposure: A Public Health Problem of Global Dimensions,” Bulletin of World Health Organiza- tion, Vol. 78, No. 9, 2000, pp. 1068-1077.
[14] Agency for Toxic Substances and Diseases Registry, “Toxicological Profile for Lead,” US Department of Health and Human Services, Public Health Services, 2005. http://www.atsdr.cdc.gov/toxprofiles/tp13.pdf
[15] G. Hotter, L. M. Fels, D. Closa, J. Rosello, H. Stolte and E. Gelpi, “Altered Levels of Urinary Prostanoids in Lead- Exposed Workers,” Toxicology Letter, Vol. 77, No. 1-3, 1995, pp. 309-312. doi:10.1016/0378-4274(95)03311-4
[16] M. P. Nava-Hernandez, L. A. Hauad-Marroquin, S. Bassol- Mayagoitia, G. Garcia- Arenas, R. Mercado-Hernandez, M. A. Echavarri-Guzman and R. M. Cerda-Flores, “Lead, Cad- mium, and Arsenic-Induced DNA Damage in Rat Germi- nal Cells,” DNA Cell Biology, Vol. 28, No. 5, 2009, pp. 241-248. doi:10.1089/dna.2009.0860
[17] Y. von Schirnding, A. Mathee, M. Kibel, P. Robertson, N. Strauss and R. A. Blignaut, “Study of Pediatric Blood Le- vels in a Mining Area in South Africa,” Environmental Research, Vol. 93, No. 3, 2003, pp. 259-263. doi:10.1016/S0013-9351(03)00117-8
[18] G. C. Lough, J. J. Schauer, J. Park, M. M. Shafer, J. T. De- Minter and J. P. Weinstein, “Emissions of Metals Associ- ated with Motor Vehicle Roadways,” Environmental Che- mistry and Technology, Vol. 39, No. 3, 2005, pp. 826- 836.
[19] J. Nriagu, N. Oleru, C. Cudioe and A. Chine, “Lead Poi- soning of Children in Africa, III. Kaduna, Nigeria,” Sci- ence of the Total Environment, Vol. 197, No. 1-3, 1997, pp. 13-19. doi:10.1016/S0048-9697(96)05408-3
[20] P. C. Onianwa and S. O. Fakayode, “Lead Contamination of Topsoil and Vegetation in the Vicinity of a Battery Factory in Nigeria,” Environmental Geochemistry and Health, Vol. 22, No. 3, 2000, pp. 211-218. doi:10.1023/A:1026539531757
[21] O. E. Orisakwe, “Environmental Pollution and Blood Lead Levels in Nigeria: Who Is Unexposed?” International Jour- nal of Occupational and Environmental Health, Vol. 15, No. 3, 2009, pp. 315-317. doi:10.1179/107735209799239007
[22] J. E. Fergusson, K. A. Hibbard and R. L. H. Ting, “Lead in Human Hair: General Survey-Battery Factory Employ- ees and Their Families,” Environmental Pollution (Ser B), Vol. 2, No. 3, 1981, pp. 235-248. doi:10.1016/0143-148X(81)90021-5
[23] S. O. Fakayode and B. I. Olu-Owolabi, “Heavy Metal Con- tamination of Roadside Topsoil in Osogbo, Nigeria: Its Relationship to Traffic Density and Proximity to High-
Copyright © 2013 SciRes. AJAC

S. O. FAKAYODE ET AL. 357
ways,” Environmental Geology, Vol. 44, No. 2, 2003, pp. 150-157.
[24] S. Bakirdere and M. Yaman, “Determination of Lead, Cad- mium and Copper in Roadside Soil and Plants in Elazig, Turkey,” Environmental Monitoring and Assessment, Vol. 136, No. 1-3, 2008, pp. 401-410. doi:10.1007/s10661-007-9695-1
[25] K. Suzuki, T. Yabuki and Y. Ono, “Roadside Rhododen- dron Pulchrum Leaves as Bioindicators of Heavy Metal Pollution in Traffic Areas of Okayama, Japan,” Environ- mental Monitoring and Assessment, Vol. 149, No. 1-4, 2009, pp. 133-141. doi:10.1007/s10661-008-0188-7
[26] H. W. Mielke, D. Dugas, P. W. Mielke, K. S. Smith, S. L. Smith and C. R. Gonzales, “Association between Soil and Soil Lead and Childhood Blood Lead in Urban New Or- leans and Rural Lafourche Parish of Louisiana,” Environ- mental Health Perspectives, Vol. 105, No. 4, 1997, pp. 950-954. doi:10.1289/ehp.97105950
[27] U. Ranft, T. Delschen, M. Machtolf, D. Sugiri and M. Wilhelm, “Lead Concentration in the Blood of Children and Its Association with Lead in Soil and Ambient Air. Trends between 1983 and 2000 in Duisburg,” Journal of Toxicology and Environmental Health, Part A, Vol. 71, No. 11-12, 2008, pp. 710-715. doi:10.1080/15287390801985117
[28] A. Kumar and P. Pastore, “Lead and Cadmium in Soft Plastic Toys,” Current Science India, Vol. 93, No. 6, 2007, pp. 818-822.
[29] European Standard EN 71-3, “Safety of Toys-Part 3, Mi- gration of Certain Elements,” 1994.
[30] Consumer Product Safety Commission, “Determination of Safe Levels of Lead in Paints,” Federal Register, Vol. 42, No. 32, 1977, pp. 9404-9406.
[31] A. Leibovitz, E. Lubart, J. Wainstein, Y. Dror and R. Se- gal, “Serum Trace Elements in Elderly Frail Patients with Oropharyngeal Dysphagia,” Journal of Nutritional Science and Vitaminology, Vol. 55, No. 5, 2009, pp. 407-411. doi:10.3177/jnsv.55.407
[32] B. Gulson, K. Mizon, A. Taylor, M. Korsch, J. Stauber, J. M. Davis, H. Louie and M. A. L. Wu, “Longitudinal Mo- nitoring of Selected Elements in Blood of Healthy Young Children,” Journal of Trace Elements in Medicine and Biology, Vol. 22, No. 3, 2008, pp. 206-214. doi:10.1016/j.jtemb.2008.04.001
[33] J. L. Rodrigues, B. L. Batista, M. Fillion, C. J. S. Passos, D. Mergler and F. Barbosa, “Trace Element Levels in Whole Blood of Riparian Villagers of The Brazilian Ama- zon,” Science of the Total Environment, Vol. 407, No. 13, 2009, pp. 4168-4173. doi:10.1016/j.scitotenv.2009.02.041
[34] M. L. Carvalho and A. F. Marques, “X-Ray Fluorescence Spectrometry: Applications in Trace Elements Studies in Human Tissues from Patients with Cirrhosis,” X-Ray Spec- trometry, Vol. 30, No. 6, 2001, pp. 397-402. doi:10.1002/xrs.517
[35] A. O. Ogunfowokan, J. P. Kaisam and M. O. Balogun, “Stu- dy of Trace Elements in Urine of Some Nigerian Medi- cal Patients,” Toxicological and Environmental Chemis- try, Vol. 91, No. 3, 2009, pp. 435-449. doi:10.1080/02772240802233597
[36] Q. Pasha, S. A. Malik, J. Iqbal and M. H. Shah, “Charac- terization and Distribution of the Selected Metals in the Scalp Hair of Cancer Patients in Comparison with Nor- mal Donors,” Biological Trace Elemment Research, Vol. 118, No. 3, 2007, pp. 207-216. doi:10.1007/s12011-007-0035-7
[37] R. Pereria, R. Riberio and F. Goncalves, “Scalp Hair Ana- lysis as a Tool in Assessing Human Exposure to Heavy Metals (S. Domingos Mine, Portugal),” Science of the Total Environment, Vol. 327, No. 1-3, 2004, pp. 81-92. doi:10.1016/j.scitotenv.2004.01.017
[38] M. Nadal, A. Bocio, M. Schuhmacher and J. L. Domingo, “Monitoring Metals in Population Living in the Vicinity of Hazardous Waste Incinerator: Levels in Hair of School Children,” Biological Trace Elemment Research, Vol. 104, No. 3, 2005, pp. 203-214. doi:10.1385/BTER:104:3:203
[39] S. Majumdar, J. Chatterjee and K. Chaudhuri, “Ultra- structural and Trace Metal Studies on Radiographers’ Hair and Nails,” Biological Trace Element Research, Vol. 67, No. 2, 1997, pp. 127-138. doi:10.1007/BF02784068
[40] M. J. Welch, L. T. Sniegoski, C. C. Allgood and M. Ha- bram, “Hair Analysis for Drugs of Abuse: Evaluation of Analytical Methods, Environmental Issues, and Devel- opment of Reference Materials,” Journal of Analytical Toxicology, Vol. 17, No. 7, 1993, pp. 389-398. doi:10.1093/jat/17.7.389
[41] M. Balikova, “Hair Analysis for Drugs of Abuse: Plausi- bility of Interpretation,” Biomed Pap Med Fac Univ Pala- cky Olomouc Czech Republic, Vol. 149, No. 2, 2005, pp. 199-207. doi:10.5507/bp.2005.026
[42] H. I. Afridi, T. G. Kazi, N. Kazi, G. A. Kandhro, J. A. Baig, M. K. Jamali, M. B. Arain and A. Q. Shah, “Inter- actions between Cadmium and Zinc in the Biological Samples of Pakistani Smokers and Nonsmokers Cardio- vascular Disease Patients,” Biological Trace Elemment Research, Vol. 139, No. 3, 2011, pp. 257-268.
[43] F. L. Barbieri, A. Cournil, J. E. S. Sarkis, E. Bénéfice and J. Gardon, “Hair Trace Elements Concentration to Descri- be Polymetallic Mining Waste Exposure in Bolivian Alti- plano,” Biological Trace Elemment Research, Vol. 139, No. 1, 2011, pp. 10-23. doi:10.1007/s12011-010-8641-1
[44] E. Rębacz, I. Baranowska-Bosiacka and D. Chlubek, “The Content of Selected Chemical Elements in the Hair of Young Men of the Bantu Language Group from Tan- zania versus Environmental and Social Conditioning,” Biological Trace Element Research, Vol. 137, No. 3, 2010, pp. 262-279. doi:10.1007/s12011-009-8589-1
[45] V. L. Dressler, D. Pozebonb, M. F. Meskoc, A. Matuschd, U. Kumtabtime, B. Wue and J. S. Beckere, “Biomonitor- ing of Essential and Toxic Metals in Single Hair Using On-line Solution-Based Calibration in Laser Ablation In- ductively Coupled Plasma Mass Spectrometry,” Talanta, Vol. 82, No. 5, 2010, pp. 1770-1777. doi:10.1016/j.talanta.2010.07.065
[46] I. A. Olusegun and N. S. Gerhard, “Lead Exposure: A Contributing Cause of the Current Breast Cancer Epi- demic in Nigerian Women,” Biological Trace Elemment Research, Vol. 136, No. 2, 2010, pp. 127-139.
Copyright © 2013 SciRes. AJAC
S. O. FAKAYODE ET AL. 358
doi:10.1007/s12011-010-8608-2
[47] S. Zaichick and V. Zaichick, “The Effect of Age and Gender on 37 Chemical Element Contents in scalp Hair of Healthy Humans,” Biological Trace Elemment Resear- ch, Vol. 134, No. 1, 2010, pp. 41-54. doi:10.1007/s12011-009-8456-0
[48] G. R. Lloyd, S. Ahmad, M. Wasimc and R. G. Brereton, “Pattern Recognition of Inductively Coupled Plasma Ato- mic Emission Spectroscopy of Human Scalp Hair for Dis- criminating between Healthy and Hepatitis C Patients,” Analytica Chimica Acta, Vol. 649, No. 1, 2009, pp. 33-42. doi:10.1016/j.aca.2009.07.005
[49] T. Wang, J. Fu, Y. Wang, C. Liao, Y. Tao and G. Jiang, “Use of Scalp Hair as Indicator of Human Exposure to Heavy Metals in an Electronic Waste Recycling Area,” Environmental Pollution, Vol. 157, No. 8-9, 2009, pp. 2445-2451. doi:10.1016/j.envpol.2009.03.010
[50] A. Unkiewicz-Winiarczyk, A. Bagniuk, K. Gromysz- Kałkowska and E. Szubartowska, “Calcium, Magnesium, Iron, Zinc and Copper Concentration in the Hair of To- bacco Smokers,” Biological Trace Elemment Research, Vol. 128, No. 2, 2009, pp. 152-160. doi:10.1007/s12011-008-8266-9
[51] T. Chao, C. Hui and X. Chengyun, “The Prediction of Cardiovascular Disease Based on Trace Element Contents in Hair and A Classifier of Boosting Decision Stumps,” Biological Trace Elemment Research, Vol. 129, No. 1-3, 2009, pp. 9-19. doi:10.1007/s12011-008-8279-4
[52] N. K. Mohammed and N. M. Spyrou, “Determination of Trace Elements in Hair from Tanzanian Children: Effect of Dietary Factors,” Journal of Radioanalytical and Nu- clear Chemistry, Vol. 278, No. 2, 2008, pp. 455-458. doi:10.1007/s10967-008-0903-4
[53] A. Rahman, M. A. K. Azad, I. Hossain, M. M. A. S. Qusar, W. Bari, F. Begum, S. M. I. Huq and A. Hasnat, “Zinc, Manganese, Calcium, Copper, and Cadmium Level in Scalp Hair Samples of Schizophrenic Patients,” Bio- logical Trace Elemment Research, Vol. 127, No. 2, 2009, pp. 102-108. doi:10.1007/s12011-008-8230-8
[54] J. L. Rodrigues, B. L. Batista, J. A. Nunes, C. J. S. Passos and F. Barbosa Jr., “Evaluation of the Use of Human Hair for Biomonitoring the Deficiency of Essential and Expo- sure to Toxic Elements,” Science of the Total Environ- ment, Vol. 405, No. 1-3, 2008, pp. 370-376. doi:10.1016/j.scitotenv.2008.06.002
[55] M. J. González-Muñoz, A. Peña and I. Meseguer, “Moni- toring Heavy Metal Contents in Food and Hair in a Sam- ple of Young Spanish Subject,” Food Chemistry and To- xicology, Vol. 46, No. 9, 2008, pp. 3048-3052. doi:10.1016/j.fct.2008.06.004
[56] Y. Li, L. Yang, W. Wang, H. Li, J. Lv and X. Zou, “Trace Element Concentrations in Hair of Healthy Chinese Cen- tenarians,” Science of the Total Environment, Vol. 409, No. 8, 2011, pp.1385-1390. doi:10.1016/j.scitotenv.2011.01.017
[57] U.S. Census Bureau, 2010. http://www.census.gov/
[58] Y. Toba, R. Masuyam, K. Katot, Y. Takadal, S. Aoet, K. Suzuki, Y. Toba, R. Masuyama, K. Katot and Y. Taka-
dal, “Effects of Dietary Magnesium Level on Calcium Absorption in Growing Male Rats,” Nutrition Research, Vol. 19, No. 5, 1999, pp. 783-793.
[59] K. Kisters, F. Wessels, H. Kuper, F. Tokmak, E. Kreft- ing, B. Gremmler, M. Kosch, M. Barenbrock and M. Hausberg, “Increased Calcium and Decreased Magnesium Concentrations and an Increased Calcium/Magnesium Ratio in Spontaneously Hypertensive Rats versus Wistar- Kyoto Rats: Relation to Arteriosclerosis,” American Jour- nal of Hypertension, Vol. 17, No. 1, 2004, pp. 59-62. doi:10.1016/j.amjhyper.2003.08.012
[60] M. Kosch, M. Hausberg, G. Westermann, J. Koneke, F. Matzkies, K. H. Rahn and K. Kisters, “Alterations in Cal- cium and Magnesium Content of Red Cell Membranes in Patients with Primary Hypertension,” American Journal of Hypertension, Vol. 14, No. 3, 2001, pp. 254-258. doi:10.1016/S0895-7061(00)01271-1
[61] A. Haenni, L. B. R. RetIeland, P. Anderssson, L. Lind and H. Lithell, “The Alterations In Insulin Sensitivity An- giotensin Converting Enzyme in Ii During Inhibitor Treatment are Related to Changes in The Calcium/Mag- nesium Balance,” American Journal of Hypertension, Vol. 10, No. 2, 1997, pp. 145-151. doi:10.1016/S0895-7061(96)00343-3
[62] P. W. F. Fischer, A. Giroux and M. R. L’Abbk, “Effect of Zinc Supplementation on Copper Statusin Adult Man,” The American Journal of Clinical Nutrition, Vol. 40, No. 4, 1984, pp. 743-746.
[63] W. P. Patterson, M. Winkelmann and M. C. Perry, “Zinc- induced Copper Deficiency: Megamineral Sideroblastic Anemia,” Annals of Internal Medicine, Vol. 103, No. 3, 1985, pp. 385-386. doi:10.7326/0003-4819-103-3-385
[64] K. G. Porter, D. McMaster, M. E. Elmes and A. H. Love, “Anaemia and Low Serum-Copper during Zinc Therapy,” Lancet, Vol. 2, No. 8041, 1977, p. 774. doi:10.1016/S0140-6736(77)90295-1
[65] R. K. Chandra, “Excessive Intake of Zinc Impairs Immu- ne Responses,” Journal of American Medical Association, Vol. 252, No. 11, 1984, pp. 1443-1446. doi:10.1001/jama.1984.03350110043027
[66] C. Fabris, R. Farini, G. D. Favero, G. Gurrieri, A. Piccoli, G. C. Sturniolo, A. Panucci and R. Naccarato, “Copper, Zinc and Copper/Zinc Ratio in Chronic Pancreatitis and Pancreatic Cancer,” Clinical Biochemistry, Vol. 18, No. 16, 1985, pp. 373-375. doi:10.1016/S0009-9120(85)80078-3
[67] K. R. Beebe, R. J. Pell and M. B. Seasholtz, “Chemome- trics—A Practical Guide,” Wiley-Interscience, New York, 1998.
[68] K. W. Busch, I. M. Swamidoss, S. O. Fakayode and M. A. Busch, “Determination of the Enantiomeric Composition of Guest Molecules by Chemometric Analysis of the UV- Visible Spectra of Cyclodextrin Guest-Host Complexes,” Journal of the American Chemical Society, Vol. 125, No. 7, 2003, pp. 1690-1691. doi:10.1021/ja025947a
[69] M. Otto, “Chemometrics,” Wiley-VCH: Weinheim, Wei- nheim, 1999.
[70] E. Marengo and M. Aceto, “Statistical Investigation of the Differences in the Distribution of Metals in Nebbiolo-
Copyright © 2013 SciRes. AJAC

S. O. FAKAYODE ET AL.
Copyright © 2013 SciRes. AJAC
359
based Wines,” Food Chemistry, Vol. 81, No. 4, 2003, pp. 621-630. doi:10.1016/S0308-8146(02)00564-2
[71] C. Diaz, J. E. Conde, D. Estevez, S. J. Perez Olivero and J. P. Perez Trujillo, “Application of Multivariate Analysis and Artificial Neural Networks for the Differentiation of
Red Wines from the Canary Islands According to the Is- land of Origin,” Journal of Agricultural and Food Chem- istry, Vol. 51, No. 15, 2003, pp. 4303-4307. doi:10.1021/jf0343581