use of mmg signals for the control of powered orthotic devices
TRANSCRIPT

Assistive Technology, 21:1–12, 2009Copyright © 2009 RESNAISSN: 1040-0435 print DOI: 10.1080/10400430902945678
1
UATY1040-0435Assistive Technology, Vol. 21, No. 1, Apr 2009: pp. 0–0Assistive Technology
Use of MMG Signals for the Control ofPowered Orthotic Devices: Development of
a Rectus Femoris Measurement ProtocolMMG Signals: Rectus Femoris Measurement ProtocolM. G. Antonelli et al.Michele Gabrio Antonelli, PhD,1
P. Beomonte Zobel, PhD,1
and J. Giacomin, PhD2
1Dipartimento di Ingegneria Meccanica, Energetica e Gestionale, Università degli Studi di L’Aquila, Roio Poggio, Italy2School of Engineering and Design, Brunel University, Uxbridge, West London, United Kingdom
Address correspondence to Antonelli Michele Gabrio, PhD, Dipartimento di Ingegneria Meccanica, Energetica e Gestionale, Università degli Studi di L’Aquila, 67040 Roio Poggio (AQ), Italy. E-mail: [email protected]
ABSTRACT A test protocol is defined for the purpose of measuring rectusfemoris mechanomyographic (MMG) signals. The protocol is specified interms of the following: measurement equipment, signal processing require-ments, human postural requirements, test rig, sensor placement, sensor dermalfixation, and test procedure. Preliminary tests of the statistical nature of rectusfemoris MMG signals were performed, and Gaussianity was evaluated bymeans of a two-sided Kolmogorov-Smirnov test. For all 100 MMG data setsobtained from the testing of two volunteers, the null hypothesis of Gaussianitywas rejected at the 1%, 5%, and 10% significance levels. Most skewness valueswere found to be greater than 0.0, while all kurtosis values were found to begreater than 3.0. A statistical convergence analysis also performed on the same100 MMG data sets suggested that 25 MMG acquisitions should prove sufficientto statistically characterize rectus femoris MMG. This conclusion is supportedby the qualitative characteristics of the mean rectus femoris MMG power spectraldensities obtained using 25 averages.
KEYWORDS accelerometer, EMG, lifting, MMG, muscle, orthosis, rectus femoris
INTRODUCTIONNumerous devices have been developed for assisting individuals with manip-
ulative or locomotive disabilities. It has been suggested (Redford, Basmajian, &Trautman, 1995) that such devices belong to one of two major categories: reha-bilitation technologies or assistive technologies. The first category includesexternal devices whose action helps to modify the structural or functional char-acteristics of the neuromusculoskeletal system. The second category consists ofbody-worn devices that assist the movement of disabled individuals.
A device belonging to the second category is the powered lower-limborthosis developed at the University of L’Aquila, which is shown in Figure 1.It consists of a frame composed of lower and upper aluminum rods, a steelhinge joint, and two shells in thermosetting plastic (Raparelli, BeomonteZobel, & Durante, 2004). The orthosis provides a lifting movement that assistswhen rising from a seated posture. Orthopedically correct motion is achieved

M. G. Antonelli et al. 2
by means of a knee joint and a cable-pulley system.Two McKibben-type pneumatic muscles (Raparelli,Durante, & Beomonte Zobel, 2002) are symmetricallylocated on the opposing sides of the leg in correspon-dence with the tibia. Introduction of compressed airinside the pneumatic muscles allows their shortening,and thus produces the lifting force. The orthosis iscontrolled by means of a sensing circuit formed by anair bladder (which is wrapped around the circumfer-ence of the upper leg) and a pressure transducer thatdetects user intention by measuring the hardness ofthe rectus femoris muscle. Two control strategiesbased on the air bladder signal have been developedand tested with interesting preliminary results: anon/off control, with one or more pressure thresholdvalues, and a continuous control. Unfortunately, thecontrol system based on the air bladder sensor hasbeen found to be highly sensitive to both variations incontact pressure with the muscle and air losses due toleakage. The research described here was performedin part due to the need to establish a more natural andefficient command system for the orthosis.
According to Veltink et al (2001), commandtechniques for assistive devices can be classified intothree categories: those based on signals originatingfrom within the muscular-skeletal system, those basedon biologically derived signals not originating fromwithin the muscular-skeletal system, and those basedon signals derived from kinetic or kinematic measure-ments of the body. Signals originating within the mus-cular-skeletal system include electromyographic(EMG) signals produced by the electrochemicalactivity involved in motor unit activation. EMG sig-nals are normally measured within the muscle tissueitself or at the external derma by means of either nee-dle or surface electrodes (Kampas, 2001). Advantagesof EMG include the fact that it provides signals whoseamplitude increases as a function of increasing muscleforce (Childress, 1995; Kampas, 2001). Further, EMGprovides a measure of command intention since theelectrical activity builds prior to actual muscularcontraction (Kampas, 2001). Disadvantages of EMGsurface electrodes include possible mechanicaldetachment of the myoelectrodes due to bodymotion, electrical interference from nearby materialsor devices, and interference caused by impedancechanges of the skin. Examples of the use of EMG forthe control of powered orthotic devices includeankle-foot orthoses (Ferris, Czerniecki, & Hannaford,2005).
Signals originating within the muscular-skeletalsystem also include force, motion, or volume changemeasures related to muscles, tissue, or tendons.Advantages of such measures include their relativerobustness against external electrical disturbances andtheir amplitudes, which are normally sufficiently highas to not require sophisticated signal conditioning.Disadvantages include the need to assure the correctpositioning of the sensor and the possibility thataccidental knocks can generate unwanted signals.Examples of the use of these command signals includethe Arthroscopically Implantable Force Probe (Reilly,Bull, Amis, Wallace, & Emery, 2003; Upasani,Kapoor, & Tesar, 1999), a Hall effect device used tocontrol an upper limb prosthesis whose output isproportional to muscle dimensional change (Kenney,Lisitsa, Bowker, Heath, Howard, 1999), and a tendon-activated pneumatic sensor used to control a handprosthesis whose output is proportional to tendonsliding movement (Craelius, Abboudi, & Newby,1999).
FIGURE 1 University of L’Aquila powered lower-limb orthosis.

3 MMG Signals: Rectus Femoris Measurement Protocol
Other signals originating from within the muscular-skeletal system include those derived from the mechanicaloscillations that occur due to the sliding of the musclefibers during contraction (Orizio, 1993). Mechano-myographic (MMG) signals consist of either accelerationor sound measurements that are made on the outerskin over a target muscle. Like EMG, MMG measuresa command intention that is produced voluntarily,but in this case there is a greater time delay due to thephysical response time of the muscle fibers. An advan-tage of MMG is that signal conditioning is less criticalthan in the case of EMG (Ebersole, Housh, Evetovich, &Cramer, 2001; Perry et al., 2001) because neither themeasurement of acceleration nor sound is affected bythe electrical impedance of the skin. Disadvantages ofthis method include the possibility of noise signalsgenerated by accidental knocks (Silva, Heim, & Chau,2005) and the possibility of sensor detachment. Thereare currently few studies in the research literature thatdescribe the use of MMG for the control of assistivedevices. One study (Barry, Leonard, Gitter, & Ball,1986) described an externally powered hand prosthesiscontrolled by means of an MMG signal measured atthe wrist extensor and flexor muscles. A second study(Silva et al., 2005) demonstrated the usefulness ofMMG in two-function hand prosthesis control signals.In this case, the system is based on a triplet of distallyrecorded, normalized root mean square (RMS) MMGsignals passed through software and hardware modulesthat emulate the output of a conventional EMG sensingsystem.
Signals originating within the muscular-skeletalsystem also include those produced by near-infraredspectroscopy; these signals are related to concentrationchanges in tissue hemoglobin (Elwell, 1995; Suzuki,Takasaki, Ozaki, & Kobayashi, 1999). This techniquemeasures the absorption of near-infrared light radia-tion caused by the oxygenation of living tissues. Highermuscular effort causes higher oxygen concentrationchange. An advantage of the technique is its potentialusefulness in cases where fatigue onset requires moni-toring. Disadvantages of the technique include theneed for complex sensors and measurement instru-mentation and sensitivity to the level of ambient lighting.No examples of the use of these signals for orthoticdevices were found in the research literature.
Biologically derived signals not originating fromwithin the muscular-skeletal system include electroen-cephalographic (EEG) signals, recorded from the scalp
using surface-mounted electrodes. Advantages ofthis technique include the possibility of obtainingcommand signals even for patients who are unable togenerate muscular activity (such as patients with tetra-plegia) and the noninvasive nature of the measurement.Disadvantages include the complexity of interpretationof the signals and the loss of much information due tothe filtering action of the skull, tissues, and skin.Examples of the use of EEG for the control of assistivedevices include an electrical orthosis (Pfurtscheller,Guger, Muller, Krausz, & Neuper, 2000) and a neuro-prosthesis (Lauer, Peckham, & Kilgore, 1999) thatrestore hand grasp function for, respectively, patientswith tetraplegia and patients with severe physical disabili-ties (e.g., amyotrophic lateral sclerosis and stroke).
Signals based on kinematic or kinetic measurementof the interaction between the human body and itssurrounding environment include a variety of forces,motions, and pressures that arise from contact betweenthe human body and either the assistive device or thenatural environment. Such signals have the advantageof being strictly related to human intention and ofoften being relatively simple from the point of view ofsensor technical requirements. Examples of the appli-cation of such signals to the control of orthotic andprosthetic devices include on/off switch systems(Davalli & Sacchetti, 2003), potentiometers (Campos &Pinto, 1999), mini-joysticks (Davalli & Sacchetti, 2003),strain gauges (Rahman, Nam, Sample, & Seliktar,2002), and load cells (Rosen, Brand, Fuchs, & Arcan,2001).
When considering which control technique toadopt in the case of the L’Aquila University poweredlower-limb orthosis, the main criteria were taken to besimplicity of installation and simplicity of use as aphysical component of the orthosis. Review of therelevant literature suggested that MMG was the mostappropriate technology and that its potential use as acontrol signal had been demonstrated (Barry et al.,1986; Silva et al., 2005). The research described herewas therefore performed in order to define a protocolfor accurately measuring rectus femoris MMG signalsin a laboratory setting for the purpose of developinga new control system for the L’Aquila University pow-ered lower-limb orthosis. New research was required todevelop a rectus femoris MMG signal measurementprotocol because no such protocol was identified inthe literature. The present study investigated the varia-tion of the MMG signal characteristics under muscular
M. G. Antonelli et al. 4
loading conditions that would be expected to occurduring the use of the powered lower-limb orthosis.The principal statistical property investigated was theRMS value of the signal since it is this value thatwould be expected to be the basis of the control actionof the orthosis (Silva et al., 2005). Instantaneous valuesof the RMS were measured under specific conditions,and the statistical convergence of the statistic undermultiple repetitions was determined. This article sum-marizes the rectus femoris test protocol, which isdescribed below in terms of the necessary measurementequipment, the signal processing requirements, thehuman postural requirements, the test rig, the placementand dermal fixation of the measurement sensor, andthe procedure.
TEST PROTOCOLMMG signals originate from the mechanical oscilla-
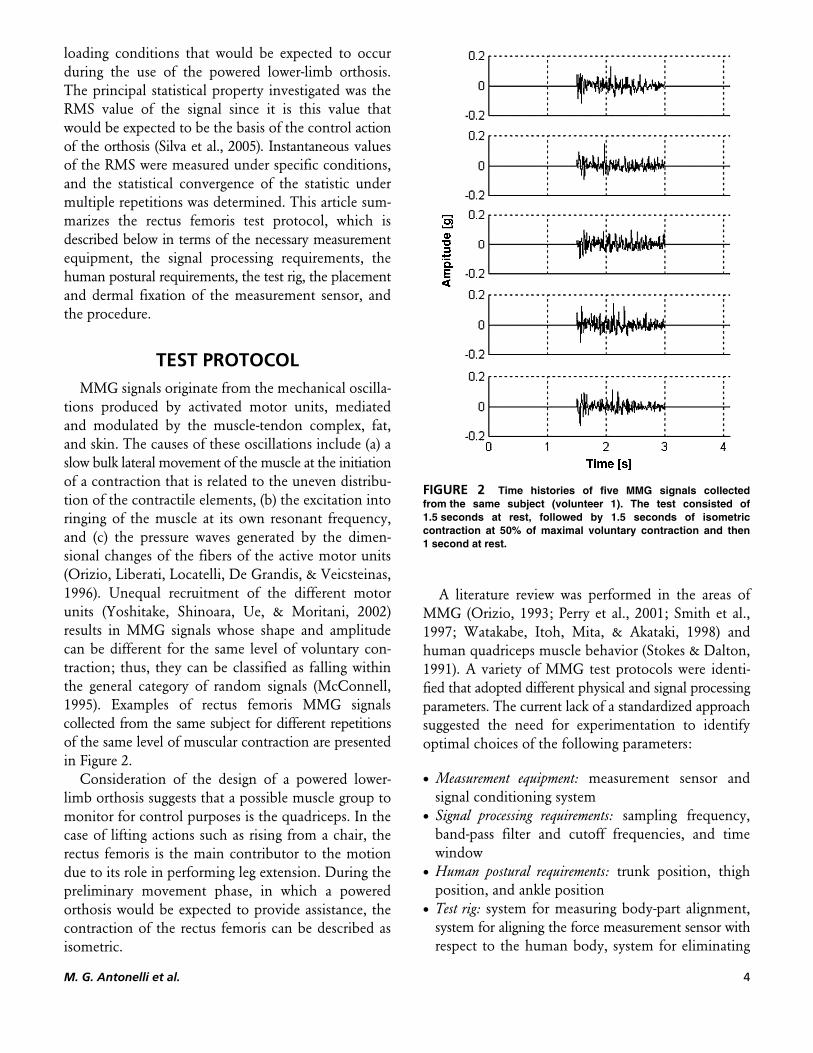
tions produced by activated motor units, mediatedand modulated by the muscle-tendon complex, fat,and skin. The causes of these oscillations include (a) aslow bulk lateral movement of the muscle at the initiationof a contraction that is related to the uneven distribu-tion of the contractile elements, (b) the excitation intoringing of the muscle at its own resonant frequency,and (c) the pressure waves generated by the dimen-sional changes of the fibers of the active motor units(Orizio, Liberati, Locatelli, De Grandis, & Veicsteinas,1996). Unequal recruitment of the different motorunits (Yoshitake, Shinoara, Ue, & Moritani, 2002)results in MMG signals whose shape and amplitudecan be different for the same level of voluntary con-traction; thus, they can be classified as falling withinthe general category of random signals (McConnell,1995). Examples of rectus femoris MMG signalscollected from the same subject for different repetitionsof the same level of muscular contraction are presentedin Figure 2.
Consideration of the design of a powered lower-limb orthosis suggests that a possible muscle group tomonitor for control purposes is the quadriceps. In thecase of lifting actions such as rising from a chair, therectus femoris is the main contributor to the motiondue to its role in performing leg extension. During thepreliminary movement phase, in which a poweredorthosis would be expected to provide assistance, thecontraction of the rectus femoris can be described asisometric.
A literature review was performed in the areas ofMMG (Orizio, 1993; Perry et al., 2001; Smith et al.,1997; Watakabe, Itoh, Mita, & Akataki, 1998) andhuman quadriceps muscle behavior (Stokes & Dalton,1991). A variety of MMG test protocols were identi-fied that adopted different physical and signal processingparameters. The current lack of a standardized approachsuggested the need for experimentation to identifyoptimal choices of the following parameters:
• Measurement equipment: measurement sensor andsignal conditioning system
• Signal processing requirements: sampling frequency,band-pass filter and cutoff frequencies, and timewindow
• Human postural requirements: trunk position, thighposition, and ankle position
• Test rig: system for measuring body-part alignment,system for aligning the force measurement sensor withrespect to the human body, system for eliminating
FIGURE 2 Time histories of five MMG signals collectedfrom the same subject (volunteer 1). The test consisted of1.5 seconds at rest, followed by 1.5 seconds of isometriccontraction at 50% of maximal voluntary contraction and then1 second at rest.
5 MMG Signals: Rectus Femoris Measurement Protocol
floor sliding friction, and system for visualizing theinstantaneous value of muscle contraction
• Sensor placement and dermal fixation: number oftransducers, physical points of measurement, andtransducer fixation method
• Test procedure: choice of muscular contraction levels,choice of muscular contraction time duration,choice of relaxation time between two consecutivetests, and choice of total number of tests needed forstatistical accuracy
A lengthy laboratory investigation involving twohuman subjects was performed in which the testparameters listed above were varied individually or ingroups. The logical criteria adopted for the investiga-tion were that any given choice or setting of the aboveshould lead to MMG signals that were approximatelyzero and nearly noise-free when under conditions ofmuscular relaxation and MMG signals that werestrong, relatively noise-free, and similar to publishedresults available in the literature when under variousdegrees of muscular contraction. The following sectionspresent a detailed description of the protocol whichresulted from the experimentation.
Measurement EquipmentWhile microphones, contact sensors, and acceler-
ometers can all be used to produce MMG signals,accelerometers have most frequently been recom-mended as the most convenient and accurate measure-ment method (Watakabe et al., 1998). An Analog DeviceADXL 203 capacitive accelerometer (Analog DevicesInc., USA) was chosen for use in this study due to itshigh sensitivity and low mass. The accelerometer’smeasurement range is ±1.7 g, its frequency bandwidthis from 0 to 2,500 Hz, its sensitivity is 1,000 mV/g, itsmass is less than 1.0 g, and its geometric dimensionsare 5 mm × 5 mm × 2 mm (0.2 in. × 0.2 in. × 0.08 in.).The accelerometer was used to measure the oscillationson the skin surface directly above the rectus femoris.Signal amplification was not required due to the highsensitivity of the accelerometer; however, an analogueanti-aliasing filter was adopted. A 16-bit NIDAQ CARD6036E (National Instruments Corporation, USA) wasused for data acquisition, as was National InstrumentsLabView 6.1 software (National Instruments Corporation,USA). All data were stored on an Intel 3.2 GHzPentium 4 personal computer.
Signal Processing RequirementsPreliminary data acquisitions were performed using
an anti-aliasing bandwidth of 100 kHz, which wasfound to be much greater than the bandwidth of theMMG signals. Upon successive acquisitions, the band-width was gradually reduced until achieving a finalvalue of 200 Hz. The 0–200 Hz low-pass anti-aliasingfilter was achieved by placing a 0.027 μF condenser inparallel to the signal line, as recommended by theAnalog Device (Analog Devices Inc., USA).
All MMG signals were acquired in differentialmode at a sampling rate of 1 kHz and pass-bandfiltered to the frequency range from 0.5 to 140 Hz bymeans of a 12th-order recursive Butterworth filter(National Instruments LabView, Measurements Manual).The time data window used for all acquisitions was4.096 seconds.
Human Postural RequirementsIn clinical practice, the force characteristics of the
rectus femoris are normally measured for the case ofisometric contraction, which is achieved by blockingthe patient’s ankle during leg extension (Kendall,Kendall McCreary, & Provance, 1999). During the test,the patient sits on an appropriate horizontal surface anduses his or her hands to grip the edges of the sittingsurface so as to stabilize the upper body position. Theclinician then positions the patient’s leg so as to achievea posture defined by a horizontal thigh and an angle ofapproximately 90° between the thigh and the lower leg.The clinician then grasps the patient’s ankle to fix it inposition and requests that the patient raise his or herlower leg using maximal voluntary contraction.
Test RigA laboratory test rig was designed and manufactured
for the purpose of reproducing the clinical guidelines inthe most accurate manner possible. As shown in Figure 3,it consists of a structure that includes a seat that isadjustable in height, a polyester belt to fix the ankle inplace, and a sliding block that reduces floor slidingfriction. The test rig also includes a TS200 load cell (AEPTransducers) for measuring the extension force of thelower leg (8 in Figure 3), a TDS210 digital oscilloscope(Tektronix Inc.) (11), and an ELD9105 digital voltmeter(Eldes Instruments) (14).

M. G. Antonelli et al. 6
The sitting posture is controlled by means of threemarkers. Marker 1 is placed on the lateral malleolus,Marker 2 on the lateral condylus femoralis, and Marker3 on the great trocanter. The height of the adjustableseat is varied so as to bring Marker 3 to the same verticallevel as Marker 2. The measurement of the final heightof the seat above the floor is performed using a system(4 in Figure 3) consisting of a pointer and a calibratedscale that is accurate to within 1 mm (0.04 in.). The hor-izontal alignment between Markers 2 and 3 is measuredby means of a horizontally placed 0.82-m pointer (32.3in.) and two calibrated vertical scales (5). The maximumerror in angular alignment is estimated to be approxi-mately 2°, based on a maximum potential placementerror of 3 mm (0.12 in.) for each of the two markerswith respect to their respective bone reference points.The vertical alignment between Markers 1 and 2 isassured by a plumb-line placed on the horizontal beam.In this case, the maximum error in vertical alignment isestimated to be approximately 2° for individuals withlower leg lengths from 0.350 to 0.420 m (from 13.78to 16.53 in.). The test rig also incorporates a handle(6) that is gripped by the test subject so as to stabilizethe upper body position.
The test rig incorporates a polyester belt (7 in Figure 3)that is worn by the human subject around his or herankle and is fixed to the load cell. The load cell (8) isfixed to the test rig frame by means of an attachmentpoint (9) that can be adjusted to be at the same heightand lateral position as the ankle of the test subject.During testing, the foot rests on an aluminum reactionblock (10) that is greased on its underside so as to reducethe effects of horizontal friction on the measurementof leg force. This essentially eliminates possible anklemoments.
Placement and Dermal Fixation of the Measurement Sensor
The frequency content of MMG signals has beenshown to depend upon the strength of fixation of thesensor to the outer skin of the test subject (Bolton,Parkes, Thompson, Clark, & Sterne, 1989). In orderto understand this aspect of the test protocol, the accel-erometer was fixed to the skin surface by means ofbi-adhesive tape, as shown in Figure 4, and tests wereperformed with two subjects in which various knocksand movements were made for a period of 45 minutes.A rectangular piece of tape was used that had a thicknessof 0.19 mm (0.007 in.) and was cut to a size that was3 mm (0.12 in.) longer on each side than the accelerom-eter. MMG acquisitions were made at various pointsduring the sequence to establish if signal characteristicsremained unaltered. The quality of the acquired signalssuggested that bi-adhesive tape was sufficient to guaranteeadequate coupling for a period of at least 45 minutes.
FIGURE 3 Test rig: Marker 1 (1); Marker 2 (2); Marker 3(3); height-adjustable seat (4); marker alignment measuresystem (5); handle (6); inextensible belt (7); load cell (8); load cellattachment point (9); sliding block (10); oscilloscope(11); personal computer (12); data acquisition board (13);voltmeter (14); and accelerometer (15).
FIGURE 4 Dermal fixation of the accelerometer by bi-adhesivetape.

7 MMG Signals: Rectus Femoris Measurement Protocol
The frequency content of MMG signals has alsobeen shown to depend on the physical location alongthe muscle group (Cescon, Farina, Gobbo, Merletti, &Orizio, 2004). Positions along the center line of themuscle, particularly near the belly of the muscle, havebeen shown to produce maximal magnitudes of theMMG signal (Cescon et al., 2004). MMG magnitudehas been found to decrease with increasing distancefrom the center point of the muscle (Cescon et al.,2004). These considerations suggested the adoption ofthe center point of the muscle as the location thatpromised the strongest and most easily interpretedsignals.
The frequency content of MMG signals isexpected to depend on the physical characteristicsof the sensor system as well. The coupled systemconsisting of the target muscle, the fat layer, theskin, the mounting tape, the accelerometer, and themoving mass of the accelerometer cable can beconsidered to act as a multi-degree of freedom mechan-ical oscillator. From studies of the mechanical responseof accelerometers that are mounted to skin layers(Kitazaki & Griffin, 1995), and from general theoryregarding mechanical oscillators (Rao, 1995), it wasconsidered prudent to reduce the mass of the tape,the accelerometer, and the accelerometer cable andto fix the accelerometer to the skin using the stron-gest possible bond (the greatest possible couplingstiffness). Further, it was considered important tolimit the spatial extent of the bi-adhesive tape toapproximately the area of the accelerometer so asto avoid large areas of tape modifying the boundaryconditions of the muscle and skin motion.
ProcedureThe procedure consists of first a measurement of
the force developed during maximal voluntary con-traction (MVC), followed by the application of theaccelerometer and the recording of MMG measure-ments relative to fixed percentages of MVC. The stepsfollowed to measure the force of MVC are:
1. The test subject is requested to sit in the test rig.2. The test subject is asked to put on the polyester
ankle belt, which is then fixed to the load cell.3. The three markers are positioned and body-part
alignment is verified and tuned.4. The MVC test is explained to the subject verbally.
5. Preliminary MVC measurements are attempted tofamiliarize the test subject with the measurement.
6. The test subject is asked to attempt to extend his or herleg with the greatest possible force for 5 seconds whilegrasping the test rig for support. The maximal forcemeasured by the load cell (8 in Figure 3) is read fromthe screen of the digital voltmeter (14 in Figure 3).
7. The test subject is asked to repeat Step 6 a total offour additional times, for a total of five measure-ments, which are averaged to determine a meanvalue of MVC. A 1-minute rest period is observedfor each repetition of Step 6.
After MVC measurement, the accelerometer isplaced at the center point of the muscle and the MMGsignals are acquired. An oscilloscope (11 in Figure 3) isused to monitor the load cell output voltage to achievethe target value of MVC. A target reference level is setat an established percentage of the test subject’s previ-ously recorded mean MVC force. During each test, thesubject is required to start from rest, then reach thetarget value as quickly as possible, and finally holdthe target value for 1.5 seconds before returning to rest.The steps followed to measure MMG are:
1. The center point of the rectus femoris is localizedby asking the subject to perform a leg extension atMVC and by searching for the point of maximummuscle expansion.
2. The center point of the rectus femoris is cleaned,and where necessary shaved, in order to facilitate theadherence of the bi-adhesive tape and accelerometer.
3. A rectangle of bi-adhesive tape is applied to thecenter point of the rectus femoris, and then theaccelerometer is secured to the tape.
4. The MMG test is explained to the subject verbally.5. Preliminary MMG measurements are attempted to
familiarize the test subject with the measurement.6. An MMG recording is made of the acceleration
data contained in a 4.096-second time window(1.5 seconds at rest, a contraction of 1.5 seconds,and the remaining time at rest) relative to a legextension at a target percentage of MVC. Duringthe recording, the subject achieves the target legforce while maintaining his or her upper bodystabilized by means of the test rig handle supports.
7. The test subject is asked to repeat Step 6 a fixednumber of times. A 2-minute rest period is observedfor each repetition of Step 6.

M. G. Antonelli et al. 8
EXPERIMENTAL TESTS ON RECTUS FEMORIS MMG SIGNAL STATISTICAL
BEHAVIORExperimental Conditions
Two healthy male volunteers aged 27 and 30 yearsparticipated in the tests after signing an informed con-sent form and after declaring that they had no historyof neuromuscular or orthopedic disease. Table 1 presentsa set of basic anthropometric parameters of possiblerelevance to the production of the measured MMGsignals that were measured prior to testing. Eachvolunteer was asked to perform a set of 50 MMGmeasurements following the rectus femoris MMGprotocol defined above. The established contractionlevel for all tests was 50% of MVC.
Signal GaussianityClassical methods of vibration analysis often
assume that the measured data are both stationary andGaussian. Such processes are completely described bytheir power spectral density (PSD), which characterizesthe distribution of vibrational energy in the frequencydomain (McConnell, 1995). The testing of whether adata set is Gaussian or not, and thus whether it is fullydescribed by its PSD or not, can be achieved by meansof the Kolmogorov-Smirnov test (Ross, 2004), whichcompares a given data set with a standard normal distri-bution. This nonparametric test can be used to definethe confidence level at which the data can be consideredGaussian.
When deviations from Gaussian behavior areexpected, three global signal statistics are often usedto quantify the size and extent of the deviation(Giacomin, Steinwolf, & Staszewski, 2000). The first isthe RMS value s. For a zero mean process such as the
MMG signals acquired in this study, the RMS valuecan be expressed in terms of the number of datapoints L and the sample time step Δt as
The second is the skewness l, which is the thirdnormalized spectral moment and is defined as theaverage of the instantaneous values x(jΔt cubed. For azero mean process, the skewness can be expressed as
The third statistic often used to quantify the deviationfrom a Gaussian stationary model is the kurtosis g,which is the fourth normalized spectral moment andis sensitive to outlying data. For a zero mean process,the kurtosis can be expressed as
For a Gaussian stationary process, the RMS value willquantify the overall amount of signal energy, whilethe skewness should be close to 0.0 and the kurtosisshould be close to 3.0. The greater the deviation fromeither 0.0 or 3.0, the greater the deviation from aGaussian model.
A question of interest regarding rectus femorisMMG signals is whether or not they are Gaussian. Inorder to clarify this point, 50 MMG signals wererecorded from each of the two volunteers. A two-sidedKolmogorov-Smirnov test was performed by means ofthe MATLAB Version 6 software package (Mathworks,2006). The null hypothesis was that of a standard nor-mal distribution, while the alternative hypothesis wasthat of a nonnormal distribution. For all 100 MMGdata sets, the null hypothesis was rejected at the 1%,5%, and 10% significance levels. The nature of thedeviation from Gaussianity is illustrated in Figure 5,which presents the distribution of skewness and kurtosisvalues determined from the 100 MMG data sets. Mostskewness values are greater than 0.0, while all kurtosisvalues are greater than 3.0.
TABLE 1 Subjects’ anthropometric data
Volunteer 1 Volunteer 2
Musculature (type) Evidence of sportstraining
Average
Age (years) 27 30Mass, kg (lb.) 70 (154.3) 76 (16 7,5)Height, m (in.) 1.780 (70) 1.800 (70.8)Sitting height, m (in.) 0.423 (16.6) 0.476 (18.7)Leg length, m (in.) 0.387 (15.2) 0.407 (16)Thigh length, m (in.) 0.432 (17) 0.430 (16.9)
s D=⎧⎨⎪
⎩⎪
⎫⎬⎪
⎭⎪−
=∑L X j tj
1 2
1
1 2
( ) .
/L
[1]
l s D= − −
=∑L X jj
1 3 3
1
( ).tL
[2]
g s D= − −
=∑L X j tj
1 4 4
1
( ).L
[3]

9 MMG Signals: Rectus Femoris Measurement Protocol
MMG Signal Statistical Convergence Properties
According to the weak law of large numbers (Ross,2004), a sequence of independent and identically dis-tributed random variables with a finite common meanm < ∞ and a partial sum given by Sn = X1 + X2 + … + Xnwill provide a running mean value Sn/n that convergesto m. The question of interest is therefore not that of con-vergence but, rather, that of the rate of convergence.
A statistical convergence analysis was performedto establish the number of repetitions of the MMGacquisition required to obtain stable ensemble averagestatistics. The statistics chosen for the analysis were theRMS and the kurtosis. They were determined for eachsignal of the ensemble of 50 MMG acquisitions per-formed for each of the two test subjects. The resultingRMS and kurtosis values were then randomly ordered soas to reduce any systematic effects due to subject trainingor muscle fatigue. The running mean was then deter-mined for each data series, as shown in Figure 6.
Boxes with dashed lines in Figure 6 indicate thepoints at which the data series first converged to avalue for which an interval of ±5% of the valuecontains the remaining data of the complete series (all50 data measurements). The value of ±5% was consid-ered appropriate since it is a commonly adopted toler-ance in engineering and medical science (Cesconet al., 2004; Perry et al., 2001; Smith et al., 1997). Assuggested by Figures 6a and 6b, the RMS requiredonly 7 and 5 MMG measurements, respectively, toreach ±5% of the terminal mean value of the completeseries, depending on the test subject. Conversely, as
shown in Figures 6c and 6d, 24 and 25 MMG mea-surements were required to reach the same statisticalconvergence in the case of the kurtosis value. Fromthe statistical convergence results obtained for the twotest subjects, it was concluded that 25 acquisitionsshould prove sufficient to adequately characterize rec-tus femoris MMG data.
The possible sufficiency of 25 data acquisitions wasalso supported by frequency domain analyses of theMMG signals. As in the case of the global statistics, thePSD was determined for each MMG data acquisition,and then the sequence order was randomized so as toreduce the effect of any deterministic relationships withtime. Figure 7 presents the mean power spectral densi-ties obtained by averaging the PSDs of the first 2, 3, 6,12, 25, or 50 MMG signals. The mean PSD obtainedfrom 25 averages is qualitatively similar to the meanPSD obtained using all 50 available signals. Characteristicpeaks are present in both PSDs at 3.5 and 10 Hz.
DISCUSSIONThe test protocol defined here was found to be easily
learned by the test participants, and the requirement
FIGURE 5 Skewness and kurtosis values determined for eachof the 50 contraction MMG time histories. Data sets a and c arefrom subject 1, while sets b and d are from subject 2. Eachoriginal time history contained 1,500 data points.
FIGURE 6 Ensemble mean RMS and kurtosis valuesdetermined from the group of 50 isometric contraction MMG timehistories. Data sets a and c are from subject 1, while sets b and dare from subject 2. Each original time history contained 1,500data points.

M. G. Antonelli et al. 10
of achieving the fixed percentages of MVC did notproduce noticeable muscular fatigue over the courseof the 25 measurements. Dermal fixation of the accel-erometer by means of bi-adhesive tape proved adequatefor periods of time exceeding the minimum requiredto perform the 25 measurements. As had been previ-ously reported by Cescon et al. (2004), the position ofthe accelerometer on the muscle was found to have animportant effect on the amplitude and spectral charac-teristics of MMG signals, and therefore the protocolincluded sensor positioning guidelines.
Based on the research of Kitazaki and Griffin(1995), the mass of the sensor used in the protocol isnot felt to produce harmful low-pass filtering effectson the measured MMG signals. The possible effect ofthe mass of the adipose and skin tissue that is locatedbetween the muscle and accelerometer was not, however,quantified in the current study. The mechanical responsecharacteristics of these tissues would be expected to pro-duce some amount of low-pass filtering of the MMG,
but no quantification of this filtering action was foundin the research literature and none was possible in thecurrent study.
A further mechanical property that was not possibleto quantify as part of the current study was the effectof external loads that act upon the rectus femorismuscle. When integrated into an orthotic device,the accelerometer might be expected to find itself incontact with components of the orthosis that createnormal and/or tangential forces. Unfortunately, noresearch literature was found that quantified the possibleeffect of external force on the MMG signal, and thusfurther research in this area would appear important.
The MMG signals acquired for the rectus femorismuscle in the current study are consistent with thosereported by previous investigators (Cescon et al.,2004; Orizio, 1993; Perry et al., 2001; Watakabe et al.,1998; Yoshitake et al., 2002) for other muscle groups.As shown in Figure 6, the time domain analysis sug-gested that the MMG signal amplitudes for volunteer 2were lower than those for volunteer 1. Frequencydomain analysis suggested that the greater part of theenergy of all of the MMG signals was below 50 Hz.Volunteer 2, who had a relatively average muscularstructure, was characterized by both a reduced fre-quency bandwidth and reduced PSD amplitudes incomparison with his counterpart who had undergonesports training. This result agrees with that of Orizio(1993), who suggested that muscular power traininginduces a shift of the PSD toward higher frequencies.
The test protocol defined here is a first step towardthe development of an assistive lower-limb orthosis.The protocol will be used to measure the rectus femorisMMG signals of individuals who suffer muscularweakness (Orizio et al., 1996) due to multiple sclerosis,muscular dystrophy, or old age. Such measurementsare necessary prerequisites to orthosis developmentbecause we have found no MMG measurements fordisabled individuals in the research literature. Statisticalanalysis of the rectus femoris MMG signals seems tosuggest that the RMS value can be used as a controlcriterion for a lower-limb orthosis, in a manner similarto that adopted for the prosthesis arm described bySilva (Silva et al., 2005). In the lower-limb application,the MMG signal might be expected to suffer fromsome mechanical noise caused by movements of thewearer’s body or of the orthosis itself. It is hypothe-sized, however, that it will prove possible to separatethose frequency components from the base MMG
FIGURE 7 Mean PSDs obtained using (a) 2, (b) 3, (c) 6, (d) 12,(e) 25, and (f) 50 averages. Each individual PSD was computedusing a real FFT, a Hanning window, and a data block size of4,096 data points.
a)
b)
c)
d)
e)
f)

11 MMG Signals: Rectus Femoris Measurement Protocol
signal or to adopt a sensor technology (Silva & Chau,2003) that minimizes the difficulty.
CONCLUSIONA test protocol, specified here in terms of measurement
equipment, signal processing requirements, humanpostural requirements, test rig, sensor placement anddermal fixation, and test procedure, has been definedfor the purpose of measuring rectus femoris MMGsignals. The protocol will serve as the basis for charac-terizing rectus femoris MMG behavior so that thesesignals can be used to control orthotic devices such asthe L’Aquila University power lower-limb orthosis.
Preliminary tests of the statistical nature of rectusfemoris MMG signals were performed. The Gaussianityof rectus femoris MMG was evaluated by means of atwo-sided Kolmogorov-Smirnov test. For all 100 MMGdata sets obtained from the testing of two volunteers,the null hypothesis of Gaussianity was rejected at the1%, 5%, and 10% significance levels. Most skewnessvalues were found to be greater than 0.0, while all kur-tosis values were found to be greater than 3.0.
A statistical convergence analysis performed on thesame 100 MMG data sets suggested that only 5 or 7measurements (depending on the human test subject)were required to stabilize the mean RMS value of thedata set to within ±5% of the terminal mean value ofthe complete series. The same convergence analysisalso suggested that 24 or 25 measurements were suffi-cient to achieve a mean kurtosis value that was within±5% of the terminal mean value of the completeseries. It was concluded that 25 MMG acquisitionsshould prove sufficient to statistically characterizerectus femoris MMG. This conclusion is supportedby the qualitative characteristics of the mean powerspectral densities obtained using 25 averages.
REFERENCESBarry, D. T., Leonard, J. A., Gitter, A. J., & Ball, R. D. (1986). Acoustic
myography as a control signal for an externally powered prosthesis.Archives of Physical Medicine and Rehabilitation, 67, 267–269.
Bolton, C. F., Parkes, A., Thompson, T. R., Clark, M. R., & Sterne, C. J.(1989). Recording sound from human skeletal muscle: Technical andphysiological aspects. Muscle & Nerve, 12, 126–134.
Campos, M. F. M., & Pinto, S. (1999, July). A simple one degree offreedom functional robotic hand orthosis. Paper presented at theInternational Conference on Rehabilitation Robotics, Stanford, CA.
Cescon, C., Farina, D., Gobbo, M., Merletti, R., & Orizio, C. (2004).Effect of accelerometer location on mechanomyogram variablesduring voluntary, constant-force contractions in three human
muscles. Medical and Biological Engineering and Computing, 42,121–127.
Childress, D. S. (1995). Myoelectric control: Brief history, signal origins,and signal processing. Capabilities of Northwestern UniversityProsthetics Research Laboratory & Rehabilitation EngineeringResearch Program, 4, 6–7.
Craelius, W., Abboudi, R. L., & Newby, N. A. (1999, July). Control of amulti-finger prosthetic hand. Paper presented at the InternationalConference on Rehabilitation Robotics, Stanford, CA.
Davalli, A., & Sacchetti, R. (2003, April). Mini joystick for upper limbprosthesis. Paper presented at the International Conference onRehabilitation Robotics, Daejeon, Korea.
Ebersole, K. T., Housh, T. J., Evetovich, T. K., & Cramer, J. T. (2001,August). Mechanomyographic and electromyographic responses toisokinetic muscle actions. Paper presented at the annual meeting ofthe American Society of Biomechanics, San Diego, CA.
Elwell, C. E. (1995). A practical users guide to near infrared spectroscopy.Hamamatsu, Japan: Hamamatsu Photonics.
Ferris, D. P., Czerniecki, J. M., & Hannaford, B. (2005). An ankle-footorthosis powered by artificial pneumatic muscles. Journal of AppliedBiomechanics, 21, 189–197.
Giacomin, J., Steinwolf, A., & Staszewski, W. J. (2000). Application ofmildly nonstationary mission synthesis (MNMS) to automotive roaddata. Engineering Integrity, 7, 44–56.
Kampas, P. H. (2001). The optimal use of myoelectrodes. MedizinischOrthopädische Technik, 121, 21–27.
Kendall, F. P., Kendall McCreary, E., & Provance, P. G. (1999). Muscles:Testing and function. Baltimore: Lippincott Williams & Wilkins.
Kenney, L. P. J., Lisitsa, I., Bowker, P., Heath, G. H., & Howard, D.(1999). Dimensional change in muscle as a control signal forpowered upper limb prosthesis: A pilot study. Medical Engineering &Physics, 21, 589–597.
Kitazaki, S., & Griffin, M. (1995). A data correction method for surfacemeasurement of vibration on the human body. Journal of Biomechanics,28, 885–890.
Lauer, R. T., Peckham, P. H., & Kilgore, K. L. (1999). EEG-basedcontrol of a hand grasp neuroprosthesis. NeuroReport, 10,1767–1771.
Mathworks. (2006). Matlab—User manual. Natick, MA: Author.McConnell, K. G. (1995). Vibration testing—Theory and practice.
New York: Wiley.Orizio, C. (1993). Muscle sound: Bases for the introduction of a mecha-
nomyographic signal in muscle studies. Critical Reviews in BiomedicalEngineering, 21, 201–243.
Orizio, C., Liberati, D., Locatelli, C., De Grandis, D., & Veicsteinas, A.(1996). Surface mechanomyogram reflects muscle fibres twitchessummation. Journal of Biomechanics, 29, 475–481.
Perry, S. R., Housh, T. J., Weir, J. P., Johnson, G. O., Bull, A. J., &Ebersole, K. T. (2001). Mean power frequency and amplitude ofthe mechanomyographic and electromyographic signals duringincremental cycle ergometry. Journal of Electromyography andKinesiology, 11, 299–305.
Pfurtscheller, G., Guger, C., Muller, G., Krausz, G., & Neuper, C. (2000).Brain oscillations control orthosis in a tetraplegic. NeuroscienceLetters, 292, 211–214.
Rahman, T., Nam, J., Sample, W., & Seliktar, R. (2002, March). Develop-ment of WREX—A power-assisted arm orthosis. Paper presented atthe Cambridge Workshop on Universal Access and Assistive Technology,Cambridge, England.
Rao, S. S. (1995). Mechanical vibrations. Boston: Addison-Wesley.Raparelli, T., Durante, F., & Beomonte Zobel, P. (2002, November).
Development of a pneumatic knee orthosis. Paper presented at theInternational Symposium on Fluid Power, Nara, Japan.
Raparelli, T., Beomonte Zobel, P., & Durante, F. (2004). Poweredlower limb orthosis for assisting standing up and sittingdown movements. In S. Keates, P. J. Clarkson, P. M. Langdon, &P. Robinson (Eds.), Design a more inclusive world (pp. 205–214).New York: Springer.

M. G. Antonelli et al. 12
Redford, J. B., Basmajian, J. V., & Trautman, P. (1995). Orthotics—Clinical practice and rehabilitation technology. London: ChurchillLivingstone.
Reilly, P., Bull, A. M. J., Amis, A. A., Wallace, A. L., & Emery, R. J. H.(2003). Arthroscopically insertable force probes in the rotator cuff invivo. Arthroscopy: The Journal of Arthroscopic and Related Surgery,19, 8.
Rosen, J., Brand, M., Fuchs, M. B., & Arcan, M. (2001). A myosignal-based powered exoskeleton system. IEEE Transactions onSystems, Man and Cybernetics—Part A: Systems and Humans, 31,210–222.
Ross, S. M. (2004). Introduction to probability and statistics for engi-neers and scientists. Amsterdam: Elsevier.
Silva, J., & Chau, T. (2003). Coupled microphone-accelerometer sensorpair for dynamic noise reduction in MMG signal recording. ElectronicsLetters, 39, 1496.
Silva, J., Heim, W., & Chau, T. (2005). A self-contained, mechanomyo-graphy-driven externally powered prosthesis. Archives of PhysicalMedicine and Rehabilitation, 86, 2066–2070.
Smith, D. B., Housh, T. J., Stout, J. R., Johnson, G. O., Evetovich, T. K., &Ebersole, K. T. (1997). Mechanomyographic responses to maximaleccentric isokinetic muscle actions. Journal of Applied Physiology,82, 1003–1007.
Stokes, M. J., & Dalton, P. A. (1991). Acoustic myographic activityincreases linearly up to maximal voluntary isometric contraction inthe human quadriceps muscle. Journal of the Neurological Sciences,101, 163–167.
Suzuki, S., Takasaki, S., Ozaki, T., & Kobayashi, Y. (1999, January).A tissue oxygenation monitor using NIR spatially resolved spectroscopy.Paper presented at the Conference on Optical Tomography andSpectroscopy of Tissue, San Jose, CA.
Upasani, A. V., Kapoor, C., & Tesar, D. (1999, September). Survey ofavailable sensor technology for robotic hands. Paper presented atthe Design Engineering Technical Conferences and Computers inEngineering Conference, Las Vegas, NV.
Veltink, P. H., Hermens, H. J., Baten, C. T. M., Slycke, P., Buma, D., &Luinge, H. J. (2001, June). Ambulatory systems for enhanced humanmotor control. Paper presented at the Workshop on European Scientificand Industrial Collaboration, Enschede, The Netherlands.
Watakabe, M., Itoh, Y., Mita, K., & Akataki, K. (1998). Technical aspectsof mechanomyography recording with piezoelectric contact sensor.Medical & Biological Engineering & Computing, 36, 557–561.
Yoshitake, Y., Shinoara, M., Ue, H., & Moritani, T. (2002). Characteristicsof surface mechanomyogram are dependent on development offusion of motor units in humans. Journal of Applied Physiology,93, 1744–1752.