use of mobile maps and satellite information in pa corné
TRANSCRIPT
Spatial variation within agricultural fields
and site-specific crop management
Use of mobile maps and satellite information in PA
Corné Kempenaar
Geospatial world forum, seminar on mobile mapping, Amsterdam, 25 april 2012
Content
Introduction to precision agriculture (PA)
Use of maps in crop management
● Specific case of variable rate application of a specific group of herbicides using biomass maps
● Variable rate application of soil herbicides using soil maps
Concluding remarks
Precision Agriculture
PA is a farming management concept based on observing and responding to intra-field variations.
● It relies on new technologies like satellite imagery, nearby sensors for soil, climate and crop properties, information technology, decision support, specific implements and geospatial tools.
● It is aided by farmers’ ability to locate their precise position in a field using satellite positioning systems like GPS.
● Autonomous vehicles and robots will be used in this concept more and more.
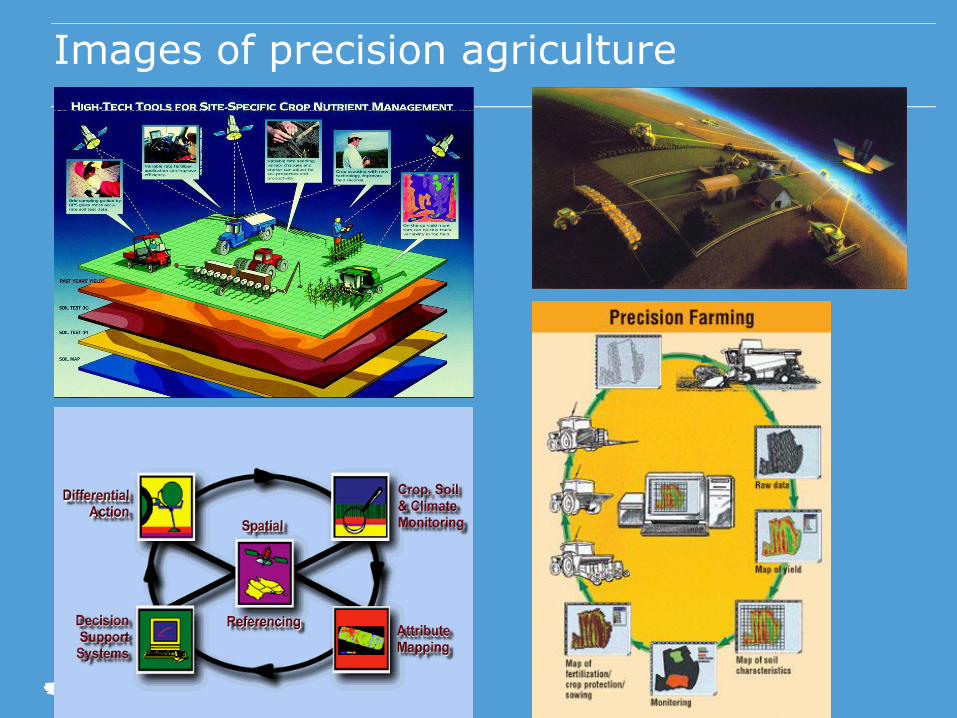
Images of precision agriculture

State of the art use satellites in PA
The many satellites around the world support PA with
● References for positing systems
● Qualitative and quantitative crop information
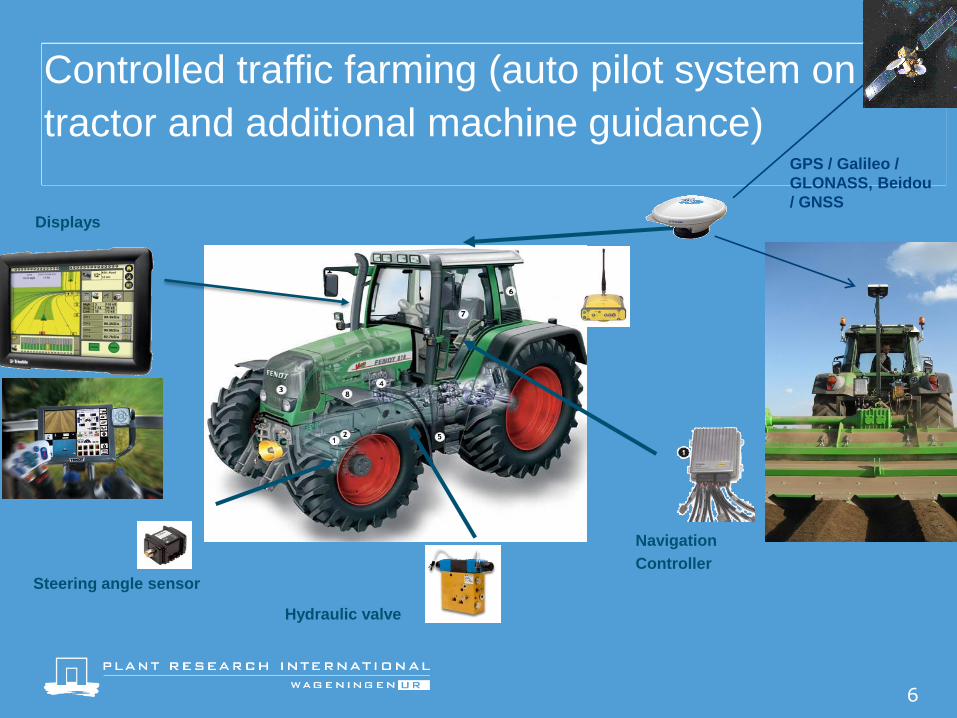
Positioning systems allow controlled traffic farming
● Nearly 10% of farms in NL have auto pilot systems
Satellite sensors provide data for
● Land use monitoring
● Crop and yield monitoring
● Optimization of crop management
6
Controlled traffic farming (auto pilot system on
tractor and additional machine guidance)
Hydraulic valve
Steering angle sensor
Navigation
Controller
Displays
GPS / Galileo /
GLONASS, Beidou
/ GNSS
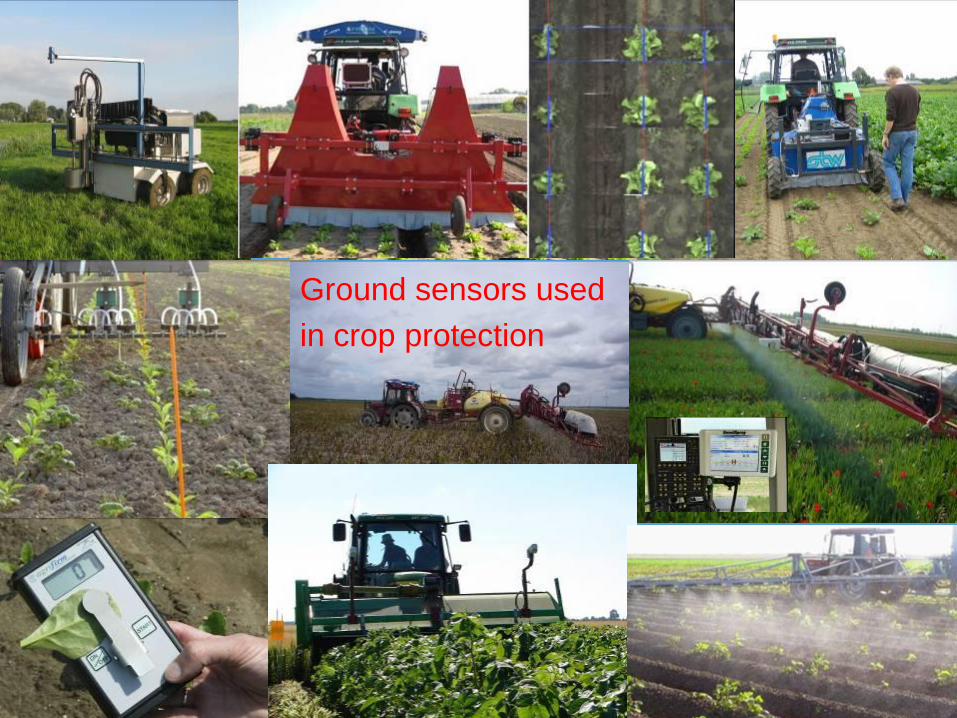
Ground sensors used
in crop protection
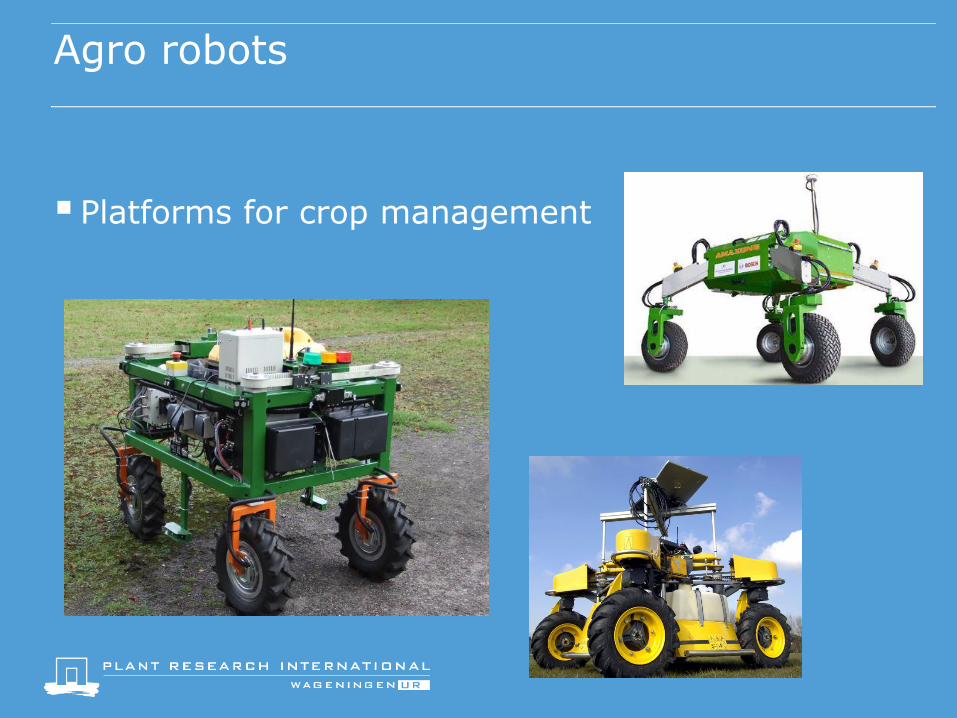
Agro robots
Platforms for crop management
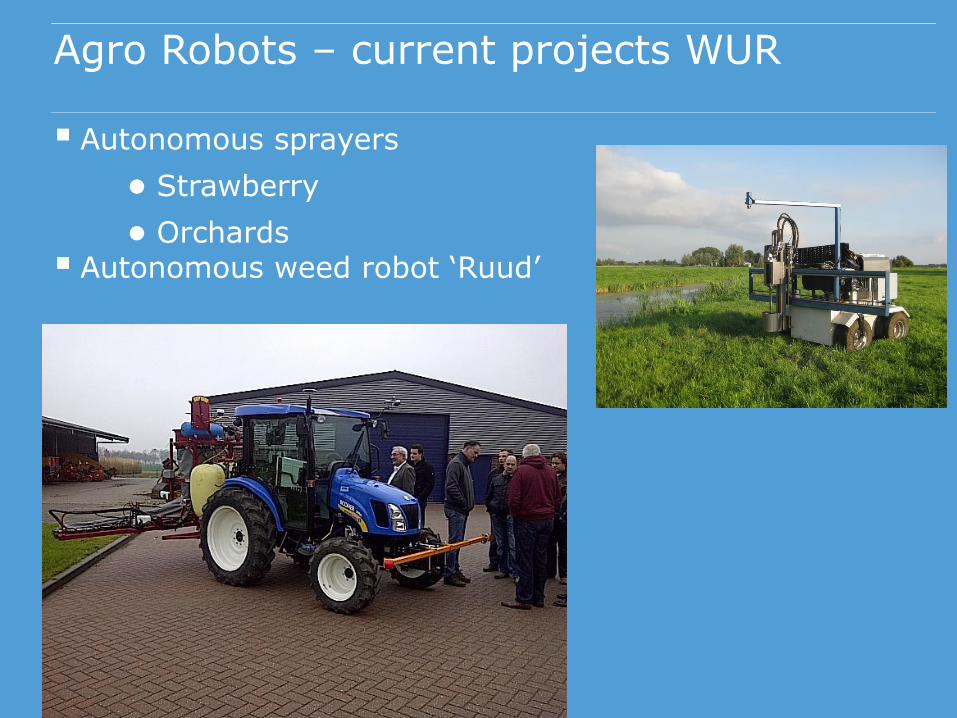
Agro Robots – current projects WUR
Autonomous sprayers
● Strawberry
● Orchards Autonomous weed robot ‘Ruud’

Variable rate application of pesticides
Case of potato haulm killing
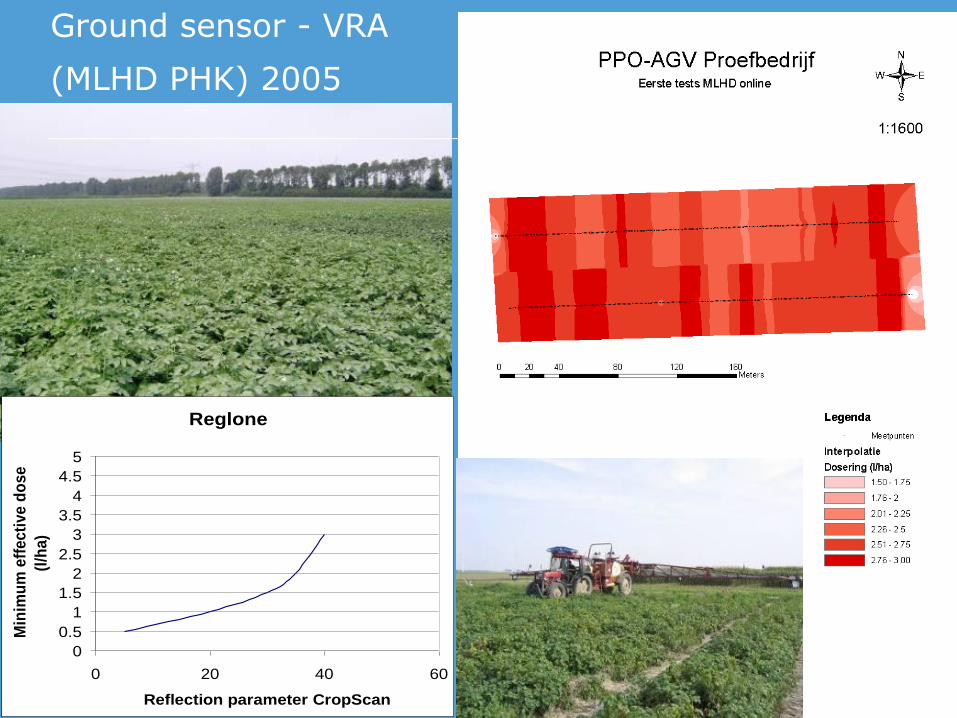
Ground sensor - VRA
(MLHD PHK) 2005
Reglone
0
0.5
1
1.5
2
2.5
3
3.5
4
4.5
5
0 20 40 60
Reflection parameter CropScan
Min
imu
m e
ffe
cti
ve
do
se
(l/h
a)
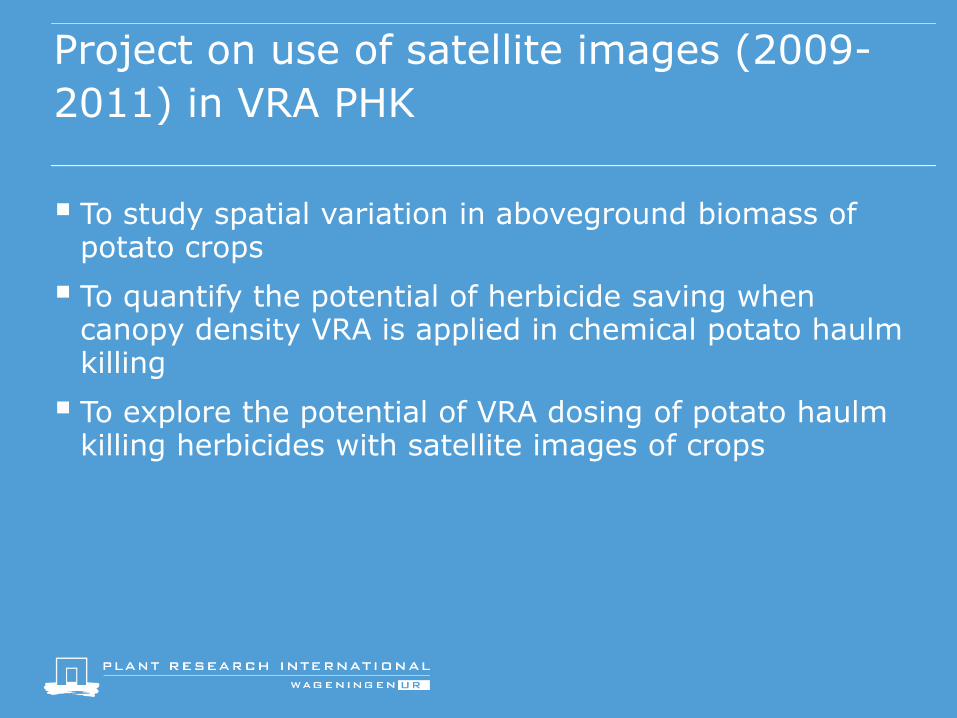
Project on use of satellite images (2009-
2011) in VRA PHK
To study spatial variation in aboveground biomass of potato crops
To quantify the potential of herbicide saving when canopy density VRA is applied in chemical potato haulm killing
To explore the potential of VRA dosing of potato haulm killing herbicides with satellite images of crops
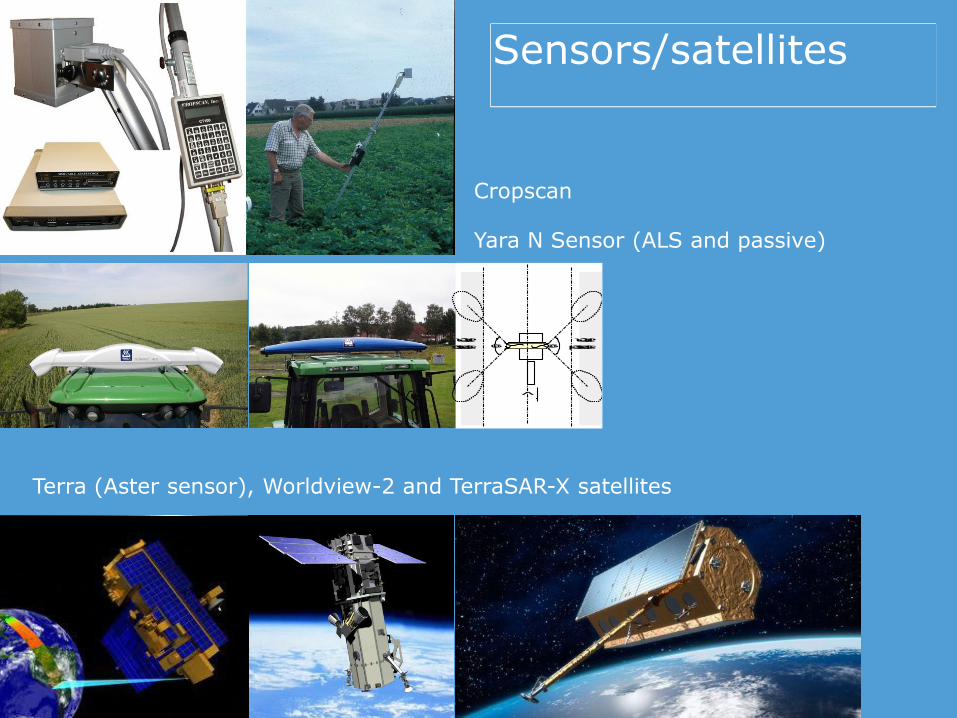
Sensors/satellites
Cropscan
Yara N Sensor (ALS and passive)
Terra (Aster sensor), Worldview-2 and TerraSAR-X satellites
90° sensed
area
v
90°sensed
area
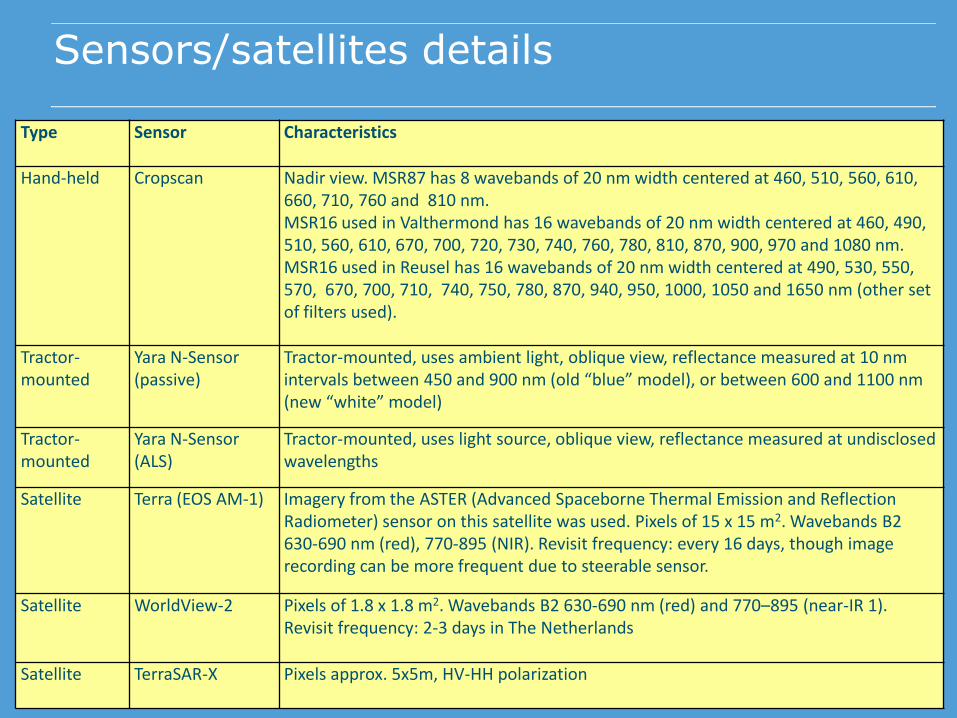
Sensors/satellites details
Type Sensor Characteristics
Hand-held Cropscan Nadir view. MSR87 has 8 wavebands of 20 nm width centered at 460, 510, 560, 610, 660, 710, 760 and 810 nm. MSR16 used in Valthermond has 16 wavebands of 20 nm width centered at 460, 490, 510, 560, 610, 670, 700, 720, 730, 740, 760, 780, 810, 870, 900, 970 and 1080 nm. MSR16 used in Reusel has 16 wavebands of 20 nm width centered at 490, 530, 550, 570, 670, 700, 710, 740, 750, 780, 870, 940, 950, 1000, 1050 and 1650 nm (other set of filters used).
Tractor-mounted
Yara N-Sensor (passive)
Tractor-mounted, uses ambient light, oblique view, reflectance measured at 10 nm intervals between 450 and 900 nm (old “blue” model), or between 600 and 1100 nm (new “white” model)
Tractor-mounted
Yara N-Sensor (ALS)
Tractor-mounted, uses light source, oblique view, reflectance measured at undisclosed wavelengths
Satellite Terra (EOS AM-1) Imagery from the ASTER (Advanced Spaceborne Thermal Emission and Reflection Radiometer) sensor on this satellite was used. Pixels of 15 x 15 m2. Wavebands B2 630-690 nm (red), 770-895 (NIR). Revisit frequency: every 16 days, though image recording can be more frequent due to steerable sensor.
Satellite WorldView-2 Pixels of 1.8 x 1.8 m2. Wavebands B2 630-690 nm (red) and 770–895 (near-IR 1). Revisit frequency: 2-3 days in The Netherlands
Satellite TerraSAR-X Pixels approx. 5x5m, HV-HH polarization
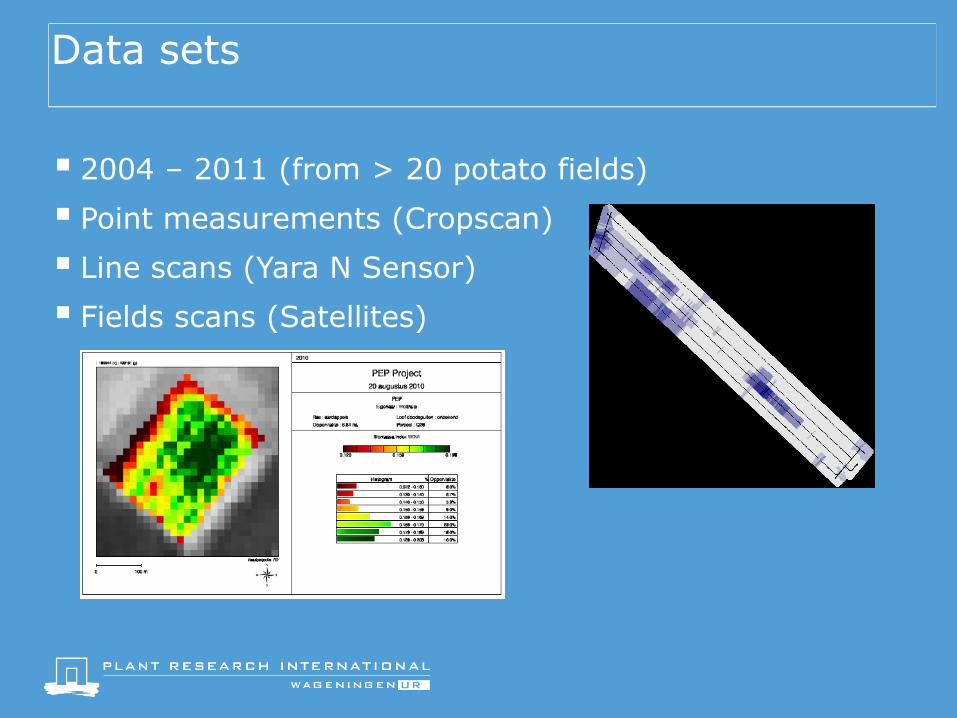
Data sets
2004 – 2011 (from > 20 potato fields)
Point measurements (Cropscan)
Line scans (Yara N Sensor)
Fields scans (Satellites)
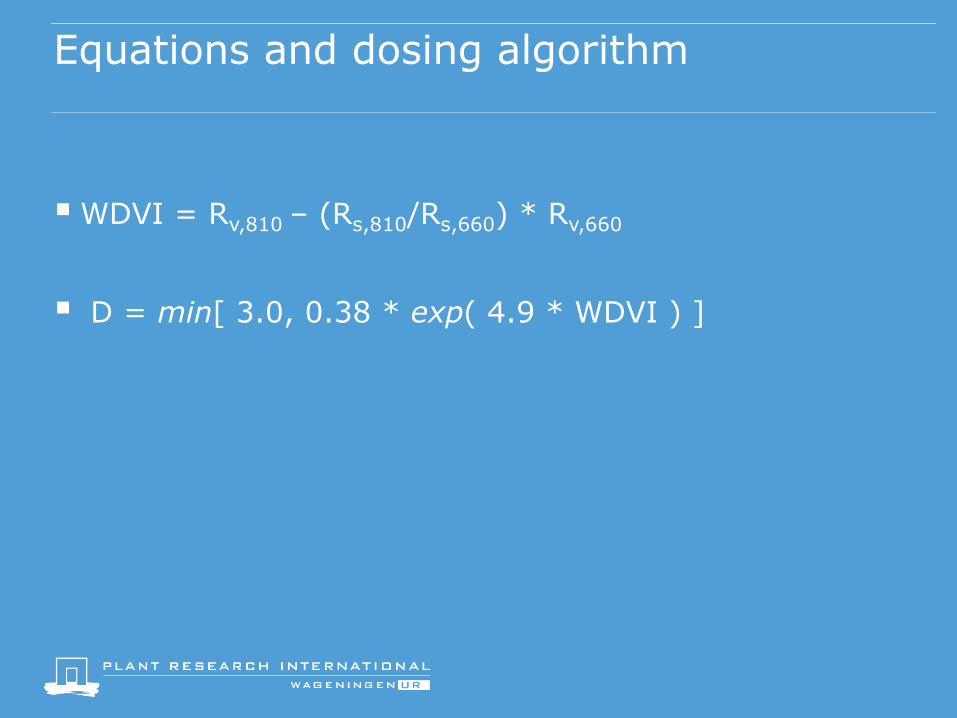
Equations and dosing algorithm
WDVI = Rv,810 – (Rs,810/Rs,660) * Rv,660
D = min[ 3.0, 0.38 * exp( 4.9 * WDVI ) ]
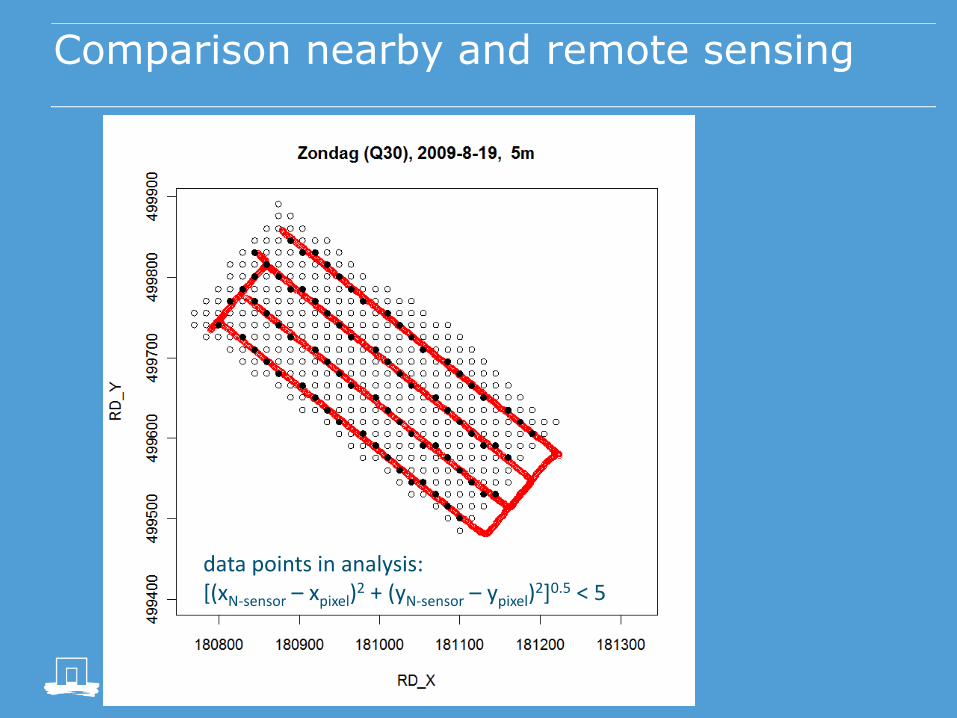
Comparison nearby and remote sensing
data points in analysis: [(xN-sensor – xpixel)
2 + (yN-sensor – ypixel)2]0.5 < 5
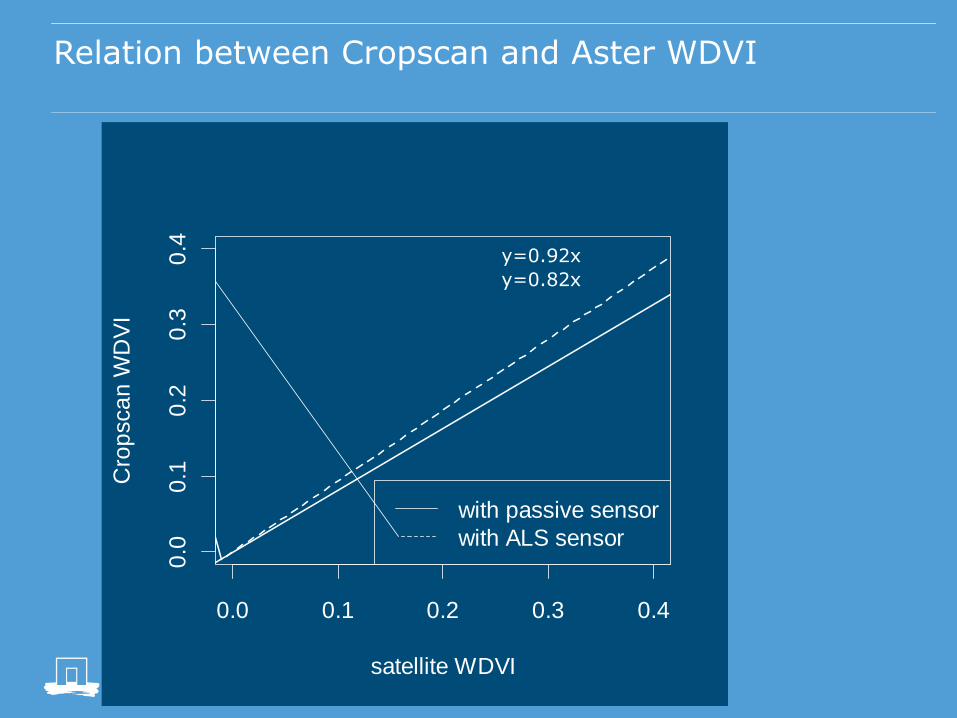
Relation between Cropscan and Aster WDVI
0.0 0.1 0.2 0.3 0.4
0.0
0.1
0.2
0.3
0.4
satellite WDVI
Cro
psca
n W
DV
I
with passive sensor
with ALS sensor
y=0.92x
y=0.82x
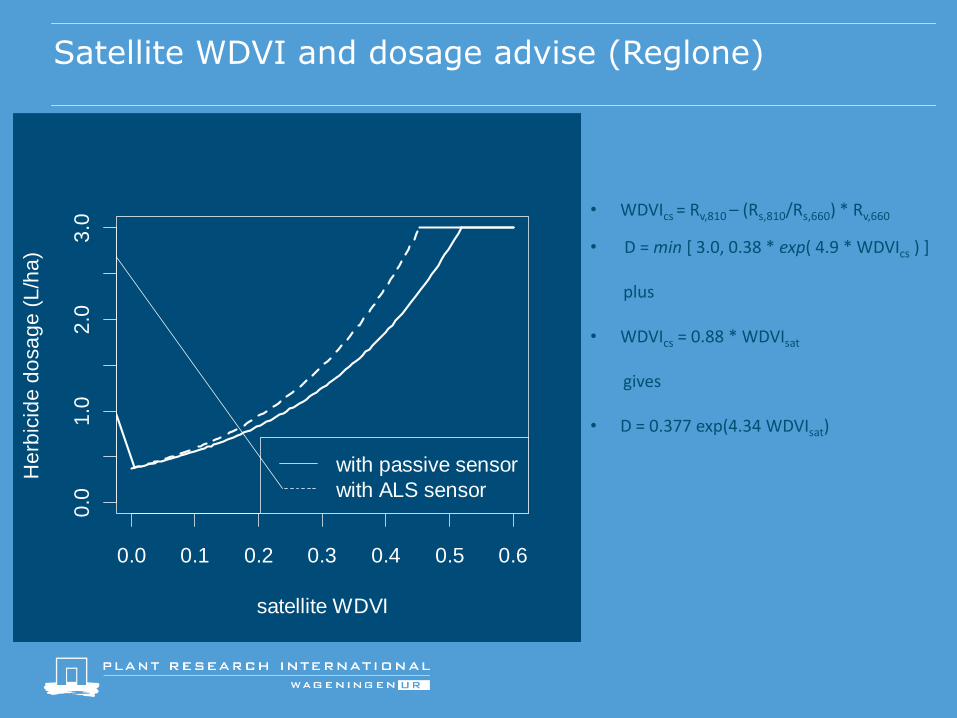
Satellite WDVI and dosage advise (Reglone)
0.0 0.1 0.2 0.3 0.4 0.5 0.6
0.0
1.0
2.0
3.0
satellite WDVI
He
rbic
ide
do
sa
ge
(L
/ha
)
with passive sensor
with ALS sensor
• WDVIcs = Rv,810 – (Rs,810/Rs,660) * Rv,660
• D = min [ 3.0, 0.38 * exp( 4.9 * WDVIcs ) ]
plus
• WDVIcs = 0.88 * WDVIsat
gives
• D = 0.377 exp(4.34 WDVIsat)
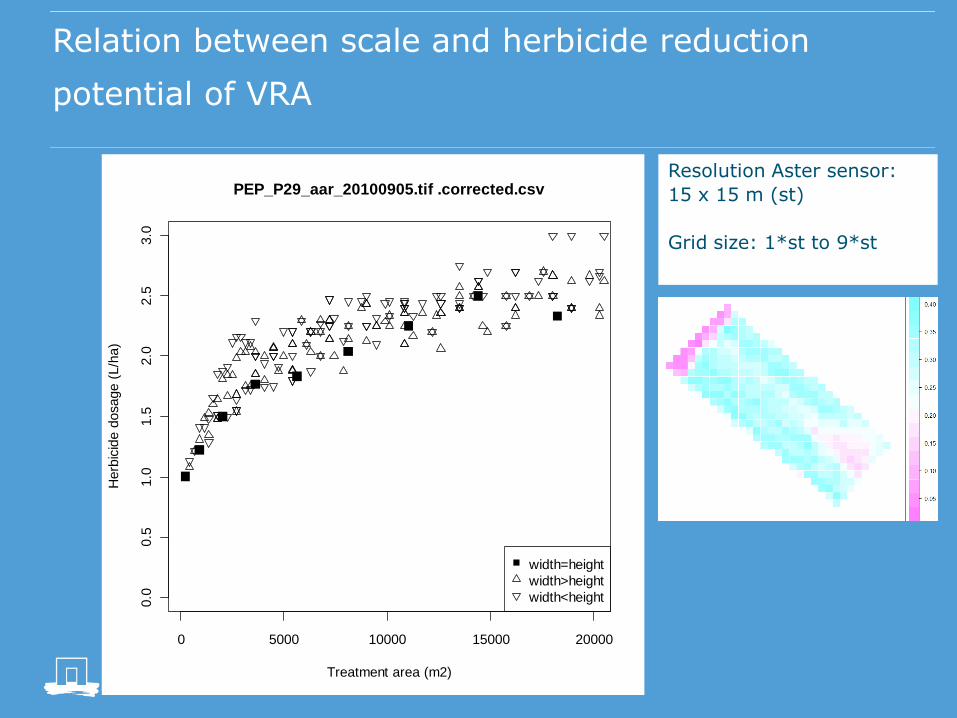
Relation between scale and herbicide reduction
potential of VRA
0 5000 10000 15000 20000
0.0
0.5
1.0
1.5
2.0
2.5
3.0
PEP_P29_aar_20100905.tif .corrected.csv
Treatment area (m2)
Herb
icid
e d
osage (
L/h
a)
width=height
width>height
width<height
Resolution Aster sensor:
15 x 15 m (st)
Grid size: 1*st to 9*st
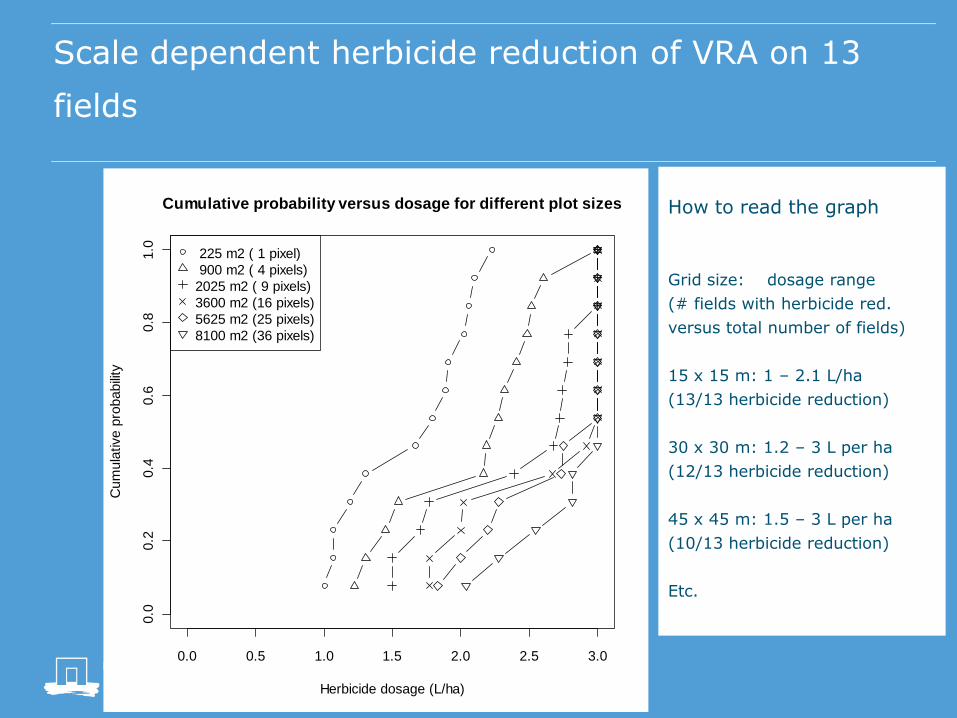
Scale dependent herbicide reduction of VRA on 13
fields
0.0 0.5 1.0 1.5 2.0 2.5 3.0
0.0
0.2
0.4
0.6
0.8
1.0
Cumulative probability versus dosage for different plot sizes
Herbicide dosage (L/ha)
Cum
ula
tive p
robabili
ty
225 m2 ( 1 pixel)
900 m2 ( 4 pixels)
2025 m2 ( 9 pixels)
3600 m2 (16 pixels)
5625 m2 (25 pixels)
8100 m2 (36 pixels)
How to read the graph
Grid size: dosage range
(# fields with herbicide red.
versus total number of fields)
15 x 15 m: 1 – 2.1 L/ha
(13/13 herbicide reduction)
30 x 30 m: 1.2 – 3 L per ha
(12/13 herbicide reduction)
45 x 45 m: 1.5 – 3 L per ha
(10/13 herbicide reduction)
Etc.
Demonstration of VRA potato haulm killing
herbicides with remote sensing biomass
maps
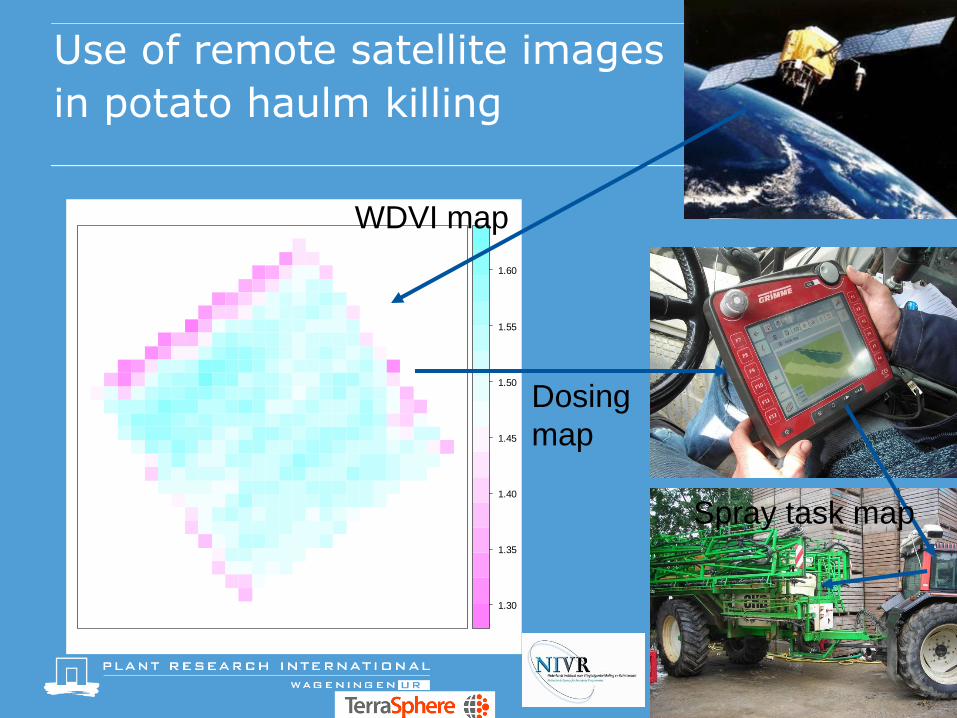
Use of remote satellite images
in potato haulm killing
1.30
1.35
1.40
1.45
1.50
1.55
1.60
WDVI map
Spray task map
Dosing
map
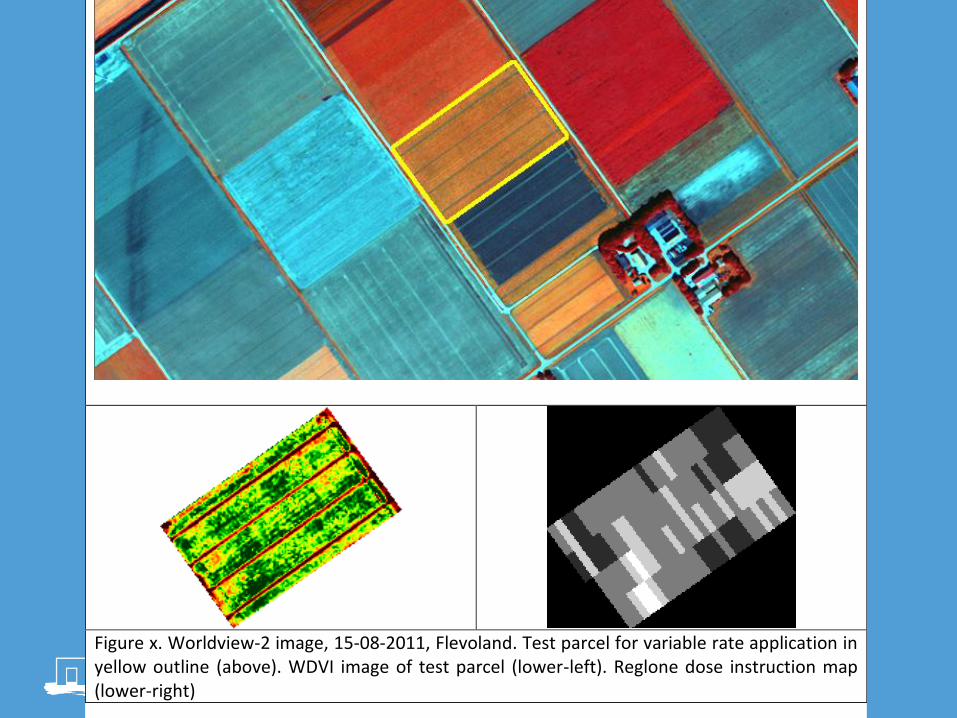
Figure x. Worldview-2 image, 15-08-2011, Flevoland. Test parcel for variable rate application in yellow outline (above). WDVI image of test parcel (lower-left). Reglone dose instruction map (lower-right)
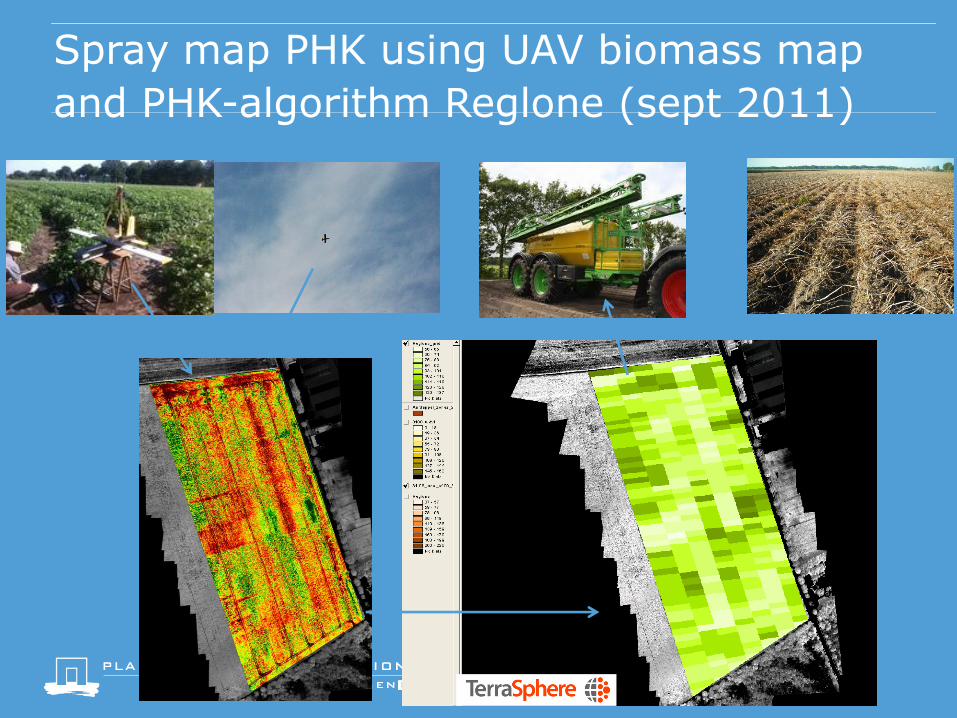
Spray map PHK using UAV biomass map
and PHK-algorithm Reglone (sept 2011)
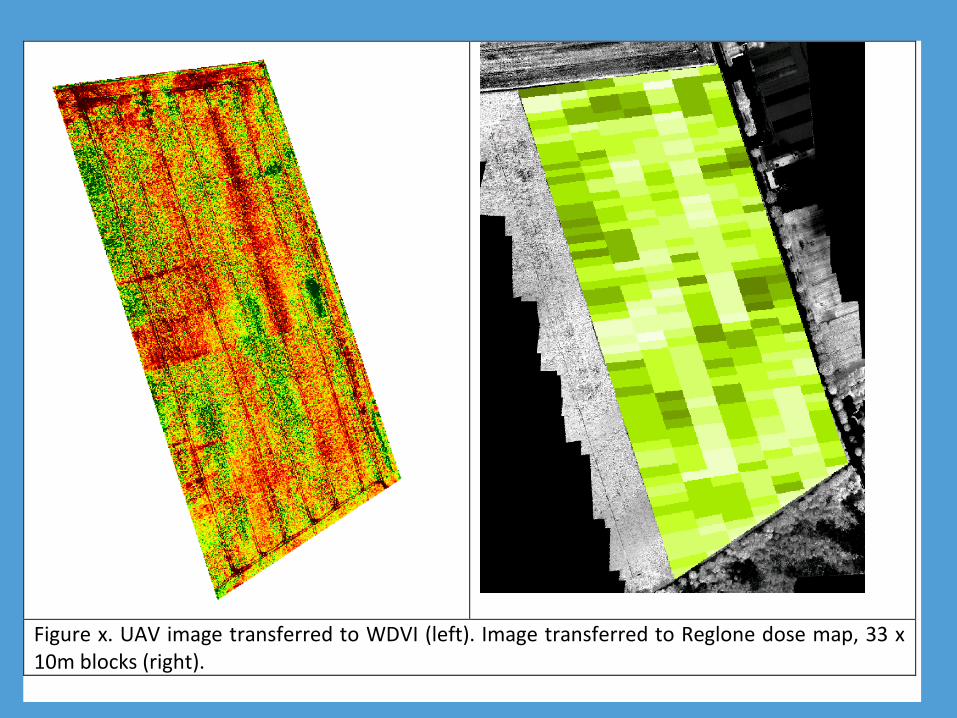
Figure x. UAV image transferred to WDVI (left). Image transferred to Reglone dose map, 33 x 10m blocks (right).

Conclusions from the study
Algorithms have been developed to related satellite WDVI to minimum effective doses of potato haulm killing herbicides
The potential of herbicide reduction is scale dependent
The concept of RS based dosage recommendation of potato haulm killing herbicides was demonstrated
So, both satellite and nearby sensor images can be used in VRA of pesticides in agriculture and other crop management
Other use of satellite images in PA
VRA of fungicides / growth regulators ......
VRA of crop nutrients
Yield monitoring and prediction
Crop development stage monitoring
Crop stress monitoring
Soil properties assessment
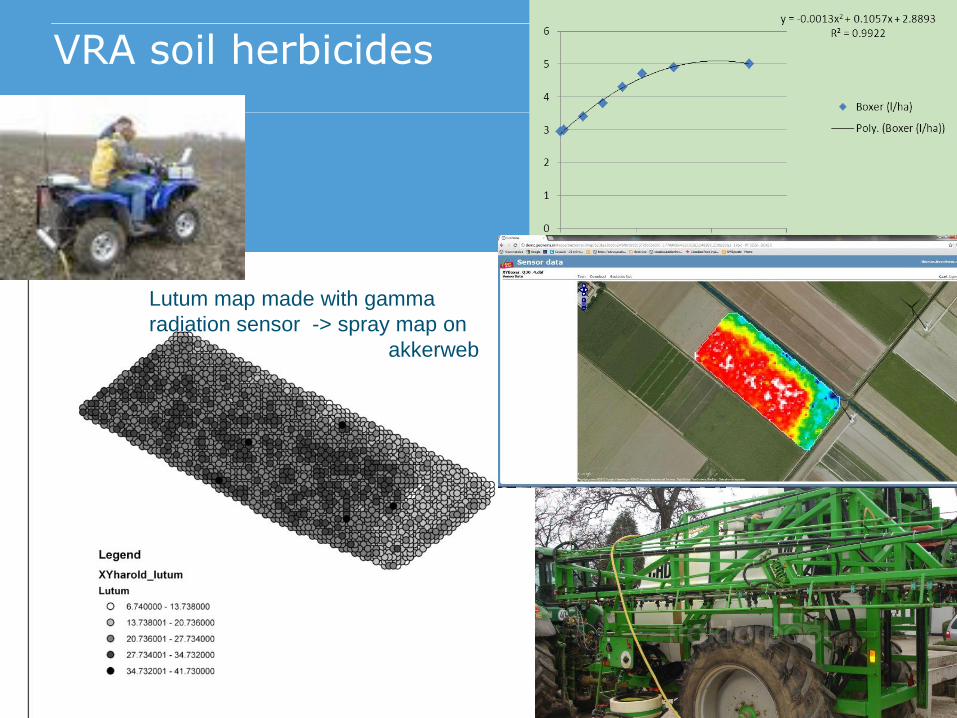
VRA soil herbicides
Lutum map made with gamma
radiation sensor -> spray map on
akkerweb

End of
presentation
More info:
www.precisielandbouw.eu
+ 31 317 480498

Plaatje yield potential of field
Plaatje crop management
Soil map and plant density
Idem soil herbicide
MLHD PHK
Fertilization
Irrigation
CDS fungicides
Pavements ImagJ sportsfields
Crop and yield monitoring
Vragen Sander
Mijn akker
Combineren
Fenology and quality
Concluding remarks
Battle ground and remote sensing
Standardization
Platforms
Challenges
Stress detection