usim webcast 3q06 versão p pdf - v4-usiminas.infoinvest...
TRANSCRIPT
WebcastThird Quarter 2006 Results
Presentation:Paulo Penido Pinto MarquesCFO and Investor Relations Director
Disclaimer
2
“Declarations relative to business perspectives of the Company,operating and financial results and projections, and references tothe growth of the Company, constitute mere forecasts and werebased on Management’s expectations in relation to futureperformance. These expectations are highly dependent on marketbehavior, Brazil’s economic situation, the industry andinternational markets, and are therefore subject to change.”
3
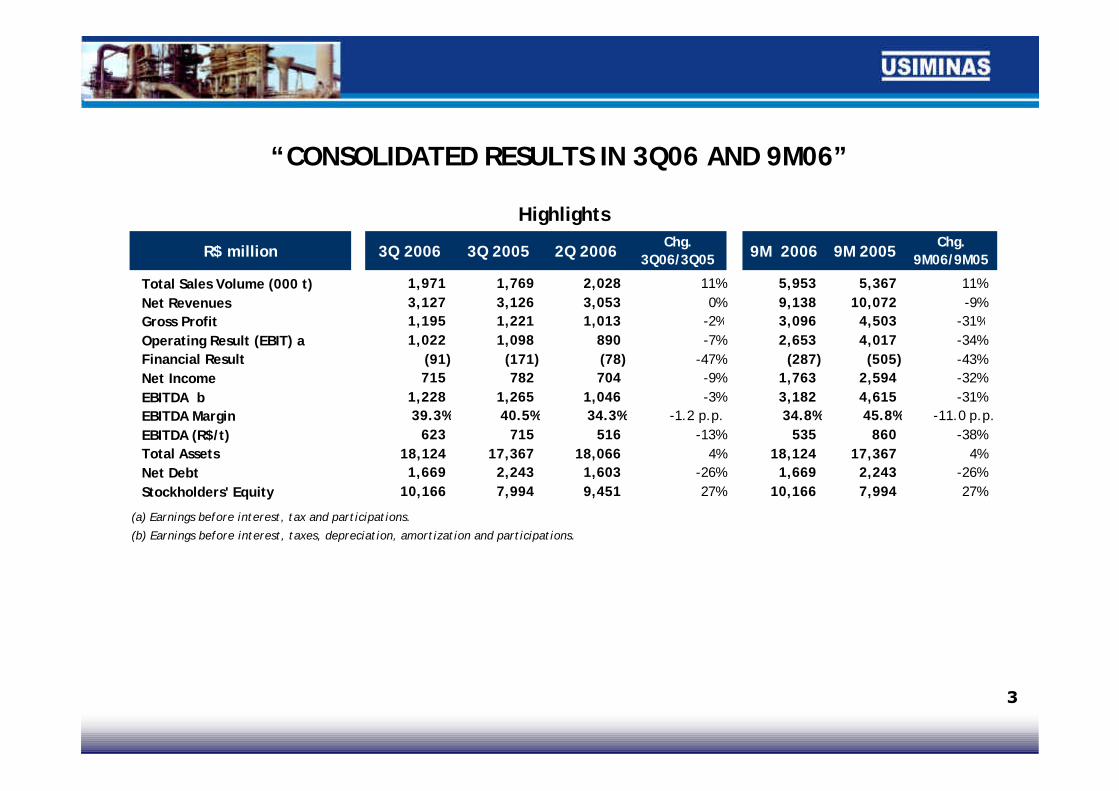
“CONSOLIDATED RESULTS IN 3Q06 AND 9M06”
R$ million 3Q 2006 3Q 2005 2Q 2006 Chg. 3Q06/3Q05 9M 2006 9M 2005 Chg.
9M06/9M05
Total Sales Volume (000 t) 1,971 1,769 2,028 11% 5,953 5,367 11%Net Revenues 3,127 3,126 3,053 0% 9,138 10,072 -9%Gross Profit 1,195 1,221 1,013 -2% 3,096 4,503 -31%Operating Result (EBIT) a 1,022 1,098 890 -7% 2,653 4,017 -34%Financial Result (91) (171) (78) -47% (287) (505) -43%Net Income 715 782 704 -9% 1,763 2,594 -32%EBITDA b 1,228 1,265 1,046 -3% 3,182 4,615 -31%EBITDA Margin 39.3% 40.5% 34.3% -1.2 p.p. 34.8% 45.8% -11.0 p.p.EBITDA (R$/t) 623 715 516 -13% 535 860 -38%Total Assets 18,124 17,367 18,066 4% 18,124 17,367 4%Net Debt 1,669 2,243 1,603 -26% 1,669 2,243 -26%Stockholders' Equity 10,166 7,994 9,451 27% 10,166 7,994 27%
(a) Earnings before interest, tax and participations.(b) Earnings before interest, taxes, depreciation, amortization and participations.
Highlights
4
• Sales Volume: In 3Q06, slight decrease compared to 2Q06, although 11%above y-o-y in 9M06
• Net Revenue: 2% above 2Q06 due to improved avg. prices, totalingR$ 9.1 billion in the year.Net Revenues per tonne: 8% increase in total sales (Dom. & Exp. market)
• EBITDA: Up 17% from 2Q06, accumulating R$ 3.2 billion in the year
• EBITDA Margin: Rose to 39% from 34% in 2Q06
• Net Profit: 2% higher than 2Q06, totaling R$ 1.8 billion in the year
• Maintenance of Domestic Market leadership: 52% Market Share
HIGHLIGHTS“Consistent results within its annual planning”

Shareholders’ Structure - New Control Group
5
Previ14.9%
CVRD12.3%
Others8.9%Votorantim
11.6%
Usiminas Pension Fund
10.1%
Nippon Group24.7%
CVRD5.9%
Camargo Corrêa11.6%C
ontr
ol G
rou
p:
63
.9%
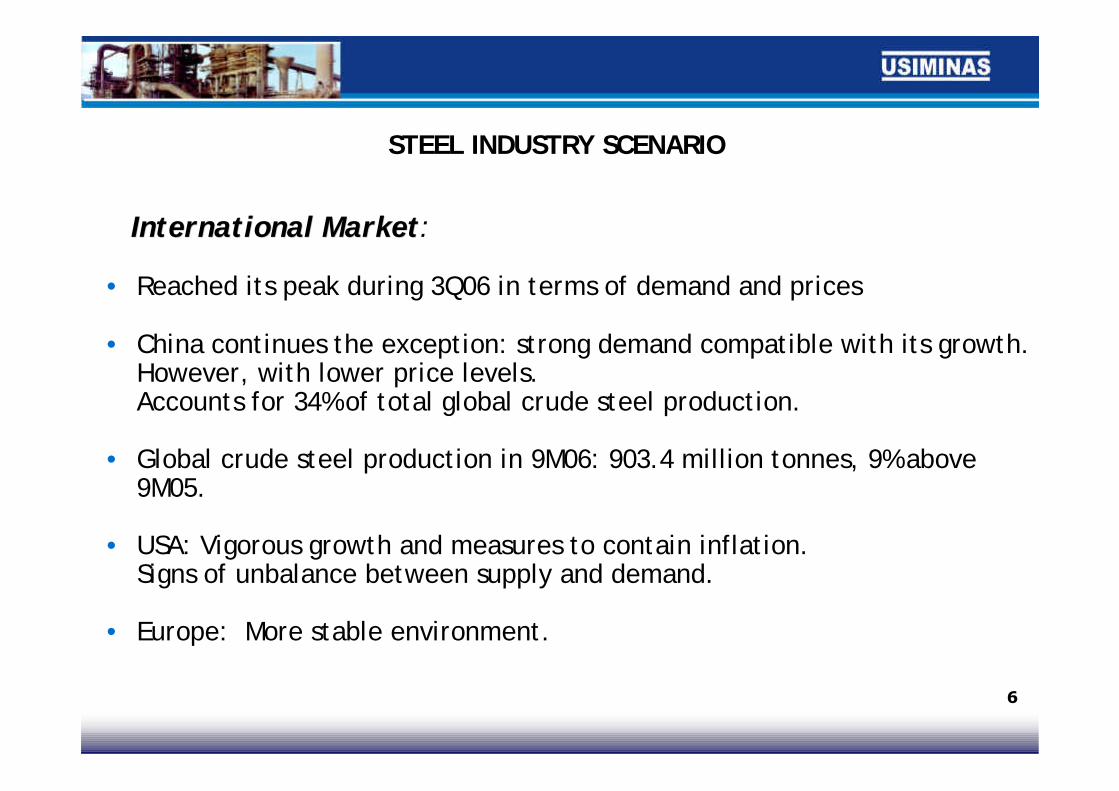
• Reached its peak during 3Q06 in terms of demand and prices
• China continues the exception: strong demand compatible with its growth.However, with lower price levels.Accounts for 34% of total global crude steel production.
• Global crude steel production in 9M06: 903.4 million tonnes, 9% above9M05.
• USA: Vigorous growth and measures to contain inflation.Signs of unbalance between supply and demand.
• Europe: More stable environment.
6
STEEL INDUSTRY SCENARIO
International MarketInternational Market:

STEEL INDUSTRY SCENARIO
Domestic Market:Domestic Market:
• Crude steel production: totaled 22.8 million tonnes in 9M06 -decrease of 4% compared to 9M05.
• Domestic flat steel demand:
3Q06/3Q05 Change: 18% growth.Highlight for civil construction/shapes, distribution, autoparts,highway equipment and electronics segments.
9M06/9M05 Change: 3% growth.Highlight for segments that were benefited by increase inconsumption; Automotive, Electrical/Electronic Equipment andDomestic Appliances.
7

• Total sales in 3Q06: 1.97 MMt,3Q06/3Q05 = 11% higher and3Q06/2Q06 = 3% decrease
• Domestic sales growth of 11% over3Q05 and 4% decrease over 2Q06.
• Export sales - 13% growth over 3Q05and 1% decrease over 2Q06.
• Accumulated sales 9M06: 5.95 MMt,11% above 9M05.
8
USIMINAS - CONSOLIDATED SALES
75% 74% 65% 64% 73%72% 71% 71% 78% 70% 69%
75% 74% 65%
Consolidated Sales (000 t)
1Q03 2Q03 3Q03 4Q03 1Q04 2Q04 3Q04 4Q04 1Q05 2Q05 3Q05 4Q05 1Q06 2Q06 3Q06
Domestic Market Export Market
72%
75% 74% 65% 64% 73%72% 71% 71% 78% 70% 69% 54% 62% 69% 68%
25% 26% 35% 36% 28% 27% 29% 29% 22% 30% 31% 46% 38% 31% 32%
1,8301,939
1,822
2,119
1,910 1,971 2,0112,170
1,7681,829
1,770
1,9811,9542,0281,971
9
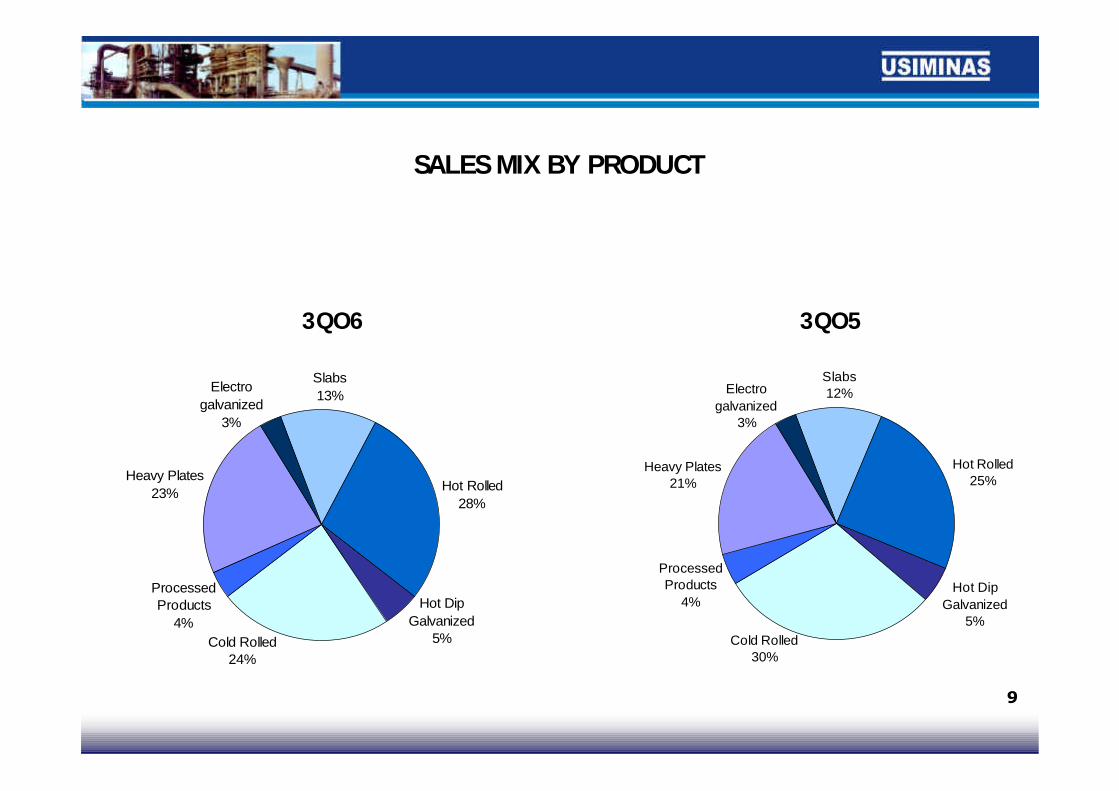
SALES MIX BY PRODUCT
Slabs13%
Hot Rolled28%
Processed Products
4%
Heavy Plates23%
Cold Rolled24%
Hot Dip Galvanized
5%
Electro galvanized
3%
Slabs12%
Hot Rolled25%
Hot Dip Galvanized
5%
Processed Products
4%
Heavy Plates21%
Cold Rolled30%
Electro galvanized
3%
3QO6 3QO5

10
EXPORTS BY COUNTRY - 9M06
Spain5%
Argentina5%
United States21%
Thailand6%
Colombia3%
South Korea3%
Canada8%
Mexico14%
Chile5%
Germany11% India
6%
Others13%
11
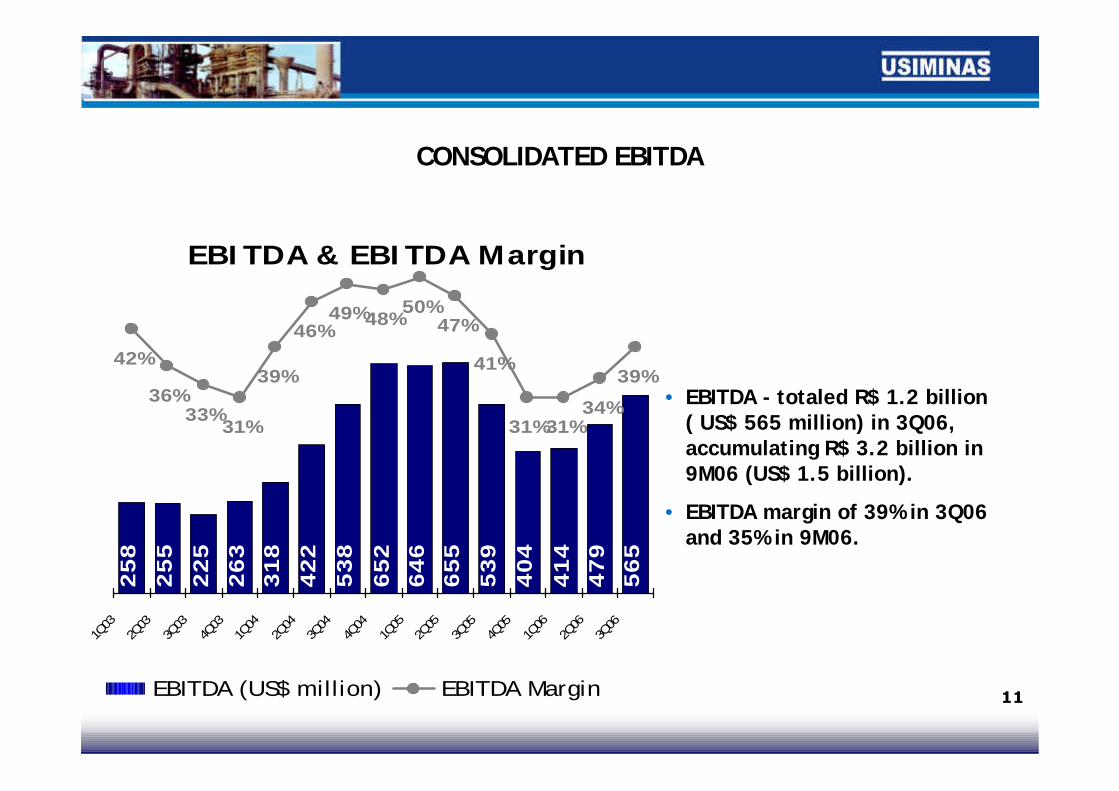
CONSOLIDATED EBITDA
• EBITDA - totaled R$ 1.2 billion( US$ 565 million) in 3Q06,accumulating R$ 3.2 billion in9M06 (US$ 1.5 billion).
• EBITDA margin of 39% in 3Q06and 35% in 9M06.
EBITDA & EBITDA Margin
479
565
414
404
539
655
646
652
538
422
318
263
225
255
258
34%
39%
31%31%
41%
47%50%
48%49%
36%
46%
39%
31%33%
42%
1Q03
2Q03
3Q03
4Q03
1Q04
2Q04
3Q04
4Q04
1Q05
2Q05
3Q05
4Q05
1Q06
2Q06
3Q06
EBITDA (US$ million) EBITDA Margin

12
CONSOLIDATED NET DEBT
• CND/EBITDA ratio at 0.4 x
• New BNDES credit line forinvestment financing up toR$ 900 million
• Debt profile:
Short Term - 26%Long Term - 74%
• Debt by currency:
Domestic - 24%Foreign - 76%
Consolidated Net Debt / EBITDA
0,7
0,8
0,9
2,4
2,6
2,5
2,3
2,2
1,9
1,7
1,3
1,0
1,0
1,0
0,7
0,4 0,40,4
2,72,5
2,32,1
1,6
2,6
1,10,7
0,4 0,4 0,4 0,3
1Q03 2Q03 3Q03 4Q03 1Q04 2Q04 3Q04 4Q04 1Q05 2Q05 3Q05 4Q05 1Q06 2Q06 3Q06
CND (US$ billion) CND/EBITDA

13• Usiminas’ cash position amounted R$2.0 billion on Sept. 29 2006
3Q06 CONSOLIDATED CASH FLOWBrazilian GAAP (Legislação Societária) - R$ million
2,000
134
313356
41178390412
1,228
2,042
Initia
l Bala
nce
EBITDA
New Fi
nanc
ing
Amortiza
tion a
nd Fi
nanc
ing Intere
st
Working
Capita
l Vari
ation
Inves
tmen
ts
Divide
nd / In
terst
on C
apita
lOthe
rs
Final
Balanc
e
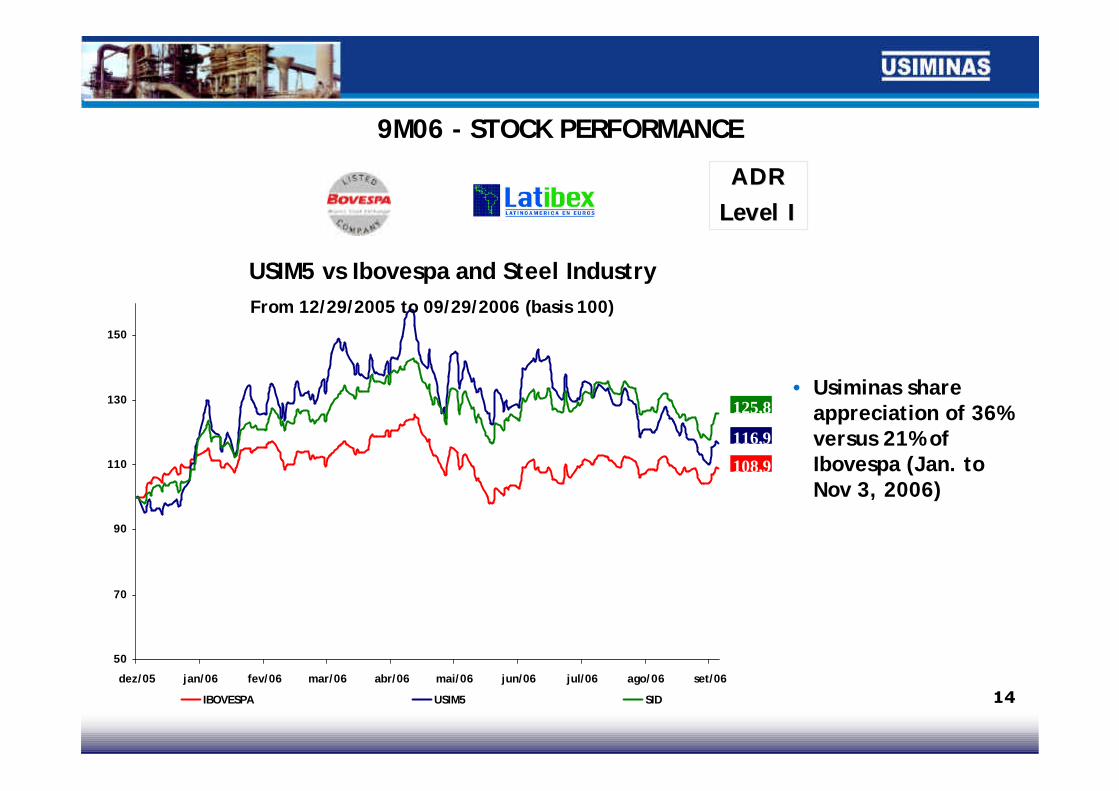
• Usiminas shareappreciation of 36%versus 21% ofIbovespa (Jan. toNov 3, 2006)
14
ADRADRLevelLevel I I
9M06 - STOCK PERFORMANCE
50
70
90
110
130
150
dez/05 jan/06 fev/06 mar/06 abr/06 mai/06 jun/06 jul/06 ago/06 set/06
IBOVESPA USIM5 SID
USIM5 vs Ibovespa and Steel IndustryFrom 12/29/2005 to 09/29/2006 (basis 100)
108,9
116,9
125,8

OUTLOOKInternational market:
• Signs of adjustment/accommodation in 4Q06 prices. Greaterawareness to avoid inventory growth.
• For 2007, forecast for reduction in US growth, compensated byChina and India.
• More stable price environment forecasted for 2007.
Domestic market:
• Demand growth of 8% in 2006 (according to IBS)
• 2007: total flat demand growing 8%, influenced by:
- maintenance of high volumes of credit;- increase in investments in important steel consuming sectors.
15
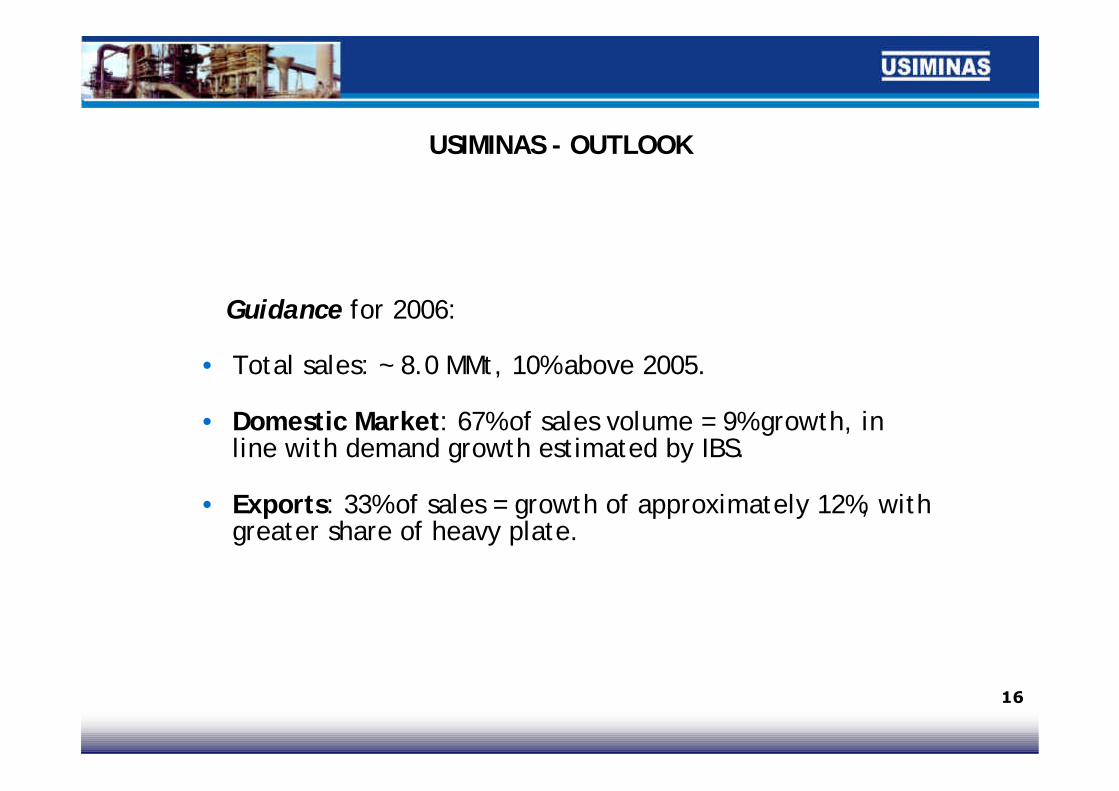
Guidance for 2006:
• Total sales: ~ 8.0 MMt, 10% above 2005.
• Domestic Market: 67% of sales volume = 9% growth, inline with demand growth estimated by IBS.
• Exports: 33% of sales = growth of approximately 12%, withgreater share of heavy plate.
USIMINAS - OUTLOOK
16

• Re-certification of Product Quality, Environmental and Worker SafetyCertificates at the Mills.
• Issuance of Installation license for Coke Oven #3 by State Environmentaland Development Agency
• Usiparts Investments - R$ 46 million for expansion
• Usiminas System is awarded:
.IstoÉ Magazine’s 500 Best Companies Guide (Usiminas and Usiparts
.Ibase Social Statement Award
.Gazeta Mercatil Award (Rio Negro)
OTHER HIGHLIGHTS
Other information:Investor Relations
18
www.usiminas.com.br
Bruno Seno Fusaro Luciana Valadares dos [email protected] [email protected]: 55 31 3499-8710 Tel.: 55 31 3499-8619
Matheus Perdigão Rosa Gilson Rodrigues [email protected] [email protected]: 55 31 3499-8056 Tel: 55 11 5070-8980 SP
55 31 3499-8617 BH