using data - welcome to esu #1 · pdf fileusing data facilitator’s guide ... center at...
TRANSCRIPT
USING DATAFacilitator’s Guide
USING DATATO GUIDE ACTION FOR SCHOOL IMPROVEMENT

Acknowledgements
Special thanks to McREL and especially to Michael Siebersma and Cori Stott, under whose guidance this guidebook was produced. Without their strong support and leadership, the development of this resource would not have been possible.
We are especially grateful to Margaret Sandoz, Niobrara Public Schools; Tracy Heilman, South Sioux City Public Schools; and Ed Stansberry, Walthill Public Schools, for their assistance in designing a resource that is practical and effective for all school districts. Thanks also to the ESU #1 staff development team–Rhonda Jindra, Amy Hill, and Chris Good–for their coordination efforts and contributions to this guidebook.
Freida Lange and the Nebraska Department of Education (NDE) leadership team also deserve special thanks for their time, support, and valuable input into this project.
Finally, we extend a special thank you to Jeff McQuistan, who offered to review the entire manuscript, despite not having been a part of the development team. His external perspective and input was invaluable.
This project originated as a response to a need for school improvement activities within the four ESU #1 Native American Districts. However, as the project proceeded, it was clear that it would be a valuable resource for all Nebraska school districts. With the support of the ESU #1 Native American Districts, NDE, and ESUCC, the project was expanded to include all stakeholders statewide. With the expanded scope, the product has been strengthened and will support the implementation of processes to use data to improve student achievement across the state.
The development team convened to provide information and support to schools and districts regarding the effective and efficient use of data to make decisions and take action for school improvement. The team hopes that individuals at all levels of the Nebraska education system will find the guidebook and facilitator guide useful in building capacity for analyzing and interpreting data to improve schools and student achievement.
Thank you for your support!
Dr. Bob Uhing ESU #1 Administrator
This project was completed through collaboration between the Nebraska Department of Education, the North Central Comprehensive Center at McREL, and ESU #1 in Wakefield, Nebraska, to provide standardization of data analysis procedures for use in schools statewide.
This report was funded wholly or in part by the U.S. Department of Education under cooperative agreement S283B050024. The views expressed in this report do not necessarily reflect the position of the U.S. Department of Education, and no official endorsement should be inferred.
For more information, contact:
Kathleen Dempsey, director North Central Comprehensive Center at McREL 4601 DTC Boulevard, Suite 500, Denver, CO 80237 303.632.5634 • [email protected]
© 2012 McREL20120820
Table of Contents
How to Use the Facilitator’s Guide ...............................................................................................................1
Introduction ............................................................................................................................................1
General Group Facilitation Guidelines .........................................................................................................3
Meeting Organization .............................................................................................................................3
Team Participation .................................................................................................................................3
Direction and Focus ...............................................................................................................................4
Data Process Considerations .......................................................................................................................6
Facilitator Reflection ..............................................................................................................................6
First Team Meeting ................................................................................................................................7
Stage 1: Ask Good Questions .............................................................................................................13
Stage 2: Collect and Prepare the Data ................................................................................................18
Stage 3: Find Trends and Make Observations .....................................................................................21
Stage 4: Interpret the Data...................................................................................................................23
Stage 5: Plan for Action .......................................................................................................................31
Stage 6: Implement, Monitor, and Sustain...........................................................................................35
Appendices ................................................................................................................................................40
Appendix A: Data Team Roles & Responsibilities ................................................................................40
Appendix B: Common Education Data Sources .................................................................................41
Appendix C: Methods of Calculation ...................................................................................................42
Appendix D: Facilitator Reflection Questions ......................................................................................44
Appendix E: Organizational Tools ........................................................................................................45
References .................................................................................................................................................46

1
This Facilitator’s Guide will assist you with leading groups through the actions and stages of the data analysis and decision-making process. The guide corresponds with the Using Data to Guide Action for School Improvement resource, or “guidebook,” and the two should be used together. Throughout the following eight sections, there are references to tools and information in the guidebook that further clarify the topics being covered.
Section 1: Introduction and General Group Facilitation Guidelines
Section 2: Instructions and Suggestions for First Team Meeting
Section 3: Instructions and Suggestions for Stage 1: Ask Good Questions
Section 4: Instructions and Suggestions for Stage 2: Collect and Prepare the Data
Section 5: Instructions and Suggestions for Stage 3: Find Trends and Make Observations
Section 6: Instructions and Suggestions for Stage 4: Interpret the Data
Section 7: Instructions and Suggestions for Stage 5: Plan for Action
Section 8: Instructions and Suggestions for Stage 6: Implement, Monitor, and Sustain
Sections 2 through 8 introduce the associated data process stage and include a listing of the guidebook tools, supplemental information, and readings. Following this, each section provides blank data process tools, instructions for using the tools, and suggestions for smooth implementation.
This Facilitator’s Guide and the guidebook are available on the Nebraska Department of Education’s website at www.education.ne.gov/APAC/SchoolImprovement.html.
Introduction
Schools and school districts are data-rich environments, with heaps of data on student demographics, achievement, outcomes, and perceptions. With so much data available, it can be easy to get caught up in the sheer enormity of the data sets. A cohesive data analysis and decision-making process can help schools, districts, and additional stakeholders to
• ask good questions,
• sort through the available data,
• identify which figures are needed to answer the questions at hand,
• analyze the data and, ultimately,
• use the information gained from the analysis to make good decisions and carry out meaningful action for school improvement.
The full data analysis process, when conducted effectively, is a collaborative endeavor. Through collaboration, teams can collect the resources and manpower needed to collect and organize data. Collaboration also enables the inclusion of numerous perspectives during data analysis cycle discussions.
How to Use the Facilitator’s Guide
2
It may not always be necessary or appropriate to use every tool or to complete every step of the process. In using the data analysis and decision-making process, a team will develop a disciplined way of thinking about and navigating data for school improvement efforts. After completing several analysis cycles, team members may find they no longer need the guidebook or that it is most useful as an informal check of their efforts.
Before a school or district begins to organize data around identified questions, it is important to designate a group of individuals within the organization who will hold primary responsibility for organizing, analyzing, and coordinating responses informed by the data. This group becomes the data team. At least one week prior to beginning their work together, all members of the data team should receive and review a copy of the guidebook to ensure that all members share a basic understanding of the process they will follow during the ensuing meetings.
Every multi-member data team should have a facilitator to guide the team through the process and to keep the team on task. This Facilitation Guide provides suggestions, instructions, and tips for a team facilitator to lead a group through the completion of each stage of the data analysis and decision-making process.
Role of the Data Team Facilitator
Data team facilitators make an important contribution to the group’s work and outcomes. The facilitator can help the group define its purpose and move seamlessly through the data analysis and decision-making process (Bens, 1999). The facilitator also holds an important role in encouraging full group participation, keeping the team on task, and managing conflict (Bens, 1999). This includes observing the process and helping the group members to work and learn together effectively (Havelock & Zlotolow, 1995; Lippitt & Lippitt, 1986). The facilitator might also serve as the liaison between the data team and the school or district administration. If the school or district lead administrators are not members of the data team, it is the facilitator’s job to remain in close collaboration or contact with those individuals, to ensure ongoing support.
Ultimately, a strong facilitator will foster team member leadership and confidence to encourage others to facilitate data processes in the future (Bens, 1999), increasing capacity and encouraging a school- or district-wide culture of data use.
The data team facilitator serves as both a fully engaged participant and as a process guide. The facilitator is not responsible for completing all of the work involved in the data analysis cycle. Ideally, after a number of cycles of data inquiry have been completed and all participants are comfortable and familiar with the process, the facilitation role can rotate among team members.
3
Meeting Organization
As the facilitator, you should ensure that all meetings are planned ahead of time. Participants should receive timely communication regarding the date, time, and location of the meeting. In addition, you should provide all participants with the agenda prior to the meeting date, to allow for updates and to create and manage expectations.
It is the facilitator’s responsibility to ensure that every meeting has, at minimum, a dedicated recorder to keep notes, and a dedicated time-keeper to keep the meeting progressing and ending on time. Whenever possible, you should assign additional roles to meeting participants, which will free you to keep the team on task and progressing through the process. A list of important meeting roles is provided in Appendix A on page 40.
The data team will need to identify a meeting location. It is the facilitator’s job to secure meeting space and to inform all team members of the location. If at all possible, you should reserve a meeting room that allows for a U-shaped or round-table configuration, allowing all members to see one another. As facilitator, it also is your responsibility to ensure that meetings are appropriately stocked with materials for recording the team’s decisions and ideas (such as chart paper and markers or a computer attached to a projector).
At the beginning of each meeting, the facilitator should quickly summarize the agenda, to clarify the purpose, timeframe, and goals of the meeting. The facilitator should also remind all team members of the group’s values, purpose, and norms.
Though the time-keeper will hold responsibility for checking the time against the agenda, it will ultimately be the facilitator’s job to ensure that the meeting begins and ends on time.
If discussions begin to lead the team off track, or if the meeting begins to run over the allotted time, the facilitator can
• make use of the Parking Lot Tool (p. 45), to record items that are not focal points for the current meeting,
• provide a time limit for remaining agenda items and discussions, or
• poll the team on whether the current issue is important enough to continue discussing, with a plan for how the remaining agenda items will be addressed in a timely manner (International Association of Facilitators, 2002).
The Parking Lot will also become a powerful tool during Stages 3, 4, and 5, when the team begins to identify facts, patterns, and strategies from the data. As the team members raise ideas that are not related to the focus question, you can note these ideas on the Parking Lot Tool for use during a future data analysis cycle.
Team Participation
It is important that all team members remain actively engaged, positive participants in the process. If you find that a team member is blocking progress or otherwise refusing positive participation, you should seek to reengage or redirect the team member.
General Group Facilitation Guidelines
4
While facilitating, you should be patient with quiet or silent members but also encourage them to participate by giving them a specific role during the meeting. For example, you might ask a silent team member to share particular expertise or to recap group decisions.
Often, teams will have one or more members who will dominate discussions. Manage these members by using nonverbal signals that remove attention from them (such as shifting eye contact to someone else in the room), asking other members to respond to direct questions, or setting time limits for each person to speak.
Direction and Focus
Sometimes, meeting participants will move the meeting off track with sidebar conversations, unbounded discussions, or personal attacks. When this happens, you should work to bring the meeting back on track.
With sidebar conversations, which occur when one or more members begin to hold private conversations during the course of the meeting, directly ask the participants to redirect their attention to the task at hand. If the group’s norms for behavior include a statement that only one person will speak at a time, you can remind the team of this norm. If it becomes a chronic problem, consider speaking one-on-one to the team members or holding a brief discussion with the team at the beginning of the next meeting, to request that all members respect one another by reducing sidebar conversations (International Association of Facilitators, 2002). Cell phones, tablets, and laptops can create similar distractions; you can handle them in the same manner.
Unbounded or never-ending discussions occur when the team appears unable to bring a discussion to a close, either because team members do not have the information they need or because the discussion topic is part of one or more members’ personal agendas. If you see that the failure to successfully conclude a discussion is due to insufficient information, ask the team to record the item on the Parking Lot Tool. This will allow team members to pursue additional information and to hold a more informed discussion of the issue at a later date.
Sometimes, the issue will occur because team members pursue personal agendas or topics about which they are particularly passionate. At these times, you can gently interrupt or use more direct statements, such as “This sounds like a recurring theme” or “Let’s add this to the Parking Lot for discussion at a later time.” If this does not serve to redirect the conversation to more agenda-driven topics, speak with the team member privately to request his or her assistance in keeping the team moving forward (International Association of Facilitators, 2002).
On rare occasions, team members may personally attack one another. If this occurs, remind the team of the norms of respect, use gentle humor to redirect, or confront the attacker directly. If the behavior persists, you may need to speak with the attacker privately, to request productive participation (International Association of Facilitators, 2002).
The data analysis and decision-making process can be complex. At times, teams may find themselves at a standstill, unable to move forward. This is the time to get the team moving again by employing effective communication and facilitation skills, such as the following.
• Paraphrase and summarize what has been decided or discussed thus far. If possible, make note of key aspects of the summary on chart paper or a whiteboard. Ask the team if this information helps them to move forward with the decision or process.
5
• Identify an earlier time when the team experienced difficulty moving forward but was able to overcome it. Ask the team to use that experience to help them to determine how to progress during this instance of immobility.
• Use patience. It may be that the team cannot move forward right away and that team members need time to think about the decision or process at hand. The facilitator can dismiss the meeting early, with plans to reconvene within a few days to regain forward movement.
The facilitator should periodically summarize the cycle to date, identify and restate all items of agreement or resolution, and remind the group about the cycle and meeting goals and activities (Myrsiades, 2000). This may help keep the team on task and feeling connected to the group’s actions.
6
The data team facilitator should keep the following ideas in mind when working as a member of a school- or district-based data team:
1. When working with novice teams, it is best to start small, with short-term data cycles centered around simple, low-variable questions. Examples of such questions are available in Appendix B: Question Bank in the Using Data guidebook (p. 66).
2. When working with more advanced teams, it is acceptable to pursue a two-fold process in which the team pursues a number of short-term cycles concurrent with one or two long-term cycles. A short-term cycle might consider actions that can take place and be measured in the space of a few weeks, while a long-term cycle might consider actions that will take place and be measured over the course of many months, semesters, or even years.
3. Particularly when teams are just getting started, be prepared to walk team members through the examples provided for each stage and activity in the guidebook.
4. Identify and celebrate small successes and quick wins. This will empower and encourage team members and the community at large.
5. The data process does not require single-direction movement. The team can return to prior steps at any time to clarify or narrow decisions.
6. Though school improvement is a continuous pursuit, the data analysis process can end if the team determines that their work is no longer necessary.
7. It is possible that the team will collect data that does not show any discernible patterns or trends. If this occurs, acknowledge that the team has learned important information about the focus question and data quality, then move on to choosing new data sources or a new focus question for inquiry.
8. Always have sticky notes, highlighters, and pens available for data meetings. If possible, ensure that chart paper and markers also are available.
9. Remember that as the facilitator, you are an active participant at all times, and you should take part in all of the activities you lead.
Facilitator Reflection
As you begin to manage data process meetings, you will likely start to identify areas of strength and areas that could be improved within the process and facilitation itself. Appendix D (p. 44) of this guide contains a series of reflective questions to consider after managing a data session that will assist you in becoming an even stronger manager of the data team and of other types of teams in the future.
Data Process Considerations

7
First Team Meeting
In this section, you’ll find step-by-step instructions for getting started and read a few suggestions for dealing with the unexpected.
Using Data Guidebook Resources and Information Available During This Stage
Information Source Guidebook Page No.
Data Team Logistics: Sample Confidentiality Agreement 32
Data Team Logistics: Data Team Roster 32
Data Team Logistics: Data Team Roles and Responsibilities 33
Data Team Logistics: Brainstorming Tool for Values, Behavior, and Purpose 34
Data Team Logistics: Sample Agenda 35
Using Data Guidebook Reading That All Team Members Should Complete Prior to This Stage’s Meeting
Section Title Guidebook Page No.
Background Information: Introduction 3
Background Information: Data Teams 5
Pre-Meeting Preparations for Facilitator
• Ensure that all members of the data team have received and reviewed a copy of the guidebook.
• Provide all members with the link to the Nebraska Department of Education’s Data Access and Use Policy and Procedures document for their brief review (available at http://www.education.ne.gov/nssrs/docs/Nebraska_Data_Policy_December_2010.pdf).
• Review the Data Team Logistics section of the Using Data guidebook, pages 31−35.
• Prepare a blank confidentiality agreement for each team member (see p. 8). Make one copy per team member.
• Prepare a Data Team Roster and sign in sheet (see p. 9) for the meeting. Make one copy of each.
• Prepare either a hard copy or electronic copy of the brainstorming tool to identify values, behavior, and purpose (see p. 11).
• Prepare an agenda. Distribute it to team members at least one day prior to the meeting. Make one copy per team member.
• Communicate with the school principal and/or other interested district administrators to let them know when and where the team will be meeting. Provide the administrator with a copy of the agenda.
• Bring a stack of sticky notes, pens, chart paper, and markers to this and all subsequent meetings.
8
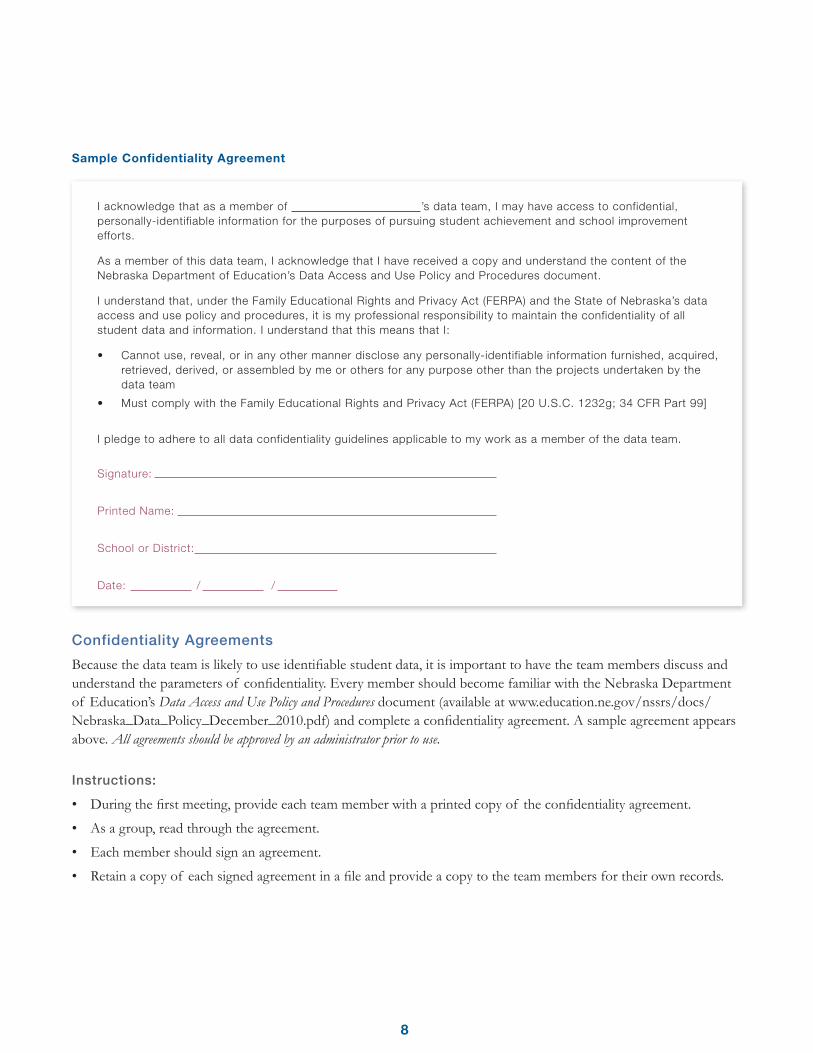
Sample Confidentiality Agreement
Confidentiality Agreements
Because the data team is likely to use identifiable student data, it is important to have the team members discuss and understand the parameters of confidentiality. Every member should become familiar with the Nebraska Department of Education’s Data Access and Use Policy and Procedures document (available at www.education.ne.gov/nssrs/docs/Nebraska_Data_Policy_December_2010.pdf) and complete a confidentiality agreement. A sample agreement appears above. All agreements should be approved by an administrator prior to use.
Instructions:
• During the first meeting, provide each team member with a printed copy of the confidentiality agreement.
• As a group, read through the agreement.
• Each member should sign an agreement.
• Retain a copy of each signed agreement in a file and provide a copy to the team members for their own records.
I acknowledge that as a member of ’s data team, I may have access to confidential, personally-identifiable information for the purposes of pursuing student achievement and school improvement efforts.
As a member of this data team, I acknowledge that I have received a copy and understand the content of the Nebraska Department of Education’s Data Access and Use Policy and Procedures document.
I understand that, under the Family Educational Rights and Privacy Act (FERPA) and the State of Nebraska’s data access and use policy and procedures, it is my professional responsibility to maintain the confidentiality of all student data and information. I understand that this means that I:
• Cannot use, reveal, or in any other manner disclose any personally-identifiable information furnished, acquired, retrieved, derived, or assembled by me or others for any purpose other than the projects undertaken by the data team
• Must comply with the Family Educational Rights and Privacy Act (FERPA) [20 U.S.C. 1232g; 34 CFR Part 99]
I pledge to adhere to all data confidentiality guidelines applicable to my work as a member of the data team.
Signature:
Printed Name:
School or District:
Date: / /
9
Suggestions:
• Before providing a confidentiality agreement to the team, request that an administrator review and approve it.
• If the team is unfamiliar with confidentiality agreements or with the sensitive nature of the data they may be reviewing, request that an administrator or data manager attend this portion of the meeting to answer any questions.
• The team will not be reviewing any data for some time, so it is acceptable for hesitant members to take the blank form with them for review prior to signing.
• Have a copy of the Nebraska Department of Education’s Data Access and Use Policy and Procedures document available for review during the meeting.
• Have a copy of the Family Educational Rights and Privacy Act (FERPA) [20 U.S.C. 1232g; 34 CFR Part 99] available for review during the meeting (available at www.gpo.gov/fdsys/pkg/FR-2011-12-02/pdf/2011-30683.pdf).
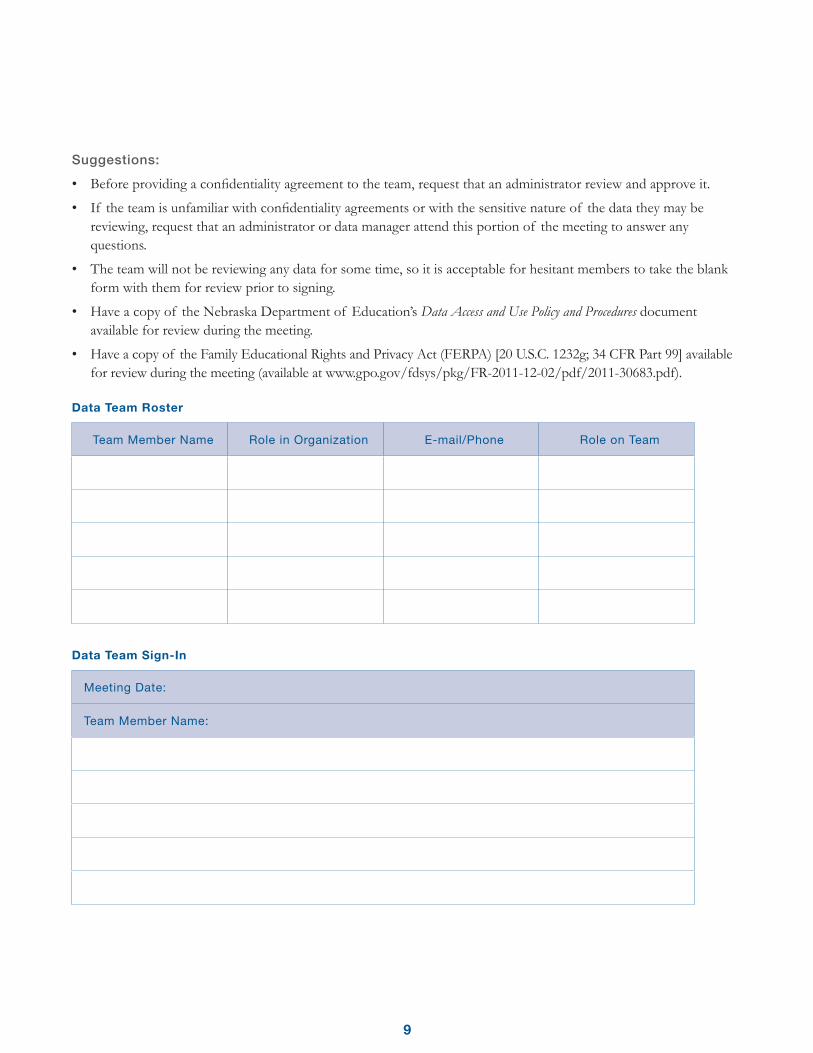
Data Team Roster
Team Member Name Role in Organization E-mail/Phone Role on Team
Data Team Sign-In
Meeting Date:
Team Member Name:
10
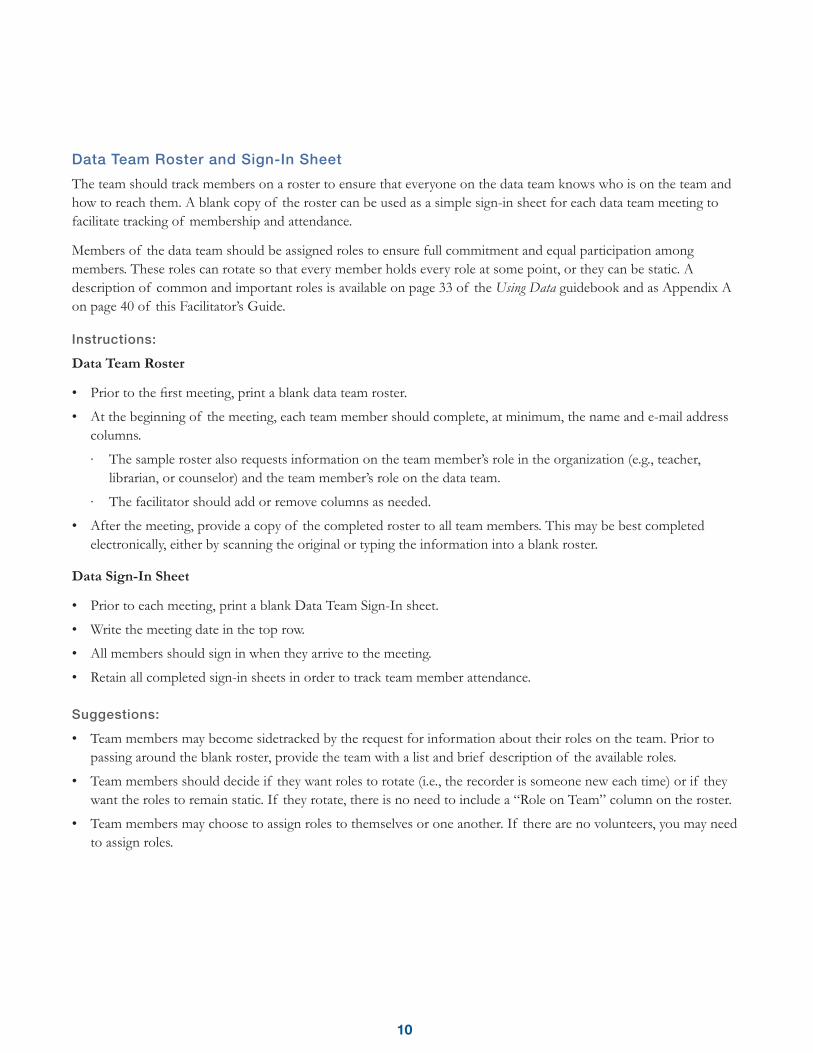
Data Team Roster and Sign-In Sheet
The team should track members on a roster to ensure that everyone on the data team knows who is on the team and how to reach them. A blank copy of the roster can be used as a simple sign-in sheet for each data team meeting to facilitate tracking of membership and attendance.
Members of the data team should be assigned roles to ensure full commitment and equal participation among members. These roles can rotate so that every member holds every role at some point, or they can be static. A description of common and important roles is available on page 33 of the Using Data guidebook and as Appendix A on page 40 of this Facilitator’s Guide.
Instructions:
Data Team Roster
• Prior to the first meeting, print a blank data team roster.
• At the beginning of the meeting, each team member should complete, at minimum, the name and e-mail address columns.
∙ The sample roster also requests information on the team member’s role in the organization (e.g., teacher, librarian, or counselor) and the team member’s role on the data team.
∙ The facilitator should add or remove columns as needed.
• After the meeting, provide a copy of the completed roster to all team members. This may be best completed electronically, either by scanning the original or typing the information into a blank roster.
Data Sign-In Sheet
• Prior to each meeting, print a blank Data Team Sign-In sheet.
• Write the meeting date in the top row.
• All members should sign in when they arrive to the meeting.
• Retain all completed sign-in sheets in order to track team member attendance.
Suggestions:
• Team members may become sidetracked by the request for information about their roles on the team. Prior to passing around the blank roster, provide the team with a list and brief description of the available roles.
• Team members should decide if they want roles to rotate (i.e., the recorder is someone new each time) or if they want the roles to remain static. If they rotate, there is no need to include a “Role on Team” column on the roster.
• Team members may choose to assign roles to themselves or one another. If there are no volunteers, you may need to assign roles.

11
Identify Values and Behavioral Norms
Values & Purpose Behavioral Norms
What do we believe?
What are we here to do?
Positive: What behaviors do we want to exhibit?
Negative: What behaviors are unacceptable?
Identify Values and Behavioral Norms
In early meetings, the team should come to consensus on the group’s shared values and expectations for behavior. The group should develop a clear and shared understanding of the team’s purpose, specific roles, responsibilities of each member, and how the team will conduct its meetings (Love, Haley-Speca, & Reed, 2010).
One method of creating this shared understanding is group brainstorming at an early meeting. You can conduct this on paper or by giving participants sticky notes on which they can write their ideas and post them to a large piece of paper.
Instructions:
• Hang two pieces of chart paper on the wall labeled “Values and Purpose” and “Norms.”
• The team should quietly consider why they chose to join the data team and what purpose the team will serve. Team members should write their ideas on sticky notes (one idea per note) and place their notes on the “Values and Purpose” chart paper.
• Read all of the submissions out loud, and allow a moment for team members to consider them.
• Organize all of the ideas into categories; then, name the categories. This will help the values to emerge.
• As a group, choose the –-6 values and 1–3 purposes that team members believe most apply to the team. Write these on a piece of chart paper and hang where all can see.
• Ensure that all team members are in agreement with the decisions.
• Write these on the Identify Values and Behavioral Norms tool.
• Next, introduce the concept of group norms to the team, saying something like this: “Our team norms will be the expectations we hold for ourselves and one another regarding our behavior and mindsets while we conduct our data team work. They include both the behaviors that we want to exhibit and the behaviors that are unacceptable.”
12
• Team members should take a moment to consider how they would like their work to be conducted. Have the team members write their ideas on sticky notes (one idea per note) and to place these on the “Norms” chart paper.
• Read all of the submissions out loud and allow a minute or two for the team to think about them.
• As a group, decide which norms to keep as the official team norms.
• Ensure that all team members are in agreement with the decisions.
• Write the agreed-upon norms on the right side of the Identify Values and Behavioral Norms tool and provide a copy to all members.
Suggestions:
• As the facilitator, you may need to provide the team with examples of common values or norms:
∙ Values: Collaboration, Leadership, Integrity, Pursuit of improvement, Respect for self and others
∙ Norms: Arrive on time. Do not use cell phone during meetings. Judge ideas not people. Be conscious and respectful listeners.
• Keep in mind that a long list of norms is difficult to internalize and monitor. Try to keep the list simple and manageable, with 3−6 norms.
13
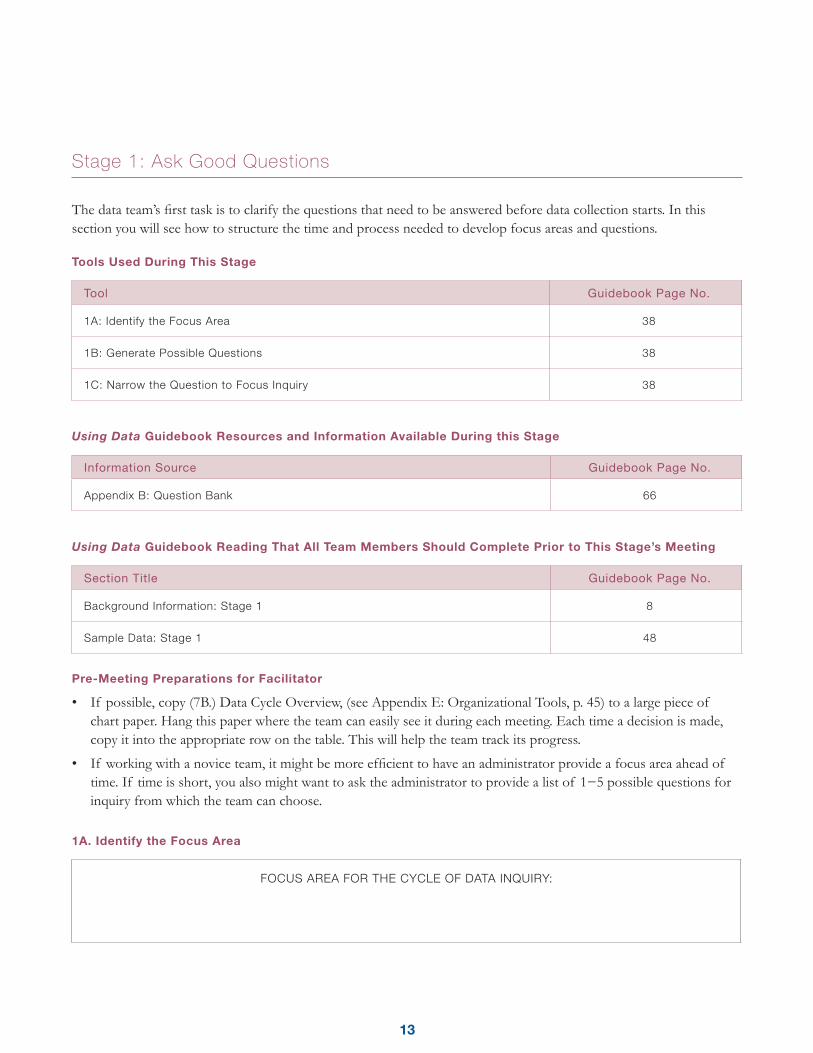
Stage 1: Ask Good Questions
The data team’s first task is to clarify the questions that need to be answered before data collection starts. In this section you will see how to structure the time and process needed to develop focus areas and questions.
Tools Used During This Stage
Tool Guidebook Page No.
1A: Identify the Focus Area 38
1B: Generate Possible Questions 38
1C: Narrow the Question to Focus Inquiry 38
Using Data Guidebook Resources and Information Available During this Stage
Information Source Guidebook Page No.
Appendix B: Question Bank 66
Using Data Guidebook Reading That All Team Members Should Complete Prior to This Stage’s Meeting
Section Title Guidebook Page No.
Background Information: Stage 1 8
Sample Data: Stage 1 48
Pre-Meeting Preparations for Facilitator
• If possible, copy (7B.) Data Cycle Overview, (see Appendix E: Organizational Tools, p. 45) to a large piece of chart paper. Hang this paper where the team can easily see it during each meeting. Each time a decision is made, copy it into the appropriate row on the table. This will help the team track its progress.
• If working with a novice team, it might be more efficient to have an administrator provide a focus area ahead of time. If time is short, you also might want to ask the administrator to provide a list of 1−5 possible questions for inquiry from which the team can choose.
1A. Identify the Focus Area
FOCUS AREA FOR THE CYCLE OF DATA INQUIRY:

14
1A. Identify the Focus Area
The data inquiry cycle begins with the identification of an overarching focus area. The focus area provides the target that you ultimately hope to accomplish and serves as an “umbrella” throughout the data inquiry cycle. Identifying the focus area for the cycle of data inquiry will help the team to identify questions for inquiry.
The focus area will often be identified by an administrator prior to convening the data team. If this is not the case, the data team should identify a focus area prior to asking questions for inquiry.
Instructions:
If the focus area has been identified by an administrator:
• Write the focus area on chart paper, a whiteboard, or other surface that can be easily seen by all team members.
• Describe for the team the meaning of a focus area, saying something like this: “The overarching focus area serves as an ‘umbrella’ for the data inquiry cycle.”
• Read the focus area to the team.
• Explain who provided it and provide any additional and relevant information.
• Ask if there are any questions. Either respond to the questions or pursue answers for quick follow-up.
• Record the focus area on the Identify the Focus Area tool.
If the focus area has not been identified ahead of time:
• Describe for the team the meaning of a focus area, saying something like this: “The overarching focus area serves as an ‘umbrella’ throughout the data inquiry cycle.”
• The team should consider potential focus areas for this cycle of data inquiry.
∙ They must be related to student achievement or other forms of school improvement.
• Provide a clear time limit for this activity (5−7 minutes).
• At the end of the time limit, the team should review the possible focus areas and choose one to guide the cycle of data inquiry. The forced-choice method can be the most efficient: Ask members to choose either Option #1 or Option #2. Follow up by asking the team to choose between the winner of the first vote and Option #3. Follow this by asking the team to choose between the winner of the second vote and Option #4. Continue this process until a single option has been chosen.
• Write out the focus area on chart paper, a whiteboard, or other surface that can be easily seen by all team members.
• Record the focus area on the Identify the Focus Area tool.
Suggestions:
• If the team finds it difficult to brainstorm and choose a focus area, suggest the common option of “Improve student achievement.” If possible, further focus the statement with a timeframe, target group, or a subject (e.g., “Improve student achievement in reading”). This will guide the team directly toward questions relating to improving student achievement.
• Consider inviting the administrator to the meeting if a pre-arranged focus area will be provided. With the administrator present, the team will be able to ask clarifying questions and better understand the administrator’s goals for their work.
15
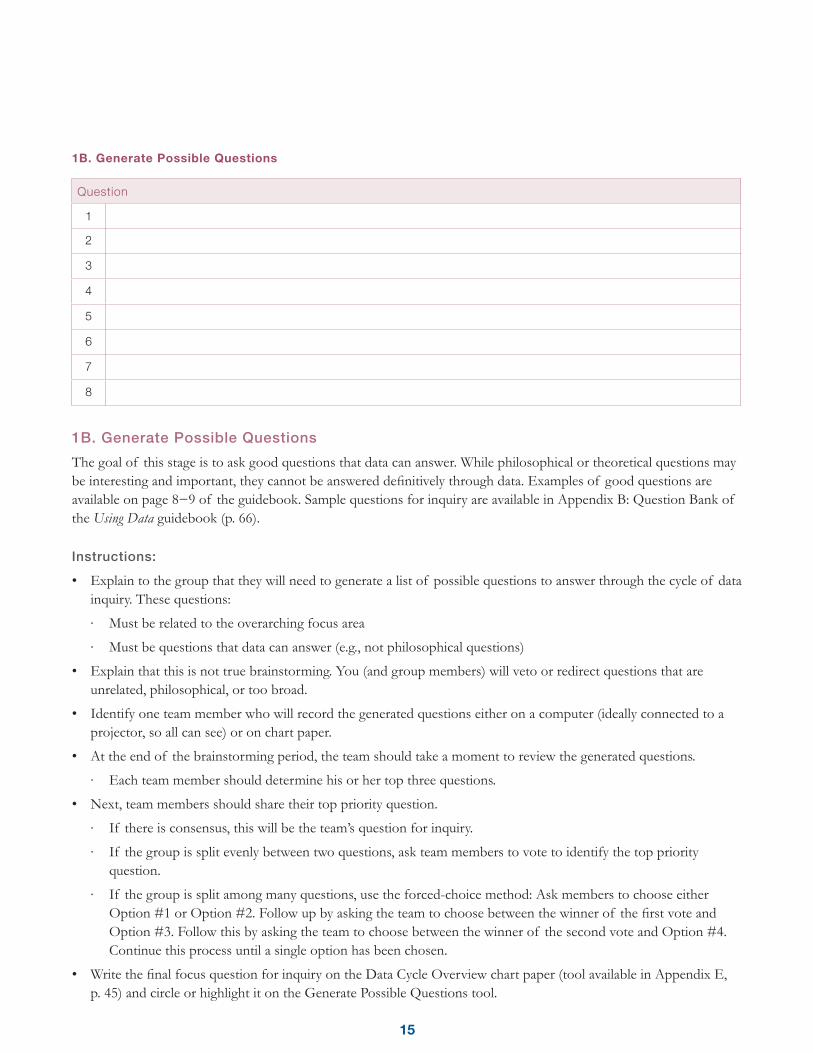
1B. Generate Possible Questions
Question
1
2
3
4
5
6
7
8
1B. Generate Possible Questions
The goal of this stage is to ask good questions that data can answer. While philosophical or theoretical questions may be interesting and important, they cannot be answered definitively through data. Examples of good questions are available on page 8−9 of the guidebook. Sample questions for inquiry are available in Appendix B: Question Bank of the Using Data guidebook (p. 66).
Instructions:
• Explain to the group that they will need to generate a list of possible questions to answer through the cycle of data inquiry. These questions:
∙ Must be related to the overarching focus area
∙ Must be questions that data can answer (e.g., not philosophical questions)
• Explain that this is not true brainstorming. You (and group members) will veto or redirect questions that are unrelated, philosophical, or too broad.
• Identify one team member who will record the generated questions either on a computer (ideally connected to a projector, so all can see) or on chart paper.
• At the end of the brainstorming period, the team should take a moment to review the generated questions.
∙ Each team member should determine his or her top three questions.
• Next, team members should share their top priority question.
∙ If there is consensus, this will be the team’s question for inquiry.
∙ If the group is split evenly between two questions, ask team members to vote to identify the top priority question.
∙ If the group is split among many questions, use the forced-choice method: Ask members to choose either Option #1 or Option #2. Follow up by asking the team to choose between the winner of the first vote and Option #3. Follow this by asking the team to choose between the winner of the second vote and Option #4. Continue this process until a single option has been chosen.
• Write the final focus question for inquiry on the Data Cycle Overview chart paper (tool available in Appendix E, p. 45) and circle or highlight it on the Generate Possible Questions tool.
16
Suggestions:
• Set a time limit for question generation. This will keep the team focused on the task and will maintain forward movement.
• Remind the team that selection of a single question does not mean that the other generated questions will be discarded. Data inquiry is an iterative process, and the team will likely return to this list as it begins the next cycle of data inquiry.
• If the team has difficulty generating or identifying questions for inquiry, or if time is very short, you can introduce Appendix B: Question Bank from the Using Data guidebook (p. 66). The sample questions might jumpstart the team’s thinking or the team might choose to use a question directly from the bank.
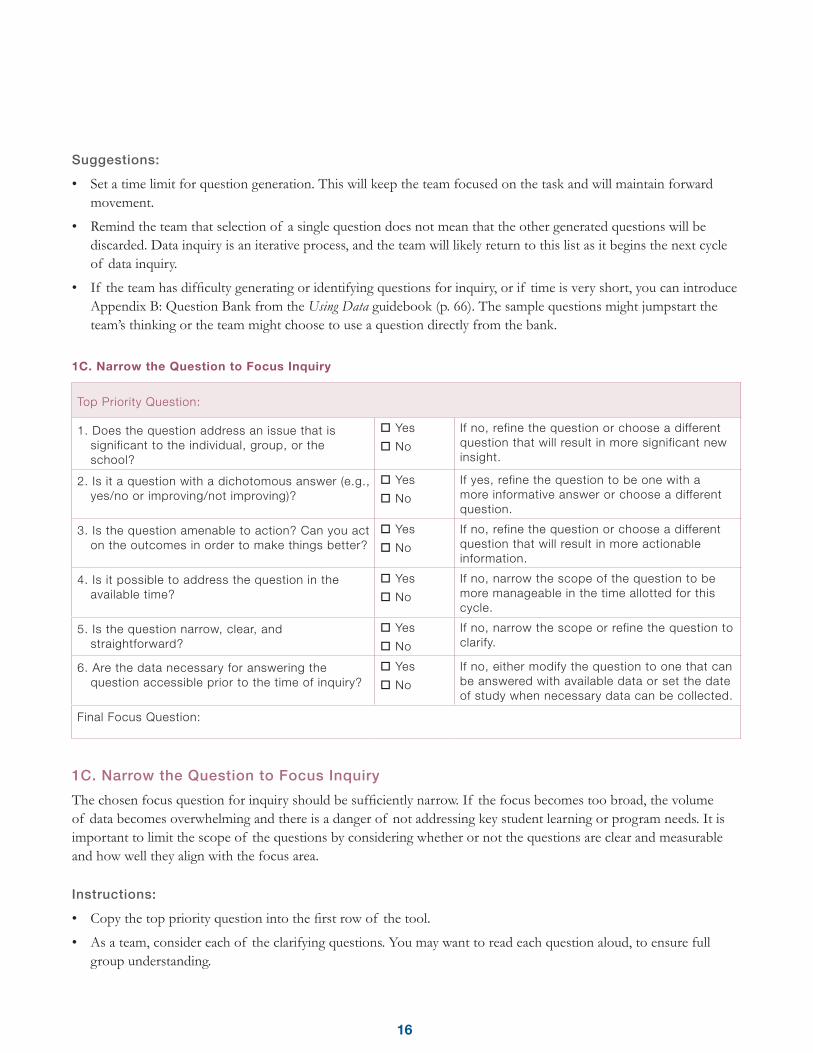
1C. Narrow the Question to Focus Inquiry
Top Priority Question:
1. Does the question address an issue that is significant to the individual, group, or the school?
Yes
No
If no, refine the question or choose a different question that will result in more significant new insight.
2. Is it a question with a dichotomous answer (e.g., yes/no or improving/not improving)?
Yes
No
If yes, refine the question to be one with a more informative answer or choose a different question.
3. Is the question amenable to action? Can you act on the outcomes in order to make things better?
Yes
No
If no, refine the question or choose a different question that will result in more actionable information.
4. Is it possible to address the question in the available time?
Yes
No
If no, narrow the scope of the question to be more manageable in the time allotted for this cycle.
5. Is the question narrow, clear, and straightforward?
Yes
No
If no, narrow the scope or refine the question to clarify.
6. Are the data necessary for answering the question accessible prior to the time of inquiry?
Yes
No
If no, either modify the question to one that can be answered with available data or set the date of study when necessary data can be collected.
Final Focus Question:
1C. Narrow the Question to Focus Inquiry
The chosen focus question for inquiry should be sufficiently narrow. If the focus becomes too broad, the volume of data becomes overwhelming and there is a danger of not addressing key student learning or program needs. It is important to limit the scope of the questions by considering whether or not the questions are clear and measurable and how well they align with the focus area.
Instructions:
• Copy the top priority question into the first row of the tool.
• As a team, consider each of the clarifying questions. You may want to read each question aloud, to ensure full group understanding.

17
• If the team gets stuck on a requirement in the Narrow the Question to Focus Inquiry tool, the facilitator can share the following clarifications, listed by question:
Question #1: Does the question address a significant issue? Will answering this question help improve something within the focus area?
Question #2: Does the question have only two possible answers or is it more open-ended? If it isn’t open-ended, the team should pursue a less restrictive question. For example, if the initial top priority question is “Have the 5th-grade math scores improved since we began math interventions two years ago?” the answer can only be yes or no. The team can change this question to say “What effect has the math intervention had on 5th-grade math scores over the last two years?”
Question #3: Can the team envision action that could be taken based on the answers to the question?
Question #4: Consider the time the team has available to complete this cycle of data inquiry. Is the question framed in such a way that the team believes it can answer and act on it within that time frame?
Questions that are clear and straightforward use common language and are easily understood by persons outside of the team. Questions that are sufficiently narrow will allow the team to answer the question within a reasonable time frame and without requiring an excessive number of data sources and variables.
Question #5: Consider all of the data variables that will be required to answer the question. Are these variables available to the team?
• If the team checks “No” to questions 1 or 3−5 or “Yes” to question 2, team members will need to refine the question.
• Once the team has determined that the question is focused, clear, appropriately narrow, and feasible, record it in the box at the bottom of the Narrow the Question to Focus Inquiry tool and update the Data Cycle Overview as necessary.
18
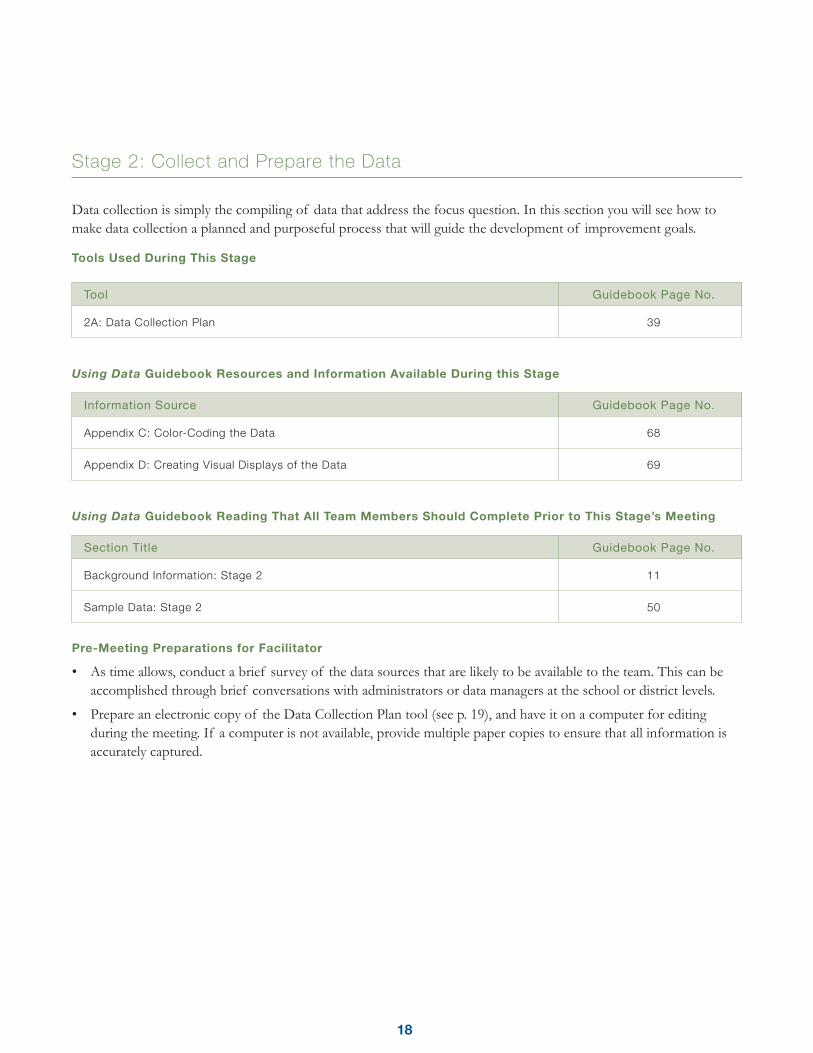
Stage 2: Collect and Prepare the Data
Data collection is simply the compiling of data that address the focus question. In this section you will see how to make data collection a planned and purposeful process that will guide the development of improvement goals.
Tools Used During This Stage
Tool Guidebook Page No.
2A: Data Collection Plan 39
Using Data Guidebook Resources and Information Available During this Stage
Information Source Guidebook Page No.
Appendix C: Color-Coding the Data 68
Appendix D: Creating Visual Displays of the Data 69
Using Data Guidebook Reading That All Team Members Should Complete Prior to This Stage’s Meeting
Section Title Guidebook Page No.
Background Information: Stage 2 11
Sample Data: Stage 2 50
Pre-Meeting Preparations for Facilitator
• As time allows, conduct a brief survey of the data sources that are likely to be available to the team. This can be accomplished through brief conversations with administrators or data managers at the school or district levels.
• Prepare an electronic copy of the Data Collection Plan tool (see p. 19), and have it on a computer for editing during the meeting. If a computer is not available, provide multiple paper copies to ensure that all information is accurately captured.
19
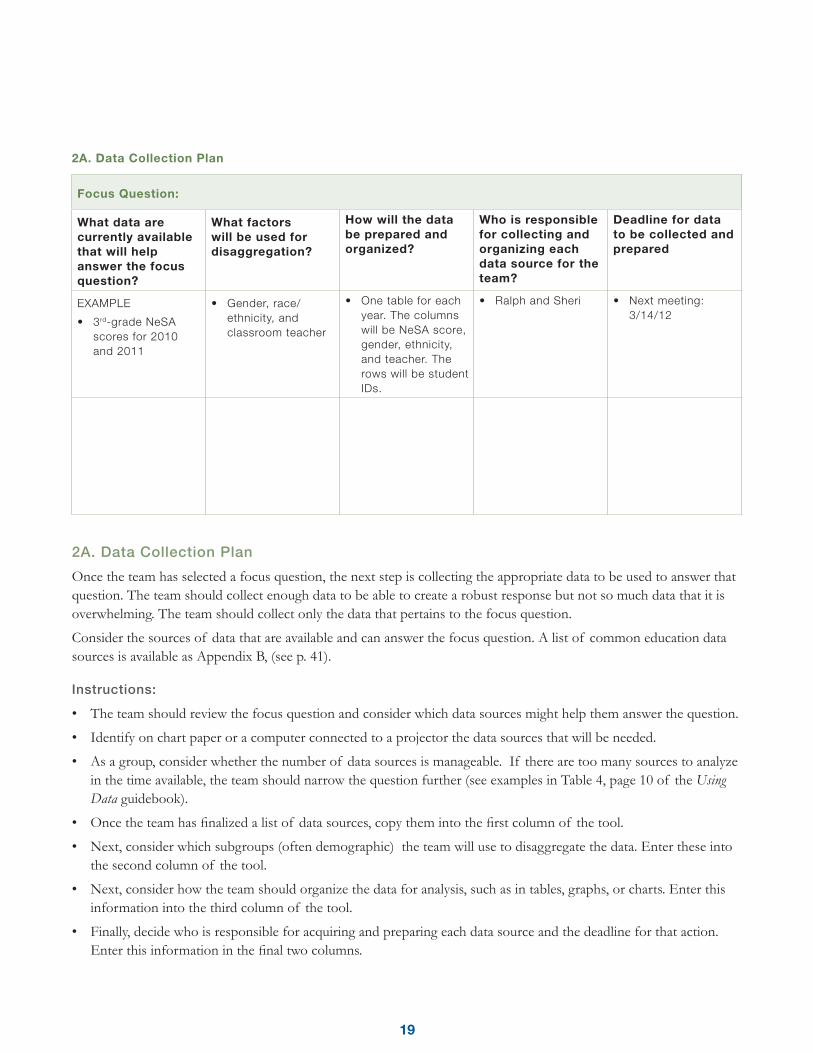
2A. Data Collection Plan
Focus Question:
What data are currently available that will help answer the focus question?
What factors will be used for disaggregation?
How will the data be prepared and organized?
Who is responsible for collecting and organizing each data source for the team?
Deadline for data to be collected and prepared
EXAMPLE
• 3rd-grade NeSA scores for 2010 and 2011
• Gender, race/ethnicity, and classroom teacher
• One table for each year. The columns will be NeSA score, gender, ethnicity, and teacher. The rows will be student IDs.
• Ralph and Sheri • Next meeting: 3/14/12
2A. Data Collection Plan
Once the team has selected a focus question, the next step is collecting the appropriate data to be used to answer that question. The team should collect enough data to be able to create a robust response but not so much data that it is overwhelming. The team should collect only the data that pertains to the focus question.
Consider the sources of data that are available and can answer the focus question. A list of common education data sources is available as Appendix B, (see p. 41).
Instructions:
• The team should review the focus question and consider which data sources might help them answer the question.
• Identify on chart paper or a computer connected to a projector the data sources that will be needed.
• As a group, consider whether the number of data sources is manageable. If there are too many sources to analyze in the time available, the team should narrow the question further (see examples in Table 4, page 10 of the Using Data guidebook).
• Once the team has finalized a list of data sources, copy them into the first column of the tool.
• Next, consider which subgroups (often demographic) the team will use to disaggregate the data. Enter these into the second column of the tool.
• Next, consider how the team should organize the data for analysis, such as in tables, graphs, or charts. Enter this information into the third column of the tool.
• Finally, decide who is responsible for acquiring and preparing each data source and the deadline for that action. Enter this information in the final two columns.
20
Suggestions:
• If the team needs assistance in considering the types of data available to answer the question, provide them with copies of Appendix B: Common Education Data Sources on page 41.
• It is not necessary to incorporate every type of data. Use only those data sources that are relevant and helpful.
• The deadline for data collection and preparation should be before the next meeting.
• Always enter names and actual dates into the “Responsibility” and “Deadline” columns. Entries such as “math teachers” or “ASAP” make it very difficult to track progress and ensure accountability.
• If a responsible party is absent or is not a member of the team, it is imperative that a single person is assigned the task of following up with them within 24 hours of the meeting to describe the responsibility and ensure that the individual is willing and able to complete the task by the deadline. If the individual is not willing or able to complete the task, the facilitator should work quickly to identify a new responsible party.
• If the team learns that the necessary data are not available, they should consider if there are other data sources that could answer the question or if the data can be created in the time allotted. If not, the team should pursue a new question for inquiry for which data can be collected.
21
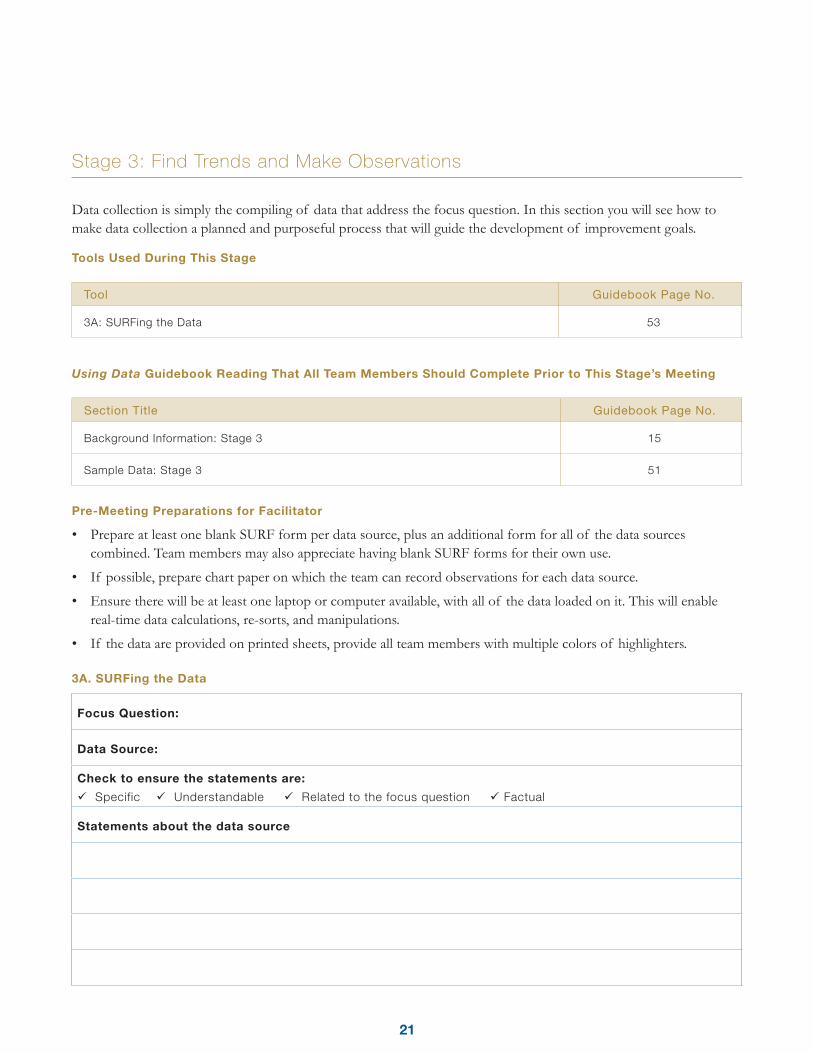
Stage 3: Find Trends and Make Observations
Data collection is simply the compiling of data that address the focus question. In this section you will see how to make data collection a planned and purposeful process that will guide the development of improvement goals.
Tools Used During This Stage
Tool Guidebook Page No.
3A: SURFing the Data 53
Using Data Guidebook Reading That All Team Members Should Complete Prior to This Stage’s Meeting
Section Title Guidebook Page No.
Background Information: Stage 3 15
Sample Data: Stage 3 51
Pre-Meeting Preparations for Facilitator
• Prepare at least one blank SURF form per data source, plus an additional form for all of the data sources combined. Team members may also appreciate having blank SURF forms for their own use.
• If possible, prepare chart paper on which the team can record observations for each data source.
• Ensure there will be at least one laptop or computer available, with all of the data loaded on it. This will enable real-time data calculations, re-sorts, and manipulations.
• If the data are provided on printed sheets, provide all team members with multiple colors of highlighters.
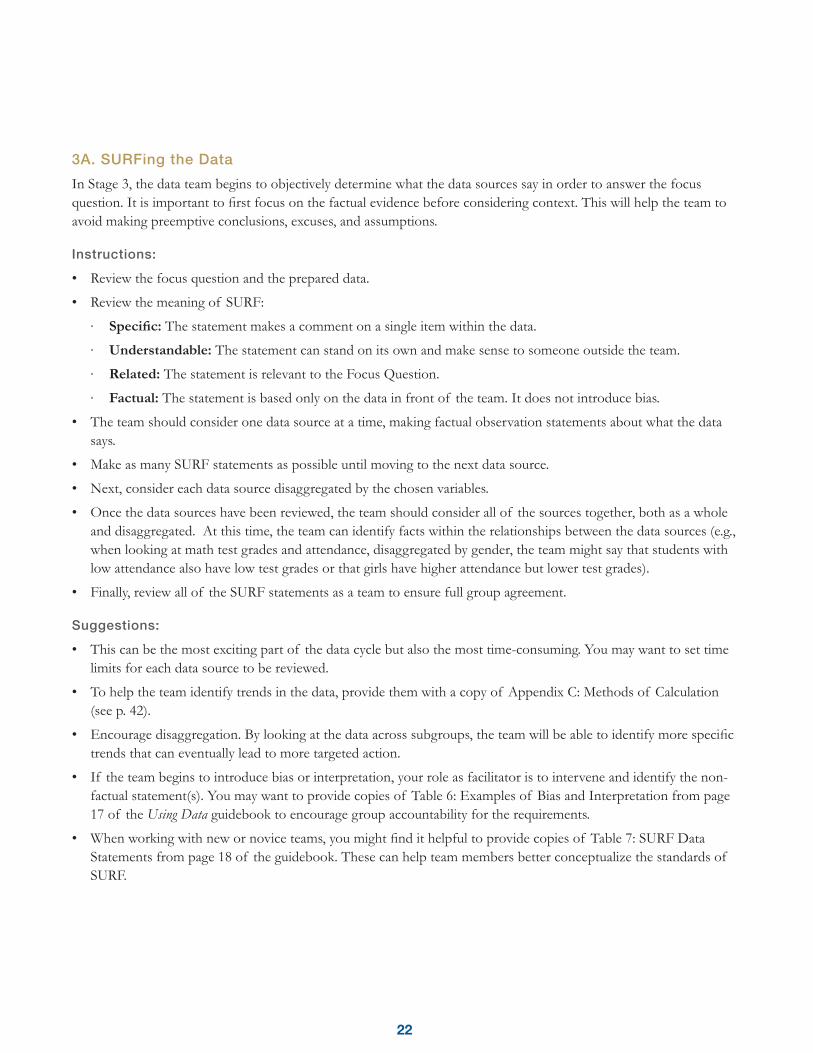
3A. SURFing the Data
Focus Question:
Data Source:
Check to ensure the statements are:
Specific Understandable Related to the focus question Factual
Statements about the data source
22
3A. SURFing the Data
In Stage 3, the data team begins to objectively determine what the data sources say in order to answer the focus question. It is important to first focus on the factual evidence before considering context. This will help the team to avoid making preemptive conclusions, excuses, and assumptions.
Instructions:
• Review the focus question and the prepared data.
• Review the meaning of SURF:
∙ Specific: The statement makes a comment on a single item within the data.
∙ Understandable: The statement can stand on its own and make sense to someone outside the team.
∙ Related: The statement is relevant to the Focus Question.
∙ Factual: The statement is based only on the data in front of the team. It does not introduce bias.
• The team should consider one data source at a time, making factual observation statements about what the data says.
• Make as many SURF statements as possible until moving to the next data source.
• Next, consider each data source disaggregated by the chosen variables.
• Once the data sources have been reviewed, the team should consider all of the sources together, both as a whole and disaggregated. At this time, the team can identify facts within the relationships between the data sources (e.g., when looking at math test grades and attendance, disaggregated by gender, the team might say that students with low attendance also have low test grades or that girls have higher attendance but lower test grades).
• Finally, review all of the SURF statements as a team to ensure full group agreement.
Suggestions:
• This can be the most exciting part of the data cycle but also the most time-consuming. You may want to set time limits for each data source to be reviewed.
• To help the team identify trends in the data, provide them with a copy of Appendix C: Methods of Calculation (see p. 42).
• Encourage disaggregation. By looking at the data across subgroups, the team will be able to identify more specific trends that can eventually lead to more targeted action.
• If the team begins to introduce bias or interpretation, your role as facilitator is to intervene and identify the non-factual statement(s). You may want to provide copies of Table 6: Examples of Bias and Interpretation from page 17 of the Using Data guidebook to encourage group accountability for the requirements.
• When working with new or novice teams, you might find it helpful to provide copies of Table 7: SURF Data Statements from page 18 of the guidebook. These can help team members better conceptualize the standards of SURF.
23
Stage 4: Interpret the Data
In this stage you will move the data team closer to answering the focus question and developing a hypothesis to drive action or response. You will see how to move the data team from factual observations of trends and patterns to deeper analysis.
Tools Used During This Stage
Tool Guidebook Page No.
4A: Celebrate Strengths and Identify Challenges 41
4B: Prioritize Challenges 41
4C: Determine Driving Factors 42
4D: Fishbone Diagram 42
4Di. Fishbone Diagram: Why/Because Table 43
4E. Isolate Controllable Driving Factors 43
Using Data Guidebook Reading That All Team Members Should Complete Prior to This Stage’s Meeting
Section Title Guidebook Page No.
Background Information: Stage 4 19
Sample Data: Stage 4 56
Pre-Meeting Preparations for Facilitator
• Prepare chart paper on which to record strengths and challenges.
• Prepare one blank electronic version of the tool, on which to record final responses.
• Prepare at least one blank Prioritize Challenges tool in the Using Data guidebook (p. 41) for each team member.
• You can use the Determine Driving Factors and/or the Fishbone Diagram (p. 42) tools to complete this stage. The Fishbone Diagram works particularly well with more complex challenges.
• If you select the Fishbone Diagram method of analysis, print several blank copies of the tool for team members to use; do the same if you intend to use the Determine Driving Factors tool.
• If possible, draw blank versions of the analysis tool(s) on a whiteboard or chart paper to enable more streamlined collaboration.
24
4A. Celebrate Strengths and Identify Challenges
Observed Strengths Observed Challenges
4A. Celebrate Strengths and Identify Challenges
The team will begin by reviewing the factual statements about the data. At this stage, the group can introduce interpretation of the facts and statements, placing the statements into the appropriate context. The team should avoid introducing biases and excuses. During this activity, the team will begin to identify areas of strength and areas of challenge that have emerged from the data.
Instructions:
• Begin by reviewing the SURF statements as a team. At this time, the team members can begin to introduce interpretation. Bias should not be included at any time.
• As a team, identify areas of strength that are evident in the data. For example, a team might note that none of the students in the data set failed science.
• Write the strengths on the left hand side of the tool.
• As a team, celebrate these strengths. It’s important to recognize areas where the organization is excelling. Teams might choose to post the strengths within the school, share the strengths during school meetings, and/or reward themselves or their peers with something small, such as by hosting a pizza party or providing colleagues with certificates of appreciation.
25
• Next, identify areas of challenge that are evident in the data and directly related to the focus question. Remind the team that challenges represent factors that may be impeding improvement or positive outcomes in student achievement and performance. Challenges are not barriers that were experienced during the cycle of data inquiry, such as a lack of data access or difficulty scheduling meeting times.
• Write the challenges into the right hand side of the tool.
Suggestions:
• It’s possible that the team will find there were no challenges evident in the data that are related to the focus question. Encourage the team to celebrate this and to accept it as valuable information, then move on to examine additional data sources or to identify a new focus question to begin a new cycle of inquiry.
• If the team identifies challenges that are not related to the focus area or focus question, ensure that the challenges are recorded on the Parking Lot Tool for future cycles of data inquiry.
4B. Prioritize Challenges
Priority Challenge
1
2
3
4
5
4B. Prioritize Challenges
The team will likely identify numerous challenges evidenced by the data but should pursue action to improve only one of the challenges at a time, so it is necessary to identify a top priority challenge.
Instructions:
• Read through all of the identified challenges.
• Team members should consider the impact each challenge might have in improving the focus area, as well as other factors, such as the resources and time they need to take action to improve the challenge.
• Each team member should individually rank order the challenges on his or her blank Prioritize Challenges tool. Challenge #1 will have the highest priority.
• Each team member should share his or her top priority challenge. If there is consensus, this will be the team’s top priority challenge.
• If the group is split evenly between two questions, hold a vote to identify the top priority challenge.
• If the group is split among many questions, use the forced-choice method: Ask members to choose either Option #1 or Option #2. Follow up by asking the team to choose between the winner of the first vote and Option #3. Follow this by asking the team to choose between the winner of the second vote and Option #4. Continue this process until a single option has been chosen.

26
• Write the final top priority challenge on the Data Cycle Overview and circle or highlight it on the tool. This will be the team’s key challenge for action.
Suggestions:
• Set a time limit for prioritizing challenges. This will keep the team focused on the task and will maintain the team’s forward movement.
• If the team experiences difficulty in rank ordering the potential challenges, move directly to the forced-choice method, working through every identified challenge.
• Remind the team that they can return to the other challenges (those that were not chosen to be the key challenge) during a later cycle of inquiry, if desired.
4C. Determine Driving Factors
Key Challenge:
Why? Because… (Driving Factors) Which Area?
Why does the key challenge exist?
Concern Influence Control
Concern Influence Control
Concern Influence Control
Concern Influence Control
Concern Influence Control
Concern Influence Control
Driving Factor
Concern Influence Control
4C. Determine Driving Factors
Once a key challenge has been identified for further inquiry and action, team members will transition to hypothesizing reasons for the challenge’s existence. These reasons, known as driving factors, will become the targets for action in later cycle stages.
27
Instructions:
• Copy the key challenge into the top row of the Determine Driving Factors tool.
• Ask the team: “Why does (key challenge) exist?
• The team should provide an answer: “Because … “
• Write this answer into the first box of the “Because” column. Each “Because” answer is a potential driving factor.
• This answer will become the basis of the next question: “Why does that exist?”
• Continue this process until team members feel they have arrived at a key driver of the issue.
• Repeat the process as many times as needed to identify a robust set of potential driving factors.
• Next, determine whether the driving factors (the “Because” statements) that the team identified best fit within the area of concern, the area of influence, or the area of control. The facilitator should provide the team with these definitions:
∙ Area of Concern: The team has no ability to alter the factors in this area, but these factors do remain a concern.
∙ Area of Influence: The team can change factors around this area, indirectly leading to possible change.
∙ Area of Control: This is a group of items that the team can directly change.
• The team should classify each driving factor into a particular area before moving on.
Suggestions:
• You might want to provide team members with handouts that outline the meanings of the three classifications (Areas of Concern, Influence, and Control). Examples of these areas are available in Table 8: Examples of Areas of Concern, Influence, and Control on page 20 of the Using Data guidebook.
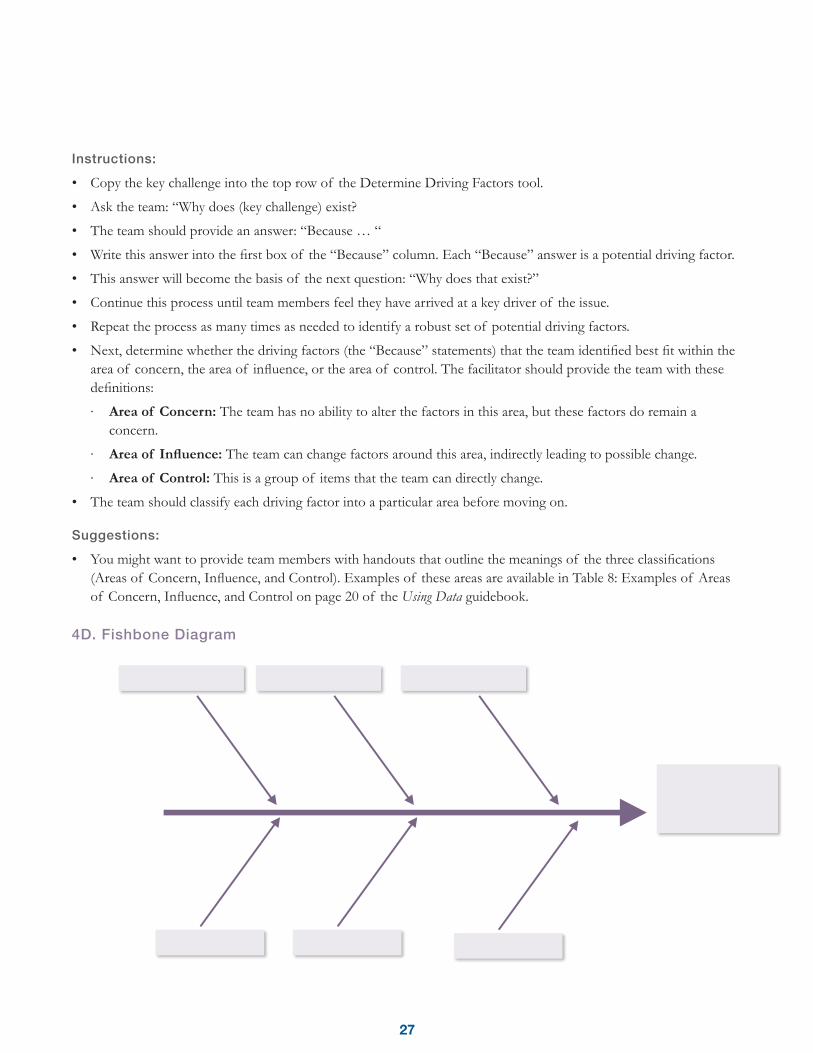
4D. Fishbone Diagram
28
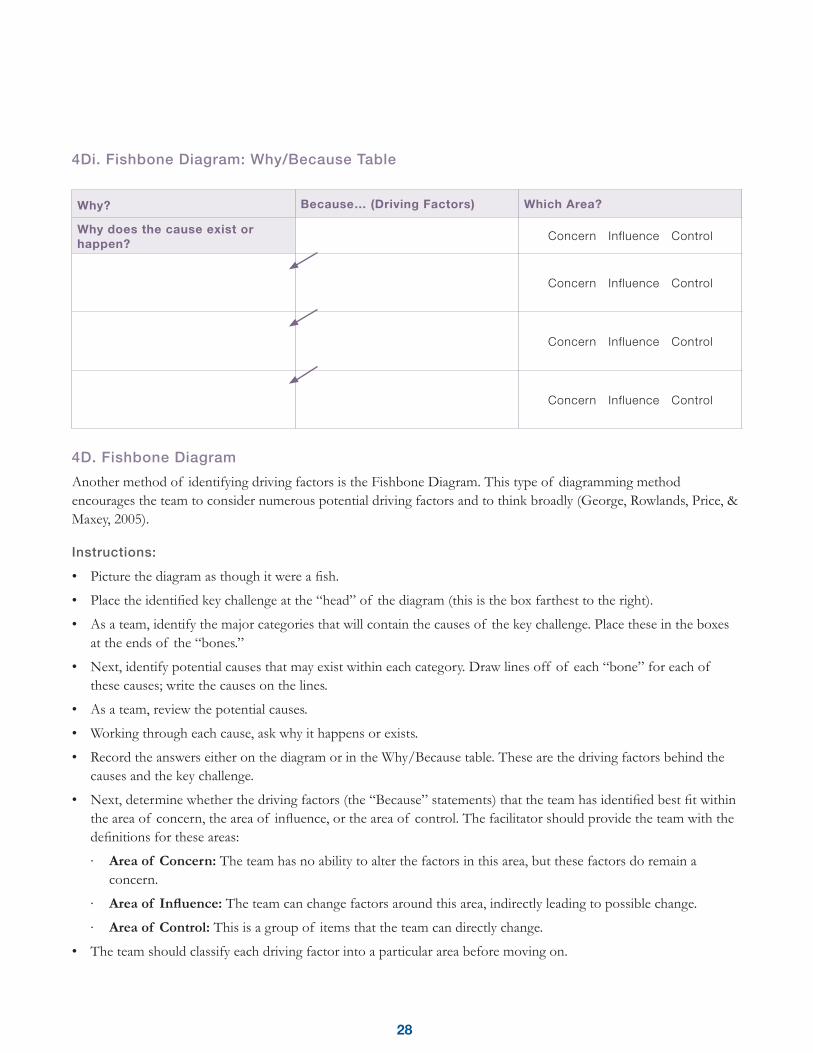
4Di. Fishbone Diagram: Why/Because Table
Why? Because… (Driving Factors) Which Area?
Why does the cause exist or happen?
Concern Influence Control
Concern Influence Control
Concern Influence Control
Concern Influence Control
4D. Fishbone Diagram
Another method of identifying driving factors is the Fishbone Diagram. This type of diagramming method encourages the team to consider numerous potential driving factors and to think broadly (George, Rowlands, Price, & Maxey, 2005).
Instructions:
• Picture the diagram as though it were a fish.
• Place the identified key challenge at the “head” of the diagram (this is the box farthest to the right).
• As a team, identify the major categories that will contain the causes of the key challenge. Place these in the boxes at the ends of the “bones.”
• Next, identify potential causes that may exist within each category. Draw lines off of each “bone” for each of these causes; write the causes on the lines.
• As a team, review the potential causes.
• Working through each cause, ask why it happens or exists.
• Record the answers either on the diagram or in the Why/Because table. These are the driving factors behind the causes and the key challenge.
• Next, determine whether the driving factors (the “Because” statements) that the team has identified best fit within the area of concern, the area of influence, or the area of control. The facilitator should provide the team with the definitions for these areas:
∙ Area of Concern: The team has no ability to alter the factors in this area, but these factors do remain a concern.
∙ Area of Influence: The team can change factors around this area, indirectly leading to possible change.
∙ Area of Control: This is a group of items that the team can directly change.
• The team should classify each driving factor into a particular area before moving on.
29
Suggestions:
• You might want to provide team members with handouts that outline the meanings of the three classifications (Areas of Concern, Influence, and Control). Examples of these areas are available in Table 8: Examples of Areas of Concern, Influence, and Control on page 20 of the Using Data guidebook.
• If possible, create a large, blank Fishbone Diagram on chart paper, a whiteboard, or other large surface and fill in the “head” and “bones” (or the key challenge and categories). While identifying potential causes, team members should write these on sticky notes and affix them to the appropriate “bones” or categories.
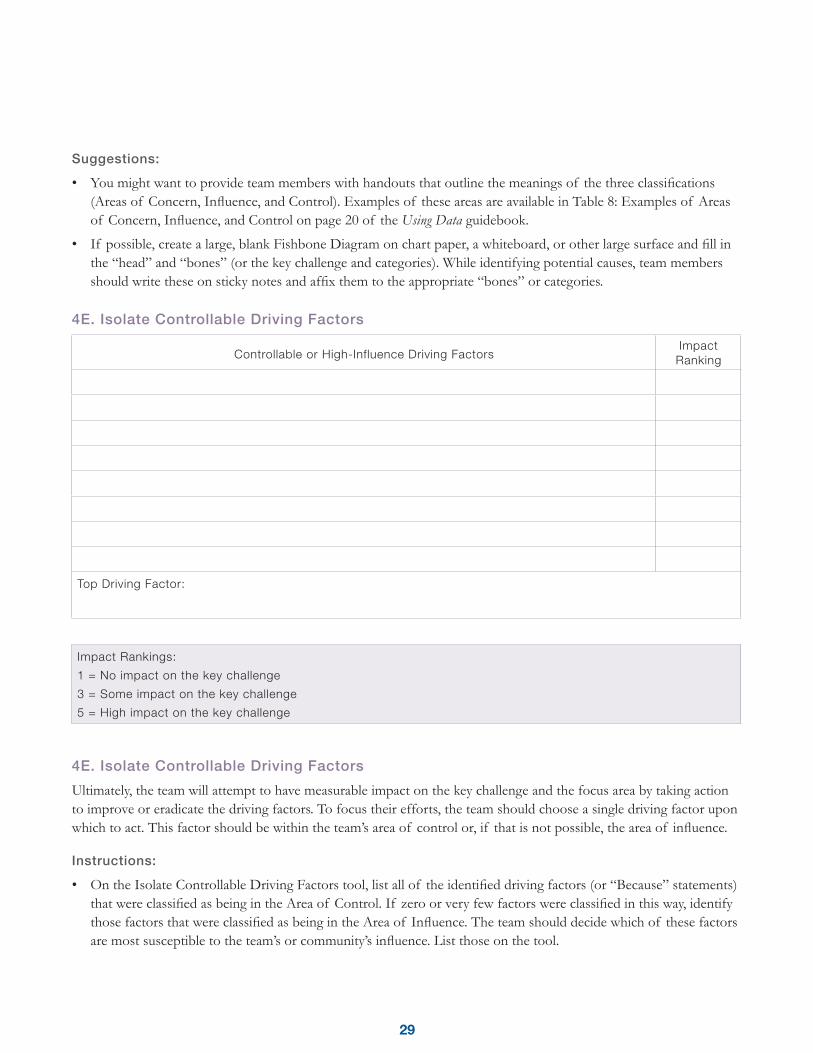
4E. Isolate Controllable Driving Factors
Controllable or High-Influence Driving FactorsImpact
Ranking
Top Driving Factor:
Impact Rankings:
1 = No impact on the key challenge
3 = Some impact on the key challenge
5 = High impact on the key challenge
4E. Isolate Controllable Driving Factors
Ultimately, the team will attempt to have measurable impact on the key challenge and the focus area by taking action to improve or eradicate the driving factors. To focus their efforts, the team should choose a single driving factor upon which to act. This factor should be within the team’s area of control or, if that is not possible, the area of influence.
Instructions:
• On the Isolate Controllable Driving Factors tool, list all of the identified driving factors (or “Because” statements) that were classified as being in the Area of Control. If zero or very few factors were classified in this way, identify those factors that were classified as being in the Area of Influence. The team should decide which of these factors are most susceptible to the team’s or community’s influence. List those on the tool.
30
• Review the decisions that have been made to date and recorded on the Data Cycle Overview. These decisions include the focus area, focus question, and key challenge.
• The team should identify potential driving factors that will have the largest impact in creating improvements within the key challenge and focus area.
• Rank order the potential driving factors according to estimated impact. Factor #1 will be estimated to have the largest impact.
• Each team member should share his or her top priority driving factor.
∙ If there is consensus, this will be the team’s top driving factor.
∙ If the group is split evenly between two questions, hold a vote to identify the top driving factor.
∙ If the group is split among many questions, use the forced-choice method: Ask members to choose either Option #1 or Option #2. Follow up by asking the team to choose between the winner of the first vote and Option #3. Follow this by asking the team to choose between the winner of the second vote and Option #4. Continue this process until a single option has been chosen.
• Write the final top driving factor on the Data Cycle Overview and circle or highlight it on the tool. This will be the team’s top driving factor for action.
Suggestions:
• Set a time limit for prioritizing driving factors. This will keep the team focused on the task and will maintain the team’s forward movement.
• If the team experiences difficulty in rank ordering the potential driving factors, the facilitator can move directly to the forced-choice method, working through every identified challenge.
• The facilitator should remind the team that they can return to the other factors (those that were not chosen to be the top driving factor) during a later cycle of inquiry if desired.
31
Stage 5: Plan for Action
After the members of the data team have collected, organized, and analyzed the data to identify patterns, challenges, and driving factors, they are ready to move to action planning. The goal of the full cycle of inquiry is to take action on key driving factors to positively affect the key challenge and ultimately improve the overarching focus area.
Tools Used During This Stage
Tool Guidebook Page No.
5A. Identify Strategy for Action 44
5B. Strategy-Setting Tool 44
Using Data Guidebook Reading That All Team Members Should Complete Prior to This Stage’s Meeting
Section Title Guidebook Page No.
Background Information: Stage 5 23
Sample Data: Stage 5 59
Pre-Meeting Preparations for Facilitator
• Prepare enough Identify Strategy for Action tools in the Using Data guidebook (p. 44) to provide every member of the team with at least one.
• Prepare a sheet of chart paper for recording potential strategies.
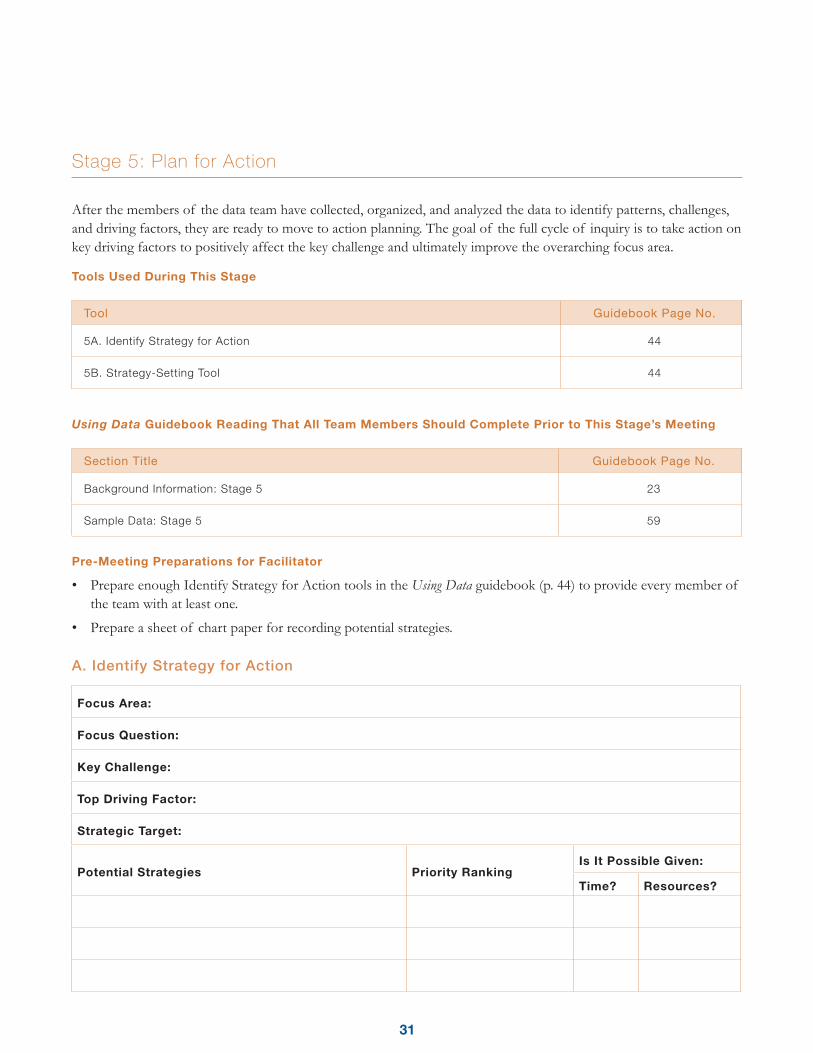
A. Identify Strategy for Action
Focus Area:
Focus Question:
Key Challenge:
Top Driving Factor:
Strategic Target:
Potential Strategies Priority RankingIs It Possible Given:
Time? Resources?

32
Strategy for Action:
5A: Identify Strategy for Action
Once the data team has assembled information from the data, team members must design a specific strategy for action that provides a clear outline of the following:
• The baseline measurement of the key challenge
• The improvement the team would like to see in the key challenge
• A deadline for improvement to have occurred
• The specific action the team will implement to create this improvement
Instructions:
• Review the focus area, focus question, key challenge, and driving factor.
• As a team, identify the change the group would like to see in the key challenge. For example, if the key challenge is a high level of tardies in the middle school, the team may decide that it would like to see the number of tardies decline.
• With the desired change in mind, the team should identify a specific target for this change. This target will represent an exact amount or goal for the change in the key challenge. For example, if the desired change is a decline in the number of tardies in the middle school, the target might be “no more than 45 total tardies.”
• This will become the team’s strategic target. Write the target into the row labeled “Strategic Target” on the Identify Strategy for Action tool.
• Next, the team should review the top driving factor that was identified during Stage 4.
∙ As a team, consider the following question: “What actions do you think we could pursue to improve the top driving factor?”
∙ These actions should be related to the key challenge and should be actions that will directly impact the top driving factor.
• The team should list these potential actions in the “Potential Strategies” column of the Identify Strategy for Action tool.
• Once the team has generated a list of potential strategies, team members should consider the feasibility of each strategy. When recording the feasibility, use simple notation (e.g., Yes, No, Maybe, or Not yet) to indicate the level of viability of each strategy.
∙ Read the first potential strategy to the team.
∙ Ask: “Is this strategy possible for us to pursue given the time we have to do it?” Note the response.
∙ Ask: “Is this strategy possible for us to pursue given the resources we have available? Resources include, among other considerations, both money and manpower.” Note the response.
∙ Continue with each item on the list until the team has rated the viability of each strategy.
33
• Cross out the strategies that received responses of No or Not Yet in either the Time or Resources column. Record these on the Parking Lot Tool or other device to ensure that the team can return to them at a later date if desired.
• The team should now consider only those strategies that were deemed feasible with both the time and resources available. Each member should individually rank the potential strategies in order of priority.
∙ If there is only one potential strategy remaining, this will be the team’s Strategy for Action.
∙ If there are two potential strategies remaining, the team should vote to determine the Strategy for Action.
∙ If there are multiple strategies remaining, use the forced-choice method: Ask members to choose either Option #1 or Option #2. Follow up by asking the team to choose between the winner of the first vote and Option #3. Follow this by asking the team to choose between the winner of the second vote and Option #4. Continue this process until a single option has been chosen.
Suggestions:
• Be prepared to set a time limit for generating potential strategies. This will help keep the team on task and moving forward.
• While generating ideas for potential strategies, the team may present ideas that are not related to the top driving factor, key challenge, or focus question. As facilitator, you (and group members) can interrupt to veto these ideas based on their irrelevance, though they should be retained on the Parking Lot or other recording tool in the event the team would like to return to them during a later cycle of inquiry.
• If the team experiences difficulty in setting a target, present it as a measurable goal, an end point where the team would like to see the key challenge at the close of their work. You also might provide possibilities, such as a percentage or raw number reduction or increase in a particular behavior, outcome, or activity.
• If it is difficult for the team to determine the feasibility of a given potential strategy, ask, “Is there anything holding us back from actually doing this action or making this a reality?” If the response is “Yes,” work to move the team towards other strategy ideas and options.
• When determining the feasibility of potential strategies, try to keep final responses to:
∙ Yes
∙ No
∙ Maybe
∙ Not yet/Not at this time
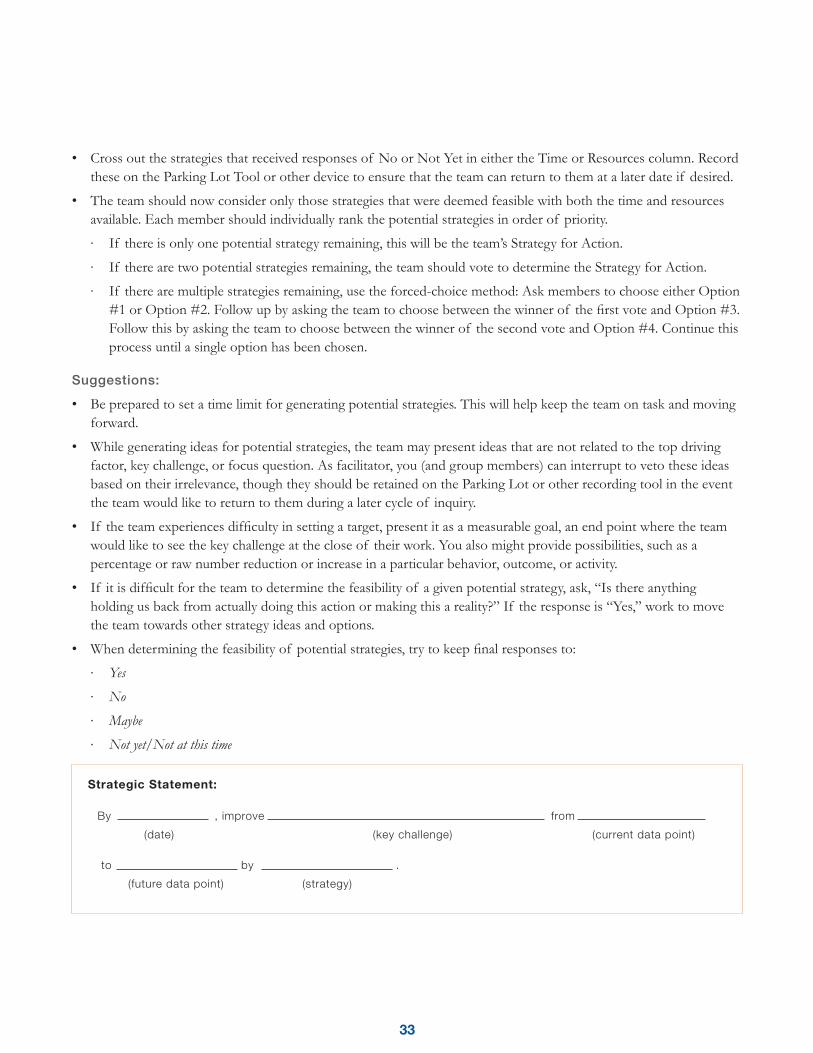
Strategic Statement:
By , improve from
(date) (key challenge) (current data point)
to by .
(future data point) (strategy)
34
This will enable tracking of potential strategies that could become more feasible over time or that could be pursued if something changes with the time or resources available.
5B. Strategy Setting Tool
Strategies must be clearly expressed to ensure consistent and faithful implementation. This will help the team get its members and the greater school or district community to commit to the plan of action and the changes that may be needed to reach the ultimate goal.
Instructions:
• The team should begin by determining a date for the action to conclude. This is the point at which the team expects to see change in the key challenge.
• Next, the team should assemble the following information:
∙ The strategy for action
∙ The key challenge
∙ The baseline measurement of the key challenge
∙ The target
∙ The end date
• With this information prepared, the team can develop a strategic statement.
• All strategic statements will have the following in common:
∙ They will identify the strategic action to be taken.
∙ They will identify the key challenge to be improved.
∙ They will set a target end point for that improvement to take place.
• The gathered information should be entered into the Strategy Setting Tool. The team may need to edit the language in order to make the strategic statement easy to understand.
• Once the strategic statement has been written, the facilitator should ensure that the whole team agrees with and understands the statement.
• Add the strategic statement to the Data Cycle Overview.
Suggestions:
• If the team decides to set a long-term goal (with a deadline more than one year out), simply complete this task and add shorter-term milestones at one-year increments.
• In some cases, the strategic statement may not fit the given form. The form is inconsequential as long as the statement includes the necessary information in a concise and comprehensible manner. If this occurs, the facilitator should ensure that enough information is included in the statement to identify:
∙ The action to be taken
∙ The key challenge to be improved
∙ The improvement that is expected
∙ An end date
35
Stage 6: Implement, Monitor, and Sustain
In this section, your focus is on the plan. The data team must develop and implement an action plan, as well as continuously evaluate and monitor how effectively the plan is working.
Tools Used During This Stage
Tool Guidebook Page No.
6A. Action Plan–Organizing the Team for Action 45
6B. Evaluating Progress and Improvement 46
Using Data Guidebook Reading That All Team Members Should Complete Prior to This Stage’s Meeting
Section Title Guidebook Page No.
Background Information: Stage 6 27
Sample Data: Stage 6 61
Pre-Meeting Preparations for Facilitator
• Ensure that the Data Cycle Overview has been completed with all of the decisions that the team made during the cycle. If possible, post this in the meeting room.
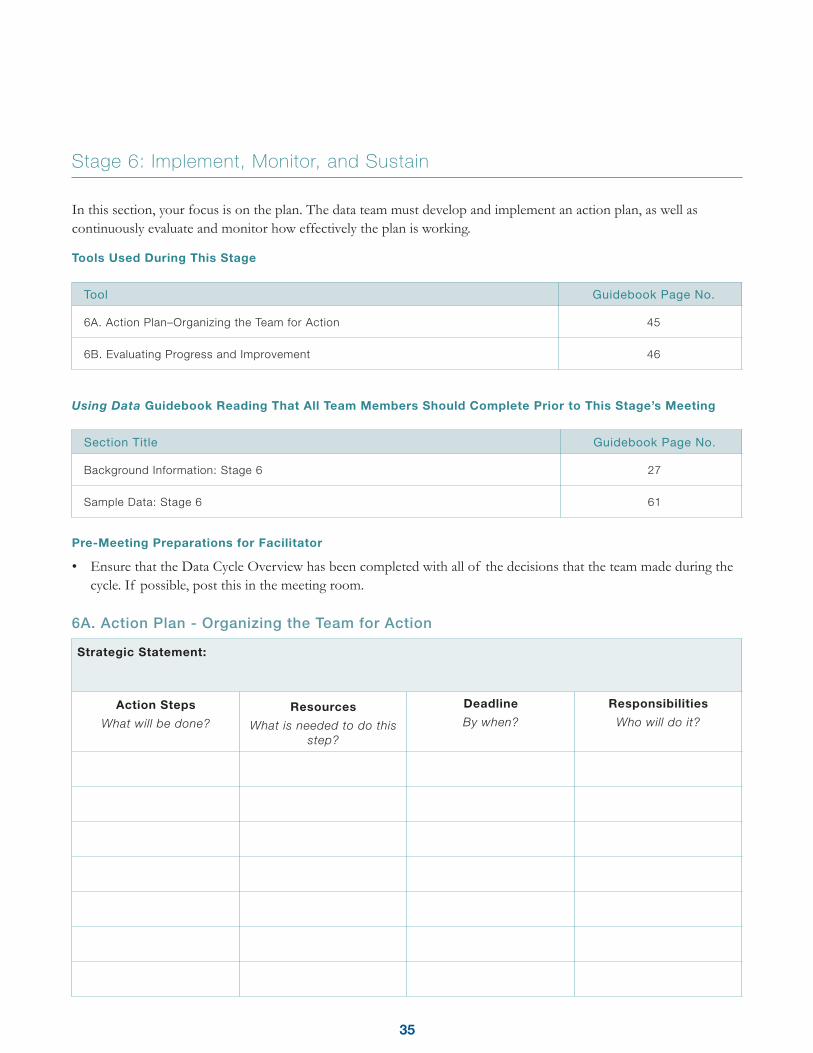
6A. Action Plan - Organizing the Team for Action
Strategic Statement:
Action Steps
What will be done?Resources
What is needed to do this step?
Deadline
By when?
Responsibilities
Who will do it?

36
6A: Action Plan–Organizing the Team for Action
In preparing to act, the team will identify all of the activities needed to implement the designated strategy. This will result in an action plan, or a project plan, for the strategy implementation. The action plan ensures that all necessary steps are included.
Instructions:
• Review the strategic statement, paying particular attention to the strategic action. Ensure full group understanding of the strategic action.
• Introduce the concept of the action plan by saying something like this: “The action plan walks the team through the whole strategy, to ensure that all of the tasks needed to complete the strategy are considered and allocated.”
• As a team, identify all of the tasks that will need to be completed in order to implement the strategic action. List these tasks in the far left column labeled “Action Steps.”
• Next, the team should consider whether there are any specific resources needed to complete the task. These may require additional tasks to acquire them.
• Next, determine when each task needs to be completed in order to keep the team on track to finishing by the deadline set in the strategic statement.
• Finally, assign responsibilities to team members.
∙ If necessary, the team can assign responsibilities to colleagues outside of the team, but should get their consent for this ahead of time.
∙ If the team chooses to assign responsibilities outside the team, one person should be assigned to follow up with the external individual to clearly describe the responsibility and the timelines and to confirm that they agree to the task and can complete the task by the deadline.
• As the team begins to implement the action plan, care should be taken to ensure that the action steps are on track for timely completion. The team should troubleshoot and problem-solve as needed to keep the plan on track.
Suggestions:
• Communication is a key aspect of a successful action plan.
• The team may want to appoint a single person to lead the action plan. This person would hold responsibility for touching base with responsible parties to see what progress has been made, to ensure that they will be able to meet their deadlines, and that they have all of the resources they need.
• Some action plans will be very detailed and several pages long while other action plans will be very short. What is important is that the action plan includes all of the steps needed to successfully implement the strategy.
• When assigning deadlines and responsibilities, the team should ensure that specific dates and individuals are identified. Inputs such as “ASAP,” “2012,” “the whole team,” or “front office staff ” can lead to missed deadlines and a lack of accountability and clarity regarding responsibility.
• All team members should participate in implementing the strategy and action plan. Though you have guided the team to this point, the whole team shares the responsibilities of completing the data process.
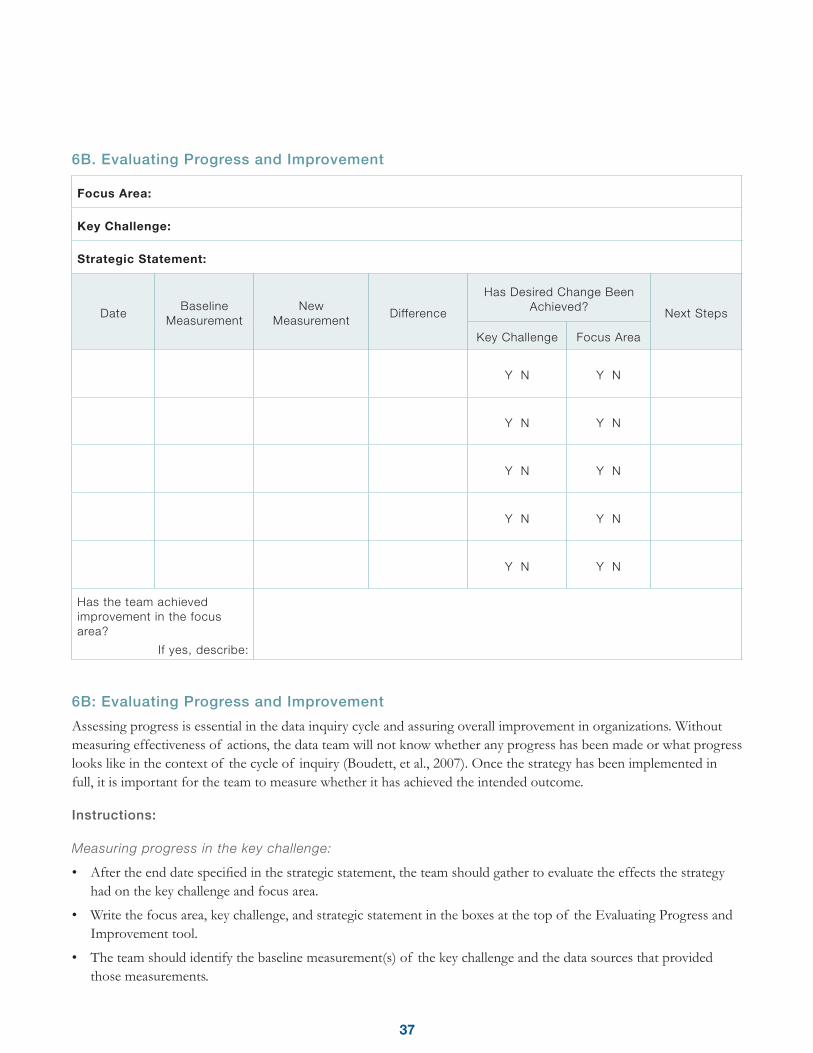
37
6B. Evaluating Progress and Improvement
Focus Area:
Key Challenge:
Strategic Statement:
DateBaseline
MeasurementNew
MeasurementDifference
Has Desired Change Been Achieved? Next Steps
Key Challenge Focus Area
Y N Y N
Y N Y N
Y N Y N
Y N Y N
Y N Y N
Has the team achieved improvement in the focus area?
If yes, describe:
6B: Evaluating Progress and Improvement
Assessing progress is essential in the data inquiry cycle and assuring overall improvement in organizations. Without measuring effectiveness of actions, the data team will not know whether any progress has been made or what progress looks like in the context of the cycle of inquiry (Boudett, et al., 2007). Once the strategy has been implemented in full, it is important for the team to measure whether it has achieved the intended outcome.
Instructions:
Measuring progress in the key challenge:
• After the end date specified in the strategic statement, the team should gather to evaluate the effects the strategy had on the key challenge and focus area.
• Write the focus area, key challenge, and strategic statement in the boxes at the top of the Evaluating Progress and Improvement tool.
• The team should identify the baseline measurement(s) of the key challenge and the data sources that provided those measurements.
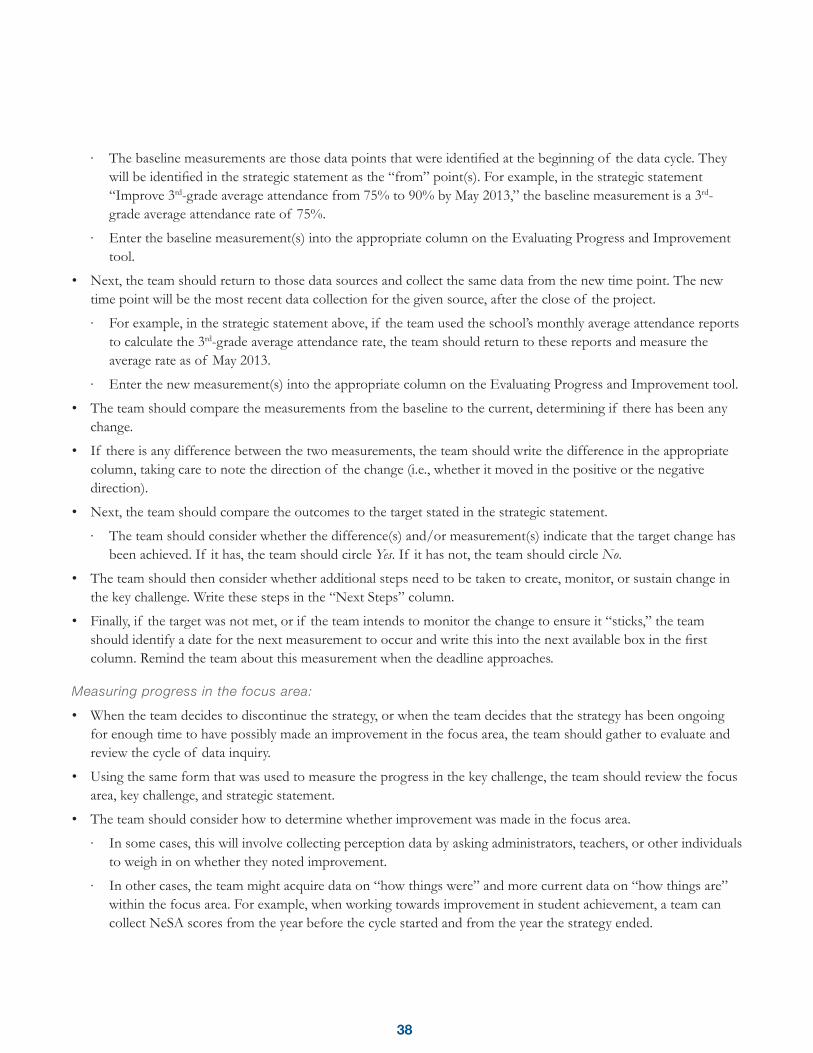
38
∙ The baseline measurements are those data points that were identified at the beginning of the data cycle. They will be identified in the strategic statement as the “from” point(s). For example, in the strategic statement “Improve 3rd-grade average attendance from 75% to 90% by May 2013,” the baseline measurement is a 3rd-grade average attendance rate of 75%.
∙ Enter the baseline measurement(s) into the appropriate column on the Evaluating Progress and Improvement tool.
• Next, the team should return to those data sources and collect the same data from the new time point. The new time point will be the most recent data collection for the given source, after the close of the project.
∙ For example, in the strategic statement above, if the team used the school’s monthly average attendance reports to calculate the 3rd-grade average attendance rate, the team should return to these reports and measure the average rate as of May 2013.
∙ Enter the new measurement(s) into the appropriate column on the Evaluating Progress and Improvement tool.
• The team should compare the measurements from the baseline to the current, determining if there has been any change.
• If there is any difference between the two measurements, the team should write the difference in the appropriate column, taking care to note the direction of the change (i.e., whether it moved in the positive or the negative direction).
• Next, the team should compare the outcomes to the target stated in the strategic statement.
∙ The team should consider whether the difference(s) and/or measurement(s) indicate that the target change has been achieved. If it has, the team should circle Yes. If it has not, the team should circle No.
• The team should then consider whether additional steps need to be taken to create, monitor, or sustain change in the key challenge. Write these steps in the “Next Steps” column.
• Finally, if the target was not met, or if the team intends to monitor the change to ensure it “sticks,” the team should identify a date for the next measurement to occur and write this into the next available box in the first column. Remind the team about this measurement when the deadline approaches.
Measuring progress in the focus area:
• When the team decides to discontinue the strategy, or when the team decides that the strategy has been ongoing for enough time to have possibly made an improvement in the focus area, the team should gather to evaluate and review the cycle of data inquiry.
• Using the same form that was used to measure the progress in the key challenge, the team should review the focus area, key challenge, and strategic statement.
• The team should consider how to determine whether improvement was made in the focus area.
∙ In some cases, this will involve collecting perception data by asking administrators, teachers, or other individuals to weigh in on whether they noted improvement.
∙ In other cases, the team might acquire data on “how things were” and more current data on “how things are” within the focus area. For example, when working towards improvement in student achievement, a team can collect NeSA scores from the year before the cycle started and from the year the strategy ended.
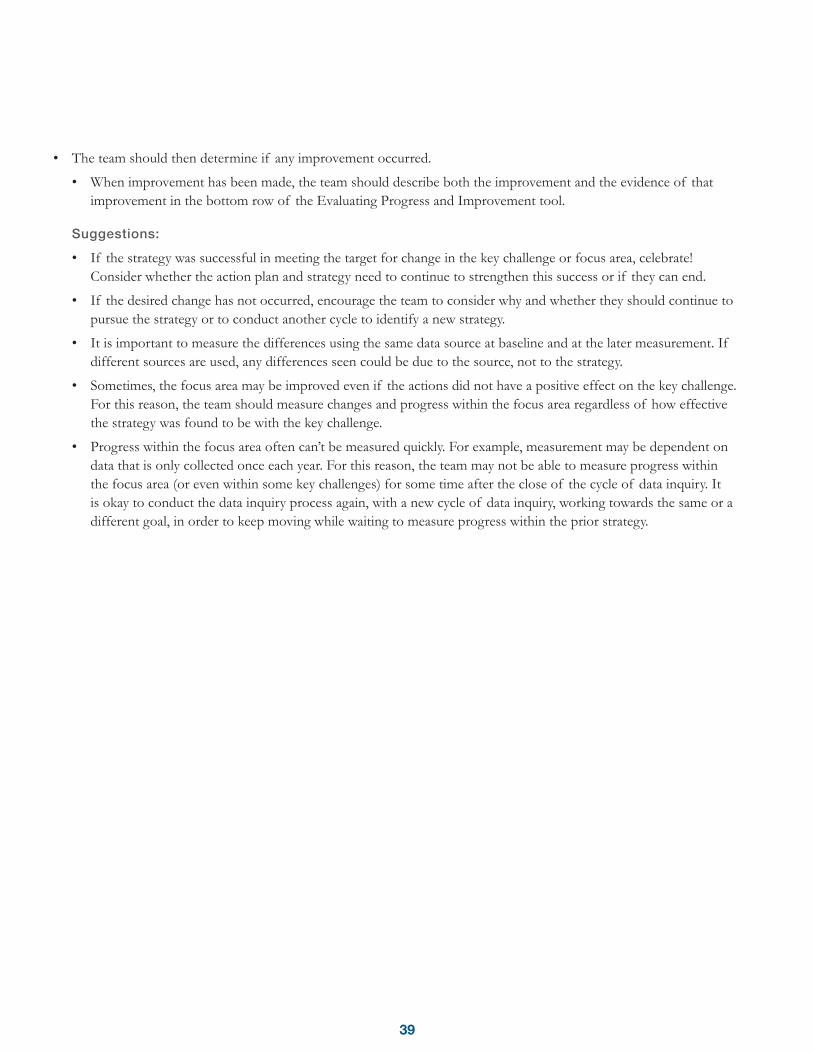
39
• The team should then determine if any improvement occurred.
• When improvement has been made, the team should describe both the improvement and the evidence of that improvement in the bottom row of the Evaluating Progress and Improvement tool.
Suggestions:
• If the strategy was successful in meeting the target for change in the key challenge or focus area, celebrate! Consider whether the action plan and strategy need to continue to strengthen this success or if they can end.
• If the desired change has not occurred, encourage the team to consider why and whether they should continue to pursue the strategy or to conduct another cycle to identify a new strategy.
• It is important to measure the differences using the same data source at baseline and at the later measurement. If different sources are used, any differences seen could be due to the source, not to the strategy.
• Sometimes, the focus area may be improved even if the actions did not have a positive effect on the key challenge. For this reason, the team should measure changes and progress within the focus area regardless of how effective the strategy was found to be with the key challenge.
• Progress within the focus area often can’t be measured quickly. For example, measurement may be dependent on data that is only collected once each year. For this reason, the team may not be able to measure progress within the focus area (or even within some key challenges) for some time after the close of the cycle of data inquiry. It is okay to conduct the data inquiry process again, with a new cycle of data inquiry, working towards the same or a different goal, in order to keep moving while waiting to measure progress within the prior strategy.

40
Appendix A: Data Team Roles & Responsibilities
Members of the data team should be assigned roles to ensure full commitment and equal participation among members. These roles can rotate, so that every member holds every role at some point, or they can be static. Important and common roles include the following.
• Facilitator: Guides the team through the stages of data inquiry. When decisions need to be made, this person will lead the team through decision making and consensus building. If the team does not appoint referee or planner roles, the facilitator will also maintain responsibility for the tasks associated with those roles.
• Time-keeper: Responsible for keeping the meeting moving according to the schedule by beginning and ending on time.
• Recorder: Responsible for taking notes during the meeting and reporting and disseminating to all team members following the meeting.
• Referee: Responsible for keeping the team on task during the meeting.
• Planner: Responsible for communicating with members about upcoming meetings and responsibilities.
• Active Participant: All team members will be engaged participants in the team meetings, actively listening and contributing to discussions.
Appendices

41
Appendix B: Common Education Data Sources
The following table contains examples of data that are commonly available in schools and school districts.
Demographic Data
• Gender
• Ethnicity
• Socio-economic status
• Enrollment
• Attendance
Demographic Data
• Stakeholder Surveys or Questionnaires (parents, students, staff, community members, graduates)
• Observations
• Climate Surveys
Performance Data:
Achievement
• State Assessments
• District & School Assessments
• Curriculum-Based Assessments
• Interim & Benchmark Assessments
• End of Course Grades
• GPA
Outcomes
• Graduation and Dropout
• Mobility
• Suspensions & Expulsions
• Behavior
• Remediation
• College Acceptance/Attendance
• Career Placement and Choices
Program Data
• Curricular sequences
• Instructional strategies
• Nature & Frequency of Assessments
• Professional Development
• Textbooks
• Staffing
• Extracurricular Activities
• Schedule

42
Appendix C: Methods of Calculation
A quick method for finding meaning in the data is counting, adding, dividing, or averaging the data.
Student IDEnd of Course Grades
Gender GradeMath Reading Science
353042 93 74 72 F 6
121224 92 76 73 F 5
101617 78 65 79 F 5
230769 73 92 84 F 6
527890 81 84 88 F 6
720508 96 81 88 F 5
926985 67 68 89 F 5
910519 82 61 90 F 6
979696 71 74 98 F 6
980957 67 63 85 M 5
993067 92 64 85 M 5
747337 74 78 85 M 6
864729 81 63 86 M 6
905777 99 81 87 M 5
385537 86 91 91 M 5
714597 73 64 94 M 6
257661 93 94 94 M 6
762871 84 73 94 M 5
Given the example data, above:
Counting: The team can manually count that the data set includes seven girls and that three students received end-of-course grades below 80 in science.
Adding: The team can identify that four 6th graders and two 5th graders had end-of-course grades above 90 in mathematics. Added together, the team can say that six students in grades 5 and 6 had end-of-course grades above 90 in mathematics.
Dividing: Because there are seven girls and nine boys, the data set is unequal in size across those groups. By dividing the total number of girls who received a grade of 80 or higher in reading by the total number of girls, the team can learn that 43 percent of girls received a grade of 80 or higher in reading. By conducting the same calculation with the data on boys, the team can learn that 33 percent of boys received a grade of 80 or higher in reading. Because the data have been calculated to a percentage, these two groups of different sizes can now be more equally compared.

43
Averaging: The team can quickly determine the average math grade by adding all of the math grades and dividing by the total number of students in the data source. From this, the team learns that the average math grade overall is 82. The team can also calculate the average 5th- grade science grade by adding all of the science grades in the 5th grade and dividing by the total number of 5th graders in the data source. From this, the team learns that the average 5th-grade science grade is 86.
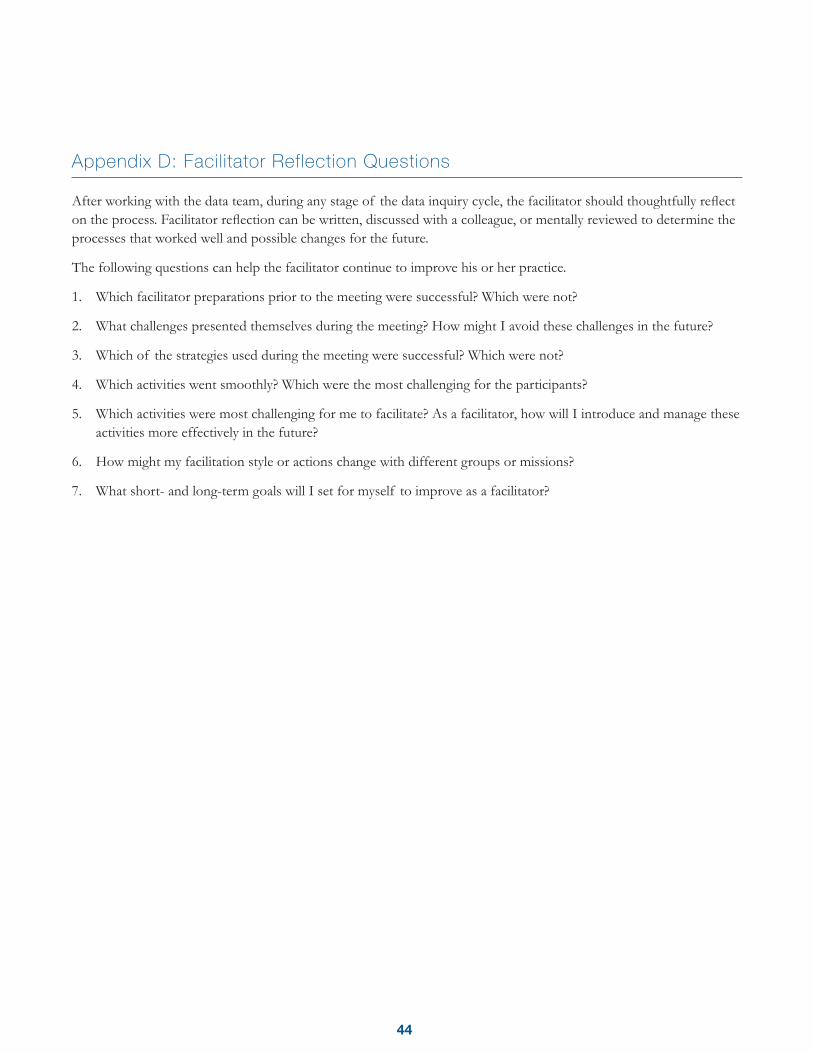
44
Appendix D: Facilitator Reflection Questions
After working with the data team, during any stage of the data inquiry cycle, the facilitator should thoughtfully reflect on the process. Facilitator reflection can be written, discussed with a colleague, or mentally reviewed to determine the processes that worked well and possible changes for the future.
The following questions can help the facilitator continue to improve his or her practice.
1. Which facilitator preparations prior to the meeting were successful? Which were not?
2. What challenges presented themselves during the meeting? How might I avoid these challenges in the future?
3. Which of the strategies used during the meeting were successful? Which were not?
4. Which activities went smoothly? Which were the most challenging for the participants?
5. Which activities were most challenging for me to facilitate? As a facilitator, how will I introduce and manage these activities more effectively in the future?
6. How might my facilitation style or actions change with different groups or missions?
7. What short- and long-term goals will I set for myself to improve as a facilitator?
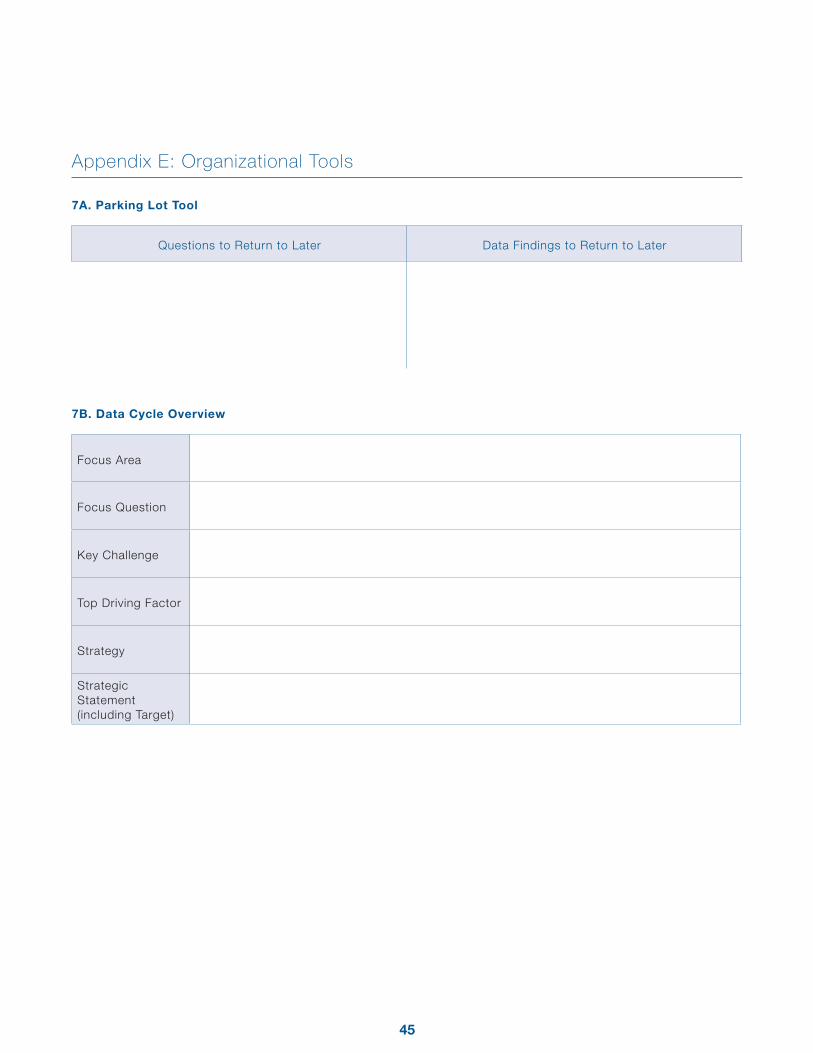
45
Appendix E: Organizational Tools
7A. Parking Lot Tool
Questions to Return to Later Data Findings to Return to Later
7B. Data Cycle Overview
Focus Area
Focus Question
Key Challenge
Top Driving Factor
Strategy
Strategic Statement (including Target)
46
Bens, I. (1999). Facilitation at a glance: Your pocket guide to facilitation. Salem, NH: GOAL/QPC.
Boudett, K. P., City, E. A., & Murname, R. J. (2007). Datawise: A step-by-step guide to using assessment results to improve teaching
and learning. Cambridge, MA: Harvard Education Press.
George, M. L., Rowlands, D., Price, M., & Maxey, J. (2005). The Lean Six Sigma pocket toolbook. New York: McGraw-Hill.
Havelock, R. G., & Zlotolow, S. (1995). The change agent’s guide (2nd ed.). Englewood Cliffs, NJ: Educational Technology
Publications.
International Association of Facilitators. (2002, May). Basic facilitation skills. St. Paul, MN: Author. Retrieved from www.uiowa.edu/~c
qi/2002BasicFacilitationPrimer.pdf
Lippitt, G. L., & Lippitt, R. (1986). The consulting process in action (2nd ed.). San Diego, CA: University Associates.
Love, N., Haley-Speca, M. A., & Reed, D. (2010, Spring). The skillful data team: Four essentials for improving teaching and learning.
Massachusetts Association for Supervision and Curriculum Development Perspectives, 2−5. Retrieved from www.mascd.
org/1731106417449990/blank/browse.asp?A=383&BMDRN=2000&BCOB=0&C=54836
Myrsiades, L. (2000). Meeting sabotage: Met and conquered. Journal of Management Development, 19(10), 870−884.
References


Nebraska Department of Education301 Centennial Mall South
P.O. Box 94987, Lincoln, NE 68509-4987
402.471.2295 • www.education.ne.gov