using gnss tracking networks to map global ionospheric ... 2014 - py08 - pi - 2324...using gnss...
TRANSCRIPT
Using GNSS Tracking Networks to Map Global Ionospheric Irregularities and Scintillation
IGS Workshop, Caltech, Pasadena, California, June 26, 2014
Xiaoqing PiAnthony J. Mannucci
Larry RomansYaoz Bar-Sever
Jet Propulsion Laboratory, California Institute of Technology
2014 California Institute of Technology.United States Government Sponsorship Acknowledged.
2
ANAS
June 26, 2014 Pi et al.: Using GNSS Networks to Map Global Ionospheric Irregularities
Ionospheric Scintillation Indices
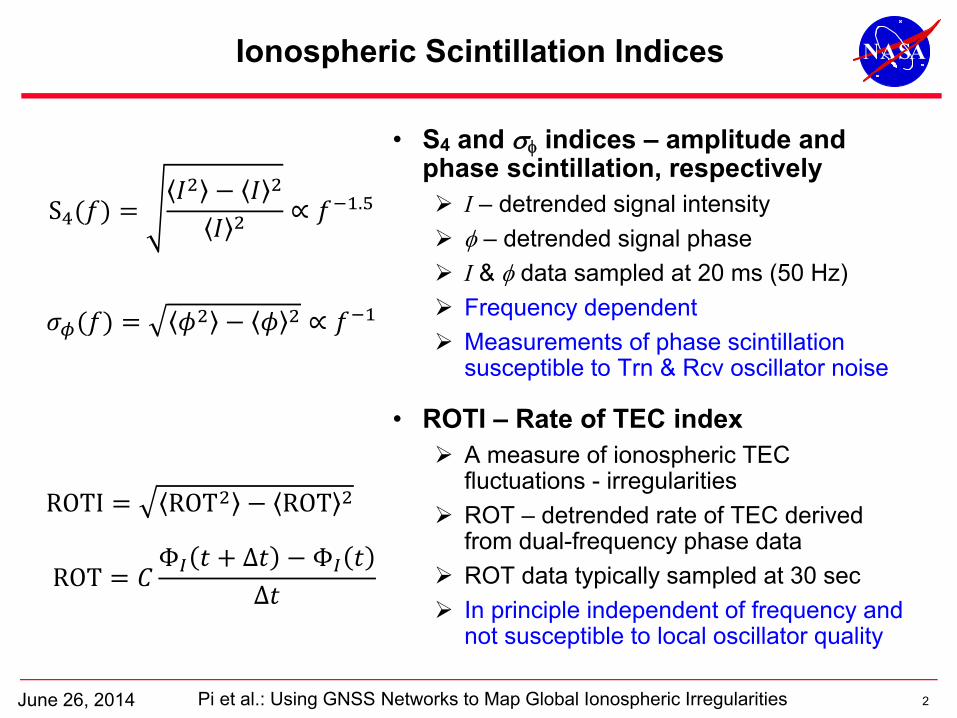
• S4 and indices – amplitude and phase scintillation, respectively I – detrended signal intensity – detrended signal phase I & data sampled at 20 ms (50 Hz) Frequency dependent Measurements of phase scintillation
susceptible to Trn & Rcv oscillator noise
• ROTI – Rate of TEC index A measure of ionospheric TEC
fluctuations - irregularities ROT – detrended rate of TEC derived
from dual-frequency phase data ROT data typically sampled at 30 sec In principle independent of frequency and
not susceptible to local oscillator quality
∝
S ∝ .
ROTI ROT ROT
ROTΦ Δ Φ
Δ
3
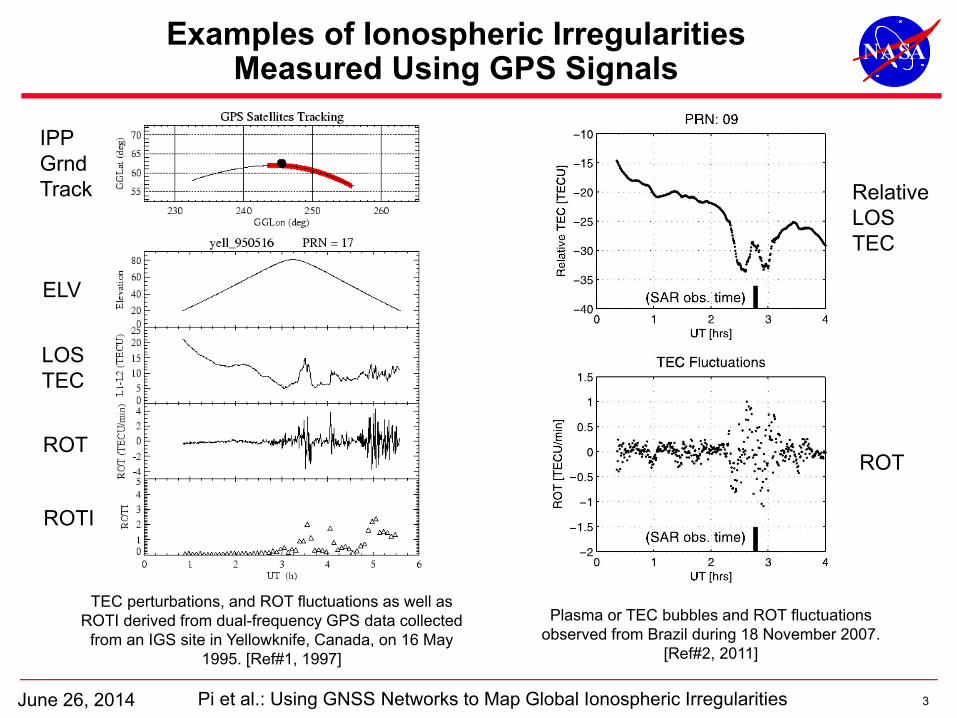
ANASExamples of Ionospheric Irregularities Measured Using GPS Signals
TEC perturbations, and ROT fluctuations as well as ROTI derived from dual-frequency GPS data collected
from an IGS site in Yellowknife, Canada, on 16 May 1995. [Ref#1, 1997]
Plasma or TEC bubbles and ROT fluctuations observed from Brazil during 18 November 2007.
[Ref#2, 2011]
June 26, 2014 Pi et al.: Using GNSS Networks to Map Global Ionospheric Irregularities
ELV
LOS TEC
ROT
ROTI
IPPGrndTrack Relative
LOS TEC
ROT
4
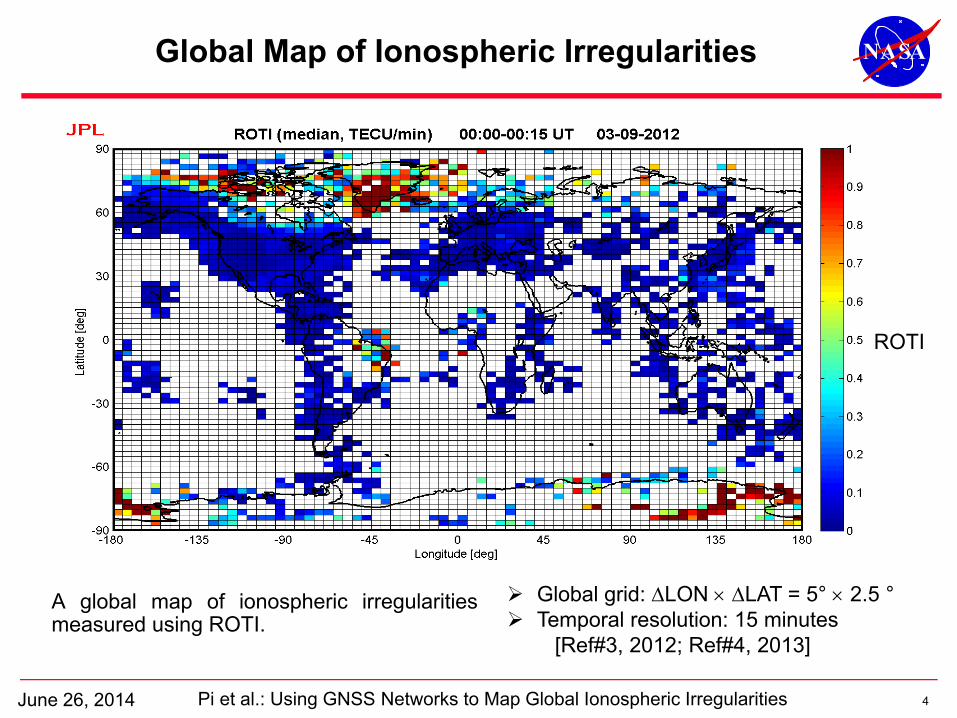
ANASGlobal Map of Ionospheric Irregularities
June 26, 2014 Pi et al.: Using GNSS Networks to Map Global Ionospheric Irregularities
A global map of ionospheric irregularitiesmeasured using ROTI.
Global grid: LON LAT = 5° 2.5 ° Temporal resolution: 15 minutes
[Ref#3, 2012; Ref#4, 2013]
ROTI
5
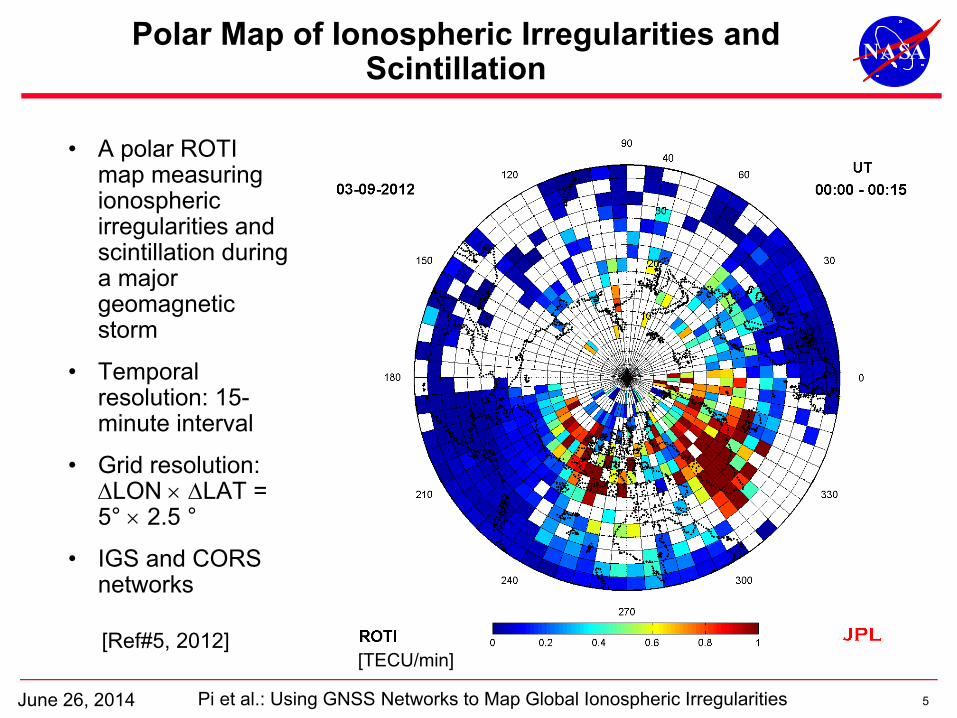
ANASPolar Map of Ionospheric Irregularities and Scintillation
June 26, 2014 Pi et al.: Using GNSS Networks to Map Global Ionospheric Irregularities
• A polar ROTI map measuring ionospheric irregularities and scintillation during a major geomagnetic storm
• Temporal resolution: 15-minute interval
• Grid resolution: LON LAT = 5° 2.5 °
• IGS and CORS networks
[Ref#5, 2012][TECU/min]
6
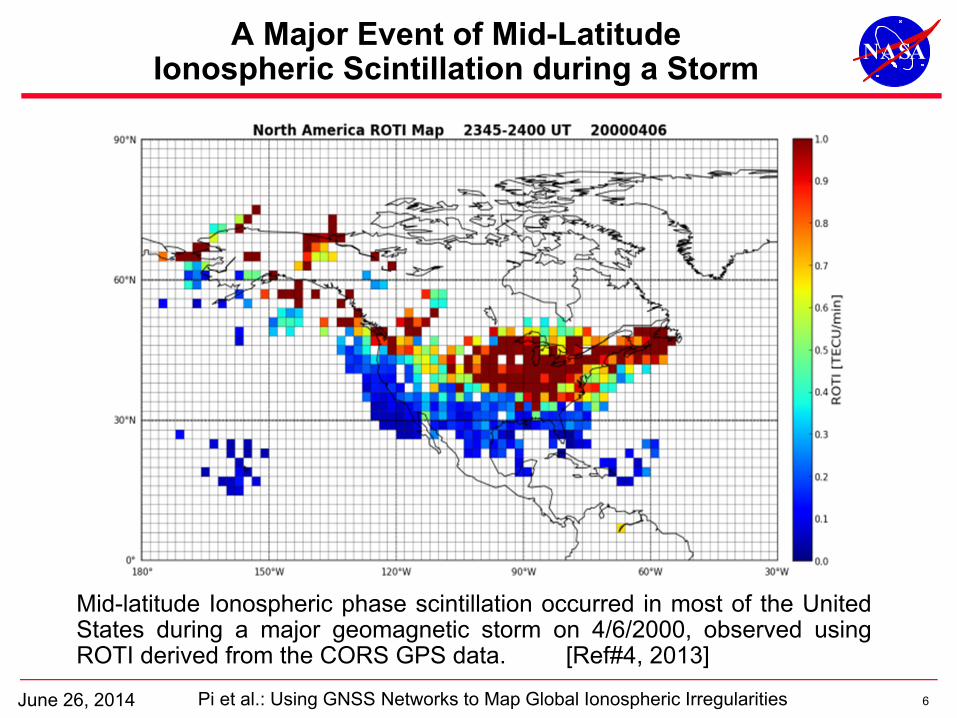
ANASA Major Event of Mid-Latitude Ionospheric Scintillation during a Storm
Mid-latitude Ionospheric phase scintillation occurred in most of the UnitedStates during a major geomagnetic storm on 4/6/2000, observed usingROTI derived from the CORS GPS data. [Ref#4, 2013]
June 26, 2014 Pi et al.: Using GNSS Networks to Map Global Ionospheric Irregularities
7
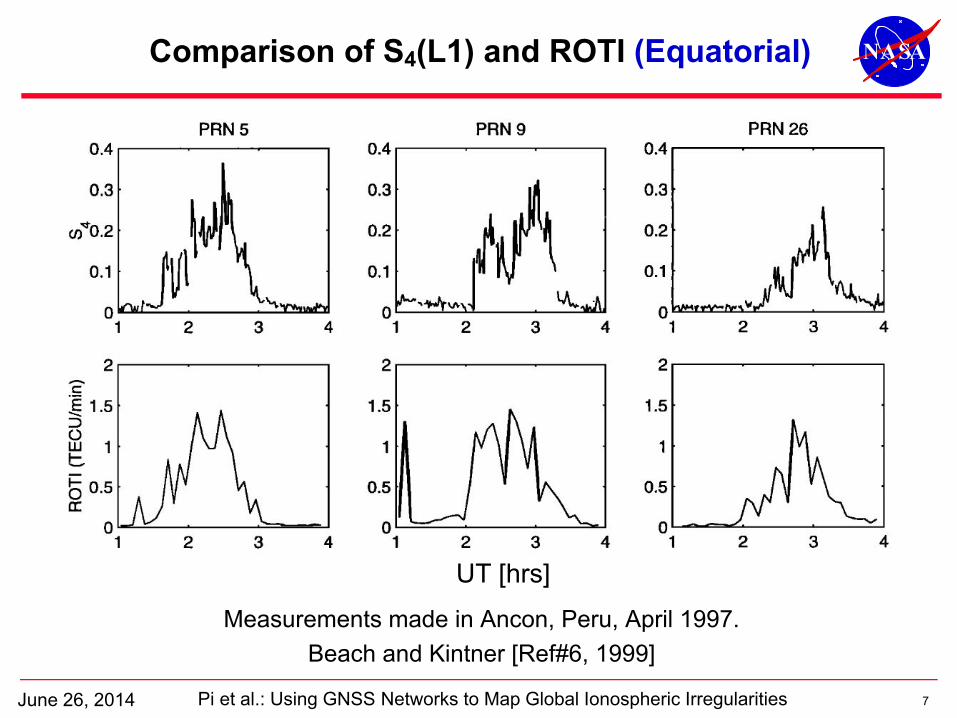
ANASComparison of S4(L1) and ROTI (Equatorial)
Measurements made in Ancon, Peru, April 1997. Beach and Kintner [Ref#6, 1999]
June 26, 2014 Pi et al.: Using GNSS Networks to Map Global Ionospheric Irregularities
UT [hrs]
8
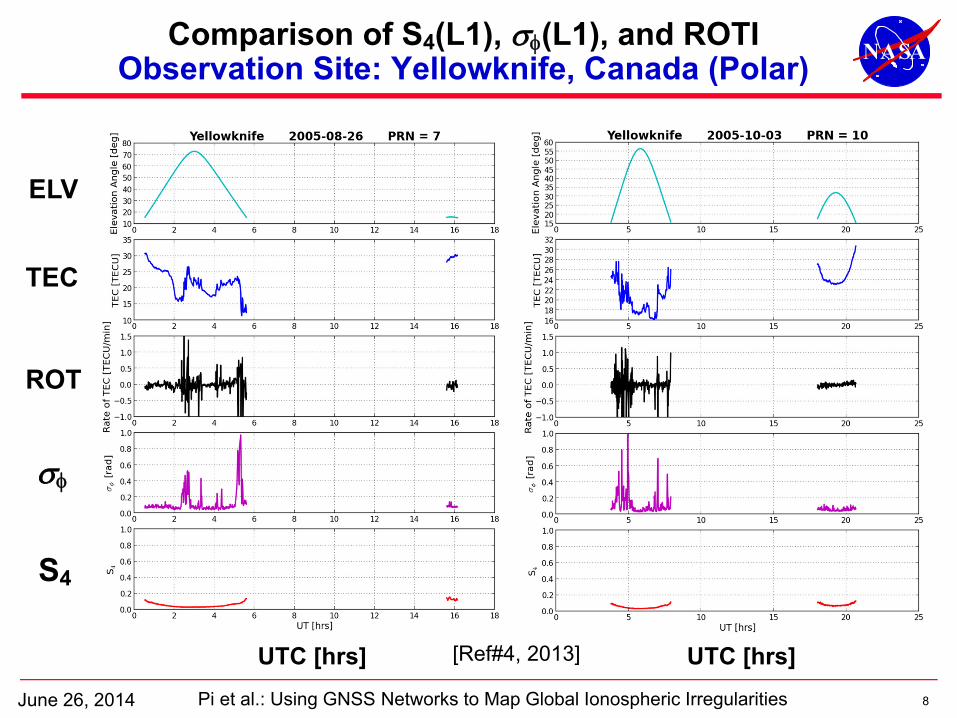
ANASComparison of S4(L1), (L1), and ROTIObservation Site: Yellowknife, Canada (Polar)
June 26, 2014 Pi et al.: Using GNSS Networks to Map Global Ionospheric Irregularities
S4
ROT
TEC
ELV
UTC [hrs] UTC [hrs][Ref#4, 2013]
9
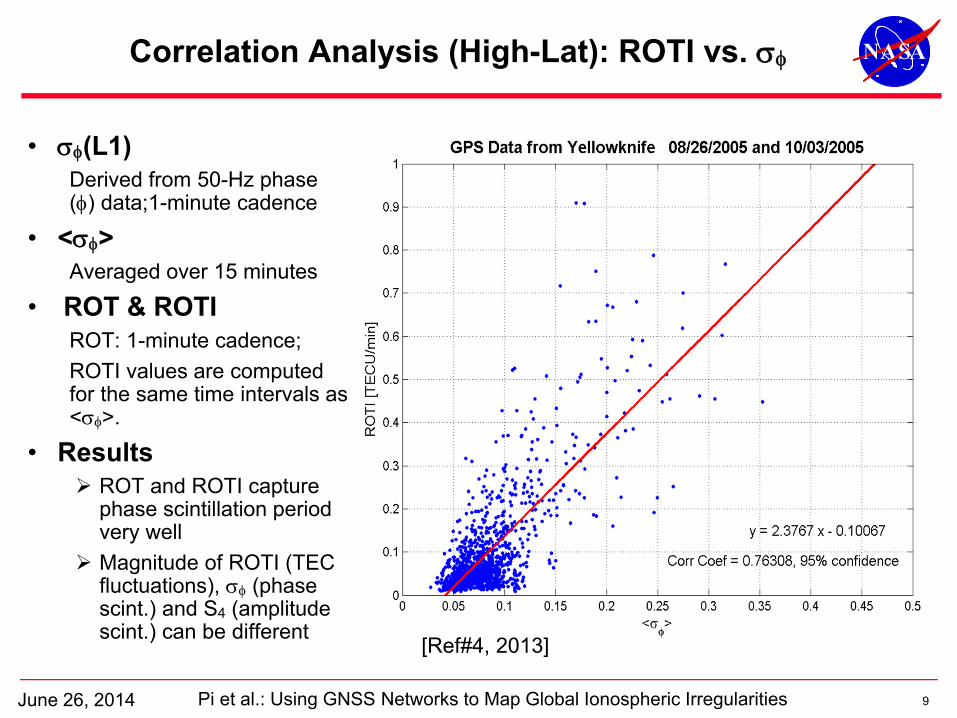
ANASCorrelation Analysis (High-Lat): ROTI vs.
June 26, 2014 Pi et al.: Using GNSS Networks to Map Global Ionospheric Irregularities
• (L1)Derived from 50-Hz phase () data;1-minute cadence
• <>Averaged over 15 minutes
• ROT & ROTIROT: 1-minute cadence;ROTI values are computed for the same time intervals as <>.
• Results ROT and ROTI capture
phase scintillation period very well
Magnitude of ROTI (TEC fluctuations), (phase scint.) and S4 (amplitude scint.) can be different [Ref#4, 2013]
10
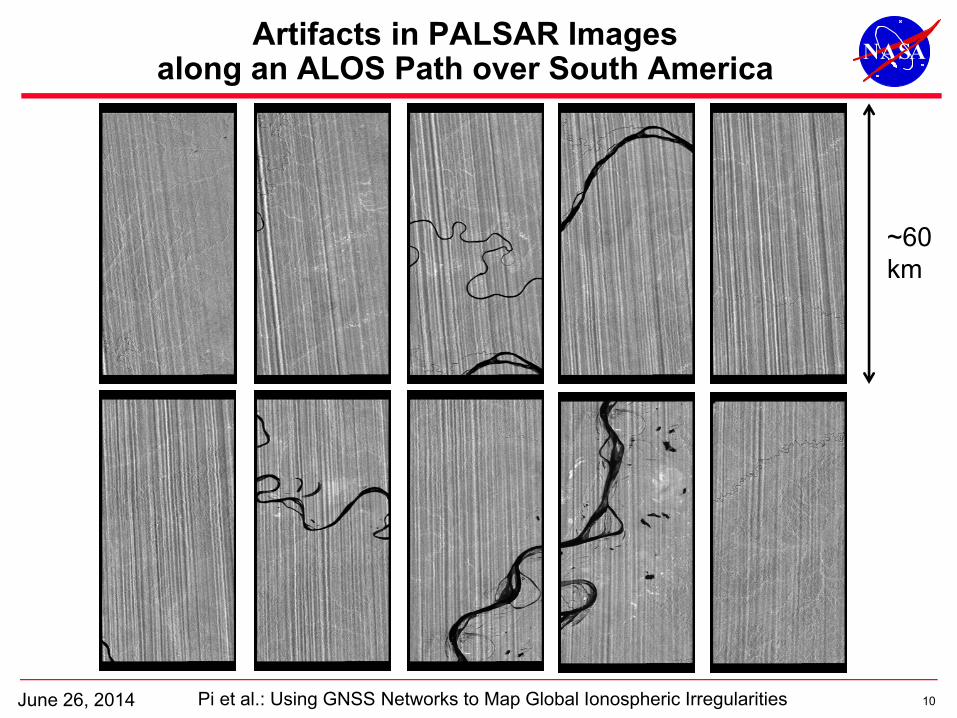
ANASArtifacts in PALSAR Images along an ALOS Path over South America
June 26, 2014 Pi et al.: Using GNSS Networks to Map Global Ionospheric Irregularities
~60 km
11
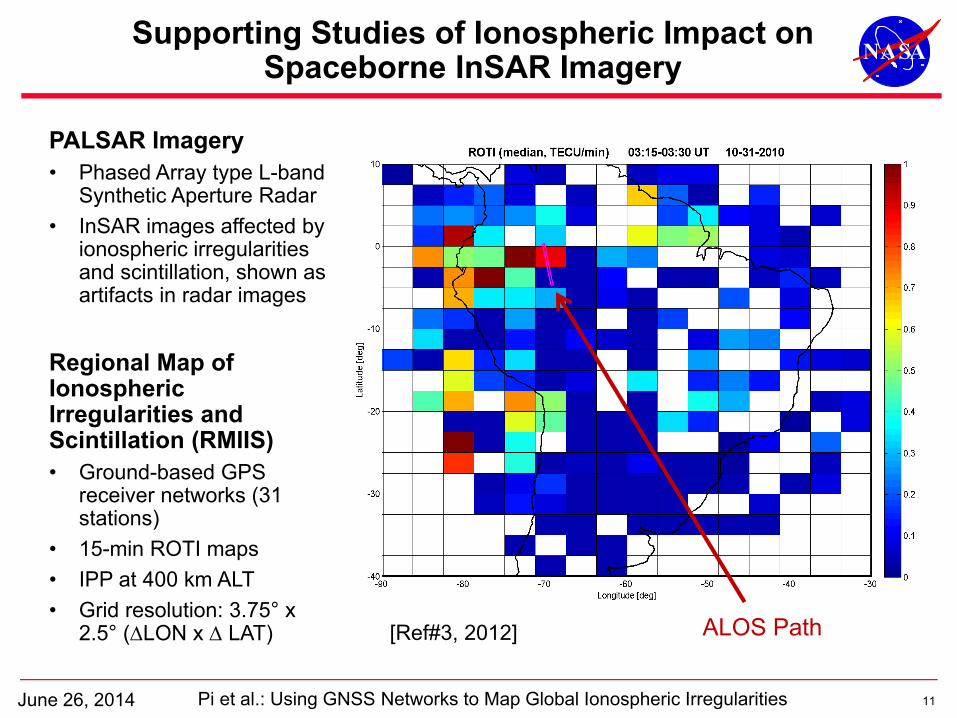
ANASSupporting Studies of Ionospheric Impact on
Spaceborne InSAR Imagery
June 26, 2014 Pi et al.: Using GNSS Networks to Map Global Ionospheric Irregularities
PALSAR Imagery• Phased Array type L-band
Synthetic Aperture Radar• InSAR images affected by
ionospheric irregularities and scintillation, shown as artifacts in radar images
Regional Map of Ionospheric Irregularities and Scintillation (RMIIS)• Ground-based GPS
receiver networks (31 stations)
• 15-min ROTI maps • IPP at 400 km ALT• Grid resolution: 3.75° x
2.5° (LON x LAT) ALOS Path[Ref#3, 2012]
12
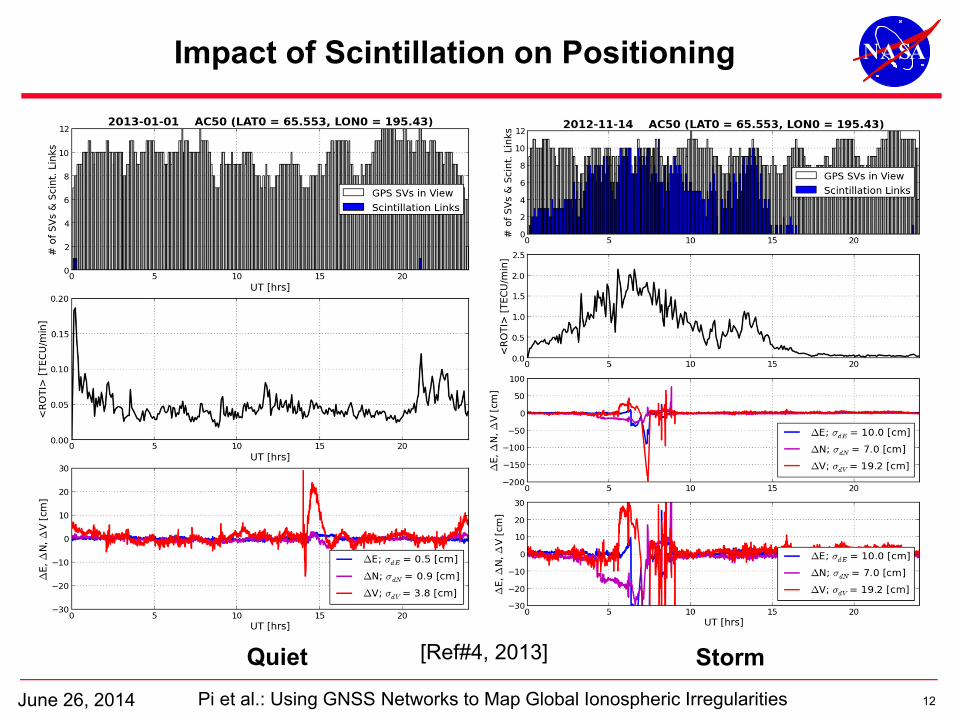
ANASImpact of Scintillation on Positioning
June 26, 2014 Pi et al.: Using GNSS Networks to Map Global Ionospheric Irregularities
Quiet Storm[Ref#4, 2013]
13
ANASSummary
• Dual-frequency GPS phase data collected from existing GNSS networks have been used to derive ROT and ROTI measurements
• Analyses by various groups have shown that ROTI is a good occurrence indicator for L-band amplitude and phase scintillation, though their magnitudes can be different depending on plasma physics processes and radio propagation environment in different latitude regions
• ROTI maps have been applied to monitoring global and regional activities of ionospheric irregularities with a 15-min temporal resolution continuously A significant event of irregularities and phase scintillation occurred in most of the
contiguous United States and Alaska under space weather disturbances has been recorded using ROTI maps
• The GPS-based ionospheric irregularity measurements have been applied to various studies, including the impact of ionospheric scintillation on Earth science remote sensing imagery and GPS-based positioning
• Real-time ROTI maps have been tested at JPL, and U.S. regional real-time ROTI maps will soon be made available to the public to serve space weather monitoring and prediction
June 26, 2014 Pi et al.: Using GNSS Networks to Map Global Ionospheric Irregularities
14
ANASReferences
1. Pi, X., A. J. Mannucci, U. J. Lindquister, and C. M. Ho, Monitoring of global ionospheric irregularities using the worldwide GPS network, Geophys. Res. Lett, Vol.24, No.18, pp.2283-2286, 1997.
2. Pi, X., A. Freeman, B. Chapman, P. Rosen, and Z. Li (2011), Imaging ionospheric inhomogeneities using spaceborne synthetic aperture radar, J. Geophys. Res., 116, A04303, doi:10.1029/2010JA016267.
3. Xiaoqing Pi, Franz J. Meyer, Kancham Chotoo, Anthony Freeman, Ronald G. Caton, and Christopher T. Bridgwood, Impact of Ionospheric Scintillation on Spaceborne SAR Observations Studied Using GNSS, ION GNSS, pp.1998-2006, 2012.
4. Xiaoqing Pi, Anthony J. Mannucci, Bonnie Valant-Spaight, Yoaz Bar-Sever, Larry J. Romans, Susan Skone, Lawrence Sparks, and G. Martin Hall, Observations of Global and Regional Ionospheric Irregularities and Scintillation Using GNSS Tracking Networks, ION Pacific PNT, pp.752-761, 2013.
5. Xiaoqing Pi, Measuring Ionospheric Irregularities globally by the Rate of TEC Index and GNSS Networks, Space Weather Workshop, Boulder, CO, April 27, 2012.
6. Beach, T.L. and Kintner, P.M. (1999). Simultaneous Global Positioning System observations of equatorial scintillations and total electron content fluctuations. Journal of Geophysical Research 104: doi: 10.1029/1999JA900220. issn: 0148-0227.
June 26, 2014 Pi et al.: Using GNSS Networks to Map Global Ionospheric Irregularities