using inquiry and tree-thinking to march through the … article using inquiry and tree-thinking to...
TRANSCRIPT

CURRICULUM ARTICLE
Using Inquiry and Tree-Thinking to “March Throughthe Animal Phyla”: Teaching Introductory ComparativeBiology in an Evolutionary Context
James J. Smith & Kendra Spence Cheruvelil
Published online: 30 July 2009# Springer Science + Business Media, LLC 2009
Abstract Biodiversity was originally taught in our Intro-ductory Organismal Biology course at Michigan StateUniversity (LB144; freshman/sophomore majors) by rotememorization of isolated facts about organisms. When wemoved to an inquiry-based laboratory framework to improvepedagogy, an unfortunate and unforeseen result was the lossof much of our study of biodiversity. In this paper, wedescribe the restructuring of LB144 to restore the study ofbiodiversity and organismal groups while retaining thebenefits of an inquiry-based approach. The curricularintervention was accomplished through the creation andimplementation of a four-week Comparative Biology labo-ratory stream. During this stream, student research teamsrecorded and organized observations that they made on arange of organisms and analyzed their data in a phylogeneticframework. During the stream, our students worked througha set of exercises designed to help them learn how to read,interpret, and manipulate phylogenetic trees. We placedparticular emphasis on the concept that phylogenetic treesare hypotheses of relationship that can be tested withscientific data. This incorporation of phylogenies and
phylogenetic analysis, or “tree-thinking,” into our students’work provided an explicit synthetic evolutionary frameworkfor their comparative biodiversity studies. End-of-streamproducts included a team phylogenetic analysis exercise andan individual comparative biology oral presentation.
Keywords Comparative biology . Evolution .
Inquiry-based approach . Introductory biology .
Phylogenetic analysis . Tree-thinking
Background
Biodiversity had been taught in our Introductory Organis-mal Biology course (LB144) for majors at Michigan StateUniversity (MSU) by rote memorization of isolated factsabout organisms in the virtual absence of a syntheticevolutionary framework. Students came into the laboratory,observed a set of specimens (mainly preserved in jars) thatrepresented the taxa of the week, drew pictures of them,and then memorized as many facts as possible about eachspecimen and its taxonomic group. This happened week-inand week-out for ten weeks, covering the range ofeukaryotic taxa. One week, students would learn that whiskferns are homosporous, while the next week they wouldlearn that snails undergo torsion, and the next week thatechinoderms have holoblastic cleavage. All of theseactivities culminated in a laboratory practical exam.Students indicated via written comments on course evalua-tions that satisfaction with this lab sequence was very low.Scores on the lab practical were also low, and our sense wasthat the students who succeeded on this exam did so bybrute force memorization as opposed to deep learning.
One of the first changes we made to improve the LB144lab experience was to move to an inquiry-based instruc-
J. J. Smith (*) :K. S. CheruvelilLyman Briggs College, Michigan State University,East Holmes Hall,East Lansing, MI 48825, USAe-mail: [email protected]
J. J. SmithDepartment of Entomology, Michigan State University,201 CIPS,East Lansing, MI 48824, USA
K. S. CheruvelilDepartment of Fisheries and Wildlife, Michigan State University,13 Natural Resources Building,East Lansing, MI 48824, USA
Evo Edu Outreach (2009) 2:429–444DOI 10.1007/s12052-009-0156-x

tional model (see Colburn 2000). During fall semester2002, we adopted the “Teams and Streams” model oflaboratory instruction (Wilterding and Luckie 2002). Usingthis model, students work in the lab in “teams” of three tofour students. These research teams worked on inquiry-based projects (“streams”) of four to six weeks duration. InLB144, we developed one stream that focused on ecology,a second on genetics, and a third on developmentalbiology.
Unfortunately, this curricular change resulted in the lossof much of the basic study of organismal biodiversity thathad previously formed a major focus of the course. Thisphenomenon is apparently not unique to our course, asMcGlynn (2008) points out that this loss of biodiversitycurricula is occurring in many places. So we asked, “howcan we teach biodiversity in an inquiry-based framework?”We also wondered how we could do this without re-introducing the “passion-killing” activities, such as “drawwhat you see,” during which students spent most of theirtime making superficial drawings of organisms they lookedat either in jars of preservative or on prepared slides under amicroscope.
The answer we came up with was to use phylogeneticanalysis as the framework for one of our lab streams. Therehas been a strong movement recently to incorporate the useof phylogenetic trees to interpret evolutionary relationships,or “tree-thinking,” into undergraduate biology education(Baum et al. 2005). A tree-thinking perspective can betaught as an element of evolution training at all levels andmakes sense as an underlying framework for all biology.After all, a primary objective for this course is for ourstudents to understand why it is that, “Nothing in biologymakes sense except in the light of evolution” (Dobzhansky1973).
We hypothesized that tree-thinking in the context ofcomparative biology would help our students understandand gain a better appreciation of natural history and theevolution of biodiversity. Several prominent scientists (e.g.,Futuyma 1998; Grant 2000; Wilson 2000) have made pleasfor stronger organismal training of college biology students(see McGlynn 2008). Therefore, we worked to provide ourstudents with the foundation with which to understandorganisms and how the environments in which they livehave shaped them over evolutionary time.
This new LB144 lab stream, which we named the“Comparative Biology” stream, was derived from what hadbeen the Developmental Biology stream. Specifically, wecreated a lab stream such that students would study andcompare organisms in the context of other, relatedorganisms with respect to their anatomy, morphology,physiology, and development. The Comparative Biologystream was designed to help students understand that (1)organismal diversity represents the result of an evolutionary
process, (2) many shared characters among organisms (e.g.,developmental, morphological) are present because groupsof organisms are related to each other (i.e., they share acommon ancestor), and (3) phylogenies represent hypoth-eses of evolutionary relationships. We addressed theseobjectives by instituting curricular changes to teach ourstudents about organisms, not in a vacuum, but in a richphylogenetic and evolutionary context.
In this paper, we describe the development and imple-mentation of the Comparative Biology laboratory streamthat we created for our Introductory Organismal Biologycourse. We describe the instructional elements that com-prise the stream, our experiences with the implementationof the lab stream as part of our course, and a preliminaryexamination of its effects on student understanding andappreciation of organismal biology. We end with additionalideas for how the stream could be modified in the futureand a description of our ongoing efforts to quantify theimpact of these instructional activities on student learning.
Our Course and the Context of the Curricular Change
Lyman Briggs Introductory Organismal Biology (LB144) isa four-credit course with a total enrollment of 90–140students per semester. Approximately 10% of the LB144students are non-majority students. The majority of thestudents in LB144 are from suburban and rural Michigan.About half of our students take LB144 as freshmen, andhalf as sophomores. Our students come to us with a rangeof biology backgrounds. Many students have not had abiology course since ninth grade, while others have had twoto three years of high school biology, and some have eventaken Advanced Placement Biology.
LB144 is taught on a rotational basis by four LBCbiology professors who share basic pedagogical views anda commitment to high teaching and learning standards.LB144 students attend two 80-minute lectures per week anda single three-hour session that serves as a combinedrecitation and lab. The lecture meets as a single section inwhich we employ a “bookends” instructional model(Johnson et al. 1998), with mini-lectures of ten to15 minutes interspersed with small group exercises,individual writing, personal response pad questions, orother active/collaborative learning activities.
The combined recitation/lab meets in five or six sectionswith 18–24 students in each section. Lab sessions arestaffed by a LB professor or a graduate Teaching Assistant(TA), plus two undergraduate learning assistants. Studentsin the labs work in teams of three to four students, yieldingsix to eight research teams per lab section. This model leadsto a very favorable student/instructor ratio, especially whenthe research team is considered to be the student unit.
430 Evo Edu Outreach (2009) 2:429–444

In the LB144 lab, student teams work on three four- tosix-week investigations, or streams. During a typicalsemester, an LB144 student team will complete an ecology,genetics, and comparative biology stream, each with theirown end product. At the beginning of the first stream of thesemester (often ecology during the fall and genetics duringthe spring), students learn about scientific reasoning,hypothesis formulation, and experimental design andstatistical analyses. For the ecology stream, students deviseand carry out an independent research project. Studentspresent the results of their work at a poster session thatmimics a professional scientific meeting. The geneticsstream focuses on the study of sex-linked genes inDrosophila and Mendelian ratios in Wisconsin Fast Plants.Student teams write up their results in the format expectedfor a manuscript being considered for publication in ascientific journal.
Before the advent of the comparative biology stream(below), the third stream was a developmental biologystream, during which the students examined developmentalsequences of sea urchins and the Japanese medaka andcarried out a research project on regeneration in eitherplanaria or blackworms. The end result of this stream wasthe construction of a web site. The regeneration researchprojects were problematic on several levels, as was web siteconstruction. These, as well as some of the elementsmentioned above (e.g., lack of study of organisms per se),were the elements of the lab that we sought to change bydeveloping the comparative biology stream.
The Comparative Biology Laboratory Stream
Overview of the Stream
The new comparative biology lab stream was designed tolast four weeks (however, see “Future Prospects andConclusions” for modifications that can alter this timeline).Week one engages the students in an exploration ofdifferent animals, how we might study their similaritiesand differences in an organized way, and how these patternsare a result of evolutionary relationships as depicted byphylogenetic trees. These activities allow us to explore theidea of phylogenies as hypotheses of evolutionary relation-ship. During weeks two and three, student teams make aseries of observations, both at the gross scale and the microscale (using dissecting and compound microscopes, respec-tively), of live and preserved animals representing nineanimal phyla that form the basis of their study. Theseobservations include the dissection of four representativeorganisms. Teams record their observations in tabular formand supplement their observations with information avail-able from literature sources. During week four, we conclude
the stream with a team exercise that requires students to usetheir tabulated observations to demonstrate an understand-ing of phylogenies as hypotheses of relationship. Inaddition, each student gives a short oral presentationdescribing one aspect of his/her own animal explorations.
Learning Goals
We had two overarching goals for the comparative biologystream:
1. Introduce students to the natural history of animalgroups by describing their basic features and naminga representative of each of the following nine animalphyla (and to be aware that there are other phyla):Porifera, Cnidaria, Platyhelminthes, Nematoda, Anne-lida, Mollusca, Arthropoda, Echinodermata, andChordata.
2. Help budding biologists to understand evolution byapplying a phylogenetic (tree-thinking) approach thatuses phylogenetic trees as testable hypotheses ofevolutionary relationships within and between groupsof organisms.
In addition, we wanted to provide students withopportunities to use technology (e.g., digital photomicro-scopy, MS PowerPoint) and practice effective oral commu-nication skills.
Descriptions of the Lessons
Below we describe, in general, the lessons and activitiesthat comprise the Comparative Biology stream. Detailedlesson plans and links to selected examples of student workare available in Appendices 1 and 2, respectively.
An Introductory Phylogeny Exercise in Lecture One of ourmajor instructional goals for LB144 is to mesh the lecturesand labs so that they work together to create a singlelearning experience. Therefore, we prepared our studentsfor the comparative biology laboratory stream duringlecture with a lesson that included a brief introduction tophylogenies and tree-thinking. This lesson was followed byan active learning exercise that allowed students to practiceworking with these concepts and allowed us (the teachingteam) to assess their level of understanding.
One of the key ideas we try to get our students tounderstand in LB144 is that biology is an experimentalscience, and not just a collection of facts. Thus, we beganthe lecture with the concepts of a phylogeny as a hypothesisof evolutionary relationships and of a phylogenetic tree as auseful visualization tool to represent these hypothesizedrelationships (Fig. 1). We emphasized to the students thatwe can build phylogenies and trees using morphological,
Evo Edu Outreach (2009) 2:429–444 431

developmental/embryological, and/or life history features,and that it is now common to use molecular biology (e.g.,DNA sequences) to make inferences about phylogeneticrelationships. We also emphasized that every phylogenyrepresents a hypothesized answer to the questions, “Whichof the taxa being studied share relatively recent commonancestors? Which share relatively distant ancestors?”
As a hypothesis, every phylogeny can then be evaluatedon the basis of evidence (i.e. what is the evidence in favorof or against a particular phylogenetic tree?). Afterpracticing how to read phylogenetic trees, including apresentation of material on how relative time is incorporat-ed into a phylogenetic analysis, we discussed ways toevaluate alternative hypotheses (trees). This discussionincluded mapping characters onto trees (where a particularcharacter state would have evolved or been lost on a tree)and using the Principle of Parsimony (i.e. the simplest tree,with the fewest number of evolutionary events, is morelikely to be the correct tree) to choose between twocompeting hypotheses (Fig. 1). By the end of this lesson,the students were primed to actively explore these ideas andassess their understanding of phylogenies.
We ended this portion of the class with an active learningexercise that had students work both individually and witha partner to evaluate alternative hypotheses of evolutionaryrelatedness using hypothetical molecular data. This exerciseuses three trees (Fig. 2, trees I, II, & III) that depictrelationships between four hypothetical species (Fig. 2 A–D). Our goals for this exercise were for the students tounderstand and practice evaluating alternative hypotheses(trees) and for us to assess their level of understanding.
This lecture and in-class exercise nicely set the stage forthe comparative biology lab stream that was to begin laterthat week. The students were introduced to phylogenies ashypotheses of evolutionary relationships and the ways thatphylogenetic trees are constructed and evaluated using
scientific data. This knowledge, along with the experiencethe students gained during the active learning exercise, leddirectly into the first week’s comparative biology labactivities that had students collect and organize scientificdata in order to think about similarities and differencesamong organisms and use scientific data to evaluatealternative hypotheses (trees). In addition, the active learningexercise’s use of molecular data to evaluate alternative treeswas a nice complement to the lab activities that usemorphological, developmental, and life history data toevaluate alternate hypotheses of evolutionary relationship.
Introductory Exercises in the Lab We began week one ofthe comparative biology stream with an engagement
Fig. 1 Alternative hypotheses for the relationships of a set of vertebratetaxa, used to introduce students to the principle of parsimony as appliedto phylogenetic analysis. In the two trees shown, we illustrate theconcept by showing students that the bony skeleton is hypothesized tohave arisen once in tree 1, while tree 2 requires two separateevolutionary origins of this character state. Students are subsequently
given an exercise in which they are challenged to count the number ofevolutionary changes in each of two trees, and then decide which of thetwo trees is a better phylogenetic hypothesis. Graphic illustrationadapted with permission from the University of California’s Under-standing Evolution Web Site (http://evolution.berkeley.edu/evolibrary/article/0_0_0/phylogenetics_08)
A B C D A B CDA B DC
Tree I Tree II Tree IIISpecies:
GAncestral base
for all 7 sites:
A B C D CDA B DC
Tree I Tree II Tree IIISpecies:
G G GAncestral base
for all 7 sites:
a
17 7
56
2 34
GAAGAGGD
TAAGGAGC
GGGAGGGB
TGGGGGAA
7654321
GAAGAGGD
TAAGGAGC
GGGAGGGB
TGGGGGAA
7654321
Sites in DNA sequence
b
Fig. 2 Graphic illustrations used in an active learning exercise inlecture during which students evaluate alternative evolutionaryhypotheses (adapted from Campbell and Reece 2002). a Trees I–IIIshow different evolutionary relationships between four hypotheticalspecies (A–D); b states for seven molecular characters for the fourspecies. Tree I is marked with eight labeled horizontal lines thatrepresent evolutionary changes in these seven characters (i.e., DNAbase changes)
432 Evo Edu Outreach (2009) 2:429–444

exercise. An array of living and preserved organisms(Table 1) was scattered throughout the lab at differentworkstations (see Online Supplemental Materials for thecomplete week one lesson plan in Appendix 2). Our goalwas to have the students discover how to build and use ataxon/characteristic state matrix. Microscopes were provid-ed and students were instructed to spend a total of20 minutes observing the 18 organisms that were ondisplay. In addition, students were instructed to take notes,listing any observations and/or questions that their teamhad. Once the observation session was complete, thestudent teams put their observations into a logical frame-work in the form of a data table. We helped them by asking,“What will you use as rows? Columns? (Why?)” We thendebriefed the exercise with a short in-class discussionduring which we highlighted contrasting ways to arrangethe data collected using the organisms.
Next, we took advantage of and adapted two publishedstudies that used inquiry and phylogeny in the biologyclassroom (Singer et al. 2001; Giese 2005). Singer et al.(2001) introduced the concepts of a characteristic table,cladistic analysis, and character conflict and demonstratedhow to use these concepts to compare competing phyloge-netic hypotheses. The authors were inspired in part by the
work of Bilardello and Valdés (1998), whose article onbuilding phylogenies showed how doing a phylogeneticanalysis provides practice in critical thinking, strengthensstudents’ logical and mathematical abilities, and strengthenstheir problem-posing and problem-solving skills. Giese(2005) described a classroom exercise during which studentteams were given “incorrect” phylogenies for a number oftaxa for which they had available fully articulated skel-etons. Students were then challenged to find skeletalevidence to reject each hypothesis, using “If-Then” reason-ing. We fused aspects of these exercises from Singer et al.(2001) and Giese (2005) to create our own exercise thatallowed students to practice making and testing alternativephylogenies.
For this exercise, we provided student teams with fullyarticulated skeletons and bone keys from each of the fivetaxa that were the focus of Singer et al. (2001; Fig. 3).Student teams were challenged to study the five skeletonsand make informal comparisons by noting similarities anddifferences between them. Student teams were then provid-ed with a table containing characters of each of the five taxa(Table 2), asked to find three to four characters (one perperson) that could be used to group taxa together to theexclusion of other taxa and challenged to see if they could
Table 1 Laboratory organisms studied in the Comparative Biology stream
Scientific name Common name Phylum Live/preserved Engagement Phylogeneticcomparison
Scypha sp. Sponge Porifera Preserved specimen; prepared slides X X
Gonionemus sp. Gonionemus Cnidaria Preserved specimen X
Hydra sp. Hydra Cnidaria Live specimen X X
Hexagonaria percarinata Petoskey stone Cnidara Fossil X
Dugesia tigrina Planarian Platyhelminthes Live specimen; prepared slides X X
Dipylidium caninum Dog tapeworm Platyhelminthes Preserved specimen X
Ascaris lumbricoides Roundworm Nematoda Preserved specimen for dissection; preparedslides
X X
Nereis succinea Clamworm Annelida Preserved specimen X
Lumbricus terrestris Earthworm Annelida Live specimen; preserved specimen for dissection X X
Romalea sp. Grasshopper Arthropoda Preserved specimen for dissection X X
Gromphadorhinaportentosa
Hissingcockroach
Arthropoda Live specimen X
Cambarus sp. Crayfish Arthropoda Preserved specimen for dissection X
Anodonta sp. Freshwatermussel
Mollusca Preserved specimen for dissection X X
Loligo pealei Squid Mollusca Preserved specimen X
Pisaster sp. Sea star Echinodermata Live specimen; Preserved specimen X X
Eupentacta sp. (?) Sea cucumber Echinodermata Live specimen X
Strongylocentrotus sp. Sea urchin Echinodermata Live specimen X
Branchiostoma sp. Lancelet Chordata Preserved specimen; whole mount X X
Rattus rattus Rat Chordata Preserved specimen X
Also indicated is whether the organism was used as a live or prepared specimen and whether or not it was used in the engagement exercise (weekone) and/or the phylogenetic comparison (weeks two to four)
Evo Edu Outreach (2009) 2:429–444 433

discover additional characters on their own by usinginformation on each animal available through the Univer-sity of Michigan Museum of Zoology’s Animal DiversityWeb (http://animaldiversity.ummz.umich.edu/site/index.html). Finally, students were asked to reflect on whichcharacters in the dataset they thought might be most usefulfor evaluating phylogenetic hypotheses, taking into consid-eration the animals’ physiology (e.g., Does it feed the fetusvia a placenta?), behavior (e.g., Is it a social animal?), andecology (e.g., Is it an aquatic animal?).
The capstone experience for week one was for thestudents to compare two arbitrarily chosen trees of the 15possible rooted trees for these five taxa (Fig. 4). We firstasked the students to convince themselves that only 15
rooted phylogenies are possible for five taxa (with opossumas the outgroup), and that one of these must be the truephylogeny. Students were guided in this lab activity towardsdeveloping an argument based on the characters in theirtable, and/or any characters that they had discovered byobserving the skeletons. Student teams worked together toanalyze the evolution of the set of characters in their table foreach phylogenetic tree. Based on this analysis, they thenexplained to the class which of the two phylogenies theythought was a better hypothesis. This exercise nicely linkedwith the active learning exercise conducted earlier in theweek during lecture (above; Fig. 1) and provided studentsmore practice using scientific data to evaluate differentphylogenetic trees as alternative hypotheses.
a. Opossum d. Cat
b. Dog e. Rabbit
c. Rat
Fig. 3 Photographs of the skel-etons of the opossum (a), dog(b), rat (c), cat (d), and rabbit(e). These skeletons were usedby the students to explore thebasis of characters and helplearn how to build and interpreta taxon/character state matrix
434 Evo Edu Outreach (2009) 2:429–444

Observations and Dissections During weeks two and threeof the comparative biology stream, students collected datafrom a set of ten organisms representing nine animal phyla.These lessons, which involved observations on all tenorganisms and four key dissections (roundworm, earth-worm, crayfish, and grasshopper), were adapted from LabTopics 17 & 18 in Morgan and Carter (2005). We found thedissection guides presented in Morgan and Carter (2005) tobe particularly useful. These two lab topics were includedin their entirety in the LB144 lab book that each studentwas required to purchase for the course. In the laboratoryitself, each of the student research teams also had availablea brief guidebook to the ten animals that they werestudying, consisting of selected pages from Elson (1982)and Rust (1983). In addition, we assigned a pair of ourundergraduate learning assistants in the course to take thelead on each of the four dissections by preparing a briefguide for the students to follow and demonstrating thedissection to the whole teaching team prior to lab.
During these two lab weeks, student teams observedeach of the ten animals both visually, to see grossanatomical features, and with dissecting microscopes toobserve finer structural detail. For each animal observed,the teams took a set of photographs to document observa-tions using microscopes equipped with digital cameras. Forsome animals, students were also provided with preparedmicroscope slides that were also used for observation viadigital photomicroscopy (e.g., the planarian, the round-worm, and the earthworm). The use of digital photo-microscopy provided a simple way for students to recorddata from their organismal observations. By encouraging
students to record data according to their own interpreta-tions of what was important, we hoped to provide a senseof ownership of their animal investigations.
A casual observer may have come away from observingthese two weeks thinking that our students simply did thelabs in Morgan and Carter (2005). For example, duringthese two weeks of observations, the student teams filledout a summary table adapted from Table 18.1 in Morganand Carter’s text (Table 3). However, we also included tree-thinking activities in our students’ investigations duringthese two weeks to get them thinking about their observa-tions in an evolutionary context (see Concluding Exercises,below).
Another major goal of the comparative biology streamwas to have student teams create an electronic notebookcontaining all of their observations of the ten animals. Thisnotebook took the form of a PowerPoint file that containedall of the student pictures taken during weeks two andthree. Each team was required to establish a collection offour to six slides per animal (some with multiple photos perslide). Each photo was annotated with labels, legends, andtext explaining what the specimen was, how it wasobserved (whole or mounted on a microscope slide), whattype of sectioning was used (whole mount, cross section,longitudinal section), and whether it was observed with adissecting or compound microscope (and at what totalmagnification). A link to an example of one such electronicnotebook is included in Appendix 2.
Concluding Phylogeny Exercises in Lab and Lecture Therewere two main activities during week four of the
Table 2 Table of characters observed in five mammals (adapted from Singer et al. 2001)
Character Opossuma Dogb Ratc Catd Rabbite
Placental − + + + +
Prehensile tail + − − − −Solitary lifestyle + − + + +/−f
No. of teeth 50 42 16 28 28
Large canine teeth + + − + −Large incisors − − + − +
Expanded metatarsals − + − + +
Hopping locomotion − − − − +
Instructions to students: Some characters are provided and scored for you, others you need to identify and score yourselves using the five mammalskeletons and keys (one character per person). You may also use the web sites below to collect additional natural history data on the organisms tohelp you evaluate the two hypotheses (phylogenetic trees)a http://animaldiversity.ummz.umich.edu/site/accounts/information/Didelphis_virginiana.htmlb http://animaldiversity.ummz.umich.edu/site/accounts/information/Canis_lupus_familiaris.htmlc http://animaldiversity.ummz.umich.edu/site/accounts/information/Rattus_rattus.htmld http://animaldiversity.ummz.umich.edu/site/accounts/information/Felis_silvestris.htmle http://animaldiversity.ummz.umich.edu/site/accounts/information/Oryctolagus_cuniculus.htmlf Variation within the group precludes categorizing rabbits as solitary or social
Evo Edu Outreach (2009) 2:429–444 435

comparative biology lab stream. First, student teams weregiven a team assignment called, “Mapping CharacteristicEvolution on Competing Phylogenies” to bring together theinformation collected during weeks two and three with thetechniques that they learned and practiced evaluatingevolutionary hypotheses (i.e., phylogenies) during weekone of the stream and during lecture. The idea was to havethe students use evidence that they themselves hadcollected to map characteristic evolution onto two phylog-
enies (Fig. 5) and to evaluate the relative strength of thetwo phylogenies, much as they had done in week one of thestream.
Second, each individual student was required to organizea set of two PowerPoint slides that would form the basis ofan oral presentation that they would give to the class duringweek four. Each of these slides included multiple photosthat demonstrated student understanding of how at leastthree of the animal phyla observed are similar and different.
Fig. 4 Fifteen possible phylo-genetic trees for rat, rabbit, dog,and cat, rooted with opossum asthe outgroup. Student teams aregiven two arbitrarily chosentrees and asked to use data todecide which of the two trees isa better hypothesis
436 Evo Edu Outreach (2009) 2:429–444

For example, a student might show how the respiratorysystem differs across three animal phyla and talk aboutwhat that means in a phylogenetic context. A link to a filecontaining examples of slides produced by LB144 studentsis included in Appendix 2. These presentations were tomimic those found at a scientific conference, allowingstudents to practice their oral communication skills. Inaddition, this exercise provided the students with theopportunity to demonstrate individual knowledge andunderstanding of the comparative biology concepts.
Implementation of the Stream and Assessmentof Student Learning
We implemented the comparative biology stream duringfall semester 2006 (F06) and spring semester 2007 (S07)using the instructional sequence described above. DuringF06, assessment of student learning in the comparativebiology stream included a lab quiz that had a questionabout mapping characters and mirrored the work thestudents had done with the skeletons during week one ofthe stream. In addition, the LB144 final exam included asection on comparative biology. One of the extendedresponse questions on this exam asked students to mapthe following characters onto a phylogenetic tree that hadphylum names as terminal taxa: (a) true tissues; (b) radialand bilateral symmetry; (c) acoelomate, pseudocoelomate,and eucoelomate body plans; and (d) protostome anddeuterostome embryological development. This exam ques-tion was almost identical to the question/task completed asa lab team during week four of the comparative biologystream (Fig. 5).
During S07, assessment of student learning included alab quiz. However, we also gave a stand-alone hour examthat included a section on comparative biology. Our (theteaching team’s) response to this exam was a sense that thestudents still did not “get it” with respect to mappingspecified characters onto morphology-based trees. Therefore,in preparation for the final exam, we prepared an AnimalProblem Study Guide that we handed out in class (not shown).We then asked the mapping question again on the final exam,but without the requirement to map the acoelomate, pseudo-coelomate, and eucoelomate body plans (Fig. 5).
Student learning of tree-thinking apparently was betterduring S07 than S06. On the F06 final exam, the studentsscored an average of 3.86/6.00 (±1.66), or 64.3%, on thecharacteristic-mapping question (Fig. 5); during S07, themean score was 4.45/6.00 (±1.76), or 74.2%. Amongthe possible reasons for the higher scores observed duringS07 than F06 are the extra coaching and the second chanceprovided the students (hour exam and the final exam), andthe easier question given on the final exam (not having toT
able
3Datatabletemplateforrecordingob
servations
ofanim
alcharacters
from
tenrepresentativ
esof
nine
anim
alph
yla(adapted
from
Table
18.1
inMorganandCarter20
05)
Animal
Sym
metry
(non
e,bilateral,
radial)
Tissues
(tissues
orno
t?Ifyes,
how
many
layers?)
Bod
ycavity
(pseud
o-coelom
ate,
acoelomate,
eucoelom
ate)
Digestio
n(intra-cellular,
oneop
ening,
twoop
enings)
Circulatory
system
(non
e,op
en,
closed)
Respiratio
n(e.g.,cell
mem
branes,
gills)
Locom
otion
(e.g.,
craw
ling,
swim
ming)
Sup
portsystem
(e.g.,
hydrostatic
skeleton
,exoskeleton)
Segmented
(yes
orno
)App
endages
(yes
orno
)Nervo
ussystem
(e.g.,
nervecells,
brain,
nerve
cord)
Spo
nge
Hyd
ra
Planarian
Rou
ndworm
Earthworm
Mussel
Crayfish
Grassho
pper
Sea
Star
Lancelet
Instructions
tostud
ents:Notethatforrespiration,
locomotion,
supp
ortsystem
,and
nervou
ssystem
,not
allop
tions
aregivento
you(w
eprov
idesomeexam
ples)andmorethan
oneop
tionmay
beneeded
tohave
thecorrectansw
er
Evo Edu Outreach (2009) 2:429–444 437

map acoelomate, pseudocoelomate, eucoelomate; Fig. 5).We also do not know if there were differences in the studentpopulations between the two semesters, whether additionalinstructional differences existed, or how well our assess-ment techniques accurately quantified student learning.
Our course evaluations at the end of the semester allowedus to obtain anecdotal student responses regarding thecomparative biology lab stream. Several students com-mented that they really enjoyed the dissections. Thiscomment makes sense given that many LB144 students areplanning careers in medicine. Another sentiment expressedwas that students appreciated the opportunity to demonstrateindividual knowledge through the PowerPoint presentations.
Although we have presented here an informal preliminaryanalysis of student learning, formal quantitative assessmentof student learning in the comparative biology stream isongoing. We created and employed a Phylogeny AssessmentTool to assess prior knowledge (Pre-test) and learningoutcomes (Post-test), and collected data from approximately200 LB144 students during fall semester 2008. Data analysesare in progress and will form the basis of a separatemanuscript (Smith and Cheruvelil, in preparation).
Future Prospects and Conclusions
We have presented here a four-week lab module supple-mented by lecture activities and assessment, focusing
mainly on the comparative morphology of animal groups.However, these materials can be adapted to fit other focusareas or groups. For example, we have incorporated anadditional lab week into our own comparative biologystream, between weeks two and three, during whichstudents compare embryological development in seaurchins, frogs, and the Japanese medaka. Results fromsome of these observations are included in the OnlineSupplemental Materials (see Appendix 2).
This laboratory stream could be adapted to plant systems,protists, fungi, and/or bacteria, and plants may be particularlywell suited for this set of exercises. Plants have goodmorphological and developmental features that can be usedin phylogenetic analysis; there is a good fossil record of plantevolution; and the phylogenetic relationships of the majorplant groups are well supported by data. Alternatively, anothersimple way to incorporate plants into the lab stream would beto use an array of plant specimens instead of animals in theengagement exercise during week one of the stream.
There are some ways in which the lab stream could bemodified and/or extended to deepen student understandingof evolution as an organizing principle. For example, oncestudents become familiar with phylogenies and phyloge-netic analysis, it should be possible to use phylogenies as aframework for advanced exercises in later parts of theorganismal biology laboratory course, with students usingphylogenies to test developmental, ecological, and/orevolutionary hypotheses. However, given some of the
Fig. 5 Phylogenetic tree showing the hypothesized relationships fornine animal phyla. a Inferred from morphological and developmentalcharacters (based on Freeman 2005, Figure 31.10); b inferred frommolecular characters (based on (Freeman 2005), Figure 31.13). In aclosed book laboratory exercise, students are asked to map each of threecharacters onto each of these two trees. The characters are: (1) bodycavity (acoelomate, pseudocoelomate, or eucoelomate), (2) number of
opening to the digestive tract (one or two), and (3) segmented body (yesor no). As part of a lecture exam, students are asked to map each of fourcharacters onto tree (a). The characters are: (1) body cavity (acoelomate,pseudocoelomate, or eucoelomate; the question asked on the FinalExam during S07, for which we have data, omitted asking about bodyplans), (2) embryological development (protostome or deuterostome),(3) true tissues, and (4) symmetry (radial or bilateral)
438 Evo Edu Outreach (2009) 2:429–444

constraints of the introductory biology laboratory curricu-lum, these advanced exercises may be more appropriate forinclusion as laboratory components in upper divisioncourses in ecology, developmental biology, and evolution-ary biology.
From a tree-thinking perspective, Novick and Catley(2007) showed that students have an easier time correctlyinterpreting phylogenetic trees that are not “ladderized.”The trees that we have used in the exercises discussed inFigs. 1, 2, and 5 are shown as ladders (slanted cladograms),and in future offerings of the LB144 comparative biologystream, we plan to modify these exercises by incorporatingrectangular cladograms into them.
Another positive change would be to take more timeduring the lab stream for students to reflect on their learningthrough the use of pre-class quizzes and their studentelectronic notebooks. For example, we could use a pre-quizsuch as one from The Tree-thinking Challenge (Baum et al.2005) to help set the context during our introductoryphylogeny lecture and provide students with a chance toreflect on their own understanding during and after theactive learning exercise. We could also expand the use ofthe electronic notebooks by asking students to describe howtheir thinking has changed by virtue of carrying out this setof exercises.
Finally, it would be worthwhile to figure out how toincorporate molecular phylogenetic trees into the mix in ameaningful way. This is not a trivial problem. The standardtree that we used in our test questions is “parsimonious”with respect to the morphological features and develop-mental patterns of organisms typically taught in undergrad-uate biology. Unfortunately, a series of phylogeneticanalyses of DNA sequences beginning in the late 1980s(Field et al. 1988) showed convincingly that this “mostparsimonious’ solution is not correct, and that morpholog-ical and developmental evolution in this group of organismshas occurred in a non-parsimonious fashion. Conveyingthis idea without causing student confusion is a majorchallenge. One idea might be to start the students on asmaller-scale exercise than the one we now do in the lab(Table 3; Fig. 5). Such an exercise could start with a series oforganisms and a tree for which parsimonious morphologicalphylogeny appears to be accurate, but is not supported bymolecular characters (nucleotide or amino acid characters).This exercise would illustrate the point that morphologydoes not always evolve in a parsimonious manner andprovide a way to explore homoplasy and the nature ofmolecular evidence, without interference from the poten-tially overwhelming set of data collected from the nineanimal phyla.
An additional problem arising from the construction ofphylogenies from molecular data is that students are oftenencouraged to use similarity-based arguments to group
organisms together. On the surface this is OK, and it doestend to give the “correct answer.” However, from a“learning about the nature and practice of science”standpoint, this may not be such a good idea. In thecomparative biology lab stream just described, we workvery hard to help students understand that when twophylogenies are under consideration, they represent explic-it, testable, alternative hypotheses of evolutionary relation-ship that can be evaluated with data (Avise 2004). This isthe real strength of the character state approach, and otherphylogenetic approaches do not lend themselves quite aseasily to such a rich interpretive framework.
Phylogenies and phylogenetic analysis are powerfultools for helping students understand evolution. The useof phylogenetic trees to interpret evolutionary relationships,or tree-thinking, has the potential to provide a syntheticevolutionary framework for biodiversity studies in under-graduate biology courses. This evolutionary framework isessential if we really want biology to “make sense” to ourstudents. Training in natural history is also very importantfor our students’ biology education, and many are findingthat this type of training is more and more difficult toprovide. Phylogenies can help in this instance because theycan help put the study of organisms into an inquiry-basedframework. The comparative biology lab stream that wehave presented here builds upon the work of others to bringtogether tree-thinking and comparative biology of animalsto help students understand animal biodiversity in anevolutionary framework and in an inquiry-based fashion.
Acknowledgments We thank Dr. Sue Hill (MSU Zoology) forinitial discussions and support for the curricular change. Also, thanksto Lyman Briggs undergraduate students Parita Shah, Phil Timko,Lauren Doherty, and Courtney Ford, who participated in an Honorsoption in LB144 during spring 2006 when we laid the groundwork formuch of the curricular change. We thank Lyman Briggs undergraduatestudents Sara Steslicki, Jake Carpenter, Nick Vito, Ryan DasGupta,Theresa Seitz, Megan Swiss-Schuster, Eliisa Bojanic, Lisa Rousseau,Lauren Priniski, Krystal Krejcik, Victoria Roney, Cassie Martin, GregKlein, Samantha Steffen, Ashley Lee, Lyndsey Wessendorf, ZhanaeSeaton, Szymon Zahel, Molly Brown, Alex Hartenstein, and KurtManuel for allowing us to share the results of their hard work inLB144. We thank LB student Lindsay Hatter for taking the photo-graphs of the skeletons used in Fig. 3. We heartily thank the LBundergraduate learning assistants and graduate TAs, especially AliciaBray and Kristi Zurawski, who worked with us to implement anddebug the comparative biology stream. We also thank two anonymousreviewers for constructive suggestions and comments.
Appendix 1. Materials Needed, Laboratory Setups,and Detailed Lesson Plans for Each of the Four Weeksof the Comparative Biology Stream
(NOTE: Included here are the lesson plans that were usedto teach this four-week-long lab stream. If you would like
Evo Edu Outreach (2009) 2:429–444 439

any of the instructional materials that were used, or if youhave any questions about any aspect of the stream and itsimplementation, please contact one of the authors.)
Overview of the Comparative Biology Lab Stream
1. Teaching team note: an introduction to phylogenyshould occur in class (lecture) prior to this lab stream,and all members of the teaching team should befamiliar with the main topics (below) and as a groupshould discuss the animal phylogenetic trees (includingdifferences between the ones based mainly on molec-ular vs. morphological characters).
2. Main topics
(a) Comparative morphology(b) Phylogenetic analysis(c) Taxonomic classification
3. Major activities
(a) Phylogenetic analysis of five mammals based onskeletal features
(b) Comparative biology (morphology) and phylogenet-ic analysis of animals representing nine animal phyla
(c) PowerPoint archives and presentations
4. Major products and homework assignments (pleasenote that we use many of the exercises as ungraded(stamped) learning experiences, but this approach couldeasily be altered)
(a) Research team
& The Little Phylogenetic Analysis: five mam-mals based on skeletal features
& Thorough PowerPoint of comparative mor-phology for archival and grading purposes
& The Big Phylogenetic Analysis: nine animalphyla based on morphological features (Notethat this exercise can be completed eitherindividually or as a team assignment.)
(b) Individual
& PowerPoint presentation that demonstratesunderstanding of morphological comparisonsacross the animal phyla
Week One
a. Materials Needed for Week One
1. Array of organisms for observation in the engagementexercise (see Table 1)
2. Dissecting microscopes as necessary for observations
3. Digital cameras for photomicroscopy (as desired)4. Computers with MS PowerPoint and photo editing
software5. Fully articulated skeletons of opossum, rabbit, rat,
cat and dog and keysb. Lab Setup for Week One
1. Set up the 18 organisms (see Table 1) at variousstations around the lab.
2. Set up the fully articulated skeletons and keysaround the lab.
3. Set up dissecting scopes with digital cameras andcomputers.
c. Lesson Plan—Comparative Biology (CB) Week One
Today’s Activities
& Engagement with and exploration of animals in ninephyla (30 min)
& As a team, spend 20 minutes observing and takingnotes on the organisms on display. Also, list anyobservations and/or questions that your team has.
& Goal: Put your observations into a logical frameworkin the form of a data table. (Students will need tothink about and get help on how to do this (what arerows and columns, and why?)). Encourage eachgroup to think about which characters are discrimi-nating for comparison (depends on taxa) and pointout that our goal is to discover (make an inferenceabout) shared ancestry.
& Product: data table. Check and stamp each datatable in lab.
& Spend 10 minutes debriefing—share contrastingways to organize the organisms with the class,make sure that they get to a “taxa by characters”table.
& Phylogenetic analysis of five mammals based onskeletal features—interpreting and evaluating phylog-enies (60 min)
& Start with a ppt slide of phylogenetic tree fromGiese paper (Fig. 1a in (Giese 2005)—overview ofhow tree is developed, what it shows, and that it is ahypothesis (this example is of an incorrect tree)
& Work through the tree with the students using “If,then, therefore” progression: If the tree is correct,then one of two things must have happened withregard to a particular character (e.g., hair). It couldhave either evolved independently two times ondifferent branches (not likely), or the evolution ofthat trait preceded the most recent common ancestorof all taxa with that characteristic. However, by usinga tree with a misplaced trait, we can then show that ifthis is the case, then that trait would have had to have
440 Evo Edu Outreach (2009) 2:429–444
been subsequently lost multiple times (on differentbranches), which is also unlikely. Therefore, thehypothesis itself seems unlikely, at least in regard tothis particular trait. Ask questions like “how do weknow that the cat is in the wrong place?”
& Point out the locations of the five skeletons and keys(rat, rabbit, cat, dog, and opossum (outgroup)).Provide each student team with a handout showingthe 15 possible resolved trees with the opossum asthe outgroup (Fig. 4). Assign each team with twotrees hypothesizing different phylogenetic relation-ships for the five taxa.
& Learning Goal: Students will use data (observations)that they record from the skeletons, plus otherinformation that they know/find out about thebiology of the taxa (from www and in table wesupply), to argue why they think the data support ordo not support each of their two given hypotheses(phylogeny).
& Instructions to students:
○ Study the five skeletons and make informalcomparisons by noting similarities and differencesbetween them. Each team should then find three tofour characters (one per person) that can be used togroup taxa together to the exclusion of other taxa.Use the keys to the skeletons to assist your team infinding out what the different bones are and formaking your comparisons. Devise a way to scoreyour character (define character states) for each ofthe five taxa.
○ Provide the students with Table 2 that combinesTable 3 from Singer et al. (2001) and info that canbe found on provided web links to the naturalhistory information for each of the five animals(Michigan Biodiversity Web). Student teams willfill in this table by incorporating the three to fourcharacters that they found by examining theskeletons and others from the www pages.
○ Student teams should reflect on which charactersof the data set they think might be useful forevaluating phylogenetic hypotheses. Among thesecould be characters of the animals’ physiology(Does it feed the fetus via a placenta?), behavior(Is it a social animal?) and/or ecology (Is it anaquatic animal?).
○ Student teams should test their two alternativehypotheses based on whether species share derivedcharacters. You may give more weight to charactersthat your research team thinks will be more usefulfor discriminating between the alternative evolu-tionary hypotheses. Include the physiological, be-havioral, and ecological characters in your tests. Use
the “If, then, therefore” reasoning demonstratedearlier.
○ As a team, write a paragraph that summarizes yourwork. Defend your preferred hypothesis and justifyeach node/branch of this phylogenetic tree. Haveyour paragraph stamped and initialed by your TA.
○ Products: data table (Table 2), alternative hypoth-eses with branches/groupings marked that aresupported by evidence and written paragraph.
& Spend 15 minutes debriefing—Have each grouppresent the two trees that they evaluated on anoverhead transparency. Each group should indicatewhich of the two trees they think is better supportedby data, and what evidence can be used to supportthe tree they prefer and why (concentrating on whythe other is wrong).
& Making a power point presentation (30 min)
○ Do a demo showing the students the basics of howto maneuver in MS PowerPoint (see Appendix 2for links to examples of student work).
○ Have each team start their PowerPoint by making atitle slide and inserting the animals’ common andscientific names into a blank slideshow.
○ Every week, each team will add materials to theirPowerPoint.
○ Product: Before each team leaves lab, have aninstructor check that their slideshow has been startedand that it has been saved in the appropriate place.
Week Two
A. Materials Needed for Week Two
1. The following animals for observation and/or dissec-tion (Table 1):
(a) Scypha sp. (Sponge; Phylum Porifera)(b) Hydra sp. (Phylum Cnidaria)(c) Dugesia tigrina (Brown Planarian; Phylum
Platyhelminthes)(d) Ascaris lumbricoides (Roundworm; Phylum
Nematoda); Dissection(e) Lumbricus terrestris (Earthworm; Phylum Anne-
lida); Dissection2. Dissecting supplies: pans, pins, and scalpels, gloves,
watch glasses, dissection “guidebook,” waste bag3. Dissecting and compound microscopes as necessary
for observations4. Digital cameras for photomicroscopy with appropri-
ate computer software for image capture5. Computers with MS PowerPoint and photo editing
software
Evo Edu Outreach (2009) 2:429–444 441
B. Lab Setup for Week Two
1) Set up dissecting and compound scopes with digitalcameras and computers.
2) Provide enough dissecting supplies for each teamto have two dissections going on at a time.
C. Lesson Plan—Comparative Biology Week Two
Today’s Activities
& PowerPoint presentation by instructor introducingmain topics (20–30 min)
○ Introduction to Comparison of Morphological,Developmental, and Life History Features inNine Animal Phyla (Table 1) using laboratoryobservation and guided dissections to comparekey organisms representing different phyla—five animals this week, five next week.
○ Wewill look at each animal with respect to a set of11 characteristics (Table 3)—discuss each char-acter a little within a phylogenetic context (e.g.,When did the body cavity likely appear on a treeof animals?).
& Lesson on “How To Dissect” for the Roundwormand the Earthworm
○ What are the tools?○ How do we prep the animals?○ How should we cut and pin the animals?○ What should we be looking for?
& Using laboratory observation and guided dissectionsto compare key organisms representing differentphyla (two to two and one-half hours; Table 4)
○ For each of the animals that we observe and/ordissect, each research team needs to take a set offour (minimum) to six (preferable) digital photo-micrographs that summarizes the features of thatorganism.
○ The data and the observations that each teammakes should be used to complete the appropriateparts of the data table (Table 3).
○ Each of the photomicrographs should be incorpo-rated into your PowerPoint file, and supported bylabels, legends, and text that will allow peoplelooking at the pages to understand what it is thatthey are looking at (or for). Remember that youwill need to be able to compare morphology/systems across phyla, so take/document picturesaccordingly.
○ Products: Before each team leaves lab, an instructorshould check Table 3 and the PowerPoint forprogress made.
Week Three
A. Materials Needed for Week Three
1. The following preserved animals for observationand/or dissection (Table 1):
(a) Anodonta sp. (Freshwater Mussels; PhylumMollusca)
(b) Cambarus sp. (Crayfish; Phylum Arthropoda);Dissection
(c) Romalea sp. (Grasshopper; Phylum Arthro-poda); Dissection
(d) Pisaster sp. (Sea Star; Phylum Echinodermata)(e) Branchiostoma sp. (Lancelet; Phylum Chordata)
2. Dissecting supplies: pans, pins, and scalpels, gloves,watch glasses, dissection “guidebook,” waste bag
3. Dissecting and compound microscopes as necessaryfor observations
4. Digital cameras for photomicroscopy with appropri-ate computer software for image capture
5. Computers with MS PowerPoint and photo editingsoftware
B. Lab Setup for Week Three
1. Set up dissecting and compound scopes with digitalcameras and computers.
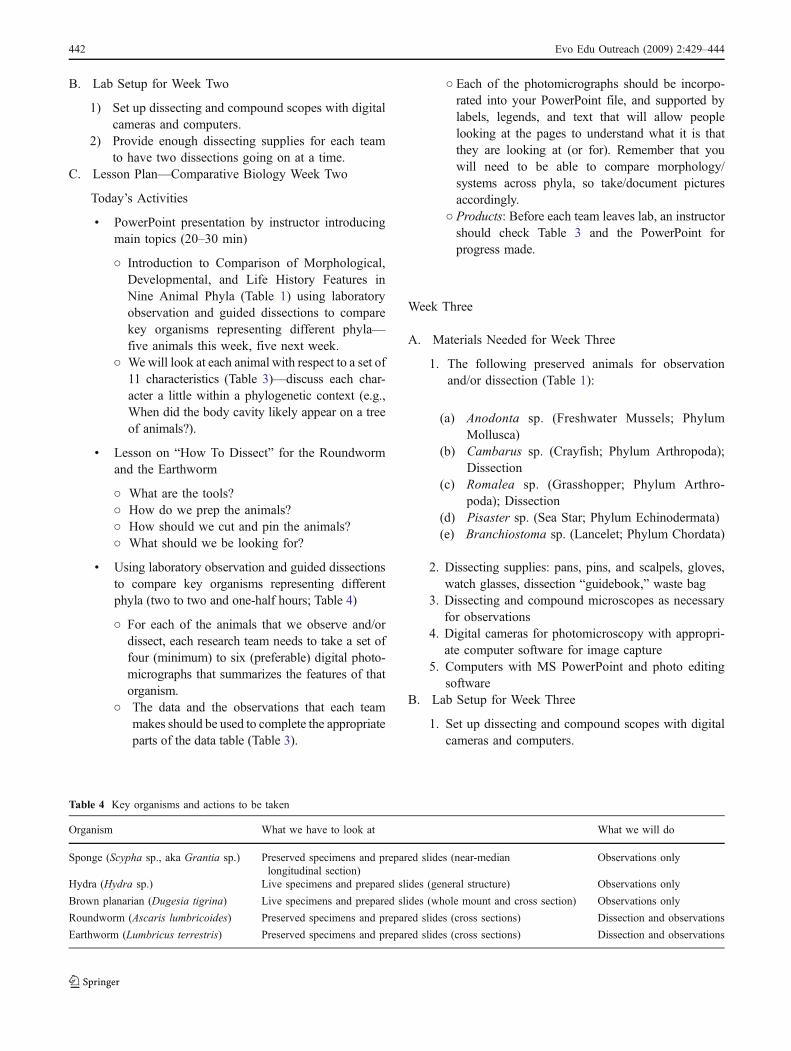
Table 4 Key organisms and actions to be taken
Organism What we have to look at What we will do
Sponge (Scypha sp., aka Grantia sp.) Preserved specimens and prepared slides (near-medianlongitudinal section)
Observations only
Hydra (Hydra sp.) Live specimens and prepared slides (general structure) Observations only
Brown planarian (Dugesia tigrina) Live specimens and prepared slides (whole mount and cross section) Observations only
Roundworm (Ascaris lumbricoides) Preserved specimens and prepared slides (cross sections) Dissection and observations
Earthworm (Lumbricus terrestris) Preserved specimens and prepared slides (cross sections) Dissection and observations
442 Evo Edu Outreach (2009) 2:429–444

2. Provide enough dissecting supplies for each team tohave two dissections going on at a time
C. Lesson Plan—Comparative Biology Week Three
Today’s Activities
& PowerPoint presentation by instructor introducingmain topics (20–30 min)
○ Continuation of Comparison of Morphological,Developmental, and Life History Features inNine Animal Phyla (Table 1) using laboratoryobservation and guided dissections to comparekey organisms representing different phyla—fiveanimals last week, five this week.
○ Reinforce the major features we are looking forin each animal (Table 3) and that they should bethinking within a phylogenetic context.
○ Remind the students what they should be tryingto accomplish in their work: dissecting thepreserved animals, and making observations onpreserved animals and prepared slides.
○ Look ahead—communicate expectation for:
■ PowerPoint file—complete file to be uploadedto course website before the beginning of labnext week, see Online Supplemental Materialsfor more details of the Assignment.
■ PowerPoint presentation—bring your compara-tive slides to lab next week for your presenta-tions, see Online Supplemental Materials inAppendix 2 for more details of the Assignment.
■ Big phylogeny exercise—this exercise can becompleted either individually or as a team.Either way, students should be reminded torevisit their notes from class and lab in terms ofhow to evaluate alternative trees. It is especiallyimportant to remind the students to revisit theskeleton exercise from week one of the CBstream and for the instructor to go over the mostcommon mistakes/misconceptions studentteams had from this exercise. Remind them tomap characters, to include a clear key, and todiscuss which tree is better supported andWHY.
& Lesson on “How To Dissect” for the Grasshopperand the Crayfish
○ What are the tools?○ How do we prep the animals?○ How should we cut and pin the animals?○ What should we be looking for?
& Using laboratory observation and guided dissectionsto compare key organisms representing differentphyla (two to two and one-half hours; Table 5)
○ For each of the animals that we observe and/or dissect, each research team needs to take a setof four (minimum) to six (preferable) digital photo-micrographs that summarizes the features of thatorganism.
○ The data and the observations that each team makesshould be used to complete the appropriate parts ofthe data table (Table 3).
○ Each of the photomicrographs should be incorporatedinto your PowerPoint file, and supported by labels,legends, and text that will allow people looking at thepages to understand what it is that they are looking at(or for). Remember that you will need to be able tocompare morphology/systems across phyla, so take/document pictures accordingly.
○ Products: Before each team leaves lab, an instructorshould check Table 3 and the PowerPoint forcompletion (Table) progress made (PowerPoint).
Week Four
A. Materials Needed for Week Four
1. Computer with MS PowerPoint, overhead projec-tor, and screen
B. Lab Set-up for Week Four
1. Set up lab with screen, projector, and computer forstudent presentations
Table 5 Key organisms and actions to be taken
Organism What we have to look at What we will do
Freshwater mussel (Anodonta sp.) Preserved specimens and prepared slide (gill cross-section) Observations only
Grasshopper (Romalea sp.) Preserved specimens Dissection and observations
Crayfish (Cambarus sp.) Preserved specimens Dissection and observations
Sea Star (Pisaster sp.) Dissected preserved specimens and prepared slides Observations only
Lancelet (Branchiostoma sp.) Preserved specimens and prepared slides Observations only
Evo Edu Outreach (2009) 2:429–444 443

C. Lesson Plan—Comparative Biology Week Four
Today’s Activities
& No PowerPoint presentation by instructor; loadstudent presentations on computer.
& Each group should present together, but eachstudent presents their two comparison slides indi-vidually, talking for three to five minutes about theanimals in a phylogenetic context.
Appendix 2. Brief Descriptions of and Links to StudentWork Available as Online Supplemental Materials
1. Electronic notebook (PowerPoint file) made by astudent team in LB144 F06. In fall semester 2006,the student notebook took the form of a PowerPointfile that contained all of the student pictures takenduring weeks two and three. Each team of threestudents was required to establish a collection of fourto six slides per animal (some with multiple photosper slide), with annotation. The linked file representsone of the best of the student notebooks: http://www.msu.edu/user/jimsmith/evoo1.ppt
2. Electronic notebook (PowerPoint file) made by stu-dents in LB144 F08. In fall semester 2008, eachindividual student was required to organize a set oftwo slides that would form the basis of an oralpresentation that they would give to the class duringweek four. Each of these PowerPoint slides was toinclude multiple photos that demonstrated studentunderstanding of similarities and differences in at leastthree of the animal phyla that were studied: http://www.msu.edu/user/jimsmith/evoo2.ppt
References
Avise JC. Molecular markers, natural history, and evolution. Sunder-land: Sinauer Associates; 2004.
Baum DA, Smith SD, Donovan SSS. Evolution: the tree-thinkingchallenge. Science. 2005;310:979–80.
Bilardello N, Valdés N. Constructing phylogenies. Am Biol Teach.1998;60:369–73.
Campbell NA, Reece JB. Biology. 6th ed. Menlo Park: Benjamin/Cummings; 2002.
Colburn A. An inquiry primer. Sci Scope. 2000;23:42–4.Dobzhansky T. Nothing in biology makes sense except in the light of
evolution. Am Biol Teach. 1973;35:125–29.Elson LM. The zoology coloring book. New York: Harper-Collins;
1982.Field KG, Olsen GJ, Lane DJ, Giovannoni SJ, Ghiselin MT, Raff EC,
et al. Molecular phylogeny of the animal kingdom. Science.1988;239:748–53.
Freeman S. Biological science. 2nd ed. Upper Saddle River: Pearson/Prentice Hall; 2005.
Futuyma DJ. Wherefore and whither the naturalist? Am Nat.1998;151:1–6.
Giese AR. Using inquiry and phylogeny to teach comparativemorphology. Am Biol Teach. 2005;67:412–7.
Grant PR. What does it mean to be a naturalist at the end of thetwentieth century? Am Nat. 2000;155:1–12.
Johnson DW, Johnson R, Smith K. Advanced cooperative learning.3rd ed. Edina: Interactive Book; 1998.
McGlynn TP. Natural history education for students heading into thecentury of biology. Am Biol Teach. 2008;70:109–11.
Morgan JG, Carter MEB. Investigating biology. 5th ed. New York:Pearson/Benjamin Cummings; 2005.
Novick LR, Catley KM. Understanding phylogenies in biology: theinfluence of a Gestalt perceptual principle. J Exp Psychol Appl.2007;13:197–223.
Rust TG. A guide to biology lab. 3rd ed. San Antonio: SouthwestEducational; 1983.
Singer F, Hagen JB, Sheehy RR. The comparative method, hypothesistesting & phylogenetic analysis—an introductory laboratory. AmBiol Teach. 2001;63:518–23.
Wilson EO. On the future of conservation biology. Conserv Biol.2000;14:1–3.
Wilterding JH, Luckie DB. Increasing student-initiated active learningwith investigative “streams:” a molecular biology example. J CollSci Teach. 2002;31:303–7.
444 Evo Edu Outreach (2009) 2:429–444