using naviance data to drive college & career readiness
TRANSCRIPT

Using Naviance Data to Drive
College & Career Readiness
Krystal Ferguson
K-12 Program Director
Agenda
Overview of Data Driven
Decision Making
What, Why, & How
Focusing on Outcomes
Building a Data Culture
Overview of Data Driven
Decision Making
DDDM
D3M
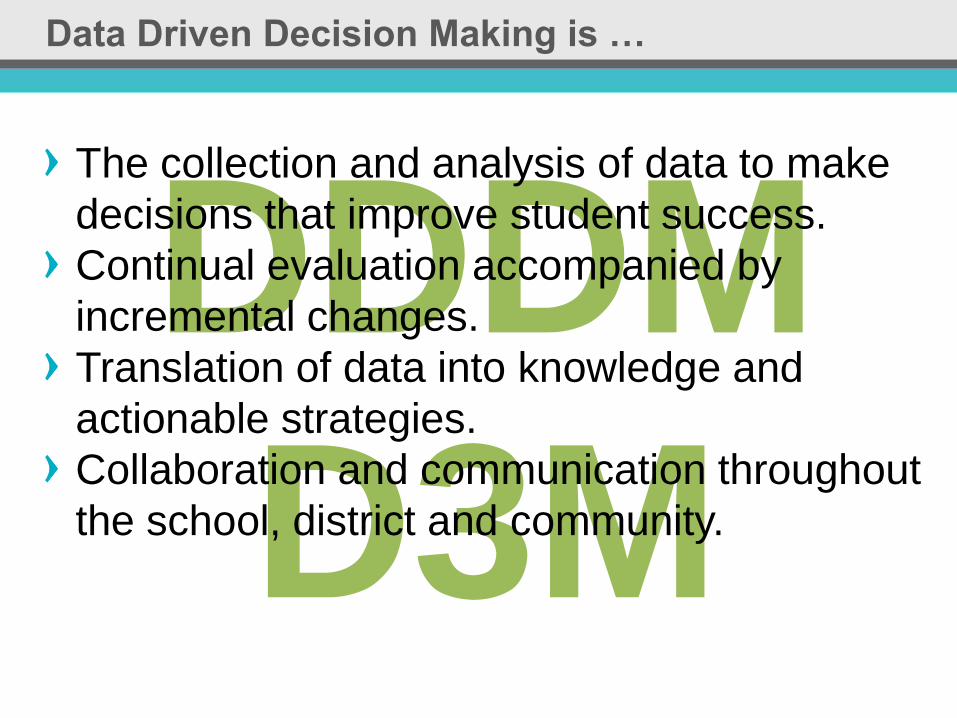
Data Driven Decision Making is …
The collection and analysis of data to make
decisions that improve student success.
Continual evaluation accompanied by
incremental changes.
Translation of data into knowledge and
actionable strategies.
Collaboration and communication throughout
the school, district and community.
6
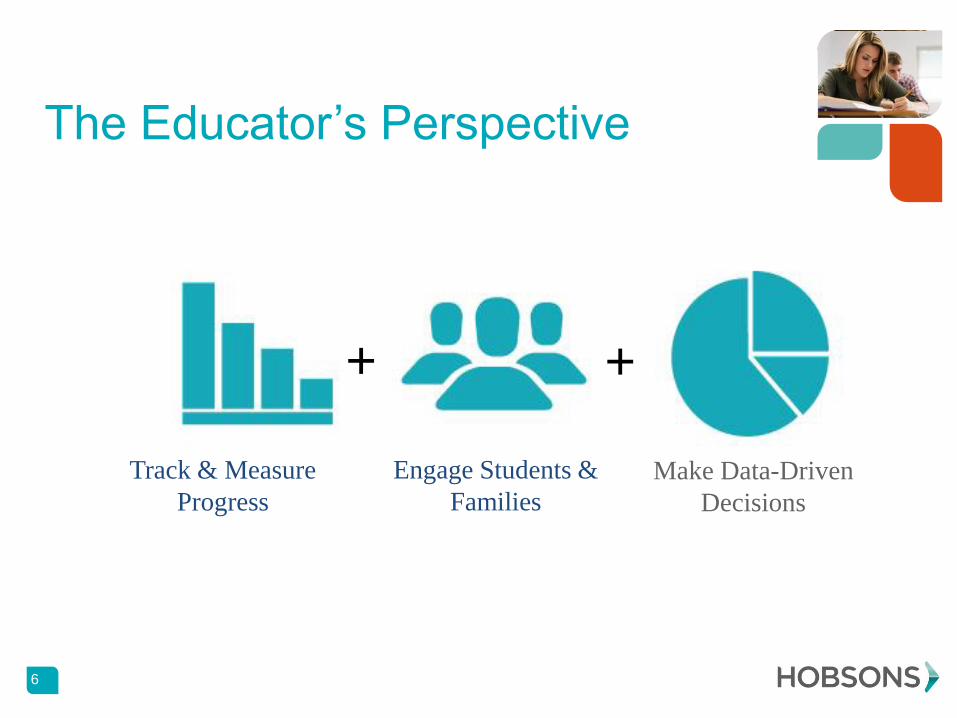
The Educator’s Perspective
+ +
Track & Measure
Progress
Engage Students &
Families
Make Data-Driven
Decisions
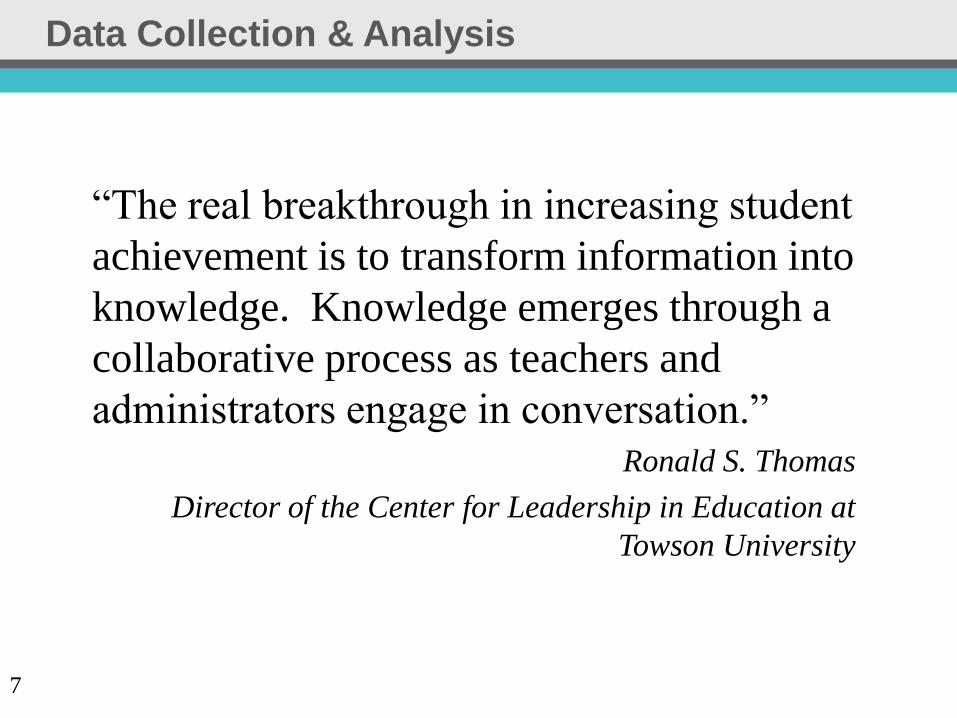
Data Collection & Analysis
7
“The real breakthrough in increasing student
achievement is to transform information into
knowledge. Knowledge emerges through a
collaborative process as teachers and
administrators engage in conversation.” Ronald S. Thomas
Director of the Center for Leadership in Education at
Towson University
What, Why, & How
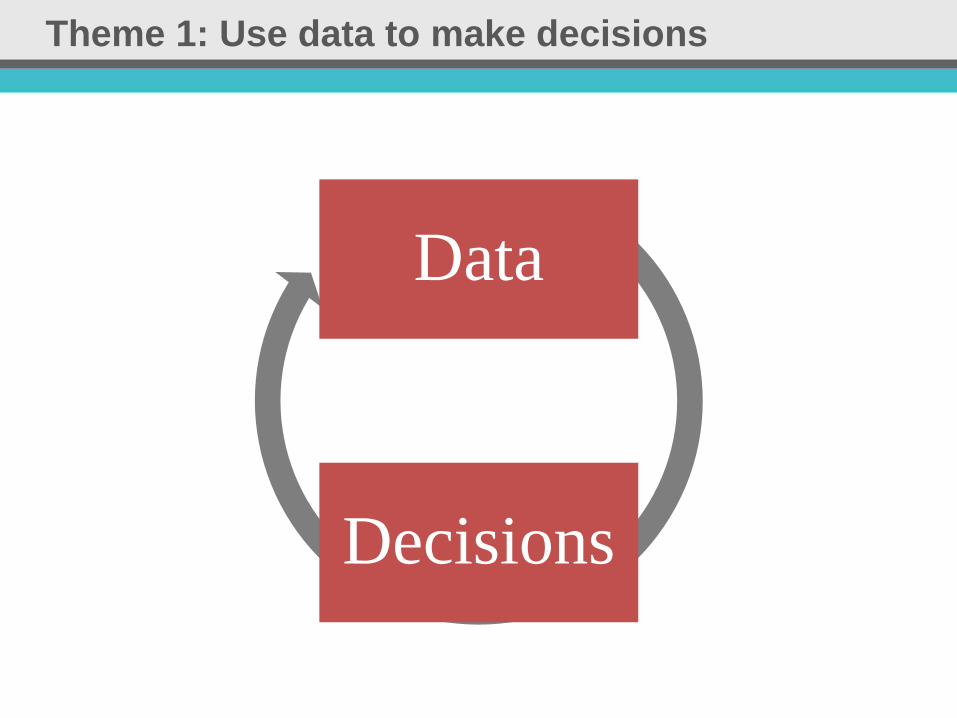
Theme 1: Use data to make decisions
Data
Decisions

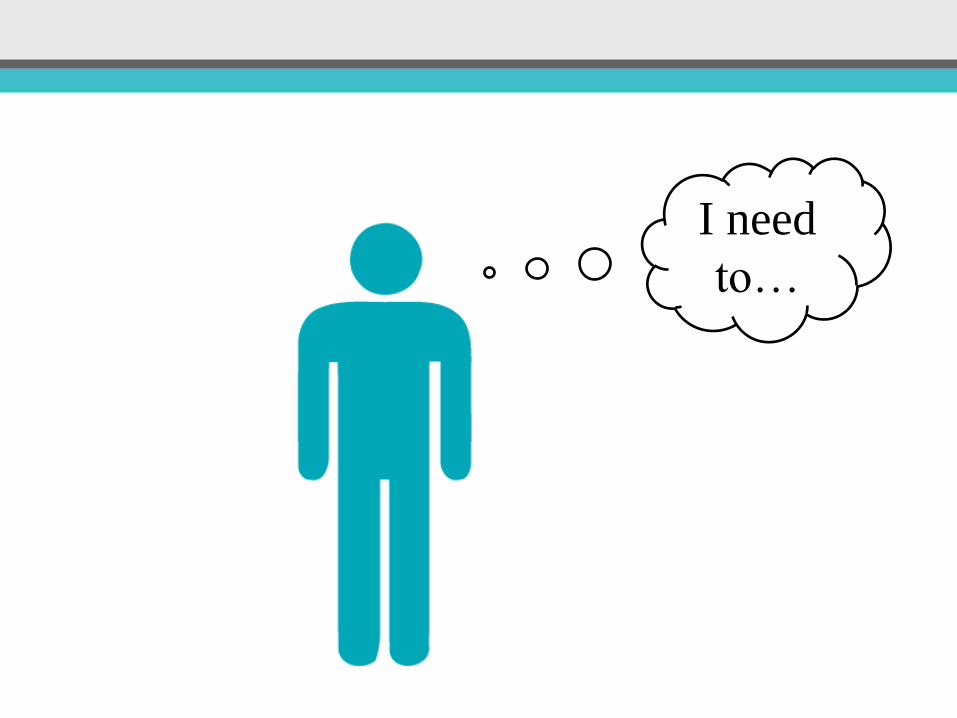
What we want to happen
Helpful
Data
I need
to…
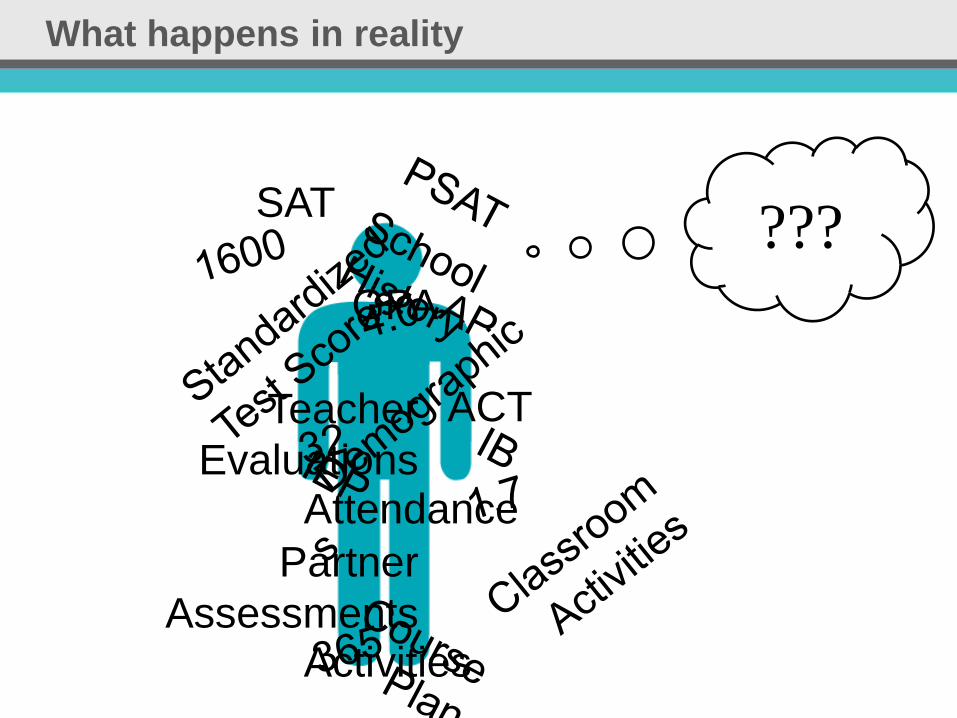
What happens in reality
Teacher
Evaluations
Partner
Assessments
SAT
GPA
ACT
Attendance
Activities
???
I need
to…

Takeaways
Use reports to determine professions/careers to target
Careers (Career Cluster) by Student
Students by Career (Career Cluster)
Use assessment results to organize professions
Holland Interest Code (Assessment Status)
Career Cluster Finder
Use survey builder to collect feedback

I need
to…

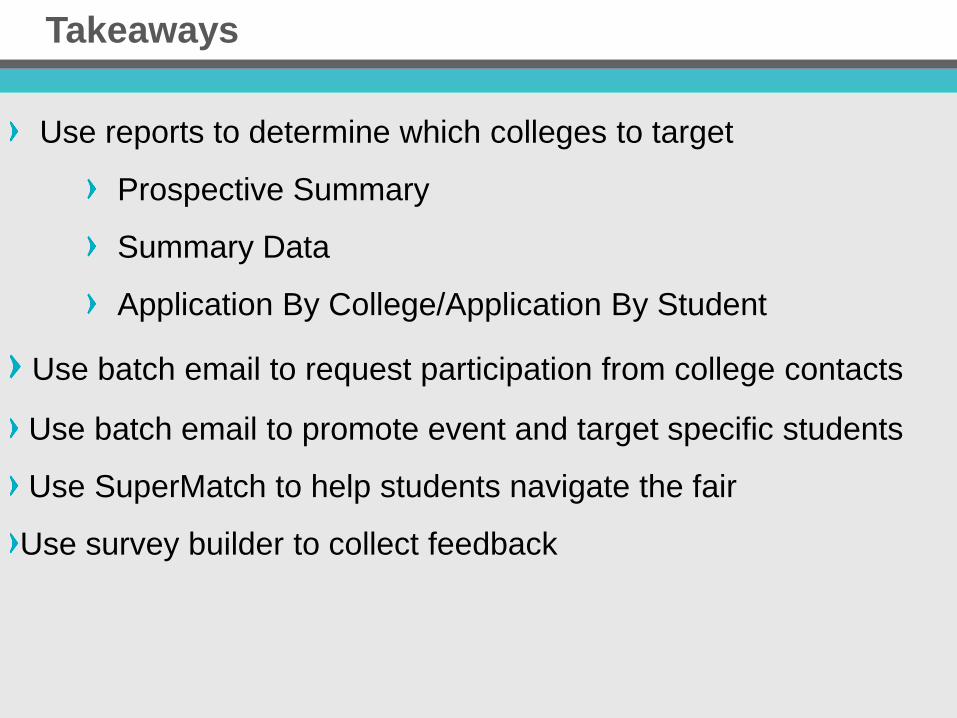
Takeaways
Use reports to determine which colleges to target
Prospective Summary
Summary Data
Application By College/Application By Student
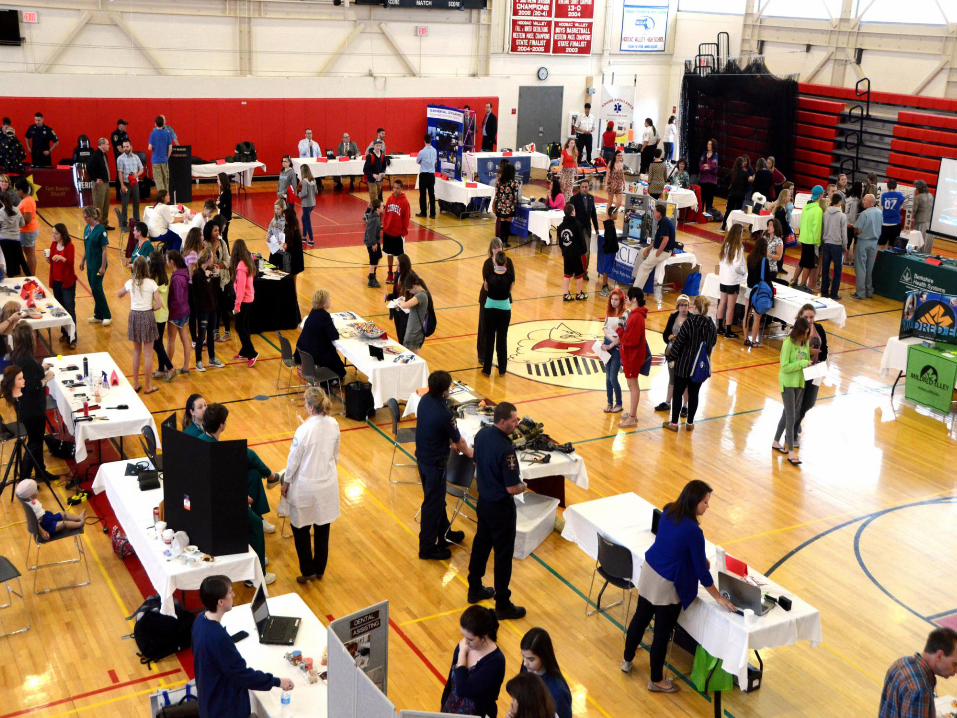
Use batch email to request participation from college contacts
Use batch email to promote event and target specific students
Use SuperMatch to help students navigate the fair
Use survey builder to collect feedback
Focus on Outcomes
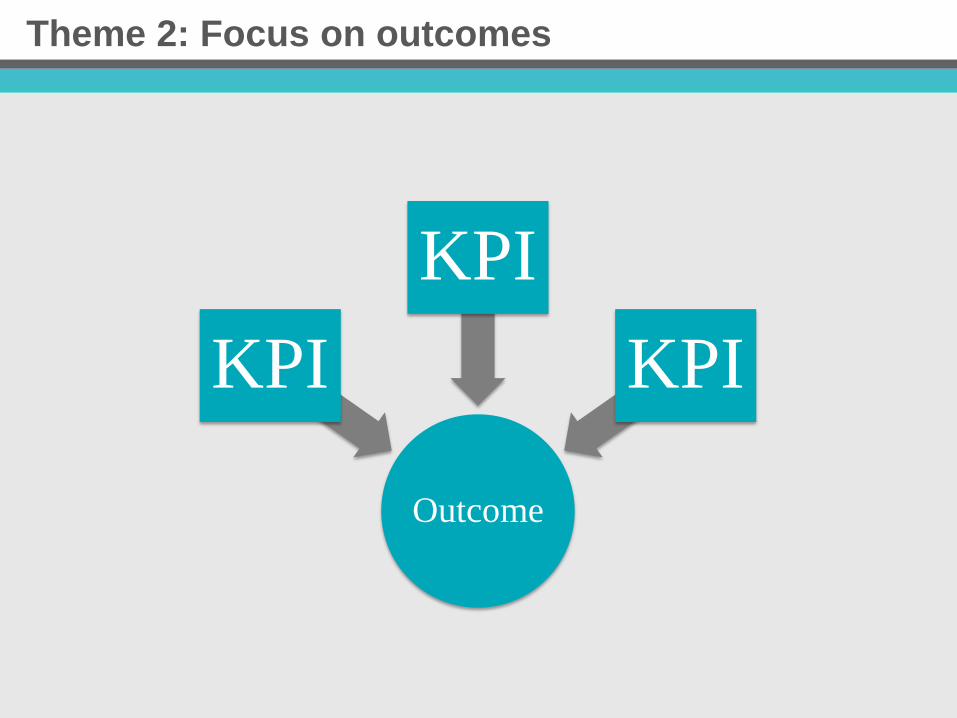
Theme 2: Focus on outcomes
Outcome
KPI
KPI
KPI
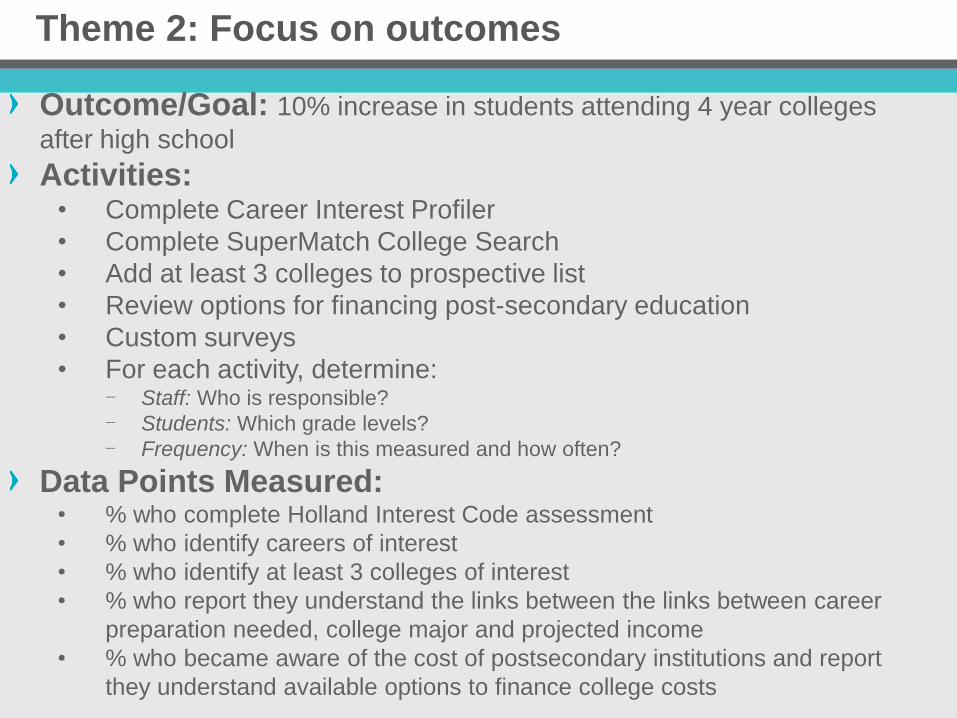
Outcome/Goal: 10% increase in students attending 4 year colleges
after high school
Activities: • Complete Career Interest Profiler
• Complete SuperMatch College Search
• Add at least 3 colleges to prospective list
• Review options for financing post-secondary education
• Custom surveys
• For each activity, determine: - Staff: Who is responsible?
- Students: Which grade levels?
- Frequency: When is this measured and how often?
Data Points Measured: • % who complete Holland Interest Code assessment
• % who identify careers of interest
• % who identify at least 3 colleges of interest
• % who report they understand the links between the links between career
preparation needed, college major and projected income
• % who became aware of the cost of postsecondary institutions and report
they understand available options to finance college costs
Theme 2: Focus on outcomes
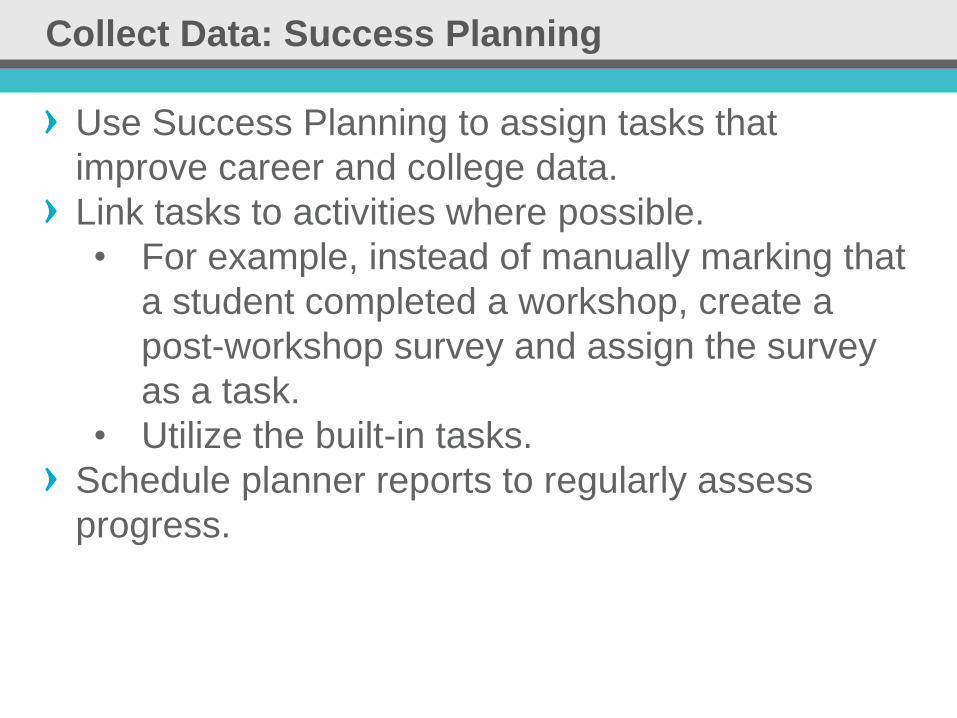
Collect Data: Success Planning
Use Success Planning to assign tasks that
improve career and college data.
Link tasks to activities where possible.
• For example, instead of manually marking that
a student completed a workshop, create a
post-workshop survey and assign the survey
as a task.
• Utilize the built-in tasks.
Schedule planner reports to regularly assess
progress.
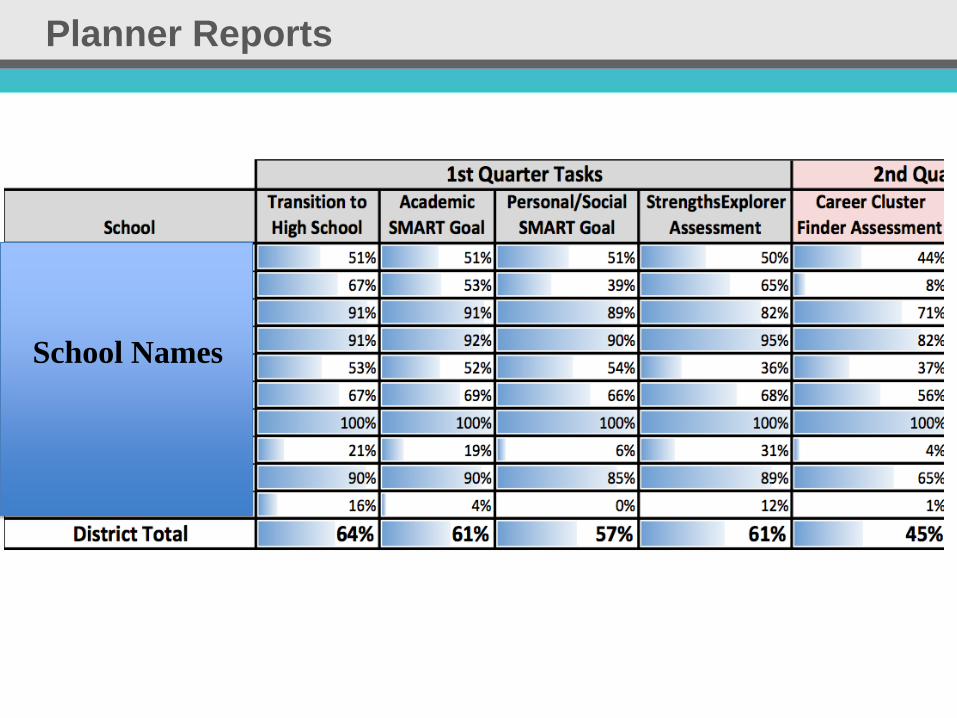
Planner Reports
School Names
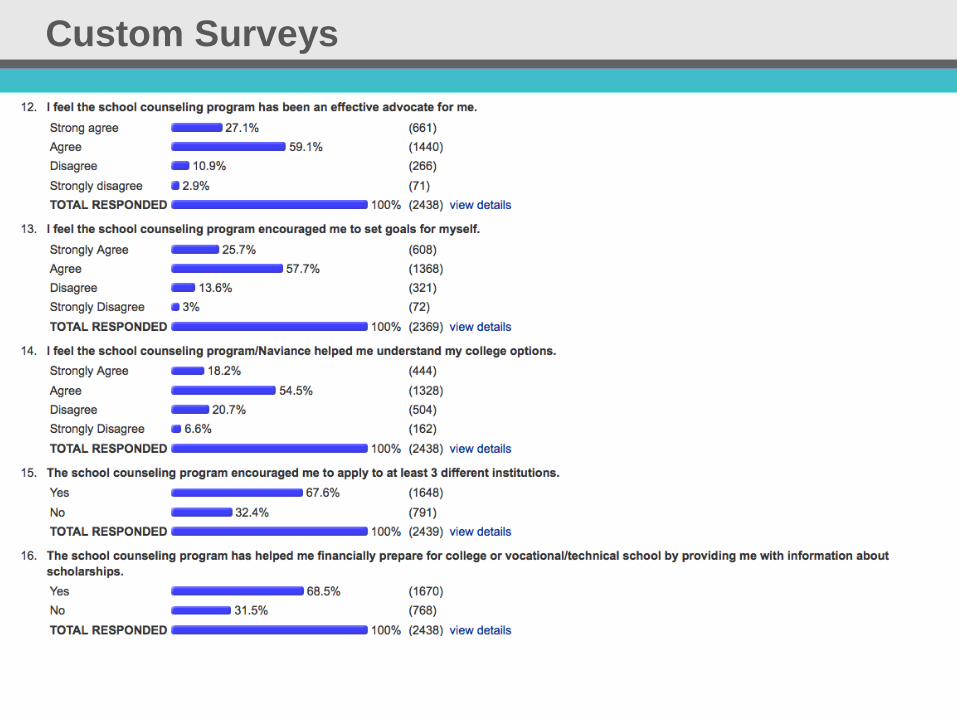
Custom Surveys

Your Turn…

Outcome/Goal:
Activities: • For each activity, determine:
- Staff: Who is responsible?
- Students: Which grade levels?
- Frequency: When is this measured and how often?
Data Points Measured:
Theme 2: Focus on outcomes (Your Turn)
Building a Data Culture
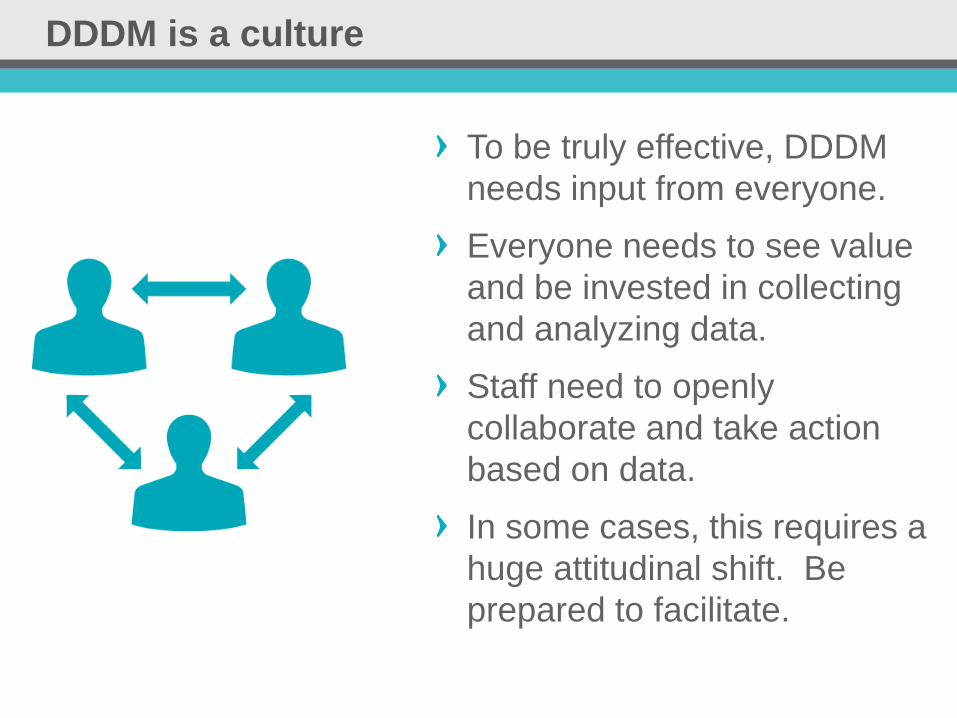
DDDM is a culture
To be truly effective, DDDM
needs input from everyone.
Everyone needs to see value
and be invested in collecting
and analyzing data.
Staff need to openly
collaborate and take action
based on data.
In some cases, this requires a
huge attitudinal shift. Be
prepared to facilitate.
Involve multiple staff
members from various roles
in the development of data
processes.
Collaborate to make the best
possible decisions.
Use data for decisions and
information, not just
compliance.
Building a Data Culture
Building a Data Culture
Get relevant input from
students.
Help students understand
data driven decision
making.
Bolster college going
culture.
Supplement college and
career planning activities.
Questions?