value i growth i innovation - alberta energy regulator
TRANSCRIPT

VALUE I GROWTH I INNOVATION
Germain Grand Rapids
Commercial Demonstration
Project (Phase 1)
AER Approval 11509
AER 2015 Annual Presentation
July 31, 2015

Agenda
• Activity Update
• Project Overview
• Resource Recovery
• Facility Update
• Compliance
July 31, 2015 NEXT STEPS 2 2

VALUE I GROWTH I INNOVATION
Germain Phase 1- AER Approval 11509
Subsection 3.1.1
Subsurface Issues Related to Resource Evaluation
and Recovery
July 31, 2015

Update on Activity
July 31, 2015 NEXT STEPS 4
Section 3.1.1(1)
Presentation to the AER on Mar 9, 2015 • Project Suspension Activities
Application No.
and Date Application Summary
Approval No.
and Date
AER -1812122
Oct 21, 2014
Top injection of NCG in upper
transition zone
11509I
Nov 25, 2014
AER -1827094
March 2015
Germain Suspension variance
request
11509J
April 21, 2015

Laricina Germain Lease
July 31, 2015 NEXT STEPS 5

Scheme Description
July 31, 2015 NEXT STEPS 6
• Commercial Demonstration Project
(Phase1)
– 5,000 bpd facility using Laricina’s SC-SAGD
process
– Incorporates water recycle
• Delineation at Germain provides a high
degree of geologic confidence
– Grand Rapids (primary target): 172
delineation wells and 11.2 km2 3D seismic
– Winterburn (secondary target): 20
delineation wells and 90.1km 2D seismic
Total Laricina Germain resource:
Key components of the Germain Project
• Central processing facility
• Single pad with 10 SAGD well-pairs (WPs)
• Equipment lay down and staging area
• Observation wells, groundwater monitoring wells,
water source and disposal wells
• Electrical substation, utility corridor including roads,
gathering lines and power lines
• Associated infrastructure such as storage tanks,
surface run-off pond, flow lines and construction and
operations camps
Germain Commercial Demonstration plant conceptual plot plan
(1) GLJ Report, effective year end, 2013. “bn” means billion.
Formation
2P Reserves (bn bbl)(1)
Best Estimate Contingent Resources (bn bbl)(1)
Project Design Capacity
(bbl/d)(1)
Grand Rapids 0.4 0.9 203,000
Winterburn - 0.4 55,500
Total 0.4 1.3 258,500

Drilled WP 10
Started WP 7
Bitumen Rate 795 m³/day
Dry Steam Injection 1,670 m³/day
Produced Water Recycle Yes, HLS
Source Water Wells 4
Make-up water (Steady-state) 176 m³/day
Disposal wells 3 wells total 338 m³/day
Steam Generators 4 x 50 mmBtu/hr
WP Spacing 60 m
Phase 1 Overview
July 31, 2015 NEXT STEPS 7
Germain lease
Project
area
Development area

Well placement in the Grand Rapids
July 31, 2015 NEXT STEPS 8
4 9
SL
SL WW SL SL
WW WW WW
SL WW
10 2 1 8 7 6 5 3
WW - Wire Wrapped
SL - Slotted Liner
Operating
Well-pair (WP)

WP 5 Trajectory / Cross-Section
July 31, 2015 NEXT STEPS 9
• Production wells P1-P6 targeted the basal water zone above the
basal shale with injection wells 5 m above the production wells
• WPs 1-6 were drilled in this configuration to optimize resource
recovery
9
Section 3.1.1(2i)

WP 10 Trajectory / Cross-Section
July 31, 2015 NEXT STEPS 10
• As authorized by AER Approval No. 11509D, the production
wells for WPs 7-10 were placed in the bitumen approximately
1 m above the bitumen-water contact
• WPs 7-10 were drilled in this configuration in order to mitigate
the potential effect of swelling clays in the basal water
10
Section 3.1.1(2i)

Existing Wells
July 31, 2015 NEXT STEPS 11
Section 3.1.1(3a)

Artificial Lift
• Electric Submersible Pumps (ESP)
– P3/P5/P6 (basal water wells) supplied by Baker Hughes
• Variable frequency drives
• Pump range between 125-600 m³/d
• Design temperature of 230°C
– P3 shut-in May 2014 due to high producing water cut
– P5 shut-in Jun 2014 due to high producing water cut
– P6 shut-in Jul 2014 due to high producing water cut
– P7-P10 pumps supplied by GE
• Pump range between 175-600 m³/d
– Smaller pump installed in P7 with more gas handling equipment
• Pump range between 100-400 m³/d
• Design temperature of 230 °C
July 31, 2015 NEXT STEPS 12
Section 3.1.1(4a,4b)

Artificial Lift continued
– Original pump in P8 (same as P9/P10) was determined to be
oversized with insufficient gas handling capabilities - replaced
September 2014 with similar pump installed in P7
• Well performance greatly improved after pump change
• P9 and P10 pumps were also identified for replacement due to similar
performance issues as P8, but well workovers were deferred due to
capital constraints
– P7 pump shaft failed Jan 3 2015 – was not repaired; well
subsequently shut-in
July 31, 2015 NEXT STEPS 13
Section 3.1.1(4a,4b)

Suspension Schedule - Well Types
• SAGD production wells – Suspended
• SAGD steam injection wells - Suspended
• Water source wells – scheduled to complete in September
• Class 1B disposal wells – scheduled to complete in September
• Observation wells will remain and continue to monitor temperature and
pressure
• The wells will be suspended in a manner that will ensure they remain in
a safe state during the suspension period in accordance to AER
Directive 13
July 31, 2015 NEXT STEPS 14

VALUE I GROWTH I INNOVATION
Scheme Performance
July 31, 2015

Project Activities
• WP7 converted to SAGD operation mid-Aug
2014
• SC-SAGD process
– WP10 - began Aug 20, 2014
– WPs 7 to 9 solvent injection initiated mid-Oct
2014
• Production uplift & SOR reduction observed in
almost all SC-SAGD WPs
– Early Dec 2014 solvent injection ceased in
WPs 7 & 10 and reduced by half in WPs 8 & 9
• Injection and production rates were reduced late
Dec - early Jan 2015 to balance local pad
pressure with regional upper transition zone &
bottom water zone
• Production ceased Feb 16, 2015 with gas
injection initiated to delay chamber collapse
• CPF Suspended Mar 23, 2015
July 31, 2015 NEXT STEPS 16
Section 3.1.1(7)

Performance
July 31, 2015 17 NEXT STEPS

WP 7 Performance
• Converted to
SC-SAGD Oct 28 2014
• Production improved with
solvent but not enough to
continue
• Solvent ceased Nov 21 2014,
no negative effect observed
• WP was young but still
tracking type curve
• Pump failed mid-Jan 2015
• Well was shut-in on Jan 3
2015
• Gas injection initiated Feb 7
2015 (82 Sm3/d) and ended
Mar 22 2015
July 31, 2015 NEXT STEPS 18
Co-injection
Sept 5-17
Stop Solvent and Restarted
Toe Co-injection

WP 8 Performance
• Converted to
SC-SAGD Oct 16 2014
• Pump change in Sept 2014 to
improve production capability;
rates also improved aided by
solvent
• Higher solvent returns
compared to others WPs
• Solvent injection ended on Jan
29 2015
• Well was shut-in on Feb 16
2015
• Gas injection initiated Feb 16
2015 (96 Sm3/d) and ended
Mar 22 2015
July 31, 2015 NEXT STEPS 19
ESP
Change Sept 19th

WP 9 Performance • Converted to SC-SAGD Oct 18
2014
• Recovered from initial dip in
FSSR* after stopping gas co-
injection
• Recent production below SC-
SAGD forecast following lower
solvent rates
• Production limited due to gas
production, candidate for possible
pump change
• Solvent injection ended Jan 29
2015
• Well was shut-in on Feb 17 2015
• Gas injection initiated Jan 29
2015 (75 Sm3/d) and ended Mar
22 2015
July 31, 2015 NEXT STEPS 20
Gas Co-inj.
*FSSR – fluid to steam + solvent ratio
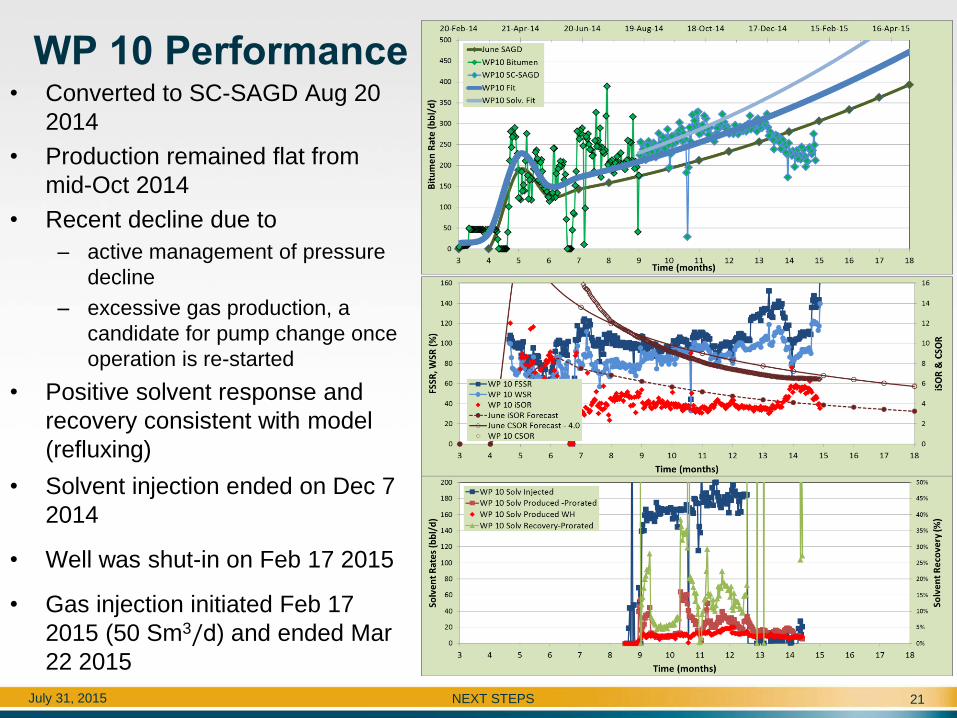
WP 10 Performance • Converted to SC-SAGD Aug 20
2014
• Production remained flat from
mid-Oct 2014
• Recent decline due to
– active management of pressure
decline
– excessive gas production, a
candidate for pump change once
operation is re-started
• Positive solvent response and
recovery consistent with model
(refluxing)
• Solvent injection ended on Dec 7
2014
• Well was shut-in on Feb 17 2015
• Gas injection initiated Feb 17
2015 (50 Sm3/d) and ended Mar
22 2015
July 31, 2015 NEXT STEPS 21

WP Overall Performance
• Overall performance tracking type curve
July 31, 2015 NEXT STEPS 22

Reservoir Pressure • Reservoir chamber pressure responded to changes in operations
• Gas injection used briefly to sustain chamber pressures following shut-in, shut off Mar
23 2015 as part of final plant suspension
July 31, 2015 NEXT STEPS 23
Section 3.1.1(7d)

WP Horizontal Temperatures
July 31, 2015 NEXT STEPS 24
WP 8
Section 3.1.1(7d)
WP 7
• Chambers cooled following SAGD suspension and
initiation of gas injection to delay chamber collapse

WP Horizontal Temperatures
July 31, 2015 NEXT STEPS 25
WP 9
WP 10
Section 3.1.1(7d)

Steam Properties and Co-injection
• Injected Steam properties: 3,000 kPag @ 235ºC header conditions, 99%
quality
• Solvent co-injection @ 5-15vol%
• Non-condensable gas co-injection/injection
– Methane @ 0.7-1.5% mole fraction
July 31, 2015 NEXT STEPS 26
Section 3.1.1(7d,7e)

SC-SAGD Performance
• SC-SAGD was tested to provide calibration data for reservoir models. An
optimized process will be developed for future phases.
• Four WPs located in the Bitumen Saturated Zone have been operated with
diluent (solvent) co-injection
• Sustainable improvement observed:
– Rate uplift in the range of 5% - 26%
– SOR reductions range from 10% - 20%
– Wells operated at low subcool resulting in solvent reflux
July 31, 2015 NEXT STEPS 27
Rate
SOR

Solvent Recovery
• Solvent reflux due to operating subcools resulted in lower solvent
returns
– Solvent recovery strongly dependent on gas production rate
– Additional solvent recovered during final blowdown before suspension
July 31, 2015 NEXT STEPS 28
Final Recovery to Mar 2015 = 17 - 42 vol%

2015 RST Logs (two wells logged in 2015)
July 31, 2015 NEXT STEPS 29
02/10-33-84-22W4 – WP 10 Toe 02/15-33-84-22W4 – WP 10 Mid
Feb
2015
Feb
2014
Feb
2015
Feb
2014
July 31, 2015 NEXT STEPS 30
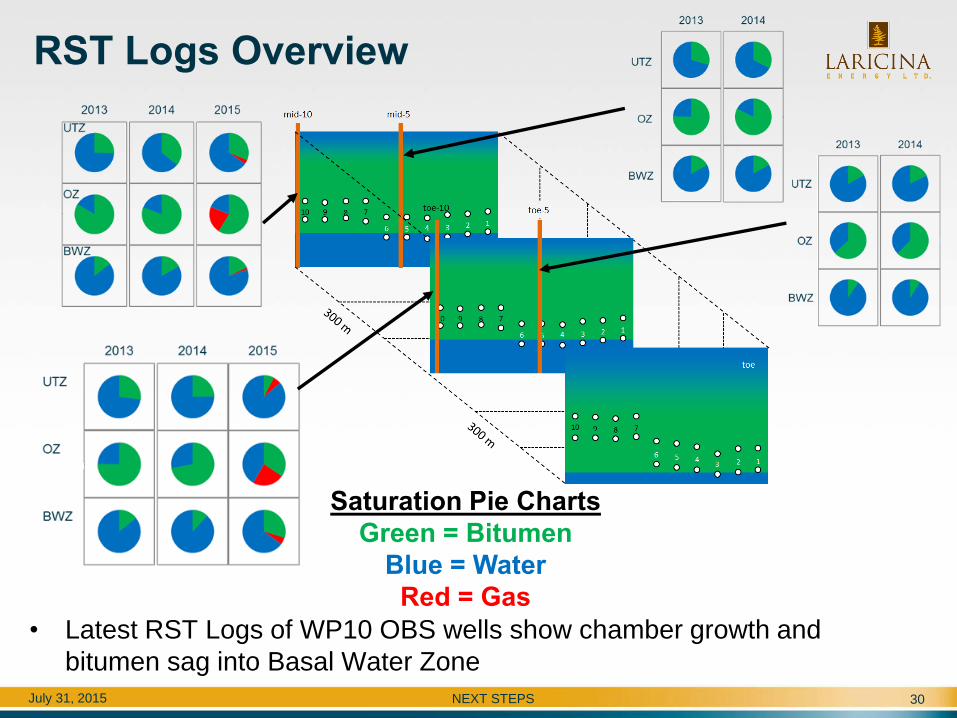
RST Logs Overview
• Latest RST Logs of WP10 OBS wells show chamber growth and
bitumen sag into Basal Water Zone
Saturation Pie Charts
Green = Bitumen
Blue = Water
Red = Gas
July 31, 2015 NEXT STEPS 31
• RST shows reduction in bitumen saturation up to 6m above injector at
toe and 2.5m above injector at mid of WP10
• No steam temperatures observed at this OBS well, indicating gas
saturation is likely composed of NCG and Solvent
• Increase in bitumen saturation below the producer suggests bitumen
loss to the bottom water but above the basal water mudstone
• Bitumen drainage into the clean water sand above the basal water
mudstone is observed, consistent with our hypothesis
RST Logs Observations

Summary of Key Scheme Insights
• Fluid losses to upper transition zone managed through changes in
operating pressure, steam injection rates and utilization of gas co-
injection
– Improved understanding of relationship between FSR and upper transition
zone/bottom water zone pressure management
• SC-SAGD operation demonstrated consistent production uplift and
solvent recovery up to 42vol%
• Learnings from the Germain Phase 1 Project are being applied to Phase
2 development
July 31, 2015 NEXT STEPS 32
Section 3.1.1(7f)

VALUE I GROWTH I INNOVATION
Subsection 3.1.2
Surface Operations, Compliance, and Issues Not
Related to Resource Evaluation and Recovery
July 31, 2015

Detailed Site Survey Plan
July 31, 2015 NEXT STEPS 34
Section 3.1.2(1a)

Well Pad Site Survey Plan
July 31, 2015 NEXT STEPS 35
Section 3.1.2(1a)
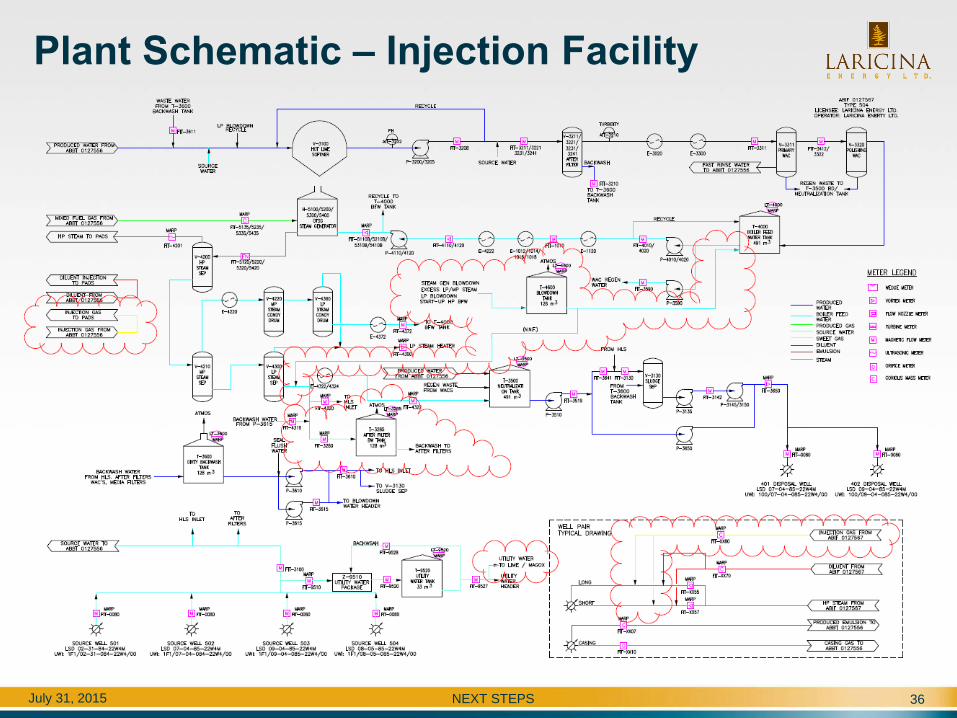
Plant Schematic – Injection Facility
July 31, 2015 NEXT STEPS 36

Plant Schematic – Production Facility
July 31, 2015 NEXT STEPS 37

Facility – Key Events
• Ramped up bitumen and water treating operations throughout 2014 and
the start of 2015
• Bitumen production >1000 bbl/d in Dec 2014
• New WACs ordered and installed
• Implemented dirty backwash water recycle to HLS in December to meet
AER water recycle requirements
• Plant suspension and mothballed Mar 2015
July 31, 2015 NEXT STEPS 38
Section 3.1.2(2)

Facility Performance
Bitumen treating – Consistent treatment of produced bitumen was achieved with BS&W of <0.5
% and density >960 kg/m3
Water treatment
• HLS design and operating issues
– Maintaining the HLS bed greatly improved after modification completed
– Modifications completed to improve operating performance
– New flocculent skid installed
• Source water contains solution gas (with no detectable H2S) that
negatively impacted WAC performance
– Source water is directed to the Produced Water Tank (PWT) and any
evolved gas is collected by the VRU
– Utility water system still contains gas as it tees off before the PWT. D60
waiver has been requested; waiting on AER approval to submitted D56
amendment to increase venting volume
July 31, 2015 NEXT STEPS 39
Section 3.1.2(2a-c)

Facility Performance
Steam Generation
• Operated 2 of 4 OTSG’s before shutdown as only 4 WPs are
operating
Additional challenges include:
• Glycol heat trace system balancing issues resulted in freezing of
lines
• Installed booster pumps in several locations to prevent line
freezing
July 31, 2015 NEXT STEPS 40
July 2010
Section 3.1.2 (2a-c)

Plant Modifications
• Diluent Recovery Unit (DRU) installed and commissioned in
spring 2014
• Start-up Tank modifications have been completed to deal
with emulsion carry-over
• Water treatment modifications
– Modified HLS internals to help stabilize bed formation
– Increased the temperature of the source water entering the
Produced Water Tank
• Installation of a bypass line around the disposal stream
meter as per the MARP
• Installation of Magnetic Resonance (MR) water cut meter for
testing
July 31, 2015 NEXT STEPS 41
July 2010
41
Section 3.1.2(1c)

2014/2015 Power Imports
(kWh) Power Generation
(kWh)
Power Exports (kWh)
August 1,294,580 0 0
September 1,284,290 0 0
October 1,352,250 0 0
November 1,493,750 0
0
December 1,446,840 0 0
January 1,434,800 0 0
February 1,187,210 0 0
March 700,470 0 0
Facility Power
July 31, 2015 NEXT STEPS 42
Section 3.1.2(2d)
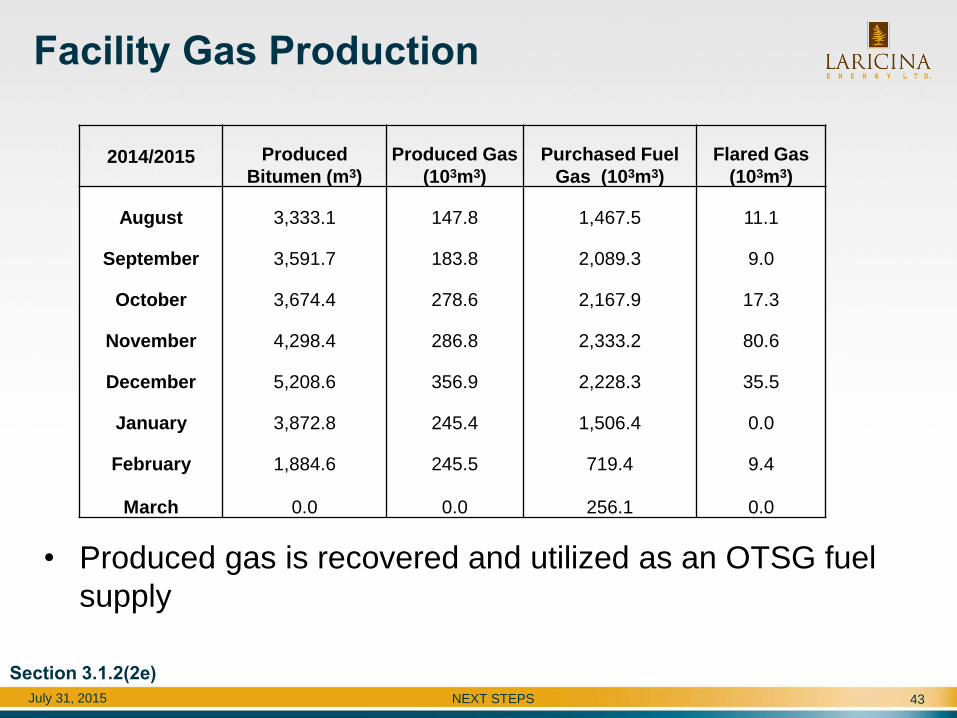
Facility Gas Production
July 31, 2015 NEXT STEPS 43
• Produced gas is recovered and utilized as an OTSG fuel
supply
Section 3.1.2(2e)
2014/2015 Produced
Bitumen (m3)
Produced Gas
(103m3)
Purchased Fuel
Gas (103m3)
Flared Gas
(103m3)
August 3,333.1 147.8 1,467.5 11.1
September 3,591.7 183.8 2,089.3 9.0
October 3,674.4 278.6 2,167.9 17.3
November 4,298.4 286.8 2,333.2 80.6
December 5,208.6 356.9 2,228.3 35.5
January 3,872.8 245.4 1,506.4 0.0
February 1,884.6 245.5 719.4 9.4
March 0.0 0.0 256.1 0.0

Summary of Environmental Greenhouse
Gas Emissions
• Phase 1 GHG threshold for reporting both provincially &
federally is 50 kilotonnes CO2e per year
• Laricina added this facility and its emissions in its annual
participation in NPRI, GHG and CAPP Responsible
Canadian Energy reporting
• In 2014 Laricina reported both provincially & federally 81.30
kilotonnes CO2e
July 31, 2015 NEXT STEPS 44
Section 3.1.2(2f)
Measurement and Reporting
• All WPs have individual flow measurement installed at the
wellhead (Coriolis mass meter) and a manual sample point for
water cut determination
• Each well is deemed to be “on-test” at all times when it is
producing
• Water cuts are measured daily and averaged to estimate the daily
produced water and bitumen for each well
• On-line Magnetic Resonance (MR) water cut meter installed
March 2014 to develop a comparison against manual water cuts
and evaluate its future use as a primary continuous BS&W
measurement device (accepted for use in MARP, see following
slides)
July 31, 2015 NEXT STEPS 45
Section 3.1.2(3a)

Measurement and Reporting
• Proration Factors:
*Gas proration factor is always 1.0, per MARP
• Optimization
– Since Aug 2014, proration factors showed gradual improvement, up until the
month prior to the start of mothballing activities
July 31, 2015 NEXT STEPS 46
Monthly 2014 2015
Aug. Sept. Oct. Nov. Dec. Jan. Feb. Mar. Apr. May Jun. Jul.
Water Proration 1.14 1.11 1.12 1.07 1.06 1.06 1.1 -- -- -- -- --
Bitumen
Proration 0.99 0.94 0.93 1.01 0.96 0.96 1.07 -- -- -- -- --
Section 3.1.2(3a,3b)

Measurement and Reporting
• On-line Magnetic Resonance (MR) water cut meter comparison against
manual water cuts:
– Operator factor represents manual cuts obtained by the operator and
demonstrate greater variance
– The meter allows for real time monitoring of water cuts, minimizing error
associated with slug flow and operator error in sample collection
– Presented to the AER on Nov 28, 2014 a proposal to use the MR meter as a
primary BS&W measurement device in the MARP based on successful field
testing results performed at the Germain project facility
• AER accepted Laricina’s MARP amendment in Dec 2014
47
Section 3.1.2(3c,3d) July 31, 2015 NEXT STEPS
Measurement and Reporting
• In accordance with AER mandated annual facility MARP
updates, the Germain MARP was submitted in Feb 2015 for
review
– In addition to the Feb 2015 MARP update, the MARP was also
submitted in Aug 2014 and Oct 2014 to address various equipment
additions, calculation changes/clarifications, and methodology
updates that occurred throughout the course of last year
July 31, 2015 NEXT STEPS 48
Section 3.1.2(3)

UWI’s of Source Water Wells and Water
Disposal Wells
• Diversion licence (# 00330267-00-00) from ESRD for 4 Grand Rapids
source water wells:
– 1F1/07-04-085-22W4, 1F1/08-05-085-22W4, 1F1/09-04-085-22W4,
1F1/02-31-084-22W4
• One Class 1B Disposal Well Approval No. 11544
– 100/02-31-084-22W4 (Grosmont A Formation)
• Two additional wells have been drilled and approved as 1B wells for
disposal Approval No. 11799A
– 100/07-04-085-22W4 (Grosmont A Formation)
– 100/09-04-085-22W4 (Grosmont A Formation)
July 31, 2015 NEXT STEPS 49
Section 3.1.2(4a, 4g)

Water Sources and Uses
July 31, 2015 NEXT STEPS 50
Section 3.1.2(4b-f)
2014/2015 FW Make
(m3)
Produced
Water (m3)
Steam
(m3)
Produced Water
Recycle
Blowdown
Recycle
August 10,003 13,006 15,929 46% 0%
September 9,601 14,061 16,965 52% 0%
October 5,939 14,400 17,437 80% 0%
November 6,353 16,108 19,455 81% 0%
December 1,309 21,684 18,338 79% 0%
January 4,618 18,729 18,375 73% 0%
February 723 10,185 9,026 82% 0%
0%
10%
20%
30%
40%
50%
60%
70%
80%
90%
100%
August September October November December January February
0
2,500
5,000
7,500
10,000
12,500
15,000
17,500
20,000
22,500
25,000
Vo
lum
e (
m3)
Water Sources and Recycle
FW Make-Up PW in Steam % PW Recycled

Disposal Wells Performance
• Both disposal wells 00/07-04-085-22W4/00 and 00/09-04-085-22W4/00 completed in the Grosmont A
disposal zone are operating at low pressures and are often under vacuum conditions
• The 100/02-31-084-22W4 well was not utilized in 2014/2015
July 31, 2015 NEXT STEPS 51
Section 3.1.2(4h)
0.0
10.0
20.0
30.0
40.0
50.0
60.0
70.0
80.0
90.0
100.0
-100
900
1900
2900
3900
4900
5900
6900
7900
8900
9900
August September October November December January February March
Tem
pe
rtu
re (
°C)
Pre
ssu
re, V
olu
me
(kP
ag, m
3 )
Disposal Well Metrics
9-4 Disposal Volume 7-4 Disposal Volume 9-4 Max Injection Pressure
7-4 Max Injection Pressure Average Disposal Fluids Temperature
3450 kPag MAX

Sulphur Production
• Project is approved for 0.2 tonnes/day SO2. To date the facility has
emitted from 0 to <0.06 tonnes/day SO2
• Emission monitoring – Stack Sampling and Analysis occurred in March
2014 and again in July 2014 due to a NOx rate issue with the glycol trim
heater - sampling and verification of emission rates met approval criteria
• Passive sampling monitors continue to demonstrate that Germain Phase
1 is well within allowable limits for SO2 and H2S
• Sulphur production remains well below the 1 t/cd
July 31, 2015 NEXT STEPS 52
Sulphur
Compliance Total Monthly Production
(kg/month) Average daily
Production (kg/cd) Average daily
Production (t/cd) Quarterly Sulphur
Production (t/cd)
Aug-14 761 24.5 0.02 0.02
Sep-14 793 26.4 0.03
Oct-14 756 24.4 0.02
0.02 Nov-14 854 28.5 0.03
Dec-14 773 24.9 0.02
Jan-15 780 25.2 0.03 0.02
Feb-15 412 14.7 0.01
Section 3.1.2(5b-d)

Summary of Environmental Issues
• Compliance issues related to regulatory approvals (e.g. EPEA,
Sustainable Resource Development (SRD), Department of Fisheries
and Oceans (DFO))
• In the table on the next slide are all the 2014-2015 non-compliance
issues related to regulatory approvals
• Over this time period 2 events had been reported to AER
• All action items with respect to non-compliances have been undertaken
and completed
• Laricina continues to be proactive in communications with regulatory
agencies to maintain transparency and provide self disclosures where
applicable
July 31, 2015 NEXT STEPS 53
Section 3.1.2(6)

Environmental Issues
• Water Act Licence # 00330267-00-00 from ESRD for 4 Grand Rapids
source water wells:
– Maximum annual diversion of 300,000 m³
– 1F1/07-04-85-22W4, 1F1/08-5-85-22W4, 1F1/09-04-85-22W4,
1F1/02-31-084-22W4
– In 2014/2015 the facility utilized 64,976 m³ of water withdrawn from the
water source wells
• Groundwater sampling continues as per the management plan with no
changes in water quality observed to date
• The 2014 Annual Groundwater Monitoring Program Summary Report
was submitted for review in March of 2015. All sampling was completed
as per the submitted report
• Laricina will continue to monitor only the three upper Grand Rapids wells
annually during the suspended operations
July 31, 2015 NEXT STEPS 54
Section 3.1.2(6b, 6c)

Summary of Compliance Issues
July 31, 2015 NEXT STEPS 55
Section 3.1.2(6)
Germain CDP Facility EPEA Approval 242701-00-02
AER FIS Incident
Number/AESRD Volume of Material
Released Brief Description of
Non-compliance Actions completed to correct
the Non-compliance
20141573 4 m3 process water Boiler blowdown water release from an
overflow from blowdown tank into
secondary containment.
Release material removed from
secondary containment and 7 day
letter completed. Tank High
alarm recalibrated. Procedures
reviewed with operations
20141445 71 m3 process water
Disposal water release through a drain
that was left open in error. Small amount
of released wastewater diluted with rain
runoff (Estimated at 50L) was observed to
have migrated through the berm.
Release material removed
including skimmed soils. Samples
taken per guidelines . De-isolation
procedure reviewed with
operations.

Statement Confirming Compliance
• Germain Phase 1 Project it has been operating in
accordance with approvals and regulatory requirements of
the AER, AESRD and DFO
• Previous non-compliance events and self-disclosures are
listed under 3.1.2 (6)
July 31, 2015 NEXT STEPS 56
Section 3.1.2(7&8)

Forward-looking Statements Advisory
This Laricina Energy Ltd. (the “Company”) presentation contains certain forward-looking statements. Forward-looking statements
may include, but are not limited to, statements concerning estimates of exploitable original-bitumen-in-place, predicted recovery
factors, steam-to-oil ratios and well production rates, estimated recoverable resources as defined below, expected regulatory filing,
review and approval dates, construction and start-up timelines and schedules, company project potential production volumes as
well as comparisons to other projects, statements relating to the continued overall advancement of the Company’s projects,
comparisons of recoverable resources to other oil sands projects, estimated relative supply costs, potential cost reductions,
recovery and production increases resulting from the application of new technology and recovery schemes, estimates of carbon
sequestration capacity, costs for carbon capture and sequestration and possible implementation schedule for carbon capture and
sequestration processes or related emissions mitigation or reduction scheme and other statements which are not historical facts.
You are cautioned not to place undue reliance on any forward-looking statements as there can be no assurance that the plans,
intentions or expectations upon which they are based will occur. By their nature forward-looking statements involve numerous
assumptions, known and unknown risks and uncertainties, both generally and specific, that contribute to the possibility that the
predictions, forecasts, projections and other forward-looking statements will not occur. Although the Company believes that the
expectations represented by such forward-looking statements are reasonable, there can be no assurance that such expectations
will prove to be correct and, accordingly that actual results will be consistent with the forward-looking statements. Some of the risks
and other factors that could cause results to differ materially from those expressed in the forward-looking statements contained in
this presentation include, but are not limited to geological conditions relating to the Company’s properties, the impact of regulatory
changes especially as such relate to royalties, taxation and environmental changes, the impact of technology on operations and
processes and the performance of new technology expected to be applied or utilized by the Company; labour shortages; supply
and demand metrics for oil and natural gas; the impact of pipeline capacity, upgrading capacity and refinery demand; general
economic business and market conditions and such other risks and uncertainties described from time to time in the reports and
filings made with security regulatory authorities, contained in other disclosure documents or otherwise provided by the Company.
Furthermore the forward-looking statements contained in this presentation are made as of the date hereof. Unless required by law
the Company does not undertake any obligation to update publicly or to revise any of the included forward-looking statements,
whether as a result of new information, future events or otherwise. The forward-looking statements contained in this presentation
are expressly qualified by this advisory and disclaimer.
January 2015 NEXT STEPS 57

January 2015 NEXT STEPS 58
Significant Definitions
In this presentation the reserve and recoverable resource numbers, along with the net present values given, are as defined in the
report of GLJ Petroleum Consultants Ltd. (“GLJ”) regarding Laricina’s Germain Grand Rapids, Germain Winterburn, Saleski
Grosmont, Burnt Lakes, Conn Creek, Poplar Creek and Portage properties as at December 30, 2014, and as at December 31,
2013 for Thornbury, Thornbury West, House River, Germain Wabiskaw and Boiler Rapids properties, collectively referred to herein
(the “GLJ Report”). “Exploitable OBIP” or “Expl. OBIP” refers to original-bitumen-in-place that is targeted for development using
thermal recovery technologies. The best and high estimate of the Company’s resources include contingent and prospective
resources. “Cont.” or “2C” and “Pros.” refer to contingent and prospective bitumen resources, respectively. Contingent resource
values have not been risked for chance of development while prospective resource values have been risked for chance of
discovery but not for chance of development. There is no certainty that it will be commercially viable to produce any portion of the
contingent resources. There is no certainty that any portion of the prospective resources will be discovered or, if discovered, if it will
be commercially viable to produce any portion of the prospective resources. “2P” means proved plus probable reserves and “3P”
means proved plus probable plus possible reserves. “SAGD” means steam-assisted gravity drainage. “C-SAGD” means cyclic
SAGD”. “SC-SAGD” means solvent-cyclic SAGD. “CSS” means cyclic steam stimulation. The SC-SAGD best estimate technology
sensitivity (Laricina technology sensitivity) net economic forecasts were prepared on Saleski-Grosmont and Germain-Grand Rapids
based on SC-SAGD technology. “SOR” means steam-oil ratio. “CSOR” means cumulative steam-oil ratio. “iSOR” means
instantaneous steam-oil ratio. “CDOR” means calendar day oil rate. “bbl” means barrel. “bn” means billions. “m” means metres.
“mm” means million. “mmbbl” means millions of barrels. “bbl/d” means barrels per day. “EIA” means Energy Information
Administration. “NPV” means net present value. “m3” means cubic metres. “m3/d” means cubic metres per day. ‘kPa” means
kilopascal. “Dkeff” means Darcy’s effective permeability. “km2” means square-kilometres. “NPV10” means net present value, before
tax, 10 percent discount. “US$” means United States dollars. “U.S.” means United States of America. “WTI” means West Texas
Intermediate. “WCS” means Western Canadian Select.
Unless otherwise stated, all dollar amounts are shown in Canadian dollars (C$).
Contact Us
Laricina Energy Ltd.
800, 425 – 1st Street SW
Calgary, Alberta T2P 3L8
403-750-0810
www.laricinaenergy.com
NEXT STEPS 59 July 31, 2015

Appendices
July 1, 2015
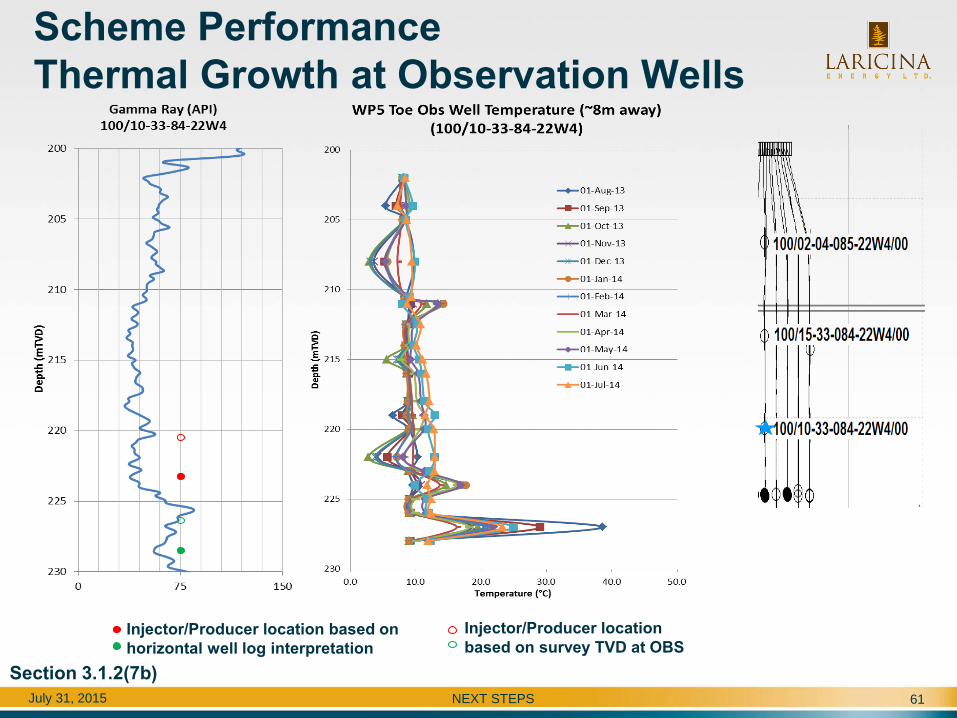
Scheme Performance
Thermal Growth at Observation Wells
July 31, 2015 NEXT STEPS 61
Injector/Producer location based on
horizontal well log interpretation
Injector/Producer location
based on survey TVD at OBS
Section 3.1.2(7b)

Scheme Performance
Thermal Growth at Observation Wells
July 31, 2015 NEXT STEPS 62
Injector/Producer location
based on survey TVD at OBS Section 3.1.2(7b)

Scheme Performance
Thermal Growth at Observation Wells
July 31, 2015 NEXT STEPS 63
Injector/Producer location
based on survey TVD at OBS
Section 3.1.2(7b)

Scheme Performance
Pressure Response OBS Well
July 31, 2015 NEXT STEPS 64
Injector/Producer location based on
horizontal well log interpretation
Injector/Producer location
based on survey TVD at OBS
Section 3.1.2(7b)

Scheme Performance
Pressure Response OBS Well
July 31, 2015 NEXT STEPS 65
Injector/Producer location based on
horizontal well log interpretation
Injector/Producer location
based on survey TVD at OBS
Section 3.1.2(7b)

Scheme Performance
Pressure Response OBS Well
July 31, 2015 NEXT STEPS 66
Injector/Producer location
based on survey TVD at OBS
Section 3.1.2(7b)

Scheme Performance
Pressure Response OBS Well
July 31, 2015 NEXT STEPS 67
Injector/Producer location
based on survey TVD at OBS
Section 3.1.2(7b)