version: publisher: doi - e-space › 618013 › 1 › apparel consumer...rahman, oandfung,...
TRANSCRIPT

Rahman, O and Fung, BCM and Chen, Zhimin and Chang, W and Gao, X(2017)A Study of Apparel Consumer Behaviour in China and Taiwan. Inter-national Journal of Fashion Design, Technology and Education, 11 (1). pp.22-33. ISSN 1754-3266
Downloaded from: http://e-space.mmu.ac.uk/618013/
Version: Accepted Version
Publisher: Taylor & Francis
DOI: https://doi.org/10.1080/17543266.2017.1298158
Please cite the published version
https://e-space.mmu.ac.uk

A study of apparel consumer behaviour in China and Taiwan Osmud Rahman1 Benjamin C.M. Fung2
, Zhimin Chen3, Wei-Lun Chang4 and Xiang Gao5
1School of Fashion, Ryerson University, Toronto, Ontario, Canada
2School of Information Studies, McGill University, Montreal, Quebec, Canada
3Manchester Fashion Institute, Manchester Metropolitan University, Manchester, UK 4Department of Business Administration, Tamkang University, Taiwan
5CICC Alpha, a fund management subsidiary of China International Capital Corporation Limited, Beijing, China
Abstract
To understand consumer behaviour and preferences for apparel shopping in Asia, the current
study was undertaken to investigate the following three topics in China and Taiwan: online and
offline shopping behaviours, product evaluative criteria and fashion information sources. Data
was collected through questionnaire surveys carried out in mainland China and Taiwan.
According to the results of this study, both Chinese and Taiwanese women shopped more
frequently than men. Chinese consumers shopped more frequently online than did their
Taiwanese counterparts. Both Chinese and Taiwanese consumers cited “fit” and “comfort” as
the two most important evaluative criteria for clothing, while “brand name’ and “country of
origin” were the least important cues. Both Chinese and Taiwanese participants cited “friends”
to be their most important fashion information sources, with “siblings” and “parents” being the
two least important sources.
Keywords: consumer behaviour, apparel attributes, product choice, fashion innovativeness,
cross-national study
1. Introduction
According to the forecast of Economist Intelligence Unit (2014), the Taiwanese consuming
power is expected to grow from US$324.1 billion in 2013 to US$370.0 billion in 2018.
According to the Ministry of Economic Affairs, the retail sales in Taiwan increased 0.42
percent year-on-year in October of 2016, and average 3.06 percent from 2010 to 2016.
The economic growth in Taiwan is partly due to the increase of tourists from mainland China
since the signing of Economic Cooperation Framework Agreement (ECFA) in 2010. In
addition to the retail sales, e-commerce in Taiwan has experiencing tremendous growth due
to the high internet penetration and widespread of smartphone usage.
In China, the GDP growth rate was 6.9 percent in 2015 (National Bureau of Statistics of
China, 2016). The total retail sales of consumer goods increased from RMB10.8 or US$1.56
trillion in 2008 to RMB20.7 or US$3.00 trillion in 2012. According to the report published
by the China Internet Watch (2016), China is expected to surpass the U.S. to become the
world’s largest consumer market in 2016. Moreover, China is the largest e-commerce market
with total sales of US$899 billion in 2016, which is almost half of the total global e-
commerce sales.
Due to the sound and steady economic growth in Taiwan and China (National Bureau of
Statistics of China, 2016; Fung Business Intelligence Centre, 2014), it is imperative for both
domestic and multinational retailers to understand their consumers in order to develop
appropriate products and effective strategies to meet their needs and aspirations. Although the
Gross Domestic Product (GDP) per capita of Taiwan (US$46,783.00) was substantially
higher than mainland China (US$14,107.43) in 2015 (International Monetary Fund, 2016),

China has undergone significant economic transformation (Lu 2004, Rahman et al. 2010) due
to the globalization and the advancement of communication technology. It is reasonable to
believe that the changing socio-economic landscape in China could play an influential role in
narrowing the inequality gap between China and Taiwan. However, there are relatively few
empirical studies (e.g., Goldsmith et al. 1993, Kim et al. 2002, Rahman et al. 2010) that have
examined this research topic, particularly from the “Greater China” perspective. Our research
seeks to enrich our understanding of consumer preferences and behaviours in two different
socio-economic contexts, and the reasons why China and Taiwan were selected was because
there are significant differences in their social, political and economic conditions (Rahman et
al. 2010, Hofstede 1984) while also sharing many similarities.
The remaining portion of this paper is organized as follows. We review previous literature
related to consumer shopping behaviour and demographics (gender and age), the significance
of fashion information sources and the role of product evaluative cues. Our proposed research
questions are also included. Research methodology, and discussions of the results are presented
in the following two sections respectively. This is followed by the conclusion and implications,
and in the final section, limitations and further research are reported and suggested.
2. Literature review and research questions
2.1 Demographics
Many consumer behaviour studies (Bakewell and Mitchell 2006, Bakewell et al. 2006, Lee et
al. 2005, Noble et al. 2006, Wilhelm and Mottner 2005) have investigated the impact of
demographic variables such as gender, age, education, income level and family size. In
particular, gender and age have been identified as important factors in many consumer research
studies (Campbell 1997, Chen-Yu and Seock 2002, Seock and Bailey 2008). For example,
Bohdanowicz and Clamp (1994) pointed out that gender is a significant factor affecting an
individual’s choice of clothing, and Behling (1985-1986) suggested that age plays a critical
role in the fashion adoption process. Therefore, the present study was primarily focused on
these two demographic variables: gender and age.
2.1.1 Gender and apparel shopping behaviours – frequency and time spent
According to a study conducted by McCracken and Roth (1989), women were significantly
more astute than men in decoding and interpreting the syntax of clothing. Many studies (Chen-
Yu and Seock 2002) have revealed that female consumers shopped significantly more often,
and spent more money, on clothing than males. Hart et al. (2007) found that many female
shoppers visited more stores during a single shopping excursion than men. Many women
enjoyed shopping because they viewed it as a leisure activity and a means for self-gratification.
However, according to more recent research studies (Ross 2011, Seo 2009, Sindicich and Black
2011), men are becoming increasingly more involved with fashion. Today’s male consumers
are more fashion conscious and concerned with their appearance than in previous generations.
A study on fashion consciousness (Parker et al. 2004) found that while female American and
Japanese teenagers tended to be more fashion conscious than males, this gender effect did not
apply to the Chinese sample. According to our literature review, the results of gender effects
are inconclusive among studies and across nations. Due to insufficient literature and
inconclusive findings, research questions were put forth instead of hypotheses for the current
study. The following research questions were posed to further investigate the gender effects on
apparel shopping behaviours:
RQ1a: What effects does gender have on the frequency and time spent on apparel shopping at
the brick-and-mortar stores in China?
RQ1b: What effects does gender have on the frequency and time spent on apparel shopping at
the brick-and-mortar stores in Taiwan?
2.1.2 Gender and online apparel shopping behaviours
In terms of online shopping behaviours, a number of studies (Kim and Kim 2004, Van den Poel
and Buckinx 2005, Wells and Chen 1999) have shown that gender was an important
demographic variable. Men are more interested in learning and navigating computer
technologies and have become more involved in downloading and making online purchases
than women (Dholakia and Chiang 2003, Van Slyke et al. 2002, Teo 2001). Several studies
(e.g., Allen 2001, Kwak et al. 2002) have also found that men are more likely to spend more
money and make a higher number of online purchases than women. A study of gender and e-
commerce (Rodgers and Harris 2003) revealed that men perceived online shopping as an
extremely convenient shopping mode than women, and had greater trust for this process.
However, other studies found that gender has no effect on online shopping behaviour
(Hernández-Ortega et al. 2011, Khare 2016). In addition, another study of gender differences
on information searches and purchase behaviours indicated that female college students had
more online apparel shopping experience than men (Seock and Bailey 2008). This could be
partly due to the fact that female consumers have a greater clothes consciousness and interest
in fashion than their male counterparts (Beaudoin et al. 2003, Pentecost and Andrews 2010).
RQ2a: What effects does gender have on the frequency and time spent with online shopping in
China?
RQ2b: What effects does gender have on the frequency and time spent with online shopping in
Taiwan?
In order to gain an understanding of the effects of gender from a cross-national/regional
perspective, we posed the following question:
RQ3: What are the differences regarding the effects of gender on the frequency of online and
offline apparel shopping and time spent between China and Taiwan?
2.1.3 Age and apparel shopping behaviours – frequency and time spent
Consumers in their 20s to 40s seem to be the most economically active, and they are more
likely to be involved with, and to spend more money on, new clothes than other age groups
(Workman and Studak 2006). Debnam and Svinos (2007) found that Chinese consumers in
their teens and 20s were further inclined to spend than to save as compared to their older
demographic cohorts. Indeed, younger Chinese women are relatively highly sophisticated and
fashion conscious, and many are willing to pay a higher price for imported goods and foreign
brands (Lee et al. 2004). Another study (Birtwistle and Moore 2006) conducted in the UK also
found that consumers between 16 and 24 years of age purchased new clothes more frequently
than other age groups, and this study also reported that the purchase rate would decline as
consumers aged. With this discussion, it is reasonable to suggest that age is associated with a
consumer’s shopping behaviour. Therefore, the following research questions regarding the
effects of age were posed for this study:
RQ4a: What effects does age have on the frequency and time spent on apparel shopping at the
brick-and-mortar stores in China?

RQ4b: What effects does age have on the frequency and time spent on apparel shopping at the
brick-and-mortar stores in Taiwan?
2.1.4 Age and online apparel shopping behaviours
In terms of online shopping, several studies (Allred et al. 2006, Mafé and Blas 2006) indicate
that age was a significant variable. Sorce et al. (2005) also reported that younger consumers
searched for more products online than their older counterparts. According to other studies,
(McFarland 2001, Yang and Folly 2008) age is a critical factor affecting consumer technology
adoption, usage and acceptance. However, some recent studies (Hernández-Ortega et al. 2011,
Khare 2016) report that demographic factors such as age had no effect on online shopping
behaviours. As Khare (2016) suggests that online shopping behaviour was influenced by the
frequency of Internet usage rather than age. The findings from previous research are
inconsistent and inconclusive; therefore, we raised the following questions for further
investigation:
RQ5a: What effects does age have on the frequency of online apparel shopping and time spent
in China?
RQ5b: What effects does age have on the frequency of online apparel shopping and time spent
in Taiwan?
RQ6: What are the differences regarding the effects of age on the frequency of online and
offline apparel shopping and time spent between Chinese and Taiwanese consumers?
2.2 Fashion information-seeking behaviours
Individuals often search for information from both internal and external sources. Internal
information sources about a product include the consumer’s memory, knowledge and past
experience. External information sources have been classified as personal/non-marketer
dominated sources (e.g., friends, parents) and impersonal/marketer-dominated sources (e.g.,
printed media, television commercials, etc.) (Barber et al. 2009, Seock and Bailey 2009). In
many shopping situations, consumers tended to rely more heavily on external information
sources: (1) when they evaluate a new or unfamiliar product; (2) if they don’t have adequate
knowledge about the product; or (3) some people do not have enough confidence nor ability to
evaluate similar alternatives. In this context, the current study primarily focused on external
information sources. Several prior studies (e.g., Lee 2014) show that both experts and novices engage in
information-seeking behaviours. Experts or experienced shoppers often acquire product-
related information to update and bolster their knowledge as well as to reduce their dependence
on others (Bettman and Park 1980). Pre-purchase information-search activities may help
consumers to identify a desirable product, enhance their buying decision, and/or reduce
uncertainty. However, due to the overwhelming amount of available information, consumers
are unlikely to conduct a fully comprehensive search or gather product information from every
available source. Thus, it is not difficult to understand why consumers often use convenient or
their preferred sources for seeking information. In order to discover which information source
is most important or more frequently used by consumers in China and Taiwan, the following
research questions were posed:
RQ7a: What fashion information sources play a more significant role in China?
RQ7b: What fashion information sources play a more significant role in Taiwan?
RQ7c: What are the differences regarding the significant role of fashion information sources
between Chinese and Taiwanese consumers?

2.3 Product evaluative cues
Consumers may hold different preferences for certain types of products in their memory. In
order to design and develop products to satisfy diverse consumer groups, a company should
acquire knowledge about their consumers’ needs and preferences with respect to what the
product offers. According to some studies (Beaudoin and Lachance 2006, Li and Xiao 1999,
Zhang et al. 2002) conducted in China, older consumers are more pragmatic and price
conscious, whereas younger consumers are more concerned with clothing styles and brand
names. The salient impact of product cues may vary among consumers depending on their
personal needs, and socio-economic contexts. Prior research studies (e.g., Rahman 2011) have
dichotomized the product cues into two types – intrinsic and extrinsic. Intrinsic cues refer to
those attributes directly attached to the physical product such as colour, style, fabric and fit,
while extrinsic cues ascribe to those intangible attributes which are indirectly attached to the
product such as price, brand name and country of origin. In order to gain an understanding of
consumer choice and preference from a cross-cultural perspective, eleven product cues were
selected for the present study. The selection criteria for these product cues were based on the
guidelines of numerous apparel studies (e.g., Rahman 2011, Rahman et al. 2009) such as the
relevancy, importance and frequency. In order to understand the effects of product cues, the
following research question is posed:
RQ8a: What product cues play a more significant role in apparel evaluation in China?
RQ8b: What product cues play a more significant role in apparel evaluation in Taiwan?
RQ8c: What are the differences regarding the significance of apparel evaluative cues between
Chinese and Taiwanese consumers?
3. Research methodology
3.1 Questionnaire survey
A questionnaire survey consisting of three sections was developed and used for the present
study. The first section of questions covered two areas: (1) the importance of product evaluative
cues; and (2) fashion information sources. In total, twelve apparel product cues and eleven
fashion information sources were selected to investigate the significance of product-evaluative
cues and information source(s) for clothing consumption. A five-point Likert-type response
scale (5 = strongly agree or very important to 1 = strongly disagree or unimportant) was used
for this section. The inclusion and exclusion of product cues and fashion information source
on the list were based on several prior fashion research studies (Eckman et al., 1990; Rahman
et al., 2010, Rahman 2011), and also determined by four judges (two fashion practitioners and
two fashion professors) to ensure cross-national appropriateness and relevancy. This validation
process among the judges was important to improve the effectiveness of the instrument. The
second section focused on consumer shopping behaviours such as apparel spending, shopping
channels (online versus offline) and shopping frequencies. The third section was designed to
collect demographic data including age, gender, income level, occupation and marital status.
The questionnaire was developed in a simplified Chinese version for China and a traditional
Chinese version for Taiwan. Prior to the data collection, the questionnaire was pre-tested on
fifteen participants in each country to identify potential problems, misunderstandings and
ambiguities, and corresponding revisions and amendments were made (Rahman et al., 2010).
3.2 Data collection
In order to collect data and increase the response rate from different age groups (18-25 and 26-
33 years), a commercial online SurveyMonkey software program was used in both countries,

and data were collected from both genders in these two age groups. Kang and Park-Poaps
(2010) suggest that there are several advantages for employing online surveys, as they (1)
reduce coding time; (2) lower financial costs; (3) minimize coding errors; (4) foster greater
privacy; and (5) allow convenience for participants. The data of this survey was primarily
collected from convenience sampling through the assistance of acquaintances and friends in
China and Taiwan. Some responses were removed from the data sets due to irrelevant age (over
33 years old) and excessive missing data. In total, we received 338 usable questionnaires from
China and 151 from Taiwan for analysis. The result of unequal sample size could be partly due
to the population size of both countries.
4. Results
The Chinese sample was composed of 213 females (63.0%) and 125 males (37.0%), and the
Taiwanese sample was composed of 88 females (58.3%) and 63 males (41.7%). The difference
in gender distribution was obvious in both samples, although there were a slightly higher
proportion of men in the Taiwanese sample than the Chinese sample. Clearly, the participants
were predominately female. This may be attributed to the nature of the topic of study. As
Quigley and Notarantonio (2009) point out that women are more engaged and interested in
fashion than are their male counterparts. Moreover, the subjects from these two countries were
relatively young, with most of the participants falling between 18 and 25 years of age. The
mean age was 24.9 years and 24.7 years for the Chinese and Taiwanese respectively, and many
were students, as shown in Table 1.
China Taiwan
Frequency
(N=338)
Percent Frequency
(N=151)
Percent
Gender
Male 125 37.0 63 41.7
Female 213 63.0 88 58.3
No Response 0 0.0 0 0.0
Age
18-25 214 63.3 100 66.2
26-33 124 36.7 47 31.1
No Response 0 0.0 4 2.6
Mean Age 24.9 (n=338) 24.7 (n=147)
Employment status
Full-time Employed 116 34.2 58 38.4
Part-time Employed 6 1.8 3 2.0
Student 178 52.7 72 47.7
Other 38 11.3 18 11.9
No Response 0 0.0 0 0.0
Table 1. Demographic profile
4.1 Gender
4.1.1 China: gender effects in the frequency and time spent on apparel shopping (RQ1a &
RQ2a)
According to our findings, female consumers shopped more frequently and spent more time at
the brick-and-mortar stores than male consumers. For example, 25.8% of female consumers

(n=55) shopped for apparel over 15 times per year, as compared to only 4.8% of male
consumers (n=6). In addition, the vast majority of female consumers (n=110, 59.1%) shopped
at the mall for over 2 hours each time, while the majority of male consumers (n=93, 74.4%)
only spent 2 hours or less. These findings are consistent with previous studies (Hart et al. 2007,
Ross, 2011, Sindicich and Black 2011). Moreover, the results of the t-test revealed that there
was a significant difference in apparel shopping at the physical stores between male and female
consumers (t=-7.473, df=336, p=0.000), and there was also a significant variance on time spent
at the shopping mall between genders (t=-6.537, df=333, p=0.000), as shown in Table 2.
In terms of online apparel shopping, women shopped more frequently than men – e.g.,
29.1% (n=62) of women shopped more than 15 times per year as compared to 8% (n=10) for
men. Our t-test result also shows the significant difference in the frequency of online apparel
shopping between men and women (t=5.594, df=334, p=0.000). It is evident that Chinese
women are more involved in apparel shopping than men.
4.1.2 Taiwan: gender effects in the frequency and time spent on apparel shopping (RQ1b &
RQ2b)
In Taiwan, our findings also indicate that female consumers shopped relatively more frequently
than male consumers at the physical stores per year. In regards to online shopping, 54.7%
female shopped more than 3 times per year, as compared to 38.1% of male consumers.
According to the t-test analysis, there was significant difference in the frequency of both online
and offline (physical stores/shopping mall) shopping between males and females. However,
our t-test results do not show significant differences on the average time spent at the brick-and-
mortar stores, as well as online, between men and women (see Table 2 for all details). It is
logical to suggest that Taiwanese women are generally more involved in apparel shopping than
men, but they don’t necessarily spend more time in either offline or online activities when they
do shop.
Gender Male Female
M
SD
n
M
SD
n
95% CI for
mean difference
t
df
Frequency of apparel shopping
at physical stores per year
China 2.33 1.349 125 3.66 1.699 213 -1.679, -0.979 -7.473* 336
Taiwan 2.35 1.334 63 3.23 1.740 88 -1.395, -0.362 -3.359* 149
Frequency of online apparel
shopping each year
China 3.16 1.578 125 4.35 2.035 211 -1.603, -0.769 -5.594* 334
Taiwan 2.43 1.304 63 3.20 1.814 88 -1.305, -0.247 -2.900* 149
Average time spent at the
shopping mall each visit
China 2.11 0.930 124 2.75 0.816 211 -0.827, -0.445 -6.537* 333
Taiwan 2.19 0.859 63 2.22 0.890 88 -0.311, 0.261 -0.176 149
Average time spent in online
shopping each session
China 1.56 0.846 125 2.18 0.846 212 -0.813, -0.425 -6.282* 335
Taiwan 1.71 0.831 63 1.93 0.968 88 -0.516, -0.081 -1.442 149
* p < 0.05
Table 2. Effects of gender: t-test results of the frequency of apparel shopping and time spent
by country
4.1.3 Differences in the effects of gender of the frequency and time spent on apparel shopping
between China and Taiwan (RQ3)
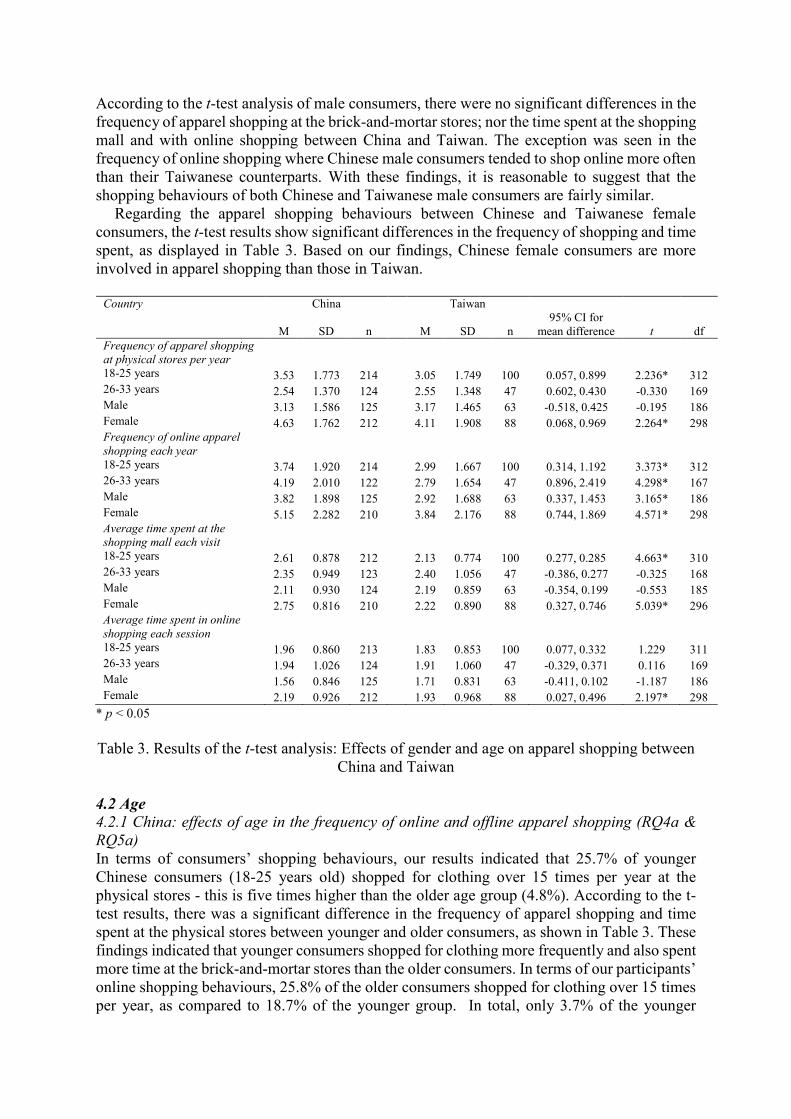
According to the t-test analysis of male consumers, there were no significant differences in the
frequency of apparel shopping at the brick-and-mortar stores; nor the time spent at the shopping
mall and with online shopping between China and Taiwan. The exception was seen in the
frequency of online shopping where Chinese male consumers tended to shop online more often
than their Taiwanese counterparts. With these findings, it is reasonable to suggest that the
shopping behaviours of both Chinese and Taiwanese male consumers are fairly similar.
Regarding the apparel shopping behaviours between Chinese and Taiwanese female
consumers, the t-test results show significant differences in the frequency of shopping and time
spent, as displayed in Table 3. Based on our findings, Chinese female consumers are more
involved in apparel shopping than those in Taiwan.
Country China Taiwan
M
SD
n
M
SD
n
95% CI for
mean difference
t
df
Frequency of apparel shopping
at physical stores per year
18-25 years 3.53 1.773 214 3.05 1.749 100 0.057, 0.899 2.236* 312
26-33 years 2.54 1.370 124 2.55 1.348 47 0.602, 0.430 -0.330 169
Male 3.13 1.586 125 3.17 1.465 63 -0.518, 0.425 -0.195 186
Female 4.63 1.762 212 4.11 1.908 88 0.068, 0.969 2.264* 298
Frequency of online apparel
shopping each year
18-25 years 3.74 1.920 214 2.99 1.667 100 0.314, 1.192 3.373* 312
26-33 years 4.19 2.010 122 2.79 1.654 47 0.896, 2.419 4.298* 167
Male 3.82 1.898 125 2.92 1.688 63 0.337, 1.453 3.165* 186
Female 5.15 2.282 210 3.84 2.176 88 0.744, 1.869 4.571* 298
Average time spent at the
shopping mall each visit
18-25 years 2.61 0.878 212 2.13 0.774 100 0.277, 0.285 4.663* 310
26-33 years 2.35 0.949 123 2.40 1.056 47 -0.386, 0.277 -0.325 168
Male 2.11 0.930 124 2.19 0.859 63 -0.354, 0.199 -0.553 185
Female 2.75 0.816 210 2.22 0.890 88 0.327, 0.746 5.039* 296
Average time spent in online
shopping each session
18-25 years 1.96 0.860 213 1.83 0.853 100 0.077, 0.332 1.229 311
26-33 years 1.94 1.026 124 1.91 1.060 47 -0.329, 0.371 0.116 169
Male 1.56 0.846 125 1.71 0.831 63 -0.411, 0.102 -1.187 186
Female 2.19 0.926 212 1.93 0.968 88 0.027, 0.496 2.197* 298
* p < 0.05
Table 3. Results of the t-test analysis: Effects of gender and age on apparel shopping between
China and Taiwan
4.2 Age
4.2.1 China: effects of age in the frequency of online and offline apparel shopping (RQ4a &
RQ5a)
In terms of consumers’ shopping behaviours, our results indicated that 25.7% of younger
Chinese consumers (18-25 years old) shopped for clothing over 15 times per year at the
physical stores - this is five times higher than the older age group (4.8%). According to the t-
test results, there was a significant difference in the frequency of apparel shopping and time
spent at the physical stores between younger and older consumers, as shown in Table 3. These
findings indicated that younger consumers shopped for clothing more frequently and also spent
more time at the brick-and-mortar stores than the older consumers. In terms of our participants’
online shopping behaviours, 25.8% of the older consumers shopped for clothing over 15 times
per year, as compared to 18.7% of the younger group. In total, only 3.7% of the younger

consumers and 2.4% of the older consumers had never shopped online. Thus, it is reasonable
to suggest that online shopping is one of the popular shopping modes in China. In addition, the
t-test results indicated that there was a significant difference in the frequency of online apparel
shopping per year (t=-2.011, df=334, p=0.000), but no significant difference in the average
time spent between younger and older consumers when shopping online (t=0.213, df=335,
p=0.831).
4.2.2 Taiwan: effects of age in the frequency of online and offline apparel shopping (RQ4b and
RQ5b)
According to the t-test results, there were no significant differences between younger and older
consumer groups in terms of the frequency of apparel shopping and time spent at the physical
stores as well as online (see Table 4).
Age Group Age: 18-25 Years Age: 26-33 Years
M
SD
n
M
SD
n
95% CI for
mean difference
t
df
Frequency of apparel shopping
at physical stores per year
China 3.53 1.773 214 2.54 1.370 124 0.624, 1.351 5.347* 336
Taiwan 3.05 1.749 100 2.55 1.348 47 -0.025, 1.018 1.721 145
Frequency of online apparel
shopping each year
China 3.74 1.920 214 4.19 2.010 122 -0.881, -0.887 -2.011* 334
Taiwan 2.99 1.667 100 2.79 1.654 47 -0.380, 0.785 0.690 145
Average time spent at the
shopping mall each visit
China 2.61 0.878 212 2.35 0.949 123 0.057, 0.461 2.525* 333
Taiwan 2.13 0.774 100 2.40 1.056 47 -0.618, 0.070 -1.775 145
Average time spent in online
shopping each session
China 1.96 0.860 213 1.94 1.026 124 -0.183, 0.228 0.213 335
Taiwan 1.83 0.853 100 1.91 1.060 47 -0.437, -0.267 -0.520 145
* p < 0.05
Table 4. Results of the t-test analysis: Effects of age on the frequency of apparel shopping
and time spent by country
4.2.3 Differences in the effects of age in the frequency of online apparel shopping between
China and Taiwan (RQ6)
According to the t-test analysis, there were significant differences in the frequency of
apparel shopping per year at the physical stores between Chinese and Taiwanese younger
consumer groups, but no significant difference between the older consumer groups. This
finding indicated that younger Chinese consumers tended to shop more frequently at the
physical stores than their Taiwanese counterparts. In terms of the frequency of online shopping
for apparel per year, our t-test results (as shown in Table 4) show significant differences
between Chinese and Taiwanese consumers of both age groups. In addition, the t-test results
show significant differences on average time spent at the shopping mall between the younger
Chinese and Taiwanese consumers, but no significant difference were found between the older
age groups. Interestingly enough, there is no significant difference on average time spent in
online shopping between Chinese and Taiwanese consumers of both age groups. Although
Chinese consumers shopped online more frequently than the Taiwanese of both age groups,
the average time spent online was similar.

4.3 Sources of fashion information
4.3.1 China and Taiwan: the significance of fashion information sources (RQ7a, 7b and 7c)
“Friends”, “store/window displays,” and the “Internet” (e-retailer websites) were ranked as the
top three sources by the Chinese consumers according to the value of mean. In terms of
impersonal source of information, a study conducted by Seock and Bailey (2009) also found
that many consumers were relied on the in-store displays. While Taiwanese consumers
considered “friends” as the most important fashion information source, “people on the street,”
and magazines” followed as their second and third choices. Both Chinese and Taiwanese
consumers ranked other personal sources such as “parents” and “siblings” to be their least
important sources, as shown in Table 5. According to our t-test analysis, there were significant
differences in the choice of “friends,” “people on the street,” “celebrities,” and “television”
between the Chinese and Taiwanese consumers, the latter relying more heavily on these
sources to search for fashion information than their Chinese counterparts.
Country China Taiwan
M
SD
n
M
SD
n
95% CI for
mean difference
t
df
Friends 3.98 1.031 337 4.25 0.824 151 -0.453, -0.079 -2.794* 486
Store/window displays 3.88 0.995 337 3.77 0.976 151 -0.074, 0.306 1.198 486
Internet: e-retailer websites 3.74 1.026 337 3.64 1.106 151 -0.099, 0.300 0.986 486
People on the street 3.72 1.014 337 3.93 0.943 151 -0.401, -0.019 -2.158* 486
Advertisements/billboards 3.70 1.021 337 3.69 0.960 151 -0.178, 0.207 0.148 486
Magazines 3.68 1.037 337 3.87 1.011 151 -0.383, 0.013 -1.837 486
Internet: fashion blogs 3.51 1.168 337 3.55 1.106 151 -0.260, 0.182 -0.349 486
Celebrities 3.40 1.174 337 3.67 1.094 151 -0.492. -0.050 -2.410* 486
Television 3.23 1.141 337 3.67 1.075 151 -0.656, -0.225 -4.011* 486
Siblings 3.11 1.291 337 3.28 1.239 151 -0.411. 0.080 -1.325 486
Parents 2.97 1.178 337 2.87 1.237 151 -0.130, 0.330 0.852 486
* p < 0.05
Table 5. The significance and effects of fashion information sources
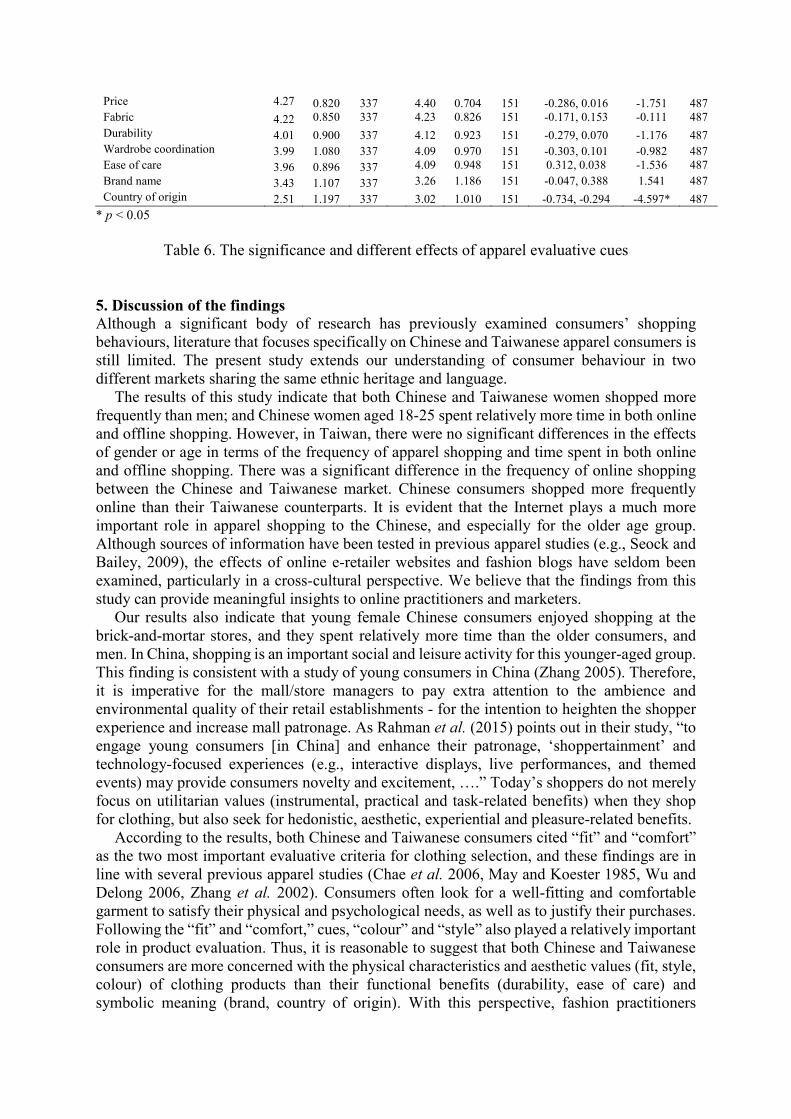
4.4 Apparel evaluative cues
4.4.1 China and Taiwan: the significance of product evaluative cues (RQ8a, 8b and 8c)
As shown in Table 6, it is evident that “fit” and “comfort” were perceived to be the two most
important product cues for clothing evaluation by participants of both countries.
“Quality/workmanship” was ranked as the third most important factor by Chinese consumers,
followed by “colour” and “style,” whereas the Taiwanese consumers ranked “price” as the third
most important cue, followed by “style” and “colour.” It is interesting to note that the Chinese
and Taiwanese both perceived “ease of care,” “brand name,” and “country of origin” as the
three least important evaluative cues. According to the t-test results, there were significant
differences in the “quality/workmanship” and “country of origin” cues. Our results showed that
the functional variables (e.g. fit, comfort, durability) and symbolic/aesthetic variables (e.g.
style, colour and brand name) played a similar role in clothing evaluation regardless of socio-
economic differences between China and Taiwan.
Country China Taiwan
M
SD
n
M
SD
n
95% CI for
mean difference
t
df
Fit 4.61 0.764 337 4.58 0.707 151 -0.110, 0.177 0.456 487
Comfort 4.52 0.728 337 4.44 0.660 151 -0.062, 0.210 1.069 487
Quality/workmanship 4.51 0.681 337 4.11 0.801 151 0.267, 0.544 5.756* 487
Colour 4.38 0.847 337 4.26 0.892 151 -0.049, 0.282 1.385 487
Style 4.29 0.865 337 4.33 0.806 151 -0.201, 0.125 -0.461 487
Price 4.27 0.820 337 4.40 0.704 151 -0.286, 0.016 -1.751 487
Fabric 4.22 0.850 337 4.23 0.826 151 -0.171, 0.153 -0.111 487
Durability 4.01 0.900 337 4.12 0.923 151 -0.279, 0.070 -1.176 487
Wardrobe coordination 3.99 1.080 337 4.09 0.970 151 -0.303, 0.101 -0.982 487
Ease of care 3.96 0.896 337 4.09 0.948 151 0.312, 0.038 -1.536 487
Brand name 3.43 1.107 337 3.26 1.186 151 -0.047, 0.388 1.541 487
Country of origin 2.51 1.197 337 3.02 1.010 151 -0.734, -0.294 -4.597* 487
* p < 0.05
Table 6. The significance and different effects of apparel evaluative cues
5. Discussion of the findings
Although a significant body of research has previously examined consumers’ shopping
behaviours, literature that focuses specifically on Chinese and Taiwanese apparel consumers is
still limited. The present study extends our understanding of consumer behaviour in two
different markets sharing the same ethnic heritage and language.
The results of this study indicate that both Chinese and Taiwanese women shopped more
frequently than men; and Chinese women aged 18-25 spent relatively more time in both online
and offline shopping. However, in Taiwan, there were no significant differences in the effects
of gender or age in terms of the frequency of apparel shopping and time spent in both online
and offline shopping. There was a significant difference in the frequency of online shopping
between the Chinese and Taiwanese market. Chinese consumers shopped more frequently
online than their Taiwanese counterparts. It is evident that the Internet plays a much more
important role in apparel shopping to the Chinese, and especially for the older age group.
Although sources of information have been tested in previous apparel studies (e.g., Seock and
Bailey, 2009), the effects of online e-retailer websites and fashion blogs have seldom been
examined, particularly in a cross-cultural perspective. We believe that the findings from this
study can provide meaningful insights to online practitioners and marketers.
Our results also indicate that young female Chinese consumers enjoyed shopping at the
brick-and-mortar stores, and they spent relatively more time than the older consumers, and
men. In China, shopping is an important social and leisure activity for this younger-aged group.
This finding is consistent with a study of young consumers in China (Zhang 2005). Therefore,
it is imperative for the mall/store managers to pay extra attention to the ambience and
environmental quality of their retail establishments - for the intention to heighten the shopper
experience and increase mall patronage. As Rahman et al. (2015) points out in their study, “to
engage young consumers [in China] and enhance their patronage, ‘shoppertainment’ and
technology-focused experiences (e.g., interactive displays, live performances, and themed
events) may provide consumers novelty and excitement, ….” Today’s shoppers do not merely
focus on utilitarian values (instrumental, practical and task-related benefits) when they shop
for clothing, but also seek for hedonistic, aesthetic, experiential and pleasure-related benefits.
According to the results, both Chinese and Taiwanese consumers cited “fit” and “comfort”
as the two most important evaluative criteria for clothing selection, and these findings are in
line with several previous apparel studies (Chae et al. 2006, May and Koester 1985, Wu and
Delong 2006, Zhang et al. 2002). Consumers often look for a well-fitting and comfortable
garment to satisfy their physical and psychological needs, as well as to justify their purchases.
Following the “fit” and “comfort,” cues, “colour” and “style” also played a relatively important
role in product evaluation. Thus, it is reasonable to suggest that both Chinese and Taiwanese
consumers are more concerned with the physical characteristics and aesthetic values (fit, style,
colour) of clothing products than their functional benefits (durability, ease of care) and
symbolic meaning (brand, country of origin). With this perspective, fashion practitioners

should prioritize their resources and pay additional attention to product research and
development (e.g., creative design and fit engineering) to satisfy their consumers’ physical and
psychological needs. Due to similar responses from both samples, we believe that standardized
or universal products can be designed and developed for the Chinese and Taiwanese markets.
Both Chinese and Taiwanese participants cited “friends” to be their most important fashion
information source, while “siblings” and “parents” were the two least important sources. These
findings are in line with consumer-socialization theory (Bearden and Randall 1990), for as
children mature and enter adulthood, parental influence decreases while peer-group influence
increases. A study of apparel shopping behaviours conducted by Koester and May (1985) also
found that parental influence on clothing selection decreased as pre-adolescents aged, and peer
and media influences increased. In addition, another study (Chen-Yu and Seock 2002) revealed
that friends were the most important source of fashion information for apparel purchases by
adolescents.
Other than “friends”, the Internet also played a relatively more important role for the
Chinese shoppers. However, many Taiwanese consumers were more reliant on what people
wore on the street, or from magazines for fashion information than from online sources. This
finding echoes the results on the frequency and time spent of apparel shopping behaviour –
Chinese consumers were more involved in online shopping than their Taiwanese counterparts.
These findings underscore at least two important implications for fashion practitioners. First,
given that “friends” are cited by both Chinese and Taiwanese consumers as the most important
fashion information source, it is reasonable to believe that fashion leaders could play an
influential role through their personal network. Therefore, it is important for fashion
practitioners to identify and communicate with fashion leaders because their word-of-mouth
influences could greatly affect other people’s perceptions toward a brand/product. Second, due
to the salient impact of the Internet (particularly for Chinese shoppers), fashion e-retailers
should constantly update and improve their website in order to maximize effective
communications and build stronger connections with online shoppers. For example, garment
style and comfort can be communicated through utilizing a variety of online videos, visual
images and textual information. In addition to clothing style, many consumers are concerned
about how clothing will look on their body, therefore, 3D model and product viewing in
different angles (rotating, zooming and flipping) could play an important role in product
evaluation and decision-making processes.
6. Conclusion
E-commerce has rapidly transformed Chinese consumers’ shopping behaviour and
experiences. It is evidence that e-commerce plays a very important role in today’s consumer
market, particularly in China. For example, China’s e-commerce giant Alibaba has broken its
'Singles Day' online sales record with $17.8 billion just in one day (Weise, 2016). Due to the
tremendous growth of online sales, Amazon’s Prime has made their shipping program available
to their consumers in China since October 28th, 2016 (Jing, 2016). With such perspective, it is
reasonable to believe that Chinese consumers will continue to use online shopping agents to
look for good deals, as well as desirable and exotic merchandises to fulfil their needs. Although
e-commerce has been growing rapidly, the return of merchandises is inevitable. In order to
reduce apparel returns, it is important for the fashion practitioners to provide well-fitted and
comfortable clothing to their consumers in addition to affordable price and fashionable style.
In general, young Chinese consumers enjoy spending time in the brick-and-mortar stores for
various reasons – personal shopping, hanging out with friends, and browsing the stores as
leisure activity. However, older consumers may not want to spend a substantial amount of time
in the stores or shopping malls due to their busy lifestyle. It is reasonable to suggest that they
are relatively more task-oriented when it comes to shopping, therefore, online shopping or
convenience shopping deem to be an important factor to the older demographics in China.
Therefore, product placement in relevant shopping channels is critical, and there is no “one-
size-fit-all” strategies for different genders, age groups and cultures.
In order to be successful in today’s marketplace, fashion practitioners must pay attention to
consumer specific needs; identify the significant role of different product attributes; monitor
and identify the shifting paradigm of consumer taste and shopping habit; and discover what
design features of a product may trigger particular cognitive and affective responses among
Chinese consumers in different regions and countries.
7. Limitations and future research
The present study has a number of limitations as many studies have. First, the sample size of
Taiwan is relatively small. Second, the findings cannot be legitimately generalized to fit all
Asian countries. More similar research will be required in other parts of the Asian region to
increase validity and reliability. Third, the effects of fashion information sources and product
evaluative cues could be varied among different product types. Therefore, it would be
increasingly meaningful to conduct additional research using different consumer goods
products. Fourth, the majority of the data was collected from a younger demographic; therefore,
the results of this study lacked generalization to other market segments or cohorts from X-
generation, baby boomer and senior demographic groups. Fifth, qualitative approaches such as
interview and ethnographic research could be employed to offer in-depth information and
insight to actual shopping experiences.
References
Allen, D. (2001). E-Marketer: women on the web. Available at:
http://www.ebusinessforum.com/analysis/ecommerce_b2c/20010228_b2c.html
Allred, C.R., Smith, S.M. and Swinyard, W.R. (2006). E-shopping lovers and fearful
conservatives: A market segmentation analysis. International Journal of Retail and
Distribution Management, 34(4/5): 308-333.
Bakewell, C. and Mitchell, V.W. (2006). Male versus female consumer decision making styles.
Journal of Business Research, 59: 1297-1300.
Bakewell, C., Mitchell, V. and Rothwell, M. (2006). UK Generation Y male fashion
consciousness. Journal of Fashion Marketing and Management, 10: 169-180.
Barber, N., Dodd, T.H. and Kolyesnikova, N. (2009). Gender differences in information search:
Implications for retailing. Journal of Consumer Marketing. 26: 415-426.
Bearden, W. and R. Randall. (1990). Attention to social comparison information: An individual
difference factor affecting consumer conformity. Journal of Consumer Research, 16: 461-471.
Beaudoin, P. and Lachance, M.J. (2006). Determinants of adolescents’ brand sensitivity to
clothing, Family and Consumer Sciences Research Journal, 36(4): 312-331.

Beaudoin, P., Lachance, M.J. and Robitaille, J. (2003), Fashion innovativeness, fashion
diffusion and brand sensitivity among adolescents, Journal of Fashion and Marketing
Management, 7(1): 23-30.
Beaudoin, P., M. Moore and R. Goldsmith. 2000. Fashion leaders’ and followers’ attitudes
toward buying domestic and imported apparel. Clothing and Textiles Research Journal, 18:
56-64.
Behling, D. (1985-86), Fashion change and demographics: A model, Clothing and Textiles
Research Journal, 4(1): 18-24.
Bettman, J.R. and Park, C.W. (1980). Effects of prior knowledge and experience and phase of
the choice process on consumer decision processes: A protocol analysis. Journal of Consumer
Research, 7: 234-248.
Birtwistle, G. and Moore, C.M. (2006). Fashion innovativeness in the UK: A replication study.
ANZMAC 2016 Conference Proceedings, Brisbane, Queensland, Australia.
Bohdanowicz, J. and Clamp, L. (1994). Fashion Marketing, New York: Routledge.
Brislin, R.W. (1986). The wording and translation of research instruments. In Lonner, W.J. and
Berry, J.W. (eds), Field Methods in Cross-cultural Research: Cross-cultural Research
Methodology Series. Thousand Oaks, CA: Sage, Vol. 8, pp. 137-164.
Campbell, C. (1997). Shopping, pleasure, and the sex war. In P. Falk and C. Campbell (eds.)
The Shopping Experience, pp. 166-175. Sage, London.
Chae, M.-H., Black, C. and Heitmeyer, J. (2006). Pre-purchase and post-purchase satisfaction
and fashion involvement of female tennis wear consumers. International Journal of
Consumer Studies, 30(1): 25-33.
Chen, L. and Sakaguchi, T. (2000). Data mining methods, applications, and tools. Information
Systems Management, 17(1): 65.
Chen-Yu, J. and Y.-K., Seock. 2002. Adolescents’ clothing purchase motivations, information
sources, and store selection criteria: A comparison of male/female and impulse/nonimpulse
shoppers. Family and Consumer Sciences Research Journal, 31: 50-77.
China Internet Watch 2016. China to become the world’s largest retail market in 2016, China
Internet Watch, September 28. Available at:
https://www.chinainternetwatch.com/18977/ecommerce-2015-2020/
Crocker, G. and Tay, Y.-C. (2004). What it takes to create a successful brand. The China
Business Review, 31(4): 10-16.
Cui, G. (1999). Segmenting China’s consumer market: a hybrid approach. Journal of
International Consumer Marketing, 11(1): 55-76.

Debnam, N., and Svinos, G. (2007). Luxury brands in China, KPMG, available at:
http://www.kpmg.com.cn/en/virtual_library/Consumer_markets/CM_Luxury_brand.pdf
Dholakia, R.R. and Chiang, K.P. (2003). Shoppers in cyberspace: are they from Venus or Mars
and does it matter? Journal of Consumer Psychology, 13: 171-176.
Eckman, M., Damhorst. M.L., and Kadolph, S.J. (1990). Toward a model of the in-store
purchase decision process: consumer use of criteria for evaluating women’s apparel, Clothing
and Textiles Research Journal, 8(2): 13-22.
Economist Intelligence Unit 2014. Taiwan country forecast, July. Available at:
http://country.eiu.com/taiwan
Eicher, J., Evenson, S. and Lutz, H. (2000). The Visible Self, Fairchild Publications, New York.
France, T., Yen, D., Wang, J.C. and Chang, C.-M. (2002). Integrating search engines with data
mining for customer-oriented information search, Information Management & Computer
Security, 10(5): 242-254.
Fung Business Intelligence Centre 2014. Asia market update: Distribution & Retail, The Fung
Group, October, (2): 1-39. Available at: http://www.funggroup.com/eng/knowledge/research/
AsiaDistributionRetail _October14.pdf
Gatignon, H. and T. Robertson. 1991. Innovative decision processes, in Robertson, T.S. and
Kassarjian, H.H. (Eds), Handbook of Consumer Behaviour. 316-348. Prentice-Hall,
Englewood Cliffs, NJ.
Goldsmith, R. and L. Flynn. 2004. Psychological and behavioral drivers of online clothing
purchase. Journal of Fashion Marketing and Management, 8: 84-95.
Goldsmith, R., J. Freiden and J. Kilsheimer. 1993. Social values and female fashion leadership:
A cross-cultural study. Psychology and Marketing, 10: 399-412.
Hart, C., Farrell, A., Stachow, G., Reed, G. and Cadogan, J. (2007). Enjoyment of the shopping
experience: impact on consumers’ repatronage intentions and gender influence. The Service
Industries Journal, 27: 583-604.
Hernández-Ortega, B., Jiménez-Martinez, J. and Martin DeHoyos, M. (2011). Age, gender and
income: Do they really moderate online shopping behaviour? Online Information Review,
35(1): 113-133.
Hofstede, G.H. (1984). Culture’s Consequences. Beverly Hills, CA: Sage Publications.
Hyllegard, K., Eckman, M., Descals, A.M. and Borja, M.A.G. (2005). Spanish consumers’
perceptions of US apparel speciality retailers’ products and services. Journal of Consumer
Behaviour, 4(5): 345-362.
International Monetary Fund (2016). World Economic Outlook Database. International
Monetary Fund. Available at: https://www.imf.org/external/pubs/ft/weo/2015/01/weodata/
index.aspx

Jing, M. (2016). Amazon launches new shipping program in China, China Daily, October 29.
Available at: http://www.chinadaily.com.cn/business/2016-10/29/content_27213674.htm
Jordaan, Y. and M. Simpson. 2006. Consumer innovativeness among females in specific
fashion stores in the Menlyn shopping centre. Journal of Family Ecology and Consumer
Science, 34: 32-40.
Kang, J. and Park-Poaps, H. (2010). Hedonic and utilitarian shopping motivations of fashion
leadership, Journal of Fashion Marketing and Management, 14(2): 312-328.
Khare, A. (2016). Consumer shopping styles and online shopping: An empirical study of Indian
consumers, Journal of Global Marketing, 29(1): 40-53.
Kim, E.Y. and Kim, Y. (2004). Predicting online purchase intentions for clothing products.
European Journal of Marketing, 38: 883-897.
Koester, A. and J. May. 1985. Clothing purchase practices of adolescents. Home Economics
Research Journal, 13: 227-236.
Kwak, H., Fox, R.J. and Zinkhan, G.M. (2002). What products can be successfully promoted
and sold via the Internet? Journal of Advertising Research, 42: 23-38.
Lam, C.M. (1997). A cultural perspective of the study of Chinese adolescent development,
Child and Adolescent Social Work Journal, 14: 85-113.
Lee, J.S.Y., Yau, O.H.M., Chow, R.P.M., Sin, L.Y.M., and Tse, A.C.B. (2004), Changing roles
and values of female consumers in China, Business Horizon, 47(3): 17-22.
Lee, S.H. (2014). The role of consumers’ network positions on information-seeking behaviour
of experts and novices: a power perspective. Journal of Business Research, 67: 2853-2859.
Lee, S.L., Ibrahim, M.F. and Hsueh-Shan, C. (2005). Shopping-centre attributes affecting male
shopping behaviour. Journal of Retailing and Leisure Property, 4: 324-340.
Li, H. and Xiao, J.J. (1999). Chinese consumer types, Journal of Consumer Studies & Home
Economics, 23(3): 171-180.
Liu, S.S. and Chen, J. (2009). Using data mining to segment healthcare markets from patients’
preference perspectives, International Journal of Health Care Quality Assurance, 22(2): 117-
134.
Lu, X. (2004). Consumption and ambivalent attitudes of Chinese young elite towards
occidental luxury goods: An exploratory study, American Marketing Association, winter, 219-
227.
Mafé, C.R. and Blas, S.S. (2006). Explaining Internet dependency: An exploratory study of
future purchase intention of Spanish Internet users. Internet Research, 16(4): 380-397.
May, J.K. and Koester, A.W. (1985). Clothing purchase practices of adolescents. Home
Economics Research Journal, 13(3): 226-236.

McCracken, G. and V. Roth (1989), Does clothing have a code? Empirical findings and
theoretical implications in the study of clothing as a means of communication, International
Journal of Research in Marketing, 6(1): 13-33.
McFarland, D.J. (2001). The role of age and efficacy on technology acceptance: Implications
for e-learning, Proceeding of Web Net 2001 World Conference WWW and Internet, Orland,
FL.
Ministry of Economic Affairs 2016. Ministry of Economic Affairs, Republic of China.
Available at: https://www.moea.gov.tw/Mns/english/home/English.aspx
Narang, R. 2010. Psychographic segmentation of youth in the evolving Indian retail market.
The International Review. Distribution and Consumer Research, 20: 535-557.
National Bureau of Statistics of China 2016. China’s economy realized a moderate but stable
and sound growth in 2015, National Bureau of Statistics of China, January 19. Available at:
http://www.stats.gov.cn/english/PressRelease/201601/t20160119_1306072.html
Noble, S., Griffith, D. and Adjei, M. (2006). Drivers of local merchant loyalty: Understanding
the influence of gender on shopping motives. Journal of Retailing, 82: 177-188.
Oates, B., Shufeldt, L. and Vaught, B. (1996). A psychographic study of the elderly and retail
store attributes. Journal of Consumer Marketing, 13(6): 14-27.
Parker, S.P., Hermans, C.M. and Schaefer, A.D. (2004), Fashion consciousness of Chinese,
Japanese and American teenagers, Journal of Fashion Marketing and Management, 8(2): 176-
186.
Pentecost, R. and Andrews, L. (2010). Fashion retailing and the bottom line: The effects of
generational cohorts, gender, fashion fanship, attitudes and impulse buying on fashion
expenditure. Journal of Retailing and Consumer Services, 17: 43-52.
Pereira, A., Hsu, C.-C. and Kundu, S. (2002). A cross-cultural analysis of ethnocentrism in
China, India, and Taiwan. Journal of International Consumer Marketing, 15(1): 77-90.
Rahman, O. 2011. Understanding consumers’ perceptions and behaviour: Implications for
denim jeans design. Journal of Textile and Apparel, Technology and Management, 7: 1-16.
Rahman, O., Wong, K.K.-K. and Hong, Y. (2016). The effects of mall personality and
fashion orientation on shopping value and mall approach behaviour among Chinese shoppers.
Journal of Retailing and Consumer Services, 28: 155-164.
Rahman, O., J. Yan and W.-S., Liu. 2009. Evaluative criteria for sleepwear: A study of
privately consumed product in the People’s Republic of China. International Journal of
Fashion Design, Technology and Education, 2, 81-90.
Rahman, O., Yan, J. and Liu, W.-S. (2010). Evaluative criteria of denim jeans: A cross-
national study of functional and aesthetic aspects. The Design Journal, 13(3): 291-311.

Raicu, D.S. (2010). Data mining framework for target marketing. Available at:
http://facweb.cs.depaul.edu/research/vc/publications/C-262.pdf
Rodgers, S. and Harris, M.A. (2003). Gender and e-commerce: an exploratory study. Journal
of Advertising Research, 43: 322-329.
Ross, F. (2011). Contemporary men’s fashion and new technology; shifting perceptions of
masculinity, menswear aesthetics and consumption, Fashion Colloquia, London College of
Fashion, London.
Seo, J.I. (2009). College men’s casual wear shopping behaviours: an investigation of the
relationship between product involvement and brand commitment, Proceedings of the Annual
Meeting of the Association of Collegiate Marketing Educations, pp. 44-45.
Seock, Y.-K. and Bailey, L.R. (2008). The influence of college students’ shopping orientations
and gender differences on online information searches and purchase behaviours, International
Journal of Consumer Studies, 32: 113-121.
Seock, Y.-K. and Bailey, L.R. (2009). Fashion promotions in the Hispanic market: Hispanic
consumers’ use of information sources in apparel shopping, International Journal of Retail &
Distribution Management, 37(2): 161-181.
Shaw, M.J., Subramaniam, C., Tan, G.W. and Welge, M.E. (2001). Knowledge management
and data mining for marketing, Decision Support Systems, 31: 127-137.
Sindicich, D. and Black, C. (2011). An assessment of fit and sizing of men’s business clothing,
Journal of Fashion Marketing and Management, 15(4): 446-463.
Sorce, P. Perotti, V. and Widrick, S. (2005). Attitude and age differences in online buying.
International Journal of Retail and Distribution Management, 33(2): 122-132.
Teo, T. (2001). Demographic and motivation variables associated with Internet usage activities,
Internet Research: Electronic Networking Applications and Policy, 11(2): 125-137.
Triandis, H.C., McCusker, C., and Hui, C.H. (1990). Multimethod probes of individualism and
collectivism, Journal of Personality and Social Psychology, 59: 1006-1020.
Weise, E. (2016). Alibaba sale nets $17.8 billion in 24 hours. USA Today, November 11.
Available at: http://www.usatoday.com/story/tech/news/2016/11/11/alibaba-singles-day-jack-
ma-2016-sale/93639376/
Van den Poel, D. and Buckinx, W. (2005). Predicting online-purchasing behaviour. European
Journal of Operational Research, 166(2): 557-575.
Van Slyke, C., Comunale, C.L. and Belanger, F. (2002). Gender differences in perceptions of
web-based shopping, Communications of the ACM, 45(8): 82-86.
Wilhelm, W. and Mottner, S. (2005). Teens and shopping mall preferences: A conjoint analysis
approach to understanding the generational shift toward an experience economy. Journal of
Shopping Centre Research, 12: 23-52.

Wong, N.Y. and Ahuvia, A.C. (1998). Personal taste and family face: Luxury consumption in
Confucian and Western societies, Psychology and Marketing, 15(5): 423-441.
Wu, J. and Delong M. (2006). Chinese perceptions of Western-branded denim jeans: A
Shanghai case study. Journal of Fashion Marketing and Management, 10(2): 238-250.
Xu, B.Y. (1990). Marketing to China: One Billion New Customers. Lincolnwood, IL: NTC
Business Books.
Zhang, G.J. (2005). Youth trends in China. Young Consumers, 6(2): 28-33.
Zhang, Z., Li. Y., Gong, C. and Wu, H. (2002), Casual wear product attributes: a Chinese
consumers’ perspective, Journal of Fashion Marketing and Management, 6(1): 53-62.