vibration analysis technology
TRANSCRIPT

7/28/2019 Vibration Analysis Technology
http://slidepdf.com/reader/full/vibration-analysis-technology 1/3
Machine Diagnostics IncorporatedPO Box 1003 Americus, Georgia 31709229-924-3030 fax 229-924-1222
The Vibration Analysis Technology
Until about 25 years ago, maintenance was primarily managed by machines. The machines “decided”schedules, parts inventories and production availability. Human management was almost purelyreactive: “When it breaks, we’ll fix it.” Machine availability was improved by maximizing the use of a Predictive Maintenance (PdM) tool known as condition monitoring.
When we think of Condition Monitoring, we usually think of vibration analysis. The technology andtechniques have been developing for over 30 years and over 78% of all manufacturing or processing plants use vibration analysis. Vibration analysis of rotating machines such as motors, pumps, fans, andgears is widely accepted as a viable technique to identify changing conditions. Reduced costs of testequipment and data management (primarily computers), availability of training, and development of computer-based expert systems are all contributing to this acceptance.
The technique measures machinery movement (vibration), typically through the use of anaccelerometer, and examines the vibration spectrum to identify and trend frequencies of interest. Somefrequencies are associated with the machine design, regardless of its condition. For example, a healthyfan or rotary compressor may have a frequency that is equal to the machine speed times the number of fan blades. The vibration analyst may monitor this frequency to note changes in the amplitudeindicating a degrading condition. Other frequencies, for example, those associated with rollingelement bearings, may be a sign of bearing damage and will alert the analyst to the start of bearingfailure. It is common for electric motor problems, such as broken rotor bars or stator eccentricity, to beseen in vibration associated with electrical line frequency. In new equipment, vibration analysis canidentify defective bearings and confirm proper alignment and balance at installation.
The vibration data is usually collected with a portable device for periodic monitoring, or a continuousmonitoring system may be installed for cost or critical systems. Analysis of the vibration data requiresa detailed understanding of machinery operation and of vibration analysis techniques. Vibration datais usually collected and analyzed on a monthly to quarterly basis (on continuously-running equipment).Costs vary due to machinery locations (the more spread out, the higher the cost) but typically are $3 to$5 per bearing depending on the quantity. The following examples demonstrate the effectiveness of the
vibration analysis technology for identifying bearing related defects. In addition, vibration analysis isuseful in determining many other types of machine faults including: unbalance, misalignment,mechanical looseness, DC drive controller problems, faulty sleeve bearings, bad gears, belt and chaindefects, resonance, softfoot, electrical faults, etc.
7/28/2019 Vibration Analysis Technology
http://slidepdf.com/reader/full/vibration-analysis-technology 2/3
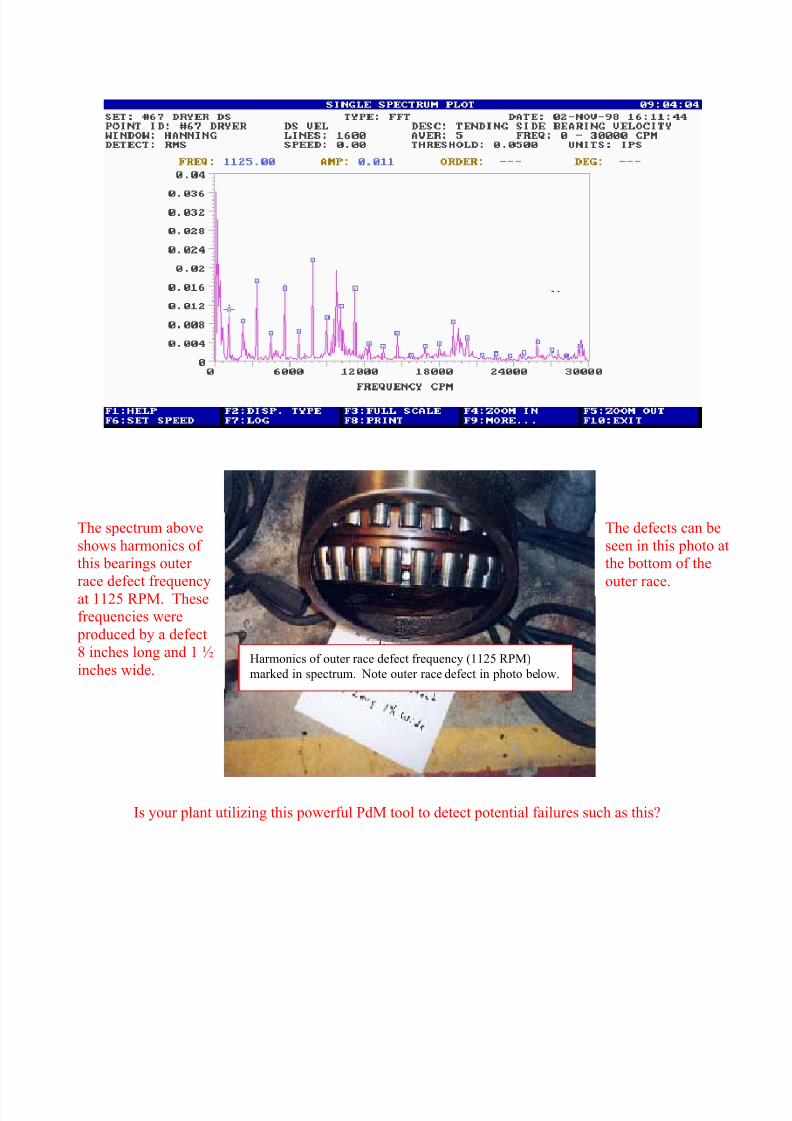
Harmonics of outer race defect frequency (1125 RPM)
marked in spectrum. Note outer race defect in photo below.
The spectrum aboveshows harmonics of this bearings outer race defect frequencyat 1125 RPM. Thesefrequencies were produced by a defect8 inches long and 1 ½inches wide.
The defects can beseen in this photo atthe bottom of the
outer race.
Is your plant utilizing this powerful PdM tool to detect potential failures such as this?

7/28/2019 Vibration Analysis Technology
http://slidepdf.com/reader/full/vibration-analysis-technology 3/3
Harmonics marked in spectrum are calculated inner racedefect frequency of 1350 RPM due to a cracked inner race. Note the cracked inner race in the photo below.