visa global travel intentions survey 2011 · visa global travel intentions survey 2011 | 1 ......
TRANSCRIPT
Visa Global Travel Intentions Survey 2011
Table of Contents
1. Background 1
2. Executive Summary 2
3. Travel and Destination Trends 5 3.1 Travel Trends 5 3.2 Destination Trends 6 3.3 Dream Holiday Destinations 8 3.4 Influences on Choice of Destination 9 3.5 Repeat Destinations 9 4. Travel Spend and Preferences 10 4.1 Travel Spend 10 4.2 Exceeding the Budget 1 1 4.3 Purchases and Spending at the Destination 1 1 4.4 Mode of Payment 13 4.5 Cash Access at Destination 14 4.6 What would people pay more for on their next trip 15 4.7 Budget for next trip 16
5. Holiday Planning 17 5.1 Planning the Travel 17 5.2 Style of Travel 18 5.3 Source of Travel Information 18 5.4 Holiday Duration 20 5.5 Type of Airline 2 1 5.6 Type of Accommodation 22 5.7 Travel Companions 24
APPENDIX - Survey Methodology 25
Visa Global Travel Intentions Survey 2011 | 1
Background11,620 travellers | 23 countries and territories | 1 global survey
Established in 2004, the Visa Travel Intentions Survey is the most comprehensive survey of its kind. The sixth wave of this survey monitors and analyses international travel trends and travel behaviour globally.
This survey was conducted in February and March 2011 and expanded upon previous surveys by extending it outside of the Asia Pacific region. This year interviews were carried out with 11,620 travellers from 23 countries and territories across the Americas (Brazil, Canada, Mexico and United States), Europe, Middle East and Africa (Croatia, Egypt, Germany, Morocco, Russia, Saudi Arabia, South Africa, United Arab Emirates and United Kingdom) and Asia Pacific (Australia, China, Hong Kong, India, Japan, Korea, Malaysia, Singapore, Taiwan and Thailand).
The study was undertaken among adults aged 18 years and older and who had traveled internationally for leisure in the last two years or who intend to travel internationally for leisure in the next two years.
This report will largely focus on results from a global perspective with country and segment highlights as appropriate.
The 2011 Visa Travel Intentions Survey focuses on the following key areas:• Travel and destination trends in the past two years and the next two years, and influences on the choice of destination• Travel budgets and preferred modes of payments of travellers• How travellers plan their holidays, their preferences and sources of information• Affluent travelers preferences as appropriate

2 | Visa Global Travel Intentions Survey 2011
EXECUTIVE SUMMARYTravel and Destination Trends
With 90 percent of globally surveyed respondents indicating a likelihood of traveling abroad for leisure over the next two years - a 12 percent increase over how much they’d traveled in the past two years - the travel and tourism industry has much to be positive about. Travelers from Asia Pacific will likely be the most frequent travelers in the next two years, followed closely by travelers from the Americas.
Globally over the next two years, the United States and United Kingdom remain the top destinations which respondents are likely to visit. However, there is a growing interest in travel to European destinations.
Top picks for travelers from Asia Pacific in the next two years are the United States and United Kingdom - a signal that longer haul travel is going to be on the rise as compared to where respondents visited the most - China and Hong Kong - in the past two years. Travelers from the Americas are showing greater interest in European destinations, while travelers from Europe, Middle East and Africa picked United Kingdom as their number one destination.
The United States, United Kingdom and France are the top destinations that the affluent segment of travelers are most likely to travel to in the next two years.
Good travel deals and promotions remain a key determinant of destination selection across the three regions. Nature or natural scenery is also very important. Novelty and diversity are two important factors for travellers from the Americas which goes some what to explain the increased interest in European countries for future travel as compared to previous travel. To attract repeat visitors, shopping is a key hook. And that is the reason behind why the United States and Hong Kong are picked as the top two destinations for repeat visits.
* For ease of communication, the notation of The People’s Republic of China will be shortened to China for this report. Similarly, Hong Kong (SAR), Macau (SAR) and Korea (ROK) will be shortened to Hong Kong, Macau and Korea respectively.

Visa Global Travel Intentions Survey 2011 | 3
Travel Spend and Preferences
On average, travelers across the three regions spent approximately US$1,481 on their last international leisure trip. Country wise, travelers from Australia spent the most (US$3,636) in their last trip, 2.5 times more than the average, followed by those from Saudi Arabia (US$3,129) and Egypt ($3,072).
Within the affluent segment, respondents spent an average of US$3,255 on their last holiday with the affluent travelers from Egypt spending the most (US$8,251) followed by those from Brazil (US$6,001) and Australia (US$5,376).
As for projected spend for their next trip, travelers from Australia, Saudi Arabia and Brazil are likely to be the top spenders. Australian respondents have budgeted an average of US$3,582 for their next holiday, followed by Saudi Arabian travelers (US$3,101) and Brazilian travelers (US$2,743).
Among the affluent segment, the top spenders are likely to be Egypt (US$6,407), Thailand (US$4,730) and Brazil (US$4,667)
Food, souvenirs/gifts and shopping are the top three items travelers spent on at the destination. Interestingly, 26 percent of Korean travelers spent at spas as compared to the global average of 14 percent and 23 percent of Indian travelers spent on healthcare/medical services as compared to an average of 11 percent globally.
Food is also the item that most people would pay more for on their next trip. This is then followed by convenience/hassle free services.
Credit cards emerged as the most widely used mode of payment among travelers from the Americas. Country wise, Chinese travelers have the highest preference for credit cards (60 percent). Travelers from Europe, Middle East and Africa showed more reliance on cash brought from home. However across all three regions, there is higher usage of credit cards among affluent travelers.
Among payment card brands, Visa is the most preferred card brand globally (53 percent). The advantage of “not carrying cash which can be cumbersome and risky” was the top reason cited for the preference of using payment cards for travel.
Chinese travellers accessed the most amounts of cash from overseas ATMs (US$1,171) and those from Croatia used this facility the least with an average of US$211 withdrawn from overseas ATMs. Respondents told us that if the exchange rate could be locked in prior to the trip, it would encourage greater cash access from ATMs overseas.

4 | Visa Global Travel Intentions Survey 2011
Holiday Planning
Most travelers start planning for their trip at least four months in advance, with United Arab Emirates and Thailand being the most spontaneous, planning in a much shorter time frame. Self-organized trips are preferred by all regions especially among people less than 35 years of age. The emergence of flexible individual tours is also attracting travelers especially in the Asia Pacific region which has traditionally been a key source market for packaged holidays.
More than half of all travellers are likely to refer to online sources of information, especially in Asia Pacific. An exception is Hong Kong where travellers cite a significant reliance on travel magazines. Travelocity is the most popular website among travellers from the Americas, while choices in Asia Pacific are more diverse depending on the country e.g. eztravel.com.tw for Taiwanese travellers.
In terms of the duration of their holidays, travelers from the Asia Pacific prefer short holidays (three–five nights) while those from the Americas and especially those from Europe, Middle East and Africa are more likely to take long holidays (more than 10 nights).
When choosing airlines, Asia Pacific travellers (59 percent) are more likely to use full-service airlines as compared with other regions. Countries that showed greater preference for budget carriers include Malaysia, Brazil, Russia and India.
For accommodation options, 3-4 star hotels are the most preferred choice across all three regions. Asia Pacific travelers and especially those within the affluent segment show a preference for resorts. The preference for free accommodation is higher among those from Europe, Middle East and Africa.
Visa Global Travel Intentions Survey 2011 | 5
TRAVEL AND DESTINATION TRENDS3.1 Travel Trends
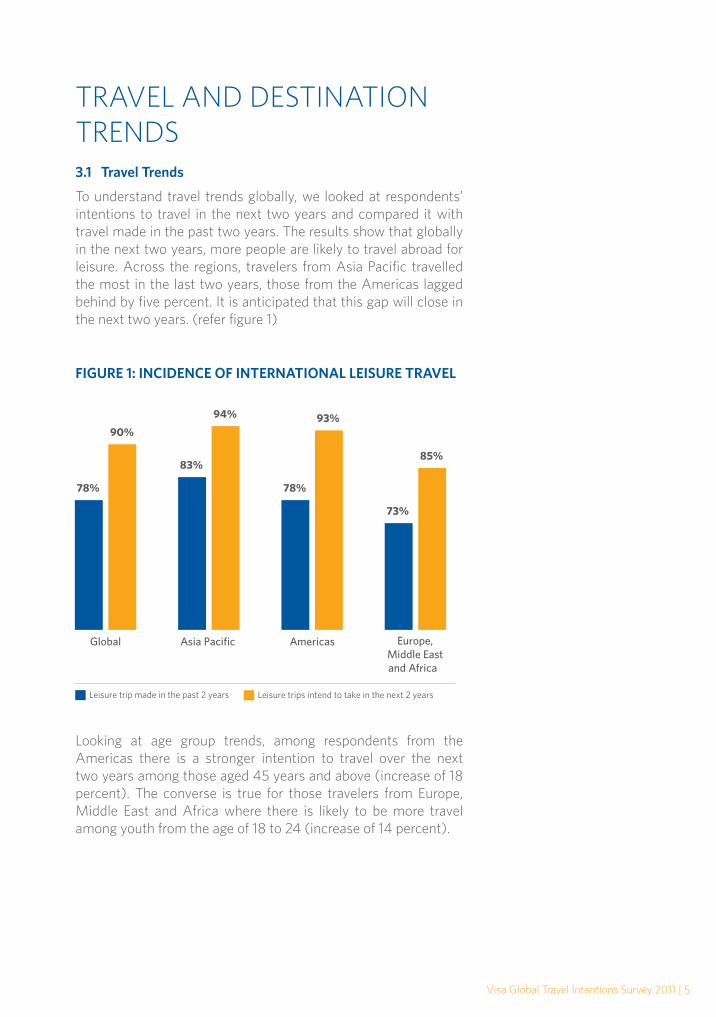
To understand travel trends globally, we looked at respondents’ intentions to travel in the next two years and compared it with travel made in the past two years. The results show that globally in the next two years, more people are likely to travel abroad for leisure. Across the regions, travelers from Asia Pacific travelled the most in the last two years, those from the Americas lagged behind by five percent. It is anticipated that this gap will close in the next two years. (refer figure 1)
Looking at age group trends, among respondents from the Americas there is a stronger intention to travel over the next two years among those aged 45 years and above (increase of 18 percent). The converse is true for those travelers from Europe, Middle East and Africa where there is likely to be more travel among youth from the age of 18 to 24 (increase of 14 percent).
FIGURE 1: INCIDENCE OF INTERNATIONAL LEISURE TRAVEL
6 | Visa Global Travel Intentions Survey 2011
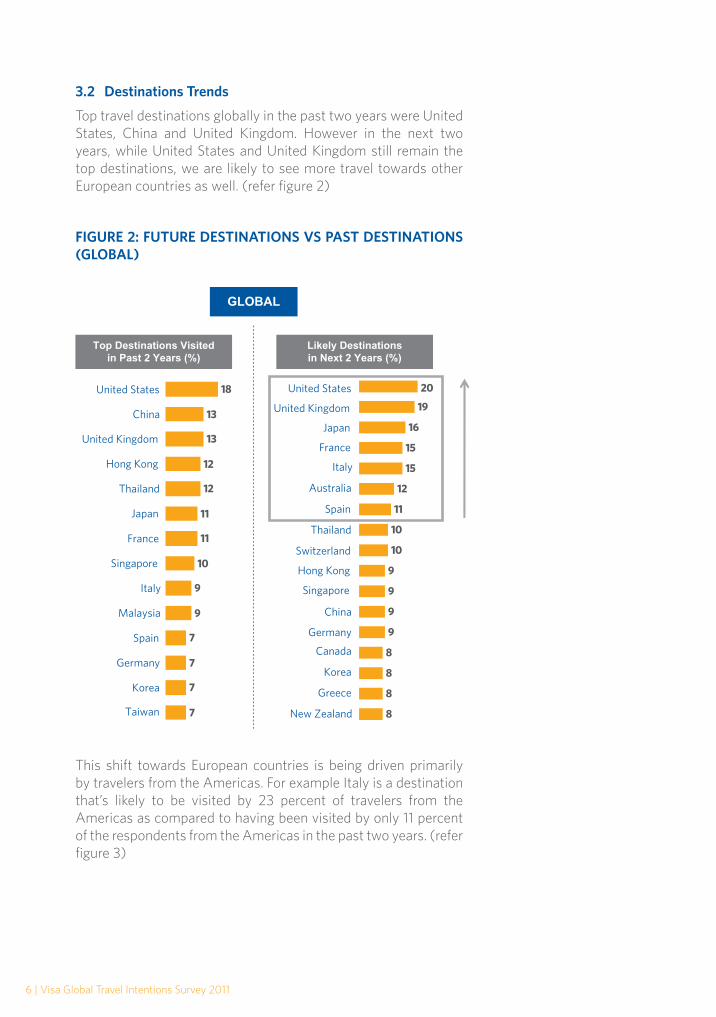
3.2 Destinations Trends
Top travel destinations globally in the past two years were United States, China and United Kingdom. However in the next two years, while United States and United Kingdom still remain the top destinations, we are likely to see more travel towards other European countries as well. (refer figure 2)
This shift towards European countries is being driven primarily by travelers from the Americas. For example Italy is a destination that’s likely to be visited by 23 percent of travelers from the Americas as compared to having been visited by only 11 percent of the respondents from the Americas in the past two years. (refer figure 3)
FIGURE 2: FUTURE DESTINATIONS VS PAST DESTINATIONS (GLOBAL)

Visa Global Travel Intentions Survey 2011 | 7
Among the Asia Pacific travelers, there is also a shift in destinations for travel in the next two years to United States and United Kingdom. This is a change from the past two years where China and Hong Kong were the most visited destinations. Travelers in Europe, Middle East and Africa are more diverse in their choices as evidenced in the lower percentages for the top three destinations with United Kingdom taking the number one spot.
FIGURE 3: FUTURE DESTINATIONS VS PAST DESTINATIONS (REGIONS)
Regions
Top 3 Most Visited Destinations in
Past 2 Years(%)
Top 3 Likely Destinations in
Next 2 Years (%)
Asia Pacific China - 24 Japan - 30
Hong Kong - 23 United States - 21
Japan - 9 United Kingdom - 20
Americas United States - 41 United States - 34
United Kingdom - 17 United Kingdom - 26
France - 13 Italy - 23
Europe, Middle East and Africa
France - 13 United Kingdom - 13
Italy - 13 Italy - 15
Turkey - 13 France, Spain - 14

8 | Visa Global Travel Intentions Survey 2011
Among the affluent travelers globally, the top two destination choices in the next two years are also United States and United Kingdom. Rounding out the top five destinations for future travel by the affluent segment are France, Singapore and Italy.
3.3 Dream Holiday Destinations
When respondents were asked what were their dream destinations - regardless of whether there was likelihood of visiting them in the next two years or not - the destinations were surprisingly not so different. Japan came out tops at seven percent, followed by the United States, Maldives, Italy, France, Europe and Australia at four percent each. Apart from the Maldives, these destinations were the same for the top likely destinations travelers would visit in the next two years. Interestingly, those who dream of visiting Maldives include travelers from China (12 percent), Korea (8 percent) and United Arab Emirates (8 percent).
Visa Global Travel Intentions Survey 2011 | 9
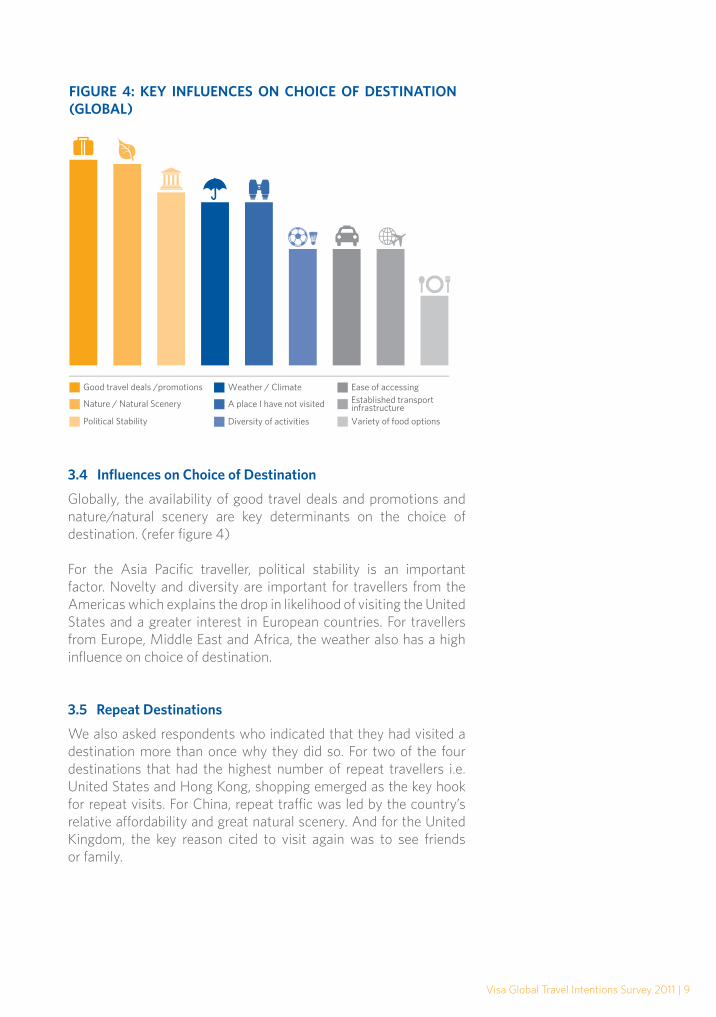
FIGURE 4: KEY INFLUENCES ON CHOICE OF DESTINATION (GLOBAL)
Good travel deals /promotions
Nature / Natural Scenery
Political Stability
Weather / Climate
A place I have not visited
Diversity of activities
Ease of accessingEstablished transportinfrastructure
Variety of food options
3.4 Influences on Choice of Destination
Globally, the availability of good travel deals and promotions and nature/natural scenery are key determinants on the choice of destination. (refer figure 4)
For the Asia Pacific traveller, political stability is an important factor. Novelty and diversity are important for travellers from the Americas which explains the drop in likelihood of visiting the United States and a greater interest in European countries. For travellers from Europe, Middle East and Africa, the weather also has a high influence on choice of destination. 3.5 Repeat Destinations
We also asked respondents who indicated that they had visited a destination more than once why they did so. For two of the four destinations that had the highest number of repeat travellers i.e. United States and Hong Kong, shopping emerged as the key hook for repeat visits. For China, repeat traffic was led by the country’s relative affordability and great natural scenery. And for the United Kingdom, the key reason cited to visit again was to see friends or family.
10 | Visa Global Travel Intentions Survey 2011
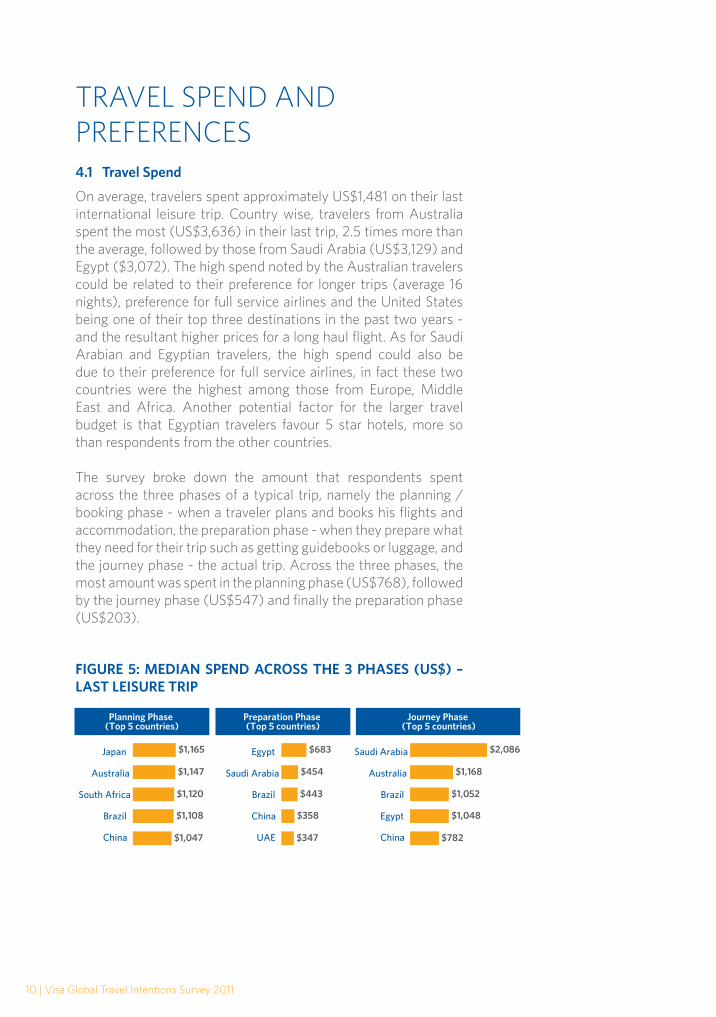
TRAVEL SPEND AND PREFERENCES4.1 Travel Spend
On average, travelers spent approximately US$1,481 on their last international leisure trip. Country wise, travelers from Australia spent the most (US$3,636) in their last trip, 2.5 times more than the average, followed by those from Saudi Arabia (US$3,129) and Egypt ($3,072). The high spend noted by the Australian travelers could be related to their preference for longer trips (average 16 nights), preference for full service airlines and the United States being one of their top three destinations in the past two years - and the resultant higher prices for a long haul flight. As for Saudi Arabian and Egyptian travelers, the high spend could also be due to their preference for full service airlines, in fact these two countries were the highest among those from Europe, Middle East and Africa. Another potential factor for the larger travel budget is that Egyptian travelers favour 5 star hotels, more so than respondents from the other countries.
The survey broke down the amount that respondents spent across the three phases of a typical trip, namely the planning / booking phase - when a traveler plans and books his flights and accommodation, the preparation phase - when they prepare what they need for their trip such as getting guidebooks or luggage, and the journey phase - the actual trip. Across the three phases, the most amount was spent in the planning phase (US$768), followed by the journey phase (US$547) and finally the preparation phase (US$203).
FIGURE 5: MEDIAN SPEND ACROSS THE 3 PHASES (US$) – LAST LEISURE TRIP
$1,165
$1,147
$1,120
$1,108
$1,047
Planning Phase (Top 5 countries)
Preparation Phase (Top 5 countries)
Journey Phase (Top 5 countries)
Japan
Australia
South Africa
Brazil
China
$683
$454
$443
$358
$347
Egypt
Saudi Arabia
Brazil
China
UAE
$2,086
$1,168
$1,052
$1,048
$782
Saudi Arabia
Australia
Brazil
Egypt
China
Visa Global Travel Intentions Survey 2011 | 11
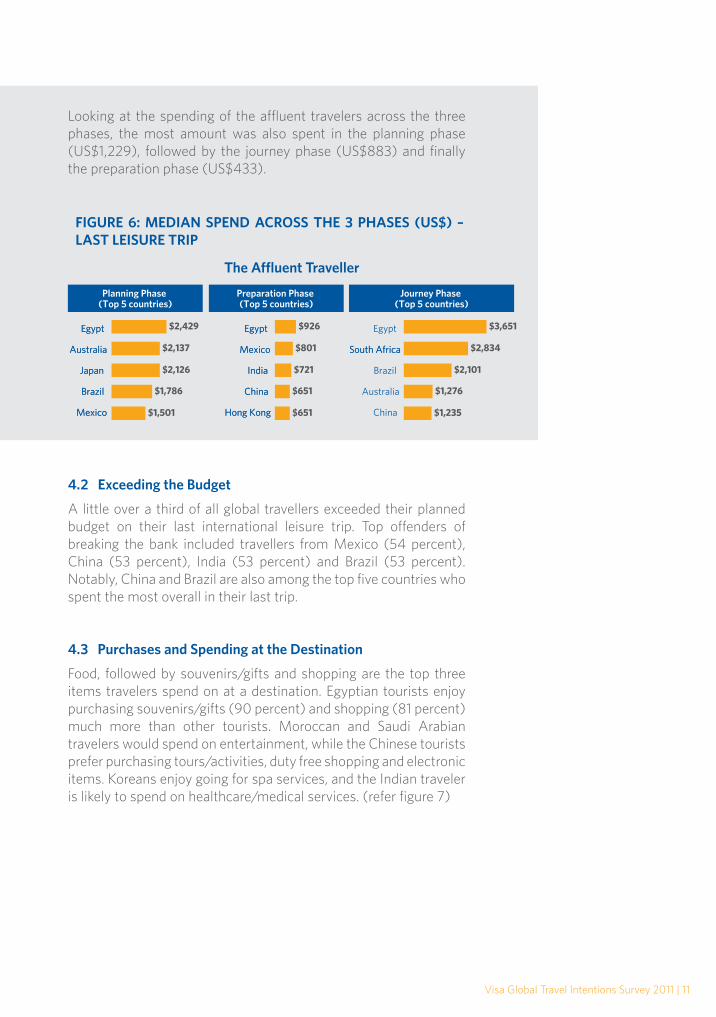
Looking at the spending of the affluent travelers across the three phases, the most amount was also spent in the planning phase (US$1,229), followed by the journey phase (US$883) and finally the preparation phase (US$433).
4.2 Exceeding the Budget
A little over a third of all global travellers exceeded their planned budget on their last international leisure trip. Top offenders of breaking the bank included travellers from Mexico (54 percent), China (53 percent), India (53 percent) and Brazil (53 percent). Notably, China and Brazil are also among the top five countries who spent the most overall in their last trip.
4.3 Purchases and Spending at the Destination
Food, followed by souvenirs/gifts and shopping are the top three items travelers spend on at a destination. Egyptian tourists enjoy purchasing souvenirs/gifts (90 percent) and shopping (81 percent) much more than other tourists. Moroccan and Saudi Arabian travelers would spend on entertainment, while the Chinese tourists prefer purchasing tours/activities, duty free shopping and electronic items. Koreans enjoy going for spa services, and the Indian traveler is likely to spend on healthcare/medical services. (refer figure 7)
FIGURE 6: MEDIAN SPEND ACROSS THE 3 PHASES (US$) – LAST LEISURE TRIP
The Affluent Traveller
Planning Phase (Top 5 countries)
Preparation Phase (Top 5 countries)
Journey Phase (Top 5 countries)
$2,429
$2,137
$2,126
$1,786
$1,501
Egypt
Australia
Japan
Brazil
Mexico
Egypt
Australia
Japan
Brazil
Mexico
$926
$801
$721
$651
$651
Egypt
Mexico
India
China
Hong Kong
Egypt
Mexico
India
China
Hong Kong
$3,651
$2,834
$2,101
$1,276
$1,235
Egypt
South Africa
Brazil
Australia
China
South Africa
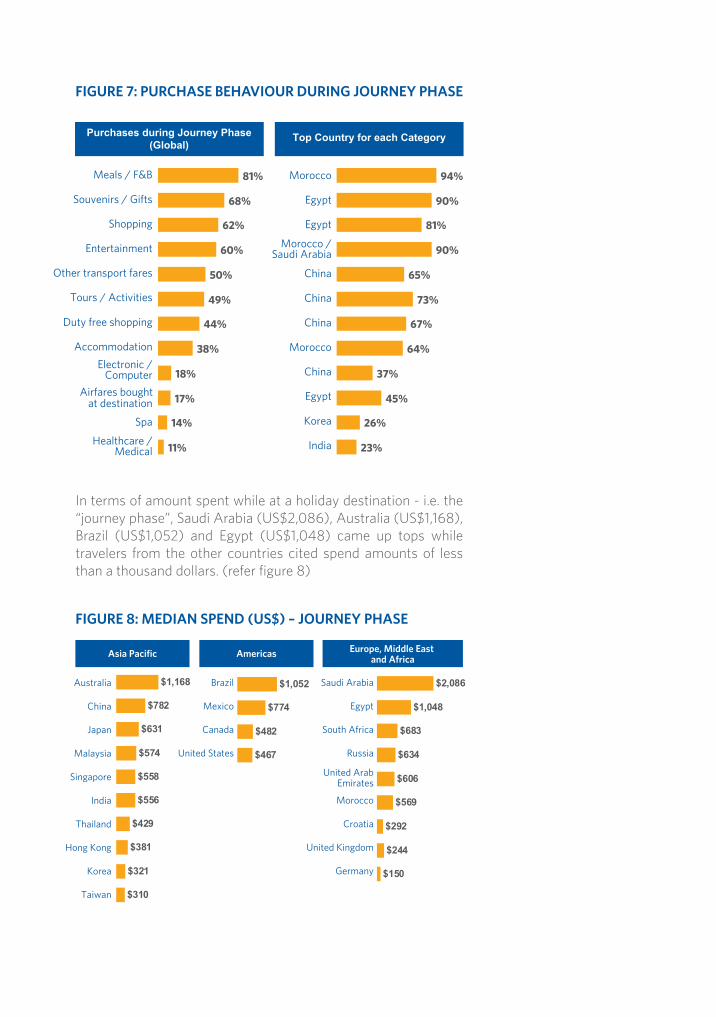
In terms of amount spent while at a holiday destination - i.e. the “journey phase”, Saudi Arabia (US$2,086), Australia (US$1,168), Brazil (US$1,052) and Egypt (US$1,048) came up tops while travelers from the other countries cited spend amounts of less than a thousand dollars. (refer figure 8)
81%
68%
62%
60%
50%
49%
44%
38%
18%
17%
14%
11%
Meals / F&B
Souvenirs / Gifts
Shopping
Entertainment
Other transport fares
Tours / Activities
Duty free shopping
Accommodation
Electronic /Computer
Airfares bought at destination
Spa
Healthcare /Medical
94%
90%
81%
90%
65%
73%
67%
64%
37%
45%
26%
23%
Morocco
Egypt
Egypt
China
China
China
Morocco
China
Egypt
Korea
India
Morocco /Saudi Arabia
Purchases during Journey Phase(Global)
Top Country for each Category
FIGURE 7: PURCHASE BEHAVIOUR DURING JOURNEY PHASE
FIGURE 8: MEDIAN SPEND (US$) – JOURNEY PHASE
Asia Pacific Americas Europe, Middle East and Africa
Australia
China
Japan
Malaysia
Singapore
India
Thailand
Hong Kong
Korea
Taiwan
$1,168
$782
$631
$574
$558
$556
$429
$381
$321
$310
Saudi Arabia
Egypt
South Africa
Russia
United ArabEmirates
Morocco
Croatia
United Kingdom
Germany
$2,086
$1,048
$683
$634
$606
$569
$292
$244
$150
Brazil
Mexico
Canada
United States
$1,052
$774
$482
$467

Visa Global Travel Intentions Survey 2011 | 13
4.4 Mode of Payment
Credit cards emerged as the most widely used mode of payment primarily among travelers from the Americas while travelers from Europe, Middle East and Africa were largely reliant on cash brought from home. (refer figure 9)
The top five payment card using countries were China (60 percent), followed by Brazil (49 percent) Japan (46 percent), United States (43 percent) and Canada (39 percent). The countries that had the least prevalence of using cards were travelers from Morocco and Russia (both 10 percent), Croatia (17 percent), UK (18 percent) and Germany (20 percent).
FIGURE 9: MOST OFTEN USED PAYMENT MODE – LAST LEISURE TRIP
Among affluent travelers, there is higher usage of credit cards with significant differences among travelers from Asia Pacific travelers (53 percent) and those from Europe, Middle East and Africa (36 percent).
Europe, Middle Eastand Africa
AmericasAsia Pacific Global
24
634
968
53294244
22
403230
533
11
79
1411
Credit card
Cash taken from home country
Cash via money changer / bank overseas
Cash via overseas ATM Check/Debit card
Travelers cheque

14 | Visa Global Travel Intentions Survey 2011
The advantages of “not carrying cash which can be cumbersome and risky”, the ability “to keep a record of all expenses” and the ability to “enjoy discounts and benefits offered by the card” are the top reasons for using payment cards for travel as cited by respondents.
4.5 Cash Access at Destination
Globally 14 percent of travellers accessed cash from overseas ATMs in their last international holiday. Travellers still have a greater tendency to rely on traditional habits of bringing cash from their home country, and the average amount withdrawn at a traveller’s home country was US$930. Despite that however, there is an increasing comfort level of accessing local currency overseas as globally, travelers still withdrew an average of $600 from overseas ATMs.
Chinese travellers accessed the highest amount at overseas ATMs (US$1,171), however in terms of percentage over total cash accessed (i.e. from both overseas ATMs and bringing local currency from their home country), Mexico was the highest at 51 percent. (refer figure 11)
FIGURE 11: MEDIAN CASH ACCESS AMOUNT (US$) – LAST LEISURE TRIP
When asked what would encourage them to withdraw cash at overseas ATMs rather than bringing with them large amounts of local currency, travellers said that lowering fees, greater availability of ATMs, and the ability to lock in an exchange rate before a trip would help incentivise a change in habits.
Visa Global Travel Intentions Survey 2011 | 15
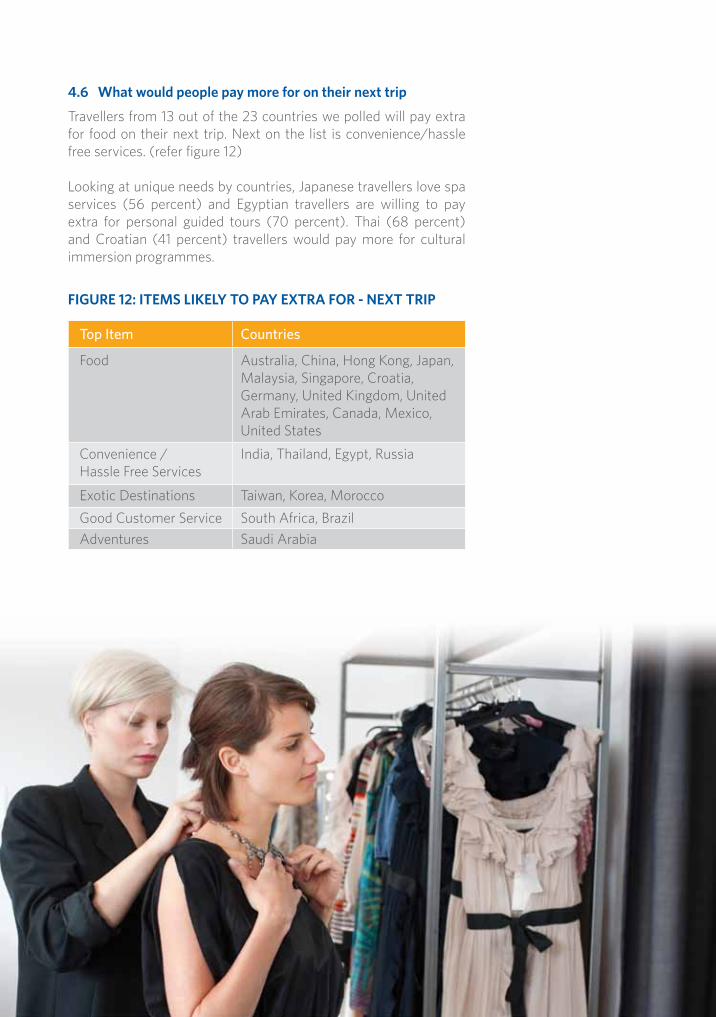
4.6 What would people pay more for on their next trip
Travellers from 13 out of the 23 countries we polled will pay extra for food on their next trip. Next on the list is convenience/hassle free services. (refer figure 12)
Looking at unique needs by countries, Japanese travellers love spa services (56 percent) and Egyptian travellers are willing to pay extra for personal guided tours (70 percent). Thai (68 percent) and Croatian (41 percent) travellers would pay more for cultural immersion programmes.
FIGURE 12: ITEMS LIKELY TO PAY EXTRA FOR - NEXT TRIP
Top Item Countries
Food Australia, China, Hong Kong, Japan, Malaysia, Singapore, Croatia, Germany, United Kingdom, United Arab Emirates, Canada, Mexico, United States
Convenience / Hassle Free Services
India, Thailand, Egypt, Russia
Exotic Destinations Taiwan, Korea, Morocco
Good Customer Service South Africa, Brazil
Adventures Saudi Arabia
16 | Visa Global Travel Intentions Survey 2011
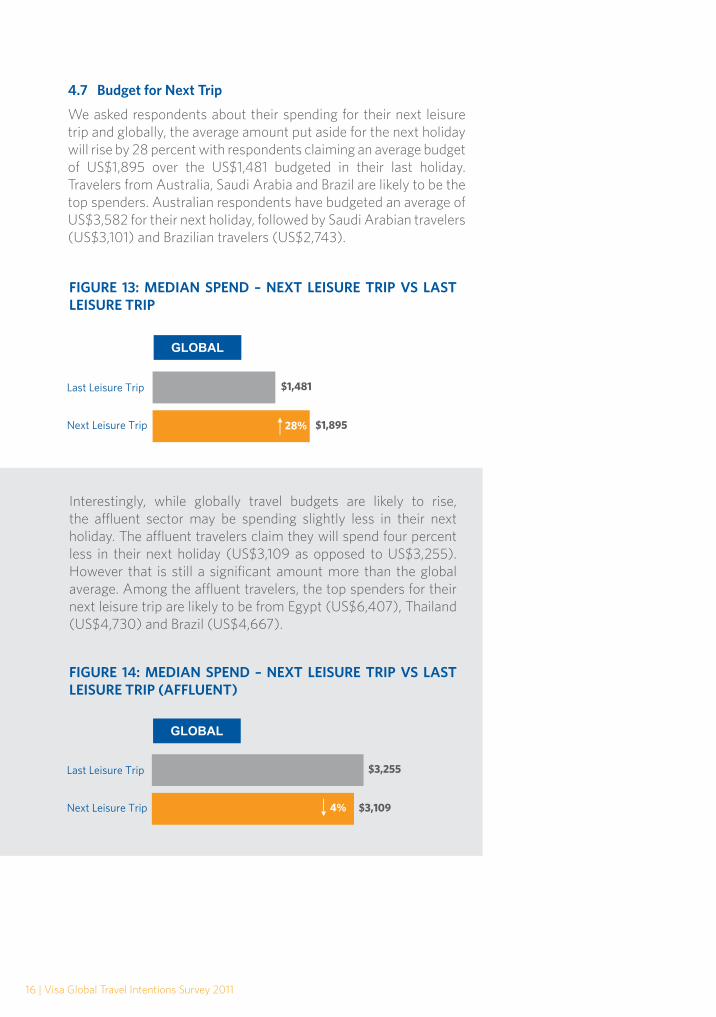
Interestingly, while globally travel budgets are likely to rise, the affluent sector may be spending slightly less in their next holiday. The affluent travelers claim they will spend four percent less in their next holiday (US$3,109 as opposed to US$3,255). However that is still a significant amount more than the global average. Among the affluent travelers, the top spenders for their next leisure trip are likely to be from Egypt (US$6,407), Thailand (US$4,730) and Brazil (US$4,667).
FIGURE 13: MEDIAN SPEND – NEXT LEISURE TRIP VS LAST LEISURE TRIP
FIGURE 14: MEDIAN SPEND – NEXT LEISURE TRIP VS LAST LEISURE TRIP (AFFLUENT)
$1,481
$1,895
Last Leisure Trip
Next Leisure Trip 28%
GLOBAL
4.7 Budget for Next Trip
We asked respondents about their spending for their next leisure trip and globally, the average amount put aside for the next holiday will rise by 28 percent with respondents claiming an average budget of US$1,895 over the US$1,481 budgeted in their last holiday. Travelers from Australia, Saudi Arabia and Brazil are likely to be the top spenders. Australian respondents have budgeted an average of US$3,582 for their next holiday, followed by Saudi Arabian travelers (US$3,101) and Brazilian travelers (US$2,743).
GLOBAL
$3,255
$3,109
Last Leisure Trip
Next Leisure Trip 4%
Visa Global Travel Intentions Survey 2011 | 17
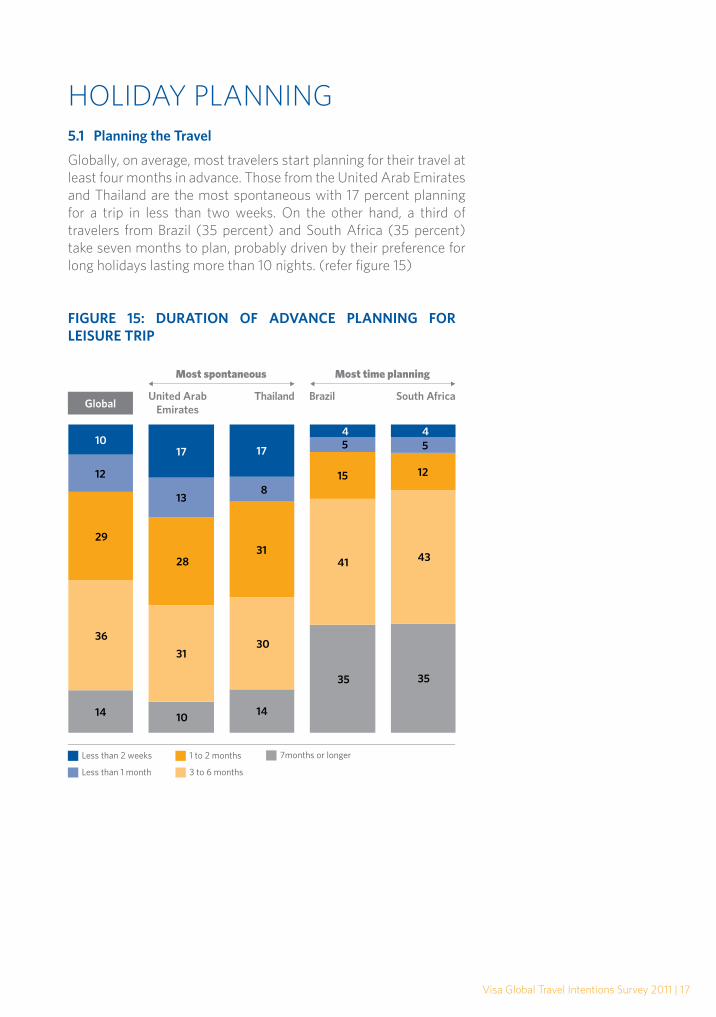
HOLIDAY PLANNING 5.1 Planning the Travel
Globally, on average, most travelers start planning for their travel at least four months in advance. Those from the United Arab Emirates and Thailand are the most spontaneous with 17 percent planning for a trip in less than two weeks. On the other hand, a third of travelers from Brazil (35 percent) and South Africa (35 percent) take seven months to plan, probably driven by their preference for long holidays lasting more than 10 nights. (refer figure 15)
FIGURE 15: DURATION OF ADVANCE PLANNING FOR LEISURE TRIP

18 | Visa Global Travel Intentions Survey 2011
5.2 Style of Travel
Most travelers express a preference for self-organized trips followed by flexible individual tours and packaged group tours. Although as a region, Asia Pacific travelers (38 percent) are less likely than the other regions to opt for self-organized trips, from a country perspective, Australians have a high preference for it (66 percent). A further study by age group reveals that in Asia Pacific and the Americas, the preference for self-organized trips is higher among people less than 35 years of age. (refer figure 16)
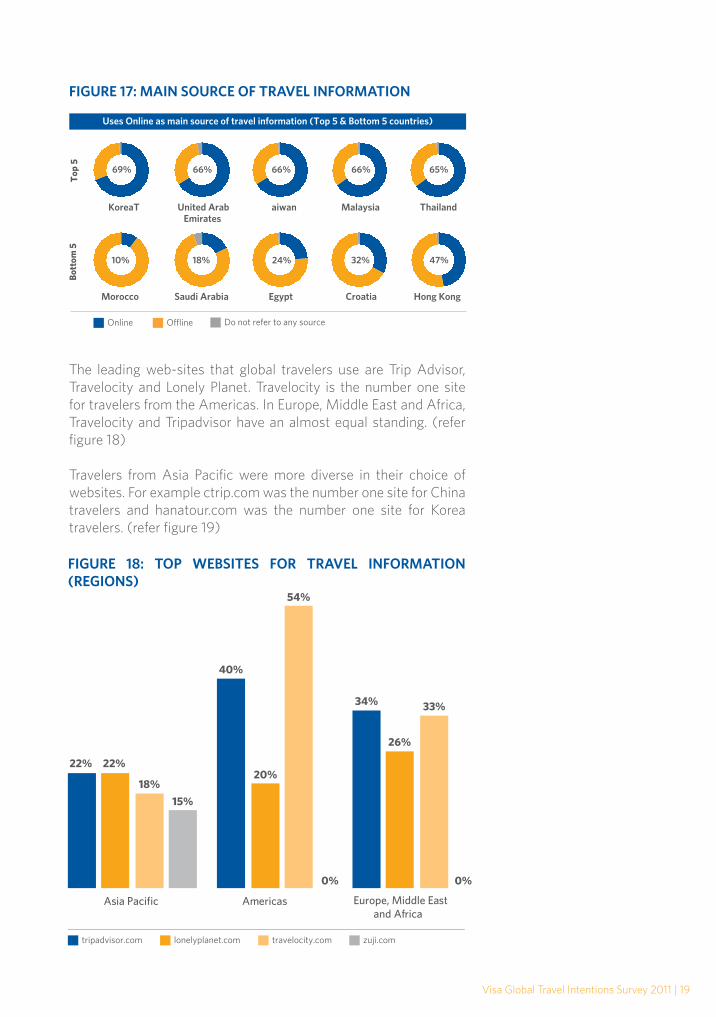
5.3 Source of Travel Information
The online space continues its dominance as the main source of travel-related information for travelers planning their next international leisure trip. More than five in ten respondents globally cited the web as a primary resource. Respondents from Asia Pacific were the most web-savvy; with four out of the top five countries that use online material as the main source of information coming from the Asia Pacific. Notably, overall dependence on online sources is significantly lower among respondents from Europe, Middle East and Africa with those from Morocco, Saudi Arabia, Egypt and Croatia most reliant on offline sources i.e. word of mouth, travel operators and even movies. Travelers from Hong Kong also cite travel magazines as their main source of information. (refer figure 17)
FIGURE 16: STYLE OF TRAVEL
Visa Global Travel Intentions Survey 2011 | 19
The leading web-sites that global travelers use are Trip Advisor, Travelocity and Lonely Planet. Travelocity is the number one site for travelers from the Americas. In Europe, Middle East and Africa, Travelocity and Tripadvisor have an almost equal standing. (refer figure 18)
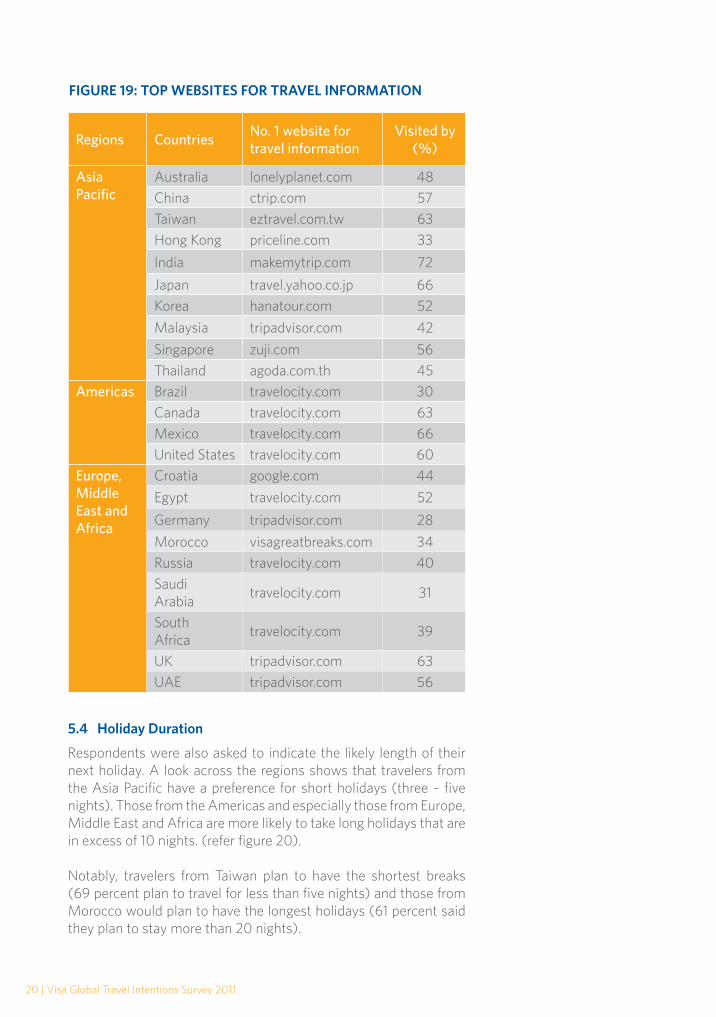
Travelers from Asia Pacific were more diverse in their choice of websites. For example ctrip.com was the number one site for China travelers and hanatour.com was the number one site for Korea travelers. (refer figure 19)
FIGURE 17: MAIN SOURCE OF TRAVEL INFORMATION
Online Offline Do not refer to any source
Uses Online as main source of travel information (Top 5 & Bottom 5 countries)
Morocco Saudi Arabia
10% 18%
KoreaT aiwan
Egypt Croatia
69% 66%
24% 32%
Malaysia ThailandUnited Arab Emirates
Hong Kong
66% 65%66%
47%
Top
5B
otto
m 5
FIGURE 18: TOP WEBSITES FOR TRAVEL INFORMATION (REGIONS)
tripadvisor.com lonelyplanet.com zuji.comtravelocity.com
22% 22%
40%
34% 33%
26%
20%
54%
0% 0%
18%
15%
Europe, Middle Eastand Africa
AmericasAsia Pacific
20 | Visa Global Travel Intentions Survey 2011
5.4 Holiday Duration
Respondents were also asked to indicate the likely length of their next holiday. A look across the regions shows that travelers from the Asia Pacific have a preference for short holidays (three – five nights). Those from the Americas and especially those from Europe, Middle East and Africa are more likely to take long holidays that are in excess of 10 nights. (refer figure 20).
Notably, travelers from Taiwan plan to have the shortest breaks (69 percent plan to travel for less than five nights) and those from Morocco would plan to have the longest holidays (61 percent said they plan to stay more than 20 nights).
FIGURE 19: TOP WEBSITES FOR TRAVEL INFORMATION
Regions CountriesNo. 1 website for travel information
Visited by(%)
Asia Pacific
Australia lonelyplanet.com 48
China ctrip.com 57
Taiwan eztravel.com.tw 63
Hong Kong priceline.com 33
India makemytrip.com 72
Japan travel.yahoo.co.jp 66
Korea hanatour.com 52
Malaysia tripadvisor.com 42
Singapore zuji.com 56
Thailand agoda.com.th 45
Americas Brazil travelocity.com 30
Canada travelocity.com 63
Mexico travelocity.com 66
United States travelocity.com 60
Europe, Middle East and Africa
Croatia google.com 44
Egypt travelocity.com 52
Germany tripadvisor.com 28
Morocco visagreatbreaks.com 34
Russia travelocity.com 40
Saudi Arabia
travelocity.com 31
South Africa
travelocity.com 39
UK tripadvisor.com 63
UAE tripadvisor.com 56

Visa Global Travel Intentions Survey 2011 | 21
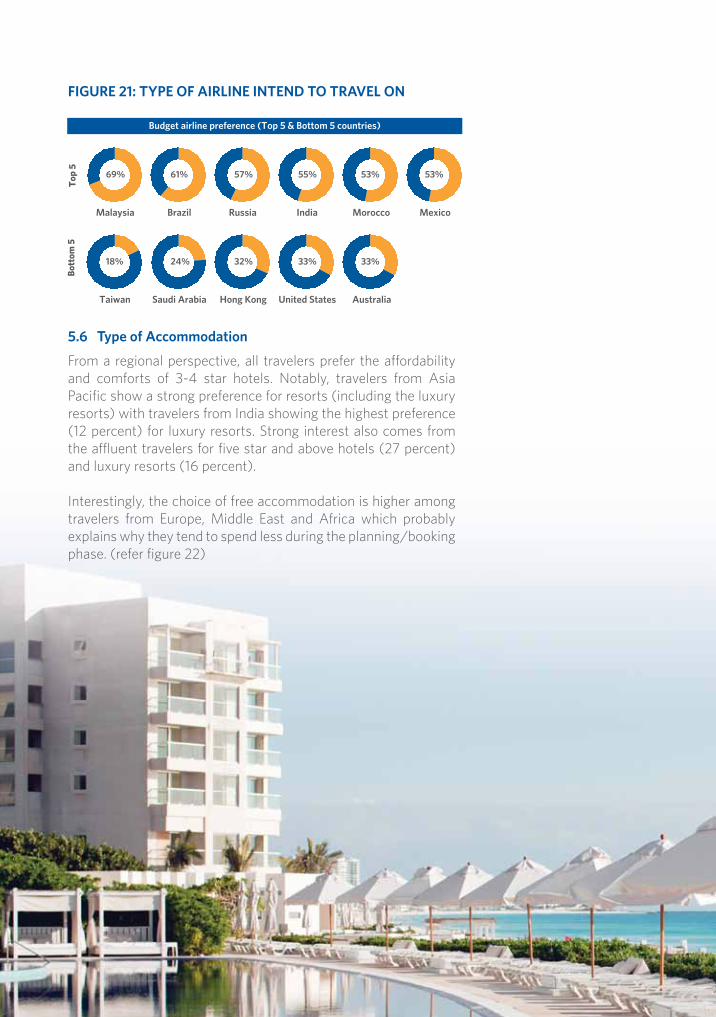
5.5 Type of Airline
Future travelers are likely to use both budget and full-service airlines. A comparison across regions revealed the preference for full-service airlines to be higher among travelers from Asia Pacific. (refer figure 21)
Countries that showed a greater preference for budget carriers include Malaysia (69 percent), Brazil (61 percent), Russia (57 percent), India (55 percent), Morocco (53 percent) and Mexico (53 percent).
FIGURE 20: DURATION OF NEXT INTERNATIONAL LEISURE TRIP
Less than 3 night 3 -5 nights > 10 nights6 -9 nights
122
63
23
Europe, Middle Eastand Africa
43
20
2
34
Americas
25
41
4
31
Asia Pacific
42
27
3
29
Global
22 | Visa Global Travel Intentions Survey 2011
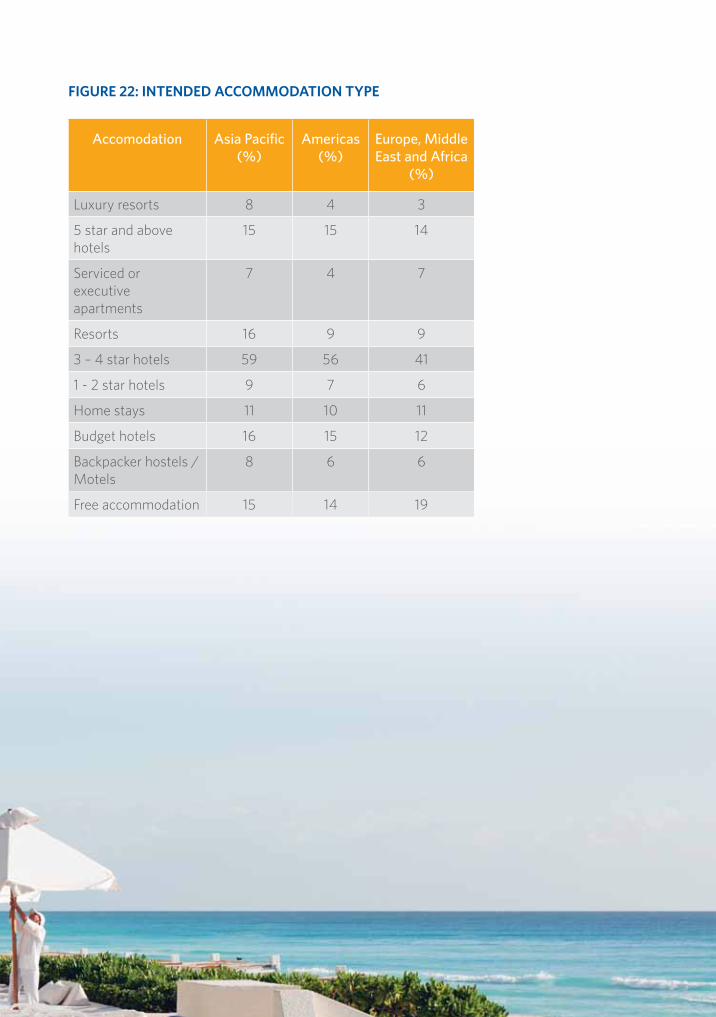
5.6 Type of Accommodation
From a regional perspective, all travelers prefer the affordability and comforts of 3-4 star hotels. Notably, travelers from Asia Pacific show a strong preference for resorts (including the luxury resorts) with travelers from India showing the highest preference (12 percent) for luxury resorts. Strong interest also comes from the affluent travelers for five star and above hotels (27 percent) and luxury resorts (16 percent).
Interestingly, the choice of free accommodation is higher among travelers from Europe, Middle East and Africa which probably explains why they tend to spend less during the planning/booking phase. (refer figure 22)
FIGURE 21: TYPE OF AIRLINE INTEND TO TRAVEL ON
Top
5B
otto
m 5
Budget airline preference (Top 5 & Bottom 5 countries)
Mexico
53%
Malaysia
69%
Taiwan
18%
Brazil
61%
Saudi Arabia
24%
Russia
57%
Hong Kong
32%
India
55%
United States
33%
Morocco
53%
Australia
33%
Visa Global Travel Intentions Survey 2011 | 23
FIGURE 22: INTENDED ACCOMMODATION TYPE
Accomodation Asia Pacific (%)
Americas (%)
Europe, Middle East and Africa
(%)
Luxury resorts 8 4 3
5 star and above hotels
15 15 14
Serviced or executive apartments
7 4 7
Resorts 16 9 9
3 – 4 star hotels 59 56 41
1 - 2 star hotels 9 7 6
Home stays 11 10 11
Budget hotels 16 15 12
Backpacker hostels / Motels
8 6 6
Free accommodation 15 14 19
24 | Visa Global Travel Intentions Survey 2011
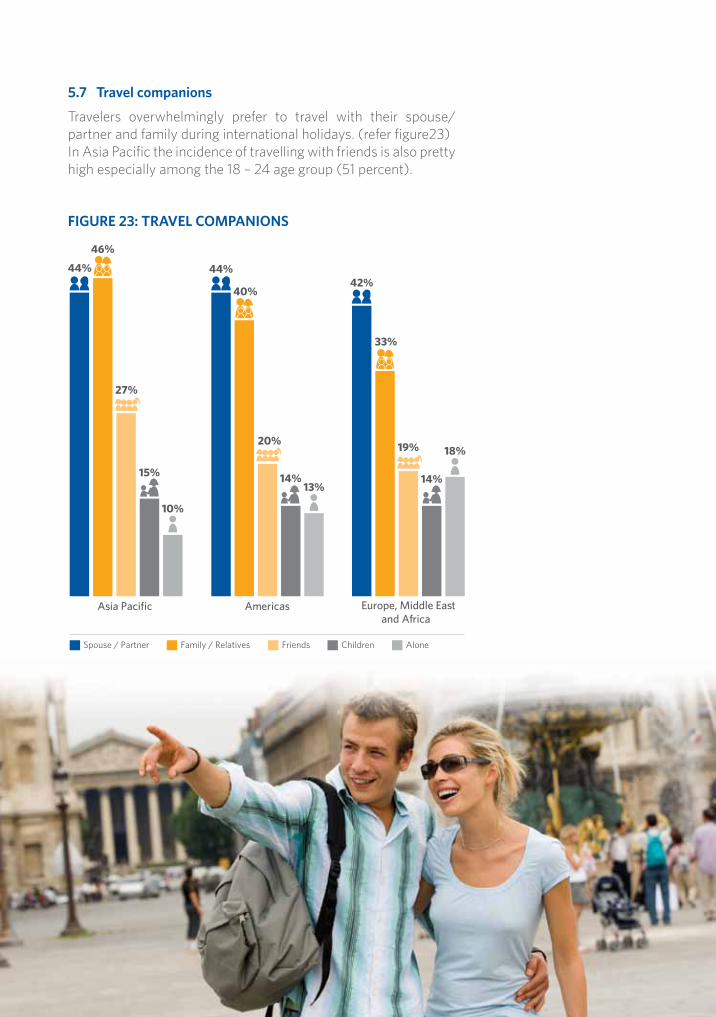
5.7 Travel companions
Travelers overwhelmingly prefer to travel with their spouse/partner and family during international holidays. (refer figure23)In Asia Pacific the incidence of travelling with friends is also pretty high especially among the 18 – 24 age group (51 percent).
FIGURE 23: TRAVEL COMPANIONS
42%
33%
19%
14%
18%
Europe, Middle Eastand Africa
44%
40%
20%
14%13%
Americas
44%
46%
27%
15%
10%
Asia Pacific
Spouse / Partner Family / Relatives Children AloneFriends
Visa Global Travel Intentions Survey 2011 | 25
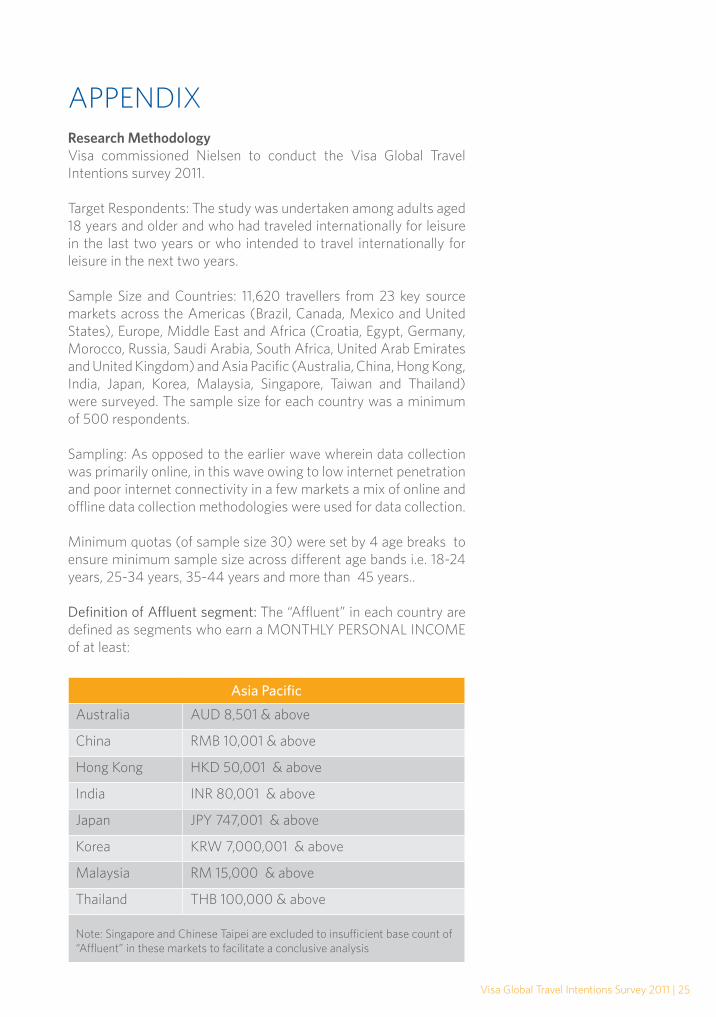
APPENDIX Research MethodologyVisa commissioned Nielsen to conduct the Visa Global Travel Intentions survey 2011.
Target Respondents: The study was undertaken among adults aged 18 years and older and who had traveled internationally for leisure in the last two years or who intended to travel internationally for leisure in the next two years.
Sample Size and Countries: 11,620 travellers from 23 key source markets across the Americas (Brazil, Canada, Mexico and United States), Europe, Middle East and Africa (Croatia, Egypt, Germany, Morocco, Russia, Saudi Arabia, South Africa, United Arab Emirates and United Kingdom) and Asia Pacific (Australia, China, Hong Kong, India, Japan, Korea, Malaysia, Singapore, Taiwan and Thailand) were surveyed. The sample size for each country was a minimum of 500 respondents.
Sampling: As opposed to the earlier wave wherein data collection was primarily online, in this wave owing to low internet penetration and poor internet connectivity in a few markets a mix of online and offline data collection methodologies were used for data collection.
Minimum quotas (of sample size 30) were set by 4 age breaks to ensure minimum sample size across different age bands i.e. 18-24 years, 25-34 years, 35-44 years and more than 45 years..
Definition of Affluent segment: The “Affluent” in each country are defined as segments who earn a MONTHLY PERSONAL INCOME of at least:
Asia Pacific
Australia AUD 8,501 & above
China RMB 10,001 & above
Hong Kong HKD 50,001 & above
India INR 80,001 & above
Japan JPY 747,001 & above
Korea KRW 7,000,001 & above
Malaysia RM 15,000 & above
Thailand THB 100,000 & above
Note: Singapore and Chinese Taipei are excluded to insufficient base count of “Affluent” in these markets to facilitate a conclusive analysis
26 | Visa Global Travel Intentions Survey 2011
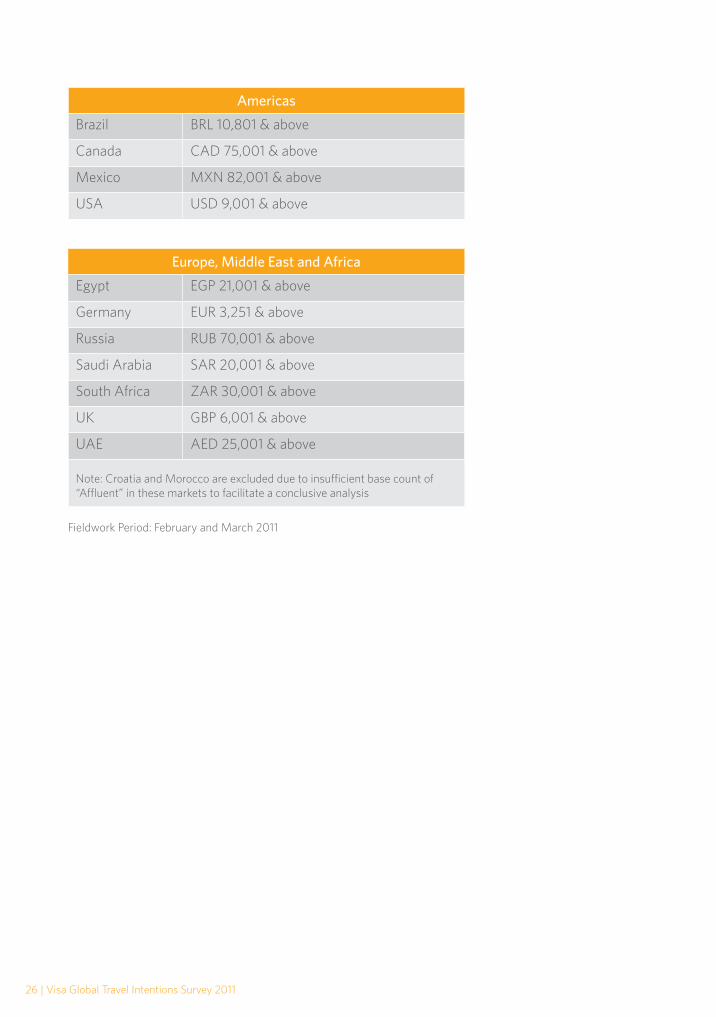
Europe, Middle East and Africa
Egypt EGP 21,001 & above
Germany EUR 3,251 & above
Russia RUB 70,001 & above
Saudi Arabia SAR 20,001 & above
South Africa ZAR 30,001 & above
UK GBP 6,001 & above
UAE AED 25,001 & above
Note: Croatia and Morocco are excluded due to insufficient base count of “Affluent” in these markets to facilitate a conclusive analysis
Americas
Brazil BRL 10,801 & above
Canada CAD 75,001 & above
Mexico MXN 82,001 & above
USA USD 9,001 & above
Fieldwork Period: February and March 2011

NOTICE OF DISCLAIMERCase studies, statistics, research and recommendations are provided “AS IS” and intended for informational purposes only and should not be relied upon for operational, marketing, legal, technical, tax, financial or other advice. When implementing any new strategy or practice, you should consult with your legal counsel to determine what laws and regulations may apply to your specific circumstances. Visa is not responsible for your use of the information contained herein (including errors, omissions, inaccuracy or non-timeliness of any kind) or any assumptions or conclusions you might draw from its use.

Visa | Robinson Road, Post Office Box 597, Singapore 901147, www.visa-asia.com