vision before and after scharioth macular lens
TRANSCRIPT

ORIGINAL RESEARCH ARTICLE
Vision before and after scharioth macular lens implantationin patients with AMD: an electrophysiological study
Jan Kremlacek . Jana Nekolova . Marketa Stredova . Jana Langrova .
Jana Szanyi . Miroslav Kuba . Zuzana Kubova . Frantisek Vıt .
Petr Voda . Martina Vesela . Nad’a Jiraskova
Received: 24 August 2020 / Accepted: 11 December 2020 / Published online: 3 January 2021
� The Author(s) 2021
Abstract
Background For patients with age-related macular
degeneration (AMD), a special intraocular lens
implantation partially compensates for the loss in the
central part of the visual field. For six months, we
evaluated changes in neurophysiological parameters
in patients implanted with a ‘‘Scharioth macula lens’’
(SML; a center near high add ? 10 D and peripheral
plano carrier bifocal lens designed to be located
between the iris and an artificial lens).
Methods Fourteen patients (5 M, 9 F, 63–87 years)
with dry AMD were examined prior to and at 3 days
after, as well as 1, 2, and 6 months after, implantation
using pattern-reversal, motion-onset, and cognitive
evoked potentials, psychophysical tests evaluating
distant and near visual acuity, and contrast sensitivity.
Results Near visual acuity without an external aid
was significantly better six months after implantation
than before implantation (Jaeger table median (lower;
upper quartile): 4 (1; 6) vs. 15 (13; 17)). Distant visual
acuity was significantly altered between the pre- (0.7
(0.5; 0.8) logMAR) and last postimplantation visits
(0.8 (0.7; 0.8) logMAR), which matched prolongation
of the P100 peak time (147 (135; 151) ms vs. 161 (141;
166) ms) of 15 arc min pattern-reversal VEPs and N2
peak time (191.5 (186.5; 214.5) ms vs. 205 (187; 218)
ms) of peripheral motion-onset VEPs.
Conclusion SML implantation significantly
improved near vision. We also observed a slight but
significant decrease in distant and peripheral vision.
The most efficient electrophysiological approach to
test patients with SML was the peripheral motion-
onset stimulation, which evoked repeatable and read-
able VEPs.
Keywords Scharioth macular lens � Maculopathy �Age-related macular degeneration � Oddball ERPs �Motion-onset VEPs � Pattern-reversal VEPs � P3b
Abbreviations
SML ‘‘Scharioth macula lens’’-intraocular
reading lens
Supplementary Information The onlineversioncontainssupplementary material available at (https://doi.org/10.1007/s10633-020-09814-8).
J. Kremlacek (&) � P. VodaDepartment of Medical Biophysics, Faculty of Medicine
in Hradec Kralove, Charles University, Simkova 870,
500 38 Prague, Hradec Kralove, Czech Republic
e-mail: [email protected]
J. Kremlacek � J. Langrova � J. Szanyi �M. Kuba � Z. Kubova � F. VıtDepartment of Pathological Physiology, Faculty of
Medicine in Hradec Kralove, Charles University, Prague,
Czech Republic
J. Nekolova � M. Stredova � M. Vesela � N. JiraskovaDepartment of Ophthalmology, Faculty of Medicine in
Hradec Kralove, University Hospital Hradec Kralove,
Charles University, Prague, Czech Republic
123
Doc Ophthalmol (2021) 143:17–31
https://doi.org/10.1007/s10633-020-09814-8(0123456789().,-volV)( 0123456789().,-volV)
LMI Lipshitz macular implant-intraocular
mirror telescope OriLens
AMD Age-related macular degeneration
CNV Choroidal neovascularization
VEP Visual-evoked potential
ERP Event-related potential
PR-VEP Pattern-reversal VEP
PR-VEP 600 PR-VEP evoked by checkerboard of
600 checksPR-VEP 150 PR-VEP evoked by checkerboard of
150 checksM-VEP Motion-onset VEP
M-VEP C8� M-VEP evoked by central 8� stimulus
M-VEP
M20�M-VEP evoked by peripheral stimulus
outside central 20�NVA Near visual acuity
BCVA Best-corrected distant visual acuity
ETDRS Early treatment diabetic retinopathy
study
P100, N75,
N145
Peak names of the PR-VEP
P1, N2, P2 Peak names of the M-VEP
P3b, P300 Peak names of ERP
Introduction
A loss of central vision impairs a person’s ability to
carry out everyday activities and causes increased
anxiety, depression, and trauma in the elderly popu-
lation. It also decreased quality of life comparably to
other systemic diseases such as cancer, ischemic heart
disease, and stroke [1] and increases the risk of death
more than twofold [2]. The most common form of
focal macular retinopathy or maculopathy is age-
related macular degeneration (AMD). AMD affects
millions of individuals among the aging population
worldwide and is the leading cause of legal blindness
in all high-income EU countries [3]. Approximately
90% of patients suffering from AMD have a ‘‘dry’’
form of AMD with no short-term prospects of drug-
related relief.
To help patients with AMD, various optical or
optoelectronic external low-vision aids can be used to
enhance images so that they are recognizable by the
perimacular part of the retina. Frequently used optical
devices enlarge the near visual scene. Such external
devices have several limitations for visual perception;
the most important limitations include (1) the reduced
role of eye movement in visual scene exploration, (2)
disturbances of the vestibular ocular reflex, and (3)
impaired depth perception (4) necessity to carry and
take care of the aid [4].
Currently, AMD patients have the option of using
intraocular telescopes implanted in the anterior seg-
ment of the eye, which can surpass disadvantages (1),
(2), and (4). While these telescopes still limit the
visual field of view by 20–24�, they can substantially
improve quality of life [4–7]. This limitation led to
progression from a Galilean type toward a mirror lens
telescope (Cassegrain type) and opened peripheral
vision [8]; however, it reduced contrast and luminance
[9]. The disadvantage of the implanted aids is that they
cannot be adjusted for a desired focus/magnification.
Recent developments have shown that an add-on
bifocal aspheric lens with unmagnified periphery and
an addition of ? 10 diopters in the central portion
measuring 1.5 mm in dia (‘‘Scharioth macula lens’’–
SML, Medicontur International, Geneva, Switzerland)
[10] could improve near vision and maintain distant
vision without visual field reduction [11–13]. The
main benefit of such a high add is that a closer working
distance may be used (relative distance magnification)
so that patients are able to read smaller sized print with
less reliance on external magnifiers such as hand or
stand magnifiers.
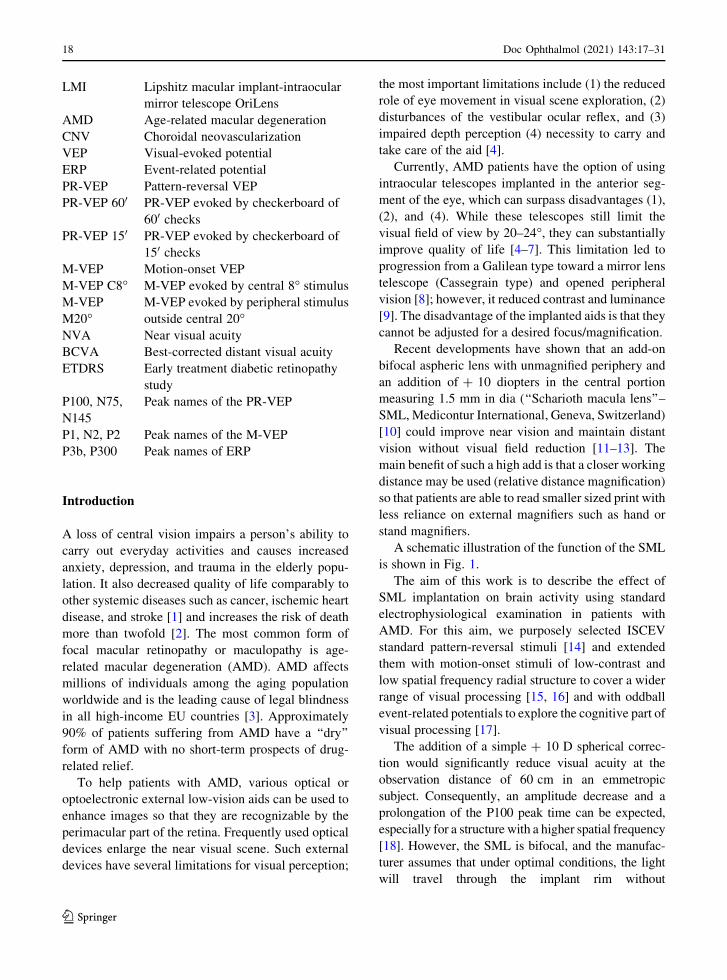
A schematic illustration of the function of the SML
is shown in Fig. 1.
The aim of this work is to describe the effect of
SML implantation on brain activity using standard
electrophysiological examination in patients with
AMD. For this aim, we purposely selected ISCEV
standard pattern-reversal stimuli [14] and extended
them with motion-onset stimuli of low-contrast and
low spatial frequency radial structure to cover a wider
range of visual processing [15, 16] and with oddball
event-related potentials to explore the cognitive part of
visual processing [17].
The addition of a simple ? 10 D spherical correc-
tion would significantly reduce visual acuity at the
observation distance of 60 cm in an emmetropic
subject. Consequently, an amplitude decrease and a
prolongation of the P100 peak time can be expected,
especially for a structure with a higher spatial frequency
[18]. However, the SML is bifocal, and the manufac-
turer assumes that under optimal conditions, the light
will travel through the implant rim without
123
18 Doc Ophthalmol (2021) 143:17–31
magnification (see Fig. 1b). In such a situation, the
SML implantation should not affect the peak P100.
Due to the unstable visual fixation in patients with
AMD, we included motion-onset stimulation in the
examination protocol. This stimulation should be
more robust to fluctuations in patients’ fixation due
to low spatial frequency and concentric radial motion.
At the same time, motion stimulation effectively and
objectively examines the peripheral vision [19]. We
expected that the motion-onset stimulation responses
would be more robust, and the SML implantation
should not alter the N160 peak parameters.
Postoperative visual rehabilitation is part of a practice
to improve vision with the SML. For one month, the
patients are intensively engaged in visual tasks. Using
cognitive potentials, we tested whether patients’ perfor-
mance in the visual domain will increase.
Suppose the SML aid and the subsequent rehabil-
itation are effective. In that case, there should be no
decrease in response to the pattern-reversal or motion-
onset stimulation. Still, we may expect an improve-
ment in cognitive response.
Methods
Patients
The selection criteria for implantation were based on
recommendations of the SML manufacturer (Medi-
contur International, Geneva, Switzerland): age over
55 years, best-corrected distant visual acuity (BCVA)
from 0.4 to 1.3 logMAR (i.e., 0.4–0.05 in decimal
fraction), stabilized maculopathy, and a pseudophakic
eye. Near visual acuity (NVA) was tested preopera-
tively with ? 6.0 diopters from 15 cm, which is
known to be equal to uncorrected NVA postopera-
tively and should be Jaeger table 6 or better. The
exclusion criteria were a photopic pupil size less than
2.5 mm, severe zonulopathy, an anterior chamber
depth less than 2.8 mm, narrow-angle or severe ocular
pathology, or previous retinal surgery.
Patient selection, surgery, clinical care, and some of
the examinations were conducted at the Department of
Ophthalmology, University Hospital in Hradec Kra-
love, Czech Republic. At Department of Pathological
Physiology, Charles University-Faculty of Medicine
in Hradec Kralove, Czech Republic, patients under-
went the electrophysiological examinations. The study
was approved by the Ethics Committee of University
Hospital in Hradec Kralove. All tenets of the Decla-
ration of Helsinki were followed, and all patients
provided informed consent.
The SML was implanted in the better seeing eye by
one of the authors (surgeon N.J.). After pupil dilatation
and application of topical anesthesia, a 2.2 mm
incision was made. The anterior chamber was filled
with an ophthalmic viscosurgical device, and the SML
was implanted using a cartridge. After implantation,
proper positioning of the haptics in the ciliary sulcus
and IOL centration were checked. Finally, the oph-
thalmic viscosurgical device was removed, and the
incision was hydrated.
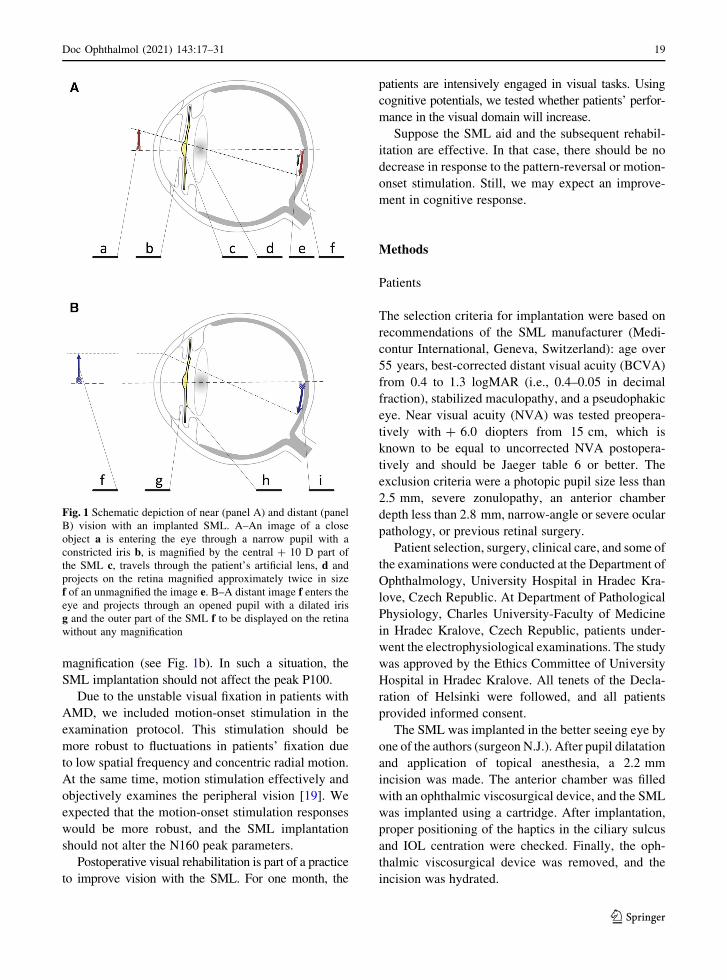
Fig. 1 Schematic depiction of near (panel A) and distant (panel
B) vision with an implanted SML. A–An image of a close
object a is entering the eye through a narrow pupil with a
constricted iris b, is magnified by the central ? 10 D part of
the SML c, travels through the patient’s artificial lens, d and
projects on the retina magnified approximately twice in size
f of an unmagnified the image e. B–A distant image f enters theeye and projects through an opened pupil with a dilated iris
g and the outer part of the SML f to be displayed on the retina
without any magnification
123
Doc Ophthalmol (2021) 143:17–31 19

All the patients underwent standard postoperative
treatment with a topical antibiotic for 1 week and a
topical steroid for 1 month. We informed patients that
sharp vision is achieved at a very near distance of
10–15 cm and advised them to read text from the
largest to the smallest type without glasses or external
magnifiers at least twice a day for 10 min per session.
To facilitate postoperative vision, all the patients
performed a half an hour of a visual rehabilitation
under supervision during the first 3 weeks.
All patients were examined at approximately
27 days (median from a range 5–49 days) before
SML implantation and then at the third day and the
first, second, and sixth months after SML
implantation.
Procedure
On every day of the examination, the BCVA was
measured from 6 m using the Early Treatment
Diabetic Retinopathy Study (ETDRS) chart [20], and
the uncorrected NVA was measured by Jaeger tables–
a printed text of increasing median letter size from
0.37 (J1) mm to 50.1 mm (J24) [21]. The table was
held by the patient, and the smallest print that the
patient could read determined his/her NVA. Reading
from a distance of 175 mm, the text of size J15, J10,
J5, and J1 corresponds to logMAR 1.3, 0.9, 0.6, 0.4,1
respectively.
Before implantation, the NVA was tested with
added ? 6 D (NVA ? 6 D). These readings were
performed at University Hospital.
At the Faculty of Medicine, electrophysiological
examinations were performed in a darkened, sound-
attenuated, electromagnetically shielded room with a
background luminance of 0.1 cd/m2. During the exper-
iment, patients were sitting in a comfortable dental chair
with neck support to reduce muscle artifacts. The correct
fixation was monitored via a near-infrared camera.
Before electrophysiological acquisition, Michelson
luminance contrast sensitivity was determined using
Landolt C with an outer diameter 4800 on a computer
monitor with the Freiburg Visual Acuity Test (4
choices, 24 trials, and screen resolution of 1024 9 768
pixels) [22].
All stimuli for the electrophysiological tests and the
contrast sensitivity test were presented on a 2100
computer monitor (Vision Master Pro 510, Iiyama,
Japan) subtending 37� 9 28� of the visual field from
an observation distance of 0.6 m. The visual stimuli
for VEPs were presented using the Visual Stimulus
Generator 2/5 (CRS ltd., UK) at a vertical refresh
frequency of 105 Hz. The ERP stimuli were presented
using Psychtoolbox 3 [23] at a vertical refresh
frequency of 75 Hz. The recorded epochs were
synchronized with a backward trace of the monitor’s
electron beam just before the first video frame of an
appropriate stimulus change. The recordings were
performed monocularly, and the implanted eye results
were analyzed and reported.
VEPs/ERPs were recorded from 6 unipolar deriva-
tions (OZ, PZ, CZ, FZ, and OL, OR-5 cm left and right
of the OZ) with a right earlobe reference (A2). The
minimum set of recording derivations was chosen
based on a previous topographical study concerning
the scalp distribution of motion-onset VEPs [24]. The
ground electrode was connected to the reference. All
electrode impedances were kept below 10 kX. Thesignal was amplified in the frequency band of
0.3–100 Hz (PSYLAB, System 5, Contact Precision
Instruments, USA).
Pattern-reversal VEPs
Over 20 s, forty reversals of a high-contrast black and
white checkerboard pattern were used to evoke
pattern-reversal VEPs. Two variants of the checker-
board stimulation were used: with check sizes of 600
(PR-VEP 600) and 150 (PR-VEP 150). Each VEP
variant was examined twice. The mean luminance of
17 cd/m2 was constant during the examination.
Patients’ task was to keep their gaze on the fixation
cross during the recording.
EEG poststimulus epochs of 440 ms duration were
sampled at 500 Hz. Epochs with absolute amplitudes
larger than 100 lV were rejected. The rest of the
responses were averaged and smoothed by a second-
order polynomial Savitzky-Golay filter across 17
samples. (The number of samples was determined
empirically to remove high-frequency noise.)
The mean interpeak amplitudes (P100-
(N75 ? N145)/2) and the P100 peak time were
evaluated offline. If the peak P100 was not identifi-
able, we assumed that its mean interpeak amplitude
1 The logMAR we counted as the angle of 1/5 of the height of
the letter a.
123
20 Doc Ophthalmol (2021) 143:17–31

was equal to zero and the peak time was set as not
available.
Motion-onset VEPs
To elicit motion-onset VEPs, we used a radial circular
pattern corrected for equal visibility in the whole
stimulus field by a magnification factor [m. factor = 1/
(0.1 9 eccentricity [�] ? 1)] [25]. The local motion
velocity increased (5–25�/s), while the spatial fre-
quency decreased (1–0.2 cycle/�) toward the periph-
ery. (The temporal frequency of 5.1 cycle/s was
constant over the whole stimulus field.) The structure
moved for 200 ms; then, it was stationary for 1000 ms.
To avoid direction-specific adaptation that would
result in a motion aftereffect, we changed the motion
direction randomly (centrifugal or centripetal). Two
variants of motion stimulation were used: central and
peripheral. During the central variant, the stimulus
occupied the central 8� of the screen (M-VEP C8�),while for the peripheral variant, the central 20� was
masked by a gray circle of pattern average luminance
with a fixation cross in its center (M-VEP M20�). Themean luminance of 17 cd/m2 was constant. One
motion-onset VEP examination took approximately
60 s and consisted of forty stimuli. Each VEP variant
was examined twice. The patients’ task was to keep
their gaze on the fixation point during the recording.
As in the case of pattern-reversal VEPs, EEG
poststimulus epochs of 440 ms duration were sampled
at 500 Hz. Epochs with an absolute amplitude larger
than 100 lV were rejected. The rest of the responses
were averaged and smoothed by a second-order
polynomial Savitzky-Golay filter across 47 samples.
The mean interpeak amplitudes ((P1 ? P2)/2-N2)
and the N2 peak time were evaluated offline. If the N2
peak was not identifiable, we assumed that its mean
interpeak amplitude was equal to zero and the peak
time was set as not available.
Cognitive ERPs
ERPs were recorded during an oddball test in which
the white letter X (frequent, nontarget stimulus with a
probability of 75%) and Arabic digits 1–9 (rare target
stimulus with a probability of 25%) appeared pseudo-
randomly. The ‘‘X’’ or the digit of 5.7 9 6.3� was
displayed for 500 ms in the center of the black
stimulus field, which was followed by a blank screen
with the fixation point displayed for 500 ms. Themean
luminance was 1 cd/m2. The patients were instructed
to press a handheld button as soon as possible
whenever the rare stimulus appeared. This enabled
evaluation of not only the peak time and amplitude of
the main ERP peak P3b (designated in the following
text as P300) but also the reaction time (RT). Before
the examination, a short training phase took place
during which the patient learned the task.
Twenty poststimulus EEG epochs of 1000 ms
duration to target stimuli and 20 randomly selected
epochs to nontarget stimuli were sampled at 250 Hz.
Epochs with an absolute amplitude larger than 200 lVwere rejected. The rest of the responses were averaged
and smoothed by a second-order polynomial Savitzky-
Golay filter across 17 samples. The mean interpeak
amplitude (P3 - (N2 ? N3)/2), the P300 peak time,
and the reaction times were evaluated offline. If the
peak P300 was not identifiable, we assumed that its
mean interpeak amplitude was equal to zero and the
peak time was set as not available.
Our stimulation parameters and conditions were
already described elsewhere [9], and they were
intentionally kept similar to those used in our previous
study of the intraocular mirror telescope—OriLens
(LMI-Lipshitz Macular Implant). The only difference
between the two studies was the pattern check size. In
the present study, we used the ISCEV standard (600
and 150) check size for the pattern-reversal VEPs.
Statistical analyses
To assess the effect of implantation, we compared
preoperative examinations of the implanted eye values
to the postimplantation measurements. The extracted
peak times, average amplitudes, contrast sensitivity,
and visual acuities were statistically processed with R
software version 3.6.2 [26] using the ‘‘nortest’’ and
‘‘ggplot2’’ packages. The VEP/ERP curves were
processed using Matlab environment release 2019b
for documentation.
Based on the Anderson–Darling assessment of
normal data distribution, Student’s parametric or
Wilcoxon nonparametric paired tests were used to
compare differences between selected visits. For
123
Doc Ophthalmol (2021) 143:17–31 21

NVA, the Wilcoxon nonparametric paired test was
used because of the ordinal type of data.
For detection of a parameter change over the
follow-up period, a linear trend analysis was per-
formed as a post hoc analysis. Every patient’s linear
slope was calculated across visits with the exception of
the second one immediately following implantation
because the surgery caused a decrease in almost all
parameters. The slope was calculated only when three
or four readable responses were available. The set of
slopes was tested against zero (no group slope was the
null hypothesis).
A result was considered statistically significant
when the probability level (p) was below the alpha
level of 0.05. False-negative findings when examining
the side effects of implantation can be threatening to
patients. Therefore, to keep the type II error low, we
did not correct the alpha level for multiple compar-
isons. For verification of the findings, we used the
aforementioned post hoc test.
Results
We screened 40 potential subjects for the study. Ten
did not meet the inclusion criteria, and 16 disagreed
with the study conditions. Most often they were
concerned about surgery, hospitalization, and a long
rehabilitation period. Fourteen patients (five males and
nine females ranging in age from 63 to 87 years) with
the fixed form of AMD were selected based on their
clinical state, cooperation, and interest in SML
implantation. Seven right and seven left eyes under-
went implantation. The SML implantation procedures
and postimplantation recovery were performed with-
out any complications or adverse effects in all patients.
All but one patient had identifiable electrophysio-
logical responses at least in one of the tested modal-
ities. The only patient without reliable responses (P7–
female, 87 years) had an excessive number of endoge-
nous muscle artifacts in the recording (see Supple-
mentary material). The behavioral responses were
Fig. 2 Grand average VEPs, ERPs, and the probability of a
button press in the group without patient P7 and the median
psychophysical parameters plotted before (above the gray line)
and after (below the gray line) SML implantation. The rows
represent data recorded within a single visit. The columns depict
the following (from the left): months relative to the surgery;
average of twice recorded VEPs from the implanted eye (red
solid line) and the fellow eye (blue dashed line) elicited by the
reversal of a checkerboard pattern with a check size of 600
(labeled PR-VEP 60 ‘); reversal of a checkerboard pattern with a
check size of 15 ‘ (PR-VEP15 ‘); low-contrast radial motion-
onset stimuli in the central 8� (M-VEP C8�); low-contrast radial
motion-onset stimuli in the periphery outside the central 20� (M-
VEP M20�); target ERPs recorded in the oddball paradigm
(Oddball); reaction time evaluated in response to the target
stimulus (Reaction t.) depicted by the cumulative distribution
function of button pressing with the median reaction time listed
beside it; visual acuity (BCVA) measured on a 6-m distant high-
contrast ETDRS chart and expressed as the logarithm of
minimum angle (logMAR, lower number—better); near visual
acuity (NVA) measured by Jaeger tables (lower number—
better); and the contrast sensitivity (CS) measured by FrVACT
(lower number—better). The individual results in the same
format are provided in the supplementary materials
123
22 Doc Ophthalmol (2021) 143:17–31

recorded in all patients. For the grand average curves,
excluding patient P7, of VEPs, ERPs, and reaction
times and the median reaction times, NVAs, BCVAs,
and contrast sensitivities, see Fig. 2. For the individual
results, see the accompanying supplementary
material.
Pattern-reversal VEPs
In 13 out of 14 patients, we recorded the PR-VEP 600
with a recognizable P100 component with a median
peak time of 128 ms (lower quartile, 118 ms; upper
quartile, 132 ms) and interpeak amplitude of 5.0 (3.6;
7.0) lV before the implantation. During the follow-up
period, the number of patients with a recognizable PR-
VEP 600 response oscillated between 11 and 12. Six
months after the implantation, the peak time of P100
was 129 (119; 136) ms with an amplitude of 4.6 (4.1,
8.0) lV, which was not significantly different from the
preimplantation examination (n = 11, p = 0.2517 vs.
n = 14, p = 0.6489). Across visits, the trend for
amplitudes and peak times did not reach statistical
significance (p[ 0.7805). We saw a significant
(n = 11, p = 0.0344) decrease in the peak time to
133 (126; 137) ms at the first postimplantation visit,
likely because of the impact of surgery.
In case of the PR-VEP 150, we recorded a readable
response in seven patients before surgery in native
conditions, i.e., without any correction. The number of
patients with a readable PR-VEP 150 increased to 9 at
the end of follow-up and oscillated from 5 to 10 during
the follow-up period. There was a statistically signif-
icant prolongation in the P100 peak time between the
preimplantation recording of 148 (138; 152) ms and
the end of follow-up recording of 162 (146; 165) ms
(n = 6, p = 0.0313).2 The mean interpeak amplitude
did not change significantly (n = 14, p[ 0. 3635); for
particular values see Table 1 and Fig. 3. There was no
statistically significant trend in the prolongation of the
P100 peak time of 21 (6; 36) ms/year, (n = 4,
p = 0.1250) or in the mean amplitude change of -
0.1 (- 1.4; 3.2) lV/year, (n = 14, p = 0.4318). For
details, see Table 1, Fig. 2 and the supplementary
material, which depict the grand averages and indi-
vidual patient results.
Motion-onset VEPs
For central radial motion-onset stimulation, we
recorded readable M-VEP C8� from eight patients
preoperatively with an N2 peak time of 210 (186;
220) ms and an interpeak amplitude of 4.1 (0.0;
6.9) lV. At the end of the follow-up period, the peak
time was 212 (202; 219) ms, and the amplitude was
3.2 (0.0; 5.4) lV; in the paired test, these did not reachstatistical significance (n = 7, p = 0.0781 and n = 14,
p = 0.6053, respectively). For other visits, we also did
not find statistically significant differences compared
with preimplantation values (p[ 0.3081). We did not
observe a significant linear intervisit dependence for
the peak time or amplitude (n = 5, p = 0. 3125, and
n = 14, p = 0.2240 respectively).
The only significant motion-onset marker was the
N2 peak time of M-VEPM20�. At the preimplantation
visit, we identified the N2 peak time for all patients of
192 (187; 215) ms. In the paired comparison, it was
statistically significantly (n = 13, p = 0.0341) shorter
by 8 (- 3; 15) ms than the N2 peak time of 205 (187;
218) ms recorded at the last visit. The mean interpeak
preimplantation amplitude of 6.9 (5.7; 7.9) lV was
not different (n = 14, p = 0. 4420) from the last
postimplantation visit value of 6.6 (4.8; 7.5) lV. Thetrend of the N2 peak time prolongation of 14 (- 5;
27) ms/year was statistically significant (n = 12,
p = 0.0355); for the amplitude, we did not see such
dependency (n = 14, p = 0.3248). Similar to PR-VEP
600, we saw significant (n = 11, p = 0.0284) N2 peak
time prolongation to 203 (193, 226) ms at the first
postimplantation visit. For details, see Table 1 and
Fig. 4.
Odd-ball ERPs
At the preimplantation visit, we recorded a distinct
P300 wave for all patients. The P300 peak time of 520
(506; 595) ms and its amplitude of 11.1 (7.6; 13.4) lVwere not significantly different (n = 11, p = 0.4136
and n = 13, p = 0.9251) from the peak time and
amplitude values of 504 (470; 540) ms and 10.6 (5.2;
20.0) lV, respectively, recorded during the last visit.
In addition, for the reaction time, we did not observe
significant difference (p = 0.1245) between the
2 Note that the descriptive parameters of the peak time for
individual visits (Table 1) may not always match those in
pairwise comparisons. This is due to a decrease in paired values
entered in the test because of missing observations.
123
Doc Ophthalmol (2021) 143:17–31 23

preimplantation value of 464 (425; 496) ms and the
last follow-up measurement of 476 (442; 543) ms. For
these parameters, there were not significant differ-
ences compared with other visits (p[ 0.1092), and the
trend analysis did not show a significant slope
(p[ 0.1762).
Distant visual acuity
The median BCVA before surgery was 0.7 (0.5;
0.8) logMAR. Three days after implantation, we
observed a statistically significant (n = 14,
p = 0.0041) decrease in the BCVA to 1.2 (0.8;
1.2) logMAR. In the following records, we saw a
return to the preimplantation level, and two months
after the surgery, with a value of 0.7 (0.5; 0.7) log-
MAR, there was not statistically significant difference
(n = 14, p = 0.8627). The last BCVA of 0.8 (0.7;
0.8) logMAR that was measured six months after
implantation worsened significantly (n = 14,
p = 0.0132) compared to the preimplantation level.
The development of the BCVA is summarized in
Table 1. The slope analysis did not show any trend
(n = 14, p = 0.2166).
Near visual acuity
Preoperatively, we measured the NVA of J15 (J13,
J17) for a native condition and J6 (J3, J7) with ? 6 D
lenses. Postoperatively, only the native condition was
examined, and the NVA was J4 (J1; J6) at the end of
the follow-up period. Postoperatively, all NVA mea-
surements were significantly decreased compared with
the native preimplantation condition (n = 14,
p\ 0.0016). The slope analysis showed a significant
(p\ 0.0001) decrease in the Jaeger table number
Fig. 3 Plot combining the boxplots summarizing the develop-
ment of the P100 peak time of PR-VEP 150. The results are
grouped by visit. The individual measurements are depicted as
semitransparent gray points connected by dotted lines to depict
within-patient relations. The plot illustrates a prolongation of
the P100 peak time just after implantation and a return close to
preimplantation levels within one month. With respect to the
preimplantation recording, the only significant peak time
prolongation was recorded during the last visit
123
24 Doc Ophthalmol (2021) 143:17–31

(increase in the NVA) during the follow-up period.
Compared with preoperative ? 6 D condition, we
found a significantly (n = 14, p = 0.0075) worse NVA
J10 (J6, J9) on the third day postoperatively, which
improved and was not significantly different
(p[ 0.1340) during the rest of the follow-up period.
For details, see Table 1, Fig. 5, and the supplementary
material.
Contrast sensitivity
Viewed natively before implantation, the lowest
contrast allowing discrimination of the 4800 LandoltC orientation was 2.3 (1.7; 2.9)%. This was not
significantly different (n = 14, p[ 0.0785) from the
postimplantation contrast sensitivity 2.9 (2.1; 4.8)%.
The trend analysis did not reject the hypothesis that the
slope is different from zero (n = 14, p = 0.0906). For
details, see Table 1 and the supplementary material.
The cells from the second row and the second
column contain descriptive statistics, the median
(upper, lower quartile), and the number of observa-
tions (n). In cases in which the measurement was
significantly different from the preimplantation value,
the stars and hashes indicate Student’s or Wilcoxon
(respectively) paired tests of significance: * or #
corresponds to p\ 0.05 and p C 0.01, ** or ##
corresponds to p\ 0.01 and p C 0.001, and *** or### corresponds to p\ 0.001. When a VEP peak was
unidentifiable, we assigned 0 lV to the corresponding
amplitude, and the peak time was set as not available;
therefore, the number of observations might differ for
the peak time and amplitude.
Discussion
Using electrophysiological examination in this
prospective study, we followed fourteen patients
before and 6 months after SML implantation to
evaluate effect of implantation on their visual pro-
cessing and to assess whether motion-onset VEPs are
suitable to monitor the vision of patients with AMD.
A significant effect of implantation on VEPs was
already present during the first postoperative mea-
surement. Although patients’ near visual acuity
improved, we observed a stronger transient deteriora-
tion in distant vision and a prolongation of the peak
time to pattern-reversal of the checkerboard 600 andthe motion-onset stimuli in the peripheral field.
In the long term, the continuous and robust
improvement in near visual acuity was accompanied
by a slight but significant N2 peak time prolongation
of peripheral motion-onset VEPs during follow-up and
by a decrease in the P100 peak time of PR-VEP 150 atthe last visit. Such VEP deterioration was supple-
mented by a small decrease in distant visual acuity.
The other electrophysiological results did not show
any significant change.
Since the development of the SML principle and its
use in maculopathies [10], four papers evaluating the
effect of SML [11–13, 27] and one case report of a
patient with diabetic macular disease [28] have been
published (pubmed.gov searched for ‘‘Scharioth mac-
ula lens’’ in July 2020). The studies agreed that the
SML improves near visual acuity and does not affect
distant vision. None of these works used visual-
evoked potentials.
Regarding the use of electrophysiological exami-
nation of patients with AMD and an optical implant,
we found only one published report (pubmed.gov
searched for ‘‘visual evoked potential macular degen-
eration implant’’ in June 2020) describing the longi-
tudinal monitoring of a 70-year-old female and a
90-year-old male with LMI implants [9]. While distant
visual acuity increased after LMI implantation, and
peripheral projection was preserved, theM-VEPM20�peak time was prolonged after implantation. The
authors showed that electrophysiological examination
may help reveal a neglected factor of light attenuation
caused by LMI. Based on the VEP results, they tested
contrast sensitivity, which showed a postimplantation
decrease [9]. These results led us to measure the
contrast sensitivity, which did not change significantly
after SML implantation.
For the sensitivity of pattern-reversal in AMD
patients, there are studies reporting a decrease in the
amplitude and a prolongation of the peak time of the
P100 wave [29–32]. We compared our patients with
respect to the laboratory norm of the P100 peak time
recorded at a high spatial frequency structure reversal.
The P100 wave was missing in seven patients or had a
peak time longer than 141 ms in four patients. The
incidence of abnormality was 79%, which is exactly
the same as in the study by Niermann et al. [31]. This is
not surprising as the VEPs for high spatial frequency
123
Doc Ophthalmol (2021) 143:17–31 25

pattern-reversal depend mostly on foveal representa-
tion [33].
Other than the mentioned case study of LMI, no
studies have evaluated motion-onset VEPs in AMD
patients (pubmed.gov searched for ‘‘motion-onset
visual evoked potential macular degeneration’’ in July
2020). In our study, responses to central motion-onset
stimulation were affected similarly to pattern-reversal
VEPs; the N2 peak was missing in six patients and
prolonged above 211 ms in four patients. The situation
was different for stimulation in the periphery of the
visual field. In the preimplantation period, nine
patients had a dominant peak within the normal limit
(below 212 ms), and the remaining five exceeded the
norm by 1, 3, 11, 12, and 24 ms. The number of
normal findings might be underestimated, however,
since the norm was created for controls aged
50–60 years [34]. A similar preservation of electro-
physiological responses to visual motion was
described for amblyopia; the authors found signifi-
cantly reduced responses to pattern-reversal stimula-
tion, while responses to the motion-onset stimulation
were comparable to the control group [35]. In these
two disorders, the common electrophysiological out-
come is caused by reduced central and preserved
peripheral vision of different etiologies, which is
consistent with the low specificity of VEPs.
With many unrecordable reactions in AMD, the
high sensitivity of PR-VEP does not seem to be
enough for monitoring vision changes in these
patients. For this purpose, peripheral low-contrast
motion-onset stimulation is suitable to monitor for
comorbidities or changes in the visual system because
M-VEP M20� was detectable in most of our AMD
patients, and, as a concurrent necessary condition, it is
sufficiently sensitive in various diseases such as
neuritis, multiple sclerosis, and neuroborreliosis (for
review see [15]).
Our study supported a generally accepted view that
near visual acuity, measured without any additional
correction, improves significantly after SML implan-
tation [12, 13, 27]; these studies also claim that distant
visual acuity remains without a statistical change;
however, there was an observable minor decrease
across these studies.3 We found that the BCVA
underwent statistically significant changes. After
implantation, the BCVA decreased significantly,
returned to preimplantation level after a month, and
then decreased again after 6 months (see Table 1). To
support the view that distant vision is undergoing
development, one should consider the parallel changes
we measured in response to peripheral motion-onset
stimulation. They were also reflected by trend analy-
sis, which was not statistically significant for BCVA
likely because of higher intervisit dynamics (see the
supplementary material). Despite the statistical sig-
nificance, just one line of the logMAR chart differen-
tiated the preimplantation from the last
postimplantation visit BCVA.
The change in distant and peripheral vision could
be due to the optical properties of the SML or brain
adaptation to a new monocular situation. A change in
the optical properties of one eye to enhance near vision
creates so-called monovision, which might modify
VEPs [36]. Since the change in VEPs was slow, its
origin resembles brain plasticity in response to mono-
vision rather than direct optical degradation of distant
and peripheral images by the SML. Aging as another
reason for the changes in distant and peripheral vision
[37] is unlikely because the M-VEP M20� N2 peak
time has a trend of 0.8 ms/year in the normal
population between 18 and 60 years [34], and we
measured a decrease of 14 ms/year in present study.
Furthermore, in contrast to the results in the implanted
eyes, in the fellow eyes, we did not see a significant
difference (n = 11, p = 0.7555) in the M-VEP M20�N2 peak time between preimplantation and six months
postimplantation.
Thus, we conclude that in addition to the strong and
desirable effect on near vision, there is a long-term
consequence of SML implantation in a small decrease
in distant and peripheral vision in the implanted eye.
In our study, we found a seeming dissociation
between psychophysical and electrophysiological
recordings. The reason the electrophysiological results
did not follow the NVA improvement could be due to
3 Nekolova et al. [12] described a BCVA before implantation of
0.57 (min 0.5, max 0.7) logMAR and 0.62 (min 0.5, max 0.7)
logMAR after six months for 8 eyes. For the BCVAmeasured in
Footnote 3 continued
50 eyes, Shrinivashan et al. [13] did not find any difference
before (0.7 ± 0.9 logMAR) and after one year (0.7 ± 1.1 log-
MAR); however, for the uncorrected distant visual acuity, they
measured a value of 0.7 ± 1.1 logMAR before implantation vs.
0.8 ± 1.1 logMAR one year later. In 15 eyes, Bereczki et al.
[27] described a value of 0.34 ± 0.92 logMAR before implan-
tation and 0.37 ± 0.92 logMAR three months later.
123
26 Doc Ophthalmol (2021) 143:17–31

Ta
ble
1Thecolumns(from
thesecondone)
depicttimewithrespectto
thesurgery
Visit[tim
erelativeto
surgery]
-1month
3rd
day
1month
2months
6months
PR-V
EP600P100peaktime[m
s]
p=0.7805
128(118;132)n=13
133(126;136.5)*
n=11
130(122;135.5)n=11
129.5
(113.5;133)n=12
129(119;136)n=11
PR-V
EP600P100am
plitude[lV]
p=0.9862
5.0
(3.6;7)n=14
4.4
(2.8;7.8)
n=14
4.4
(3.4;6.9)n=14
6.1
(2.9;6.5)n=14
4.6
(4.1;8.0)n=14
PR-V
EP150P100peaktime[m
s]
p=0.1250
147(135;151)n=7
152(147.8;157.8)
n=8
143.5
(141.2;150.5)n=10
140(137;145)n=5
161(141;166)#
n=9
PR-V
EP150P100am
plitude[lV]
p=0.4318
2(0.9;3.5)n=14
1.9
(1.1;4.6)
n=14
2.9
(0.6;6.4)n=14
0.9
(0.0;3.9)n=14
3.3
(0.5;5.2)n=14
M-V
EPC8�N2peaktime[m
s]
p=0.3125
210(185.8;220)n=8
194(185;205)
n=8
205(193;226)n=6
199(193;228)n=9
211.5
(202;219)n=8
M-V
EPC8�N2am
plitude[lV]
p=0.2240
4.1
(0.0;6.9)n=14
2.9
(0.0;6.3)
n=14
2.7
(0.0;6.4)n=14
3.2
(0.0;6.0)n=14
3.2
(0.0;5.4)n=14
M-V
EPM20�N2peaktime[m
s]
p=0.03554
191.5
(186.5;214.5)n=14
203(192.5;225.5)
n=11
191(185;211)n=13
198.5
(188;205.5)n=12
205(187;218)*n=13
M-V
EPM20�N2am
plitude[lV]
p=0.3248
6.9
(5.7;7.9)n=14
5.6
(3.9;7)
n=14
6.8
(5.8;8.5)n=14
5.4
(4.6;7.9)n=14
6.6
(4.8;7.4)n=14
Odd-ballP300peaktime[m
s]
p=0.3868
520(506;595)n=14
508(466;562)
n=11
524(492;580)n=13
492(472;560)n=11
504(470;540)n=11
Odd-ballP300am
plitude[lV]
p=0.9720
11.1
(7.6;13.4)n=14
10.2
(5.4;12.9)
n=14
9.7
(7;15.9)n=14
11.7
(4.4;14.4)n=14
10.6
(5.2;20.0)n=13
Reactiontime[m
s]
p=0.1762
464(425;496)n=14
456(428;540)
n=13
478(426;524)n=14
450(433;542)n=14
476(442;543)n=14
BCVA
[logMAR]
p=0.2166
0.7
(0.5;0.8)n=14
1.2
(0.8;1.2)##
n=14
0.8
(0.5;1)n=14
0.7
(0.5;0.8)n=14
0.8
(0.7;0.8)*n=14
NVA
[Jaeger
table]
p\
0.0001
J15(J13;J17)n=14
J10(J6;J12)##
n=14
J5(J3;J7)##
n=14
J5(J1;J6)##
n=14
J4(J1;J6)##
n=14
NVA
?6D
before
surg.[Jaeger
table]
p=0.03667
J6(J3;J7)n=14
J10(J6;J12)##
n=14
J5(J3;J7)n=14
J5(J1;J6)n=14
J4(J1;J6)n=14
CS[%
]p=0.09057617
2.3
(1.7;2.9)n=14
2.8
(2.1;3.2)
n=14
2.3
(2.1;3.2)n=14
2.2
(1.8;3.4)n=14
2.9
(2.1;4.8)n=14
Therowsrepresentthefollowingparam
eters.
Thenam
esfortheelectrophysiological
param
etersandreactiontimeareself-explanatory.Forthepsychophysicalparam
eters,
BCVAstandsforthebest-correctedvisualacuityat
6m
measuredbythehigh-contrastETDRSchartandexpressed
asthelogarithm
oftheminim
um
angle
resolution(logMAR,
lower
number—
better);NVA
isthenearvisual
acuitymeasuredbyJaeger
tables(lower
number—
better);NVA
?6D
istheNVA
tested
with?
6D
lensbefore
implantation;
andCSis
theMichelsoncontrastsensitivitymeasuredbyFrV
ACT(lower
number—
better).Thep-valuein
this
columncorrespondsto
thelineartrendhypothesis
test
(see
Methods)
123
Doc Ophthalmol (2021) 143:17–31 27

the different observation distance. It was approxi-
mately 15 cm for the NVA and 60 cm for the
electrophysiological examinations, which was out of
the SML focus (15 cm). In addition, during the NVA
test, we used the subject’s desired illumination, which
was usually higher than normal daylight, which, in
combination with the accommodation convergence
reflex for close viewing distance, reduced possible
corneal image spreading and contributed to the better
NVA.
Conclusions
We proved that measurement of VEPs can be used to
evaluate the vision of patients with AMD and to
monitor changes related to monovision.
With an observation distance of 60 cm, the elec-
trophysiological markers did not reach or surmount
the preimplantation level, while the near visual acuity
without an external aid improved strongly. Electro-
physiological testing brought valuable outcomes in
evaluating distant and peripheral vision.
Using motion-onset peripheral stimulation, we
recorded a canonical form of motion-onset VEPs in
the majority of our AMD patients throughout the
follow-up period. This helped to reveal a long-term
consequence of SML implantation as a decrease in
distant and peripheral vision in the implanted eye. This
effect is negligible compared with the near vision
enhancement. Pattern-reversal VEPs were also a
sensitive test but only partially effective as they were
not recordable in many patients.
Fig. 4 N2 peak time in peripheral radial motion-onset VEPs
grouped by visit. The individual measurements are depicted as
semitransparent gray points connected by dotted lines to depict
within-patient relations. The plot illustrates two statistically
significant findings—the paired difference between preimplan-
tation and the first postimplantation visit (n = 11, p = 0.0284) or
last visit (n = 13, p = 0.0341)
123
28 Doc Ophthalmol (2021) 143:17–31

Limitations
The electrophysiological examinations were influ-
enced by patients’ reduced ability to fixate due to
maculopathy. Therefore, some recordings have a
lower S/N ratio, which might decrease the sensitivity
of the testing. We tried to reduce this effect using a
bigger fixation cross of 1� and by including a
peripheral motion stimulus.
In the simple oddball discrimination task, it is not
clear how much a learning during repeated examina-
tions might confound the cognitive function
evaluation.
The specific effect of the SML was not evident in
our VEP examination; however, testing with a very
close viewing distance (15 cm) could be an appropri-
ate condition for its evaluation. Our results are
indicative of routine VEP examinations. Also, CS
measure was examined from the same distance having
the same limitations.
Our monitored electrophysiological parameters
alone are not sufficient to estimate the effectiveness
of treatment with the SML. For such conclusions, it is
necessary to evaluate the quality of life of patients,
which is included in the continuation of our project.
Acknowledgements The authors thank Moravkova Daniela,
Drtılkova Kristyna, Ladislava Kolkova, and Jitka Kotlandova
for visual rehabilitation and data collection.
Author contributions J.K., N.J., M.K., Z.K., J.N., and F.V.
contributed to the study conception, design, and material
preparation. Surgery was performed by N.J. J.N. with the help
of M.S. sought out and identified patients for the study and
performed pre- and postoperative care. Data collection was
performed by J.L., J. S., J.N, M.S. and M.V. The analysis was
performed by J.K. The first draft of the manuscript was written
by J.K., and all authors commented on the manuscript. All
authors read and approved the final manuscript.
Funding This work was supported by Ministry of Health of
the Czech Republic, grant nr. AZV NV18-06–00484 and project
PROGRES Q40/07. The sponsor provided financial support in
Fig. 5 Near visual acuity measured without any correction
grouped by visit. The individual measurements are depicted as
semitransparent gray points connected by dotted lines to depict
within-patient relations. The plot illustrates the continuous
improvement in near visual acuity after the implantation
123
Doc Ophthalmol (2021) 143:17–31 29

the form of salaries and consumables and had no role in the
design or conduct of this research.
Data availability The dataset is obtainable from the
corresponding author on reasonable request.
Code availability The analysis script is available from the
corresponding author on reasonable request.
Compliance with ethical standards
Conflict of Interest All authors certify that they have no
affiliations with or involvement in any organization or entity
with any financial interest (such as honoraria; educational
grants; participation in speakers’ bureaus; membership,
employment, consultancies, stock ownership, or other equity
interest; and expert testimony or patent-licensing arrange-
ments), or nonfinancial interest (such as personal or professional
relationships, affiliations, knowledge, or beliefs) in the subject
matter or materials discussed in this manuscript.
Ethics approval The study was approved by the Ethical
committee of University Hospital in Hradec Kralove (No.
201707 S08P).
Consent to participate Informed consent was obtained from
all individual participants included in the study.
Consent for publication Not applicable.
Statement of human rights All procedures performed in our
study were in accordance with the ethical standards of the
institutional and/or national research committee and with the
1964 Helsinki declaration and its later amendments or compa-
rable ethical standards.
Statement on the welfare of animals This report does not
contain any studies with animals performed by any of the authors.
Open Access This article is licensed under a Creative Com-
mons Attribution 4.0 International License, which permits use,
sharing, adaptation, distribution and reproduction in any med-
ium or format, as long as you give appropriate credit to the
original author(s) and the source, provide a link to the Creative
Commons licence, and indicate if changes were made. The
images or other third party material in this article are included in
the article’s Creative Commons licence, unless indicated
otherwise in a credit line to the material. If material is not
included in the article’s Creative Commons licence and your
intended use is not permitted by statutory regulation or exceeds
the permitted use, you will need to obtain permission directly
from the copyright holder. To view a copy of this licence, visit
http://creativecommons.org/licenses/by/4.0/.
References
1. Yuzawa M, Fujita K, Tanaka E, Wang ECY (2013)
Assessing quality of life in the treatment of patients with
age-related macular degeneration: clinical research findings
and recommendations for clinical practice. Clin Ophthalmol
7:1325–1332. https://doi.org/10.2147/OPTH.S45248
2. Taylor HR, McCarty CA, Nanjan MB (2000) Vision
impairment predicts five-year mortality. Trans Am Oph-
thalmol Soc 98:91–96
3. Bourne RRA, Jonas JB, Flaxman SR et al (2014) Prevalence
and causes of vision loss in high-income countries and in
Eastern and Central Europe: 1990–2010. Br J Ophthalmol
98:629–638. https://doi.org/10.1136/bjophthalmol-2013-
304033
4. SingerAmirHerro MaNA et al (2012) Improving quality of
life in patients with end-stage age-related macular degen-
eration: focus on miniature ocular implants. Clin Ophthal-
mol 6:33–39. https://doi.org/10.2147/OPTH.S15028
5. Hau VS, London N, Dalton M (2016) The treatment para-
digm for the implantable miniature telescope. Ophthalmol
Ther 5:21–30. https://doi.org/10.1007/s40123-016-0047-5
6. Gupta A, Lam J, Custis P et al (2014) Implantable miniature
telescope (IMT) for vision loss due to end-stage age-related
macular degeneration. In: Gupta A (ed) Cochrane Database
of Systematic Reviews. Wiley, UK
7. Agarwal A, Lipshitz I, Jacob S et al (2008)Mirror telescopic
intraocular lens for age-related macular degeneration:
design and preliminary clinical results of the Lipshitz
macular implant. J Cataract Refract Surg 34:87–94. https://
doi.org/10.1016/j.jcrs.2007.08.031
8. Lipshitz I, Lipshitz Y (2009) Intra-Ocular Implant. 2.
https://patents.google.com/patent/CN104203155A/en
9. Kremlacek J, Jiraskova N, Nekolova J et al (2016) Elec-
trophysiological testing of visual function after mirror
telescope implantation: a case report. Doc Ophthalmol
133:171–181. https://doi.org/10.1007/s10633-016-9563-9
10. Scharioth GB (2015) New add-on intraocular lens for
patients with age-related macular degeneration. J Cataract
Refract Surg 41:1559–1563. https://doi.org/10.1016/j.jcrs.
2015.07.018
11. Nekolova J, Kremlacek J, Kuba M et al (2019) Methods of
improving the visual functions in patients with stable mac-
ulopathy-pilot results of a new study. Czech Slovak Oph-
thalmol. 75:130–135. https://doi.org/10.31348/2019/3/3
12. Nekolova J, Rozsival P, Sin M, Jiraskova N (2017) Schar-
ioth macula lens: a new intraocular implant for low-vision
patients with stabilized maculopathy-first experience.
Biomed Pap. https://doi.org/10.5507/bp.2017.014
13. Srinivasan S, Riehl A, Tanev IV et al (2019) Implantation of
Scharioth macula lens in patients with age-related macular
degeneration: results of a prospective European multicentre
clinical trial. BMJ Open Ophthalmol 4:000322. https://doi.
org/10.1136/bmjophth-2019-000322corr1
14. Odom JV, Bach M, Brigell M et al (2016) ISCEV standard
for clinical visual evoked potentials: (2016 update). Doc
Ophthalmol 133:1–9. https://doi.org/10.1007/s10633-016-
9553-y
15. Kuba M, Kubova Z, Kremlacek J, Langrova J (2007)
Motion-onset VEPs: characteristics, methods, and diag-
nostic use. Vis Res. 47:189–202. https://doi.org/10.1016/j.
visres.2006.09.020
16. Heinrich SP (2007) A primer on motion visual evoked
potentials. Doc Ophthalmol 114:83–105. https://doi.org/10.
1007/s10633-006-9043-8
123
30 Doc Ophthalmol (2021) 143:17–31

17. Polich J (1993) Cognitive Brain Potentials. Curr Dir Psychol
Sci 2:175–179. https://doi.org/10.1111/1467-8721.
ep10769728
18. Sokol S, Moskowitz A (1981) Effect of retinal blur on the
peak latency of the pattern evoked potential. Vision Res
21:1279–1286
19. Kremlacek J, Kuba M, Chlubnova J, Kubova Z (2004)
Effect of stimulus localisation on motion-onset VEP. Vision
Res 44:2989–3000. https://doi.org/10.1016/j.visres.2004.
07.002
20. Bailey IL, Lovie-Kitchin JE (2013) Visual acuity testing
from the laboratory to the clinic. Vision Res 90:2–9. https://
doi.org/10.1016/j.visres.2013.05.004
21. Rubin GS (2013) Measuring reading performance. Vision
Res 90:43–51. https://doi.org/10.1016/j.visres.2013.02.015
22. Bach M (2007) The freiburg visual acuity test-variability
unchanged by post-hoc re-analysis. Graefes Arch Clin Exp
Ophthalmol 245:965–971. https://doi.org/10.1007/s00417-
006-0474-4
23. Brainard DH (1997) The Psychophysics Toolbox. Spat Vis
10:433–436
24. Kremlacek J, Kuba M (1999) Global brain dynamics of
transient visual evoked potentials. Physiol Res 48:303–308
25. Kremlacek J, Kuba M, Kubova Z, Chlubnova J (2004)
Motion-onset VEPs to translating, radial, rotating and spiral
stimuli. Doc Ophthalmol 109:169–175
26. R Development Core Team (2020) R: A Language and
Environment for Statistical Computing. R Found. Stat.
Comput. 3503
27. Bereczki A (2019) Experiences with the Scharioth Macula
Lens– new hope for patients with dry macular degeneration.
Rom J Ophthalmol. 63:128–134. https://doi.org/10.22336/
rjo.2019.19
28. Chantarasorn Y, Kim EL, Thabsuwan K (2019) Macular
add-on intraocular lens successfully restores reading vision
in eyes with end-stage diabetic macular disease. Retin Cases
Brief Rep Publish Ah: https://doi.org/10.1097/ICB.
0000000000000885
29. Bass S, Sherman J, Bodis-Wollner I, Nath S (1985) Visual
evoked potentials in macular disease. Ophthalmol Vis.
16:1071–1074
30. Moschos MM, Nitoda E (2018) The Role of mf-ERG in the
diagnosis and treatment of age-related macular degenera-
tion: electrophysiological features of AMD. Semin Oph-
thalmol 33:461–469. https://doi.org/10.1080/08820538.
2017.1301496
31. Niermann F, Lorenz R, Heider W (1989) Pattern elec-
troretinography and pattern visual evoked potentials in
maculopathy: a comparison with sensory tests. Fortschr
Ophthalmol 86:54–58
32. Perlman I, Segev E, Mazawi N et al (2001) Visual evoked
cortical potential can be used to differentiate between
uncorrected refractive error and macular disorders. Doc
Ophthalmol 102:41–62. https://doi.org/10.1023/a:
1017539308389
33. Meredith JT, Celesia GG (1982) Pattern-reversal visual
evoked potentials and retinal eccentricity. Electroen-
cephalogr Clin Neurophysiol 53:243–253. https://doi.org/
10.1016/0013-4694(82)90082-7
34. Langrova J, KubaM, Kremlacek J et al (2006)Motion-onset
VEPs reflect long maturation and early aging of visual
motion-processing system. Vision Res 46:536–544. https://
doi.org/10.1016/j.visres.2005.06.024
35. Kubova Z, Kuba M, Juran J, Blakemore C (1996) Is the
motion system relatively spared in amblyopia? evidence
from cortical evoked responses. Vis Res 36:181–190
36. Zeri F, Berchicci M, Naroo SA et al (2018) Immediate
cortical adaptation in visual and non-visual areas functions
induced by monovision. J Physiol 596:253–266. https://doi.
org/10.1113/JP274896
37. Kuba M, Kremlacek J, Langrova J et al (2012) Aging effect
in pattern, motion and cognitive visual evoked potentials.
Vision Res 62:9–16. https://doi.org/10.1016/j.visres.2012.
03.014
Publisher’s Note Springer Nature remains neutral with
regard to jurisdictional claims in published maps and
institutional affiliations.
123
Doc Ophthalmol (2021) 143:17–31 31