visual replenishment methods in the manufacturing …624651/fulltext01.pdf · i . visual...
TRANSCRIPT

i
Visual replenishment methods in the manufacturing industry
and suggestion for a decision tool
Licentiate thesis by
Stefan Eriksson
Stockholm, Sweden 2013

ii
© Stefan Eriksson Stockholm 2013, Royal Institute of Technology Department of Production Engineering TRITA-IIP-13-06 ISSN 1650-1888

i
Abstract In almost all supply chains, materials need to be stored or buffered, implying that manufacturing companies need effective replenishment methods. However, this is challenging, since companies must balance inventory costs and customer service in complex and different situations. Therefore, it is important to choose replenishment methods carefully. One well-known and widespread method is Material Requirements Planning (MRP). But the method has problems, such as regarding volume flexibility. There are other methods, but the literature lacks case studies and detailed descriptions and analysis of them, especially for visually oriented methods. Therefore, it is important to explore different methods for materials supply. The purpose of this study is to analyze the application of visually oriented replenishment methods in manufacturing industry and further to design a tentative decision tool for selecting methods. The research aims to provide some answers to three key questions. The first research question concerns general factors that are important for evaluating how effective replenishment methods are. From the literature review, different factors emerged such as product characteristics (fit in the Kraljic matrix, volume issues, size, etc.); information, trust, and geographical proximity between supplier and customer; and different logistics goals (delivery service elements, tied-up capital, use of resources, inventory accuracy). It is also import to include the basic principles methods are related to. The factors were summarized in an analysis model, which is structured with three main areas (planning environment/conditions, basic principles, and effects). The model is used to analyze four case studies. The second research question focuses on the characteristics for visually oriented replenishment methods. Examples of characteristics are: easy to understand and operate, offers uncomplicated flows, substantially applicable for noncritical and leverage parts with high yearly requirement and fairly even consumption, provides potential for reduced errors in stores/flows, potential for providing high delivery service and low levels of tied-up capital and resource utilization. The third research question focuses on what a tentative decision tool for selecting replenishment methods might look like, based on the factors that emerged from the other research questions and studies by others. In order to achieve an efficient materials supply, companies need to consider these factors when selecting replenishment methods. The decision tool consists of different steps, considering aspects of the planning environment/conditions in relation to the product and the supplier. The importance of the companies’ goals/motives for materials supply must also be assessed. The output from the decision tool is appropriate replenishment methods. Keywords: materials supply, replenishment methods, visual, selecting methods, decision tool

ii
Preface This thesis work has been very interesting and fruitful for me in several aspects. I am very grateful to have had the opportunity to start this research in the first place. This education in research has developed my scientific understanding, contributed insights into what research is and increased my knowledge within the area of materials supply and other related areas. Moreover, the work has influenced my role as a teacher and program coordinator positively here at the University of Gävle. I am now, thanks to this education, more able to support my students in a better way and to help them to develop themselves academically. I am very grateful to all those who have supported me in this work. First of all I would like to thank my supervisors Professor Lars Bengtsson at the University of Gävle, Docent Peter Gröndahl, and Professor Mauro Onori at the Royal Institute of Technology in Stockholm. You have been helpful, positive, and flexible supervisors. I am also thankful for valuable feedback and tips from my colleagues at the department. Furthermore, the research seminars held at the University of Gävle and at the Royal Institute of Technology have been very valuable for this work. The seminars have been creative, inspiring, and interesting for me and have helped me to continue the thesis work with more strength and more ideas. I am also thankful for the contributions from the respondents at the company where the case studies were conducted. They devoted serious attention to this work, and have offered their time and provided me with valuable empirical information and inspiring discussions. Visits to the company have always been interesting and fruitful, and I have always felt that I was welcomed. Besides the valuable empirical material itself, the visits also contributed to a practical understanding of materials supply. The opportunity to informally talk to different employees and see how methods work in practice provides important input when doing research, I believe. Finally, I also want to express my appreciation for the opportunity of financial support I have received from CLIP (the Center for Logistics and Innovative Production) here at the University of Gävle.

iii
Glossary 3PLP Third Party Logistics Provider BOM Bill Of Material COP Call-Off Production EDI Electronic Data Interchange ERP Enterprise Resource Planning Fill rate (or inventory service level) Describes to what extent stock items are actually available in stock when they are demanded IHD In-House Delivery MI Mobile Inventory MRP Material Requirements Planning Pallet flag A piece of plastic marked with part number and replenishment quantity Planning environment/conditions Essential conditions or other contextual circumstances for making a replenishment method work properly Replenishment method Materials supply from a supplier to use in production, from a manufacturer’s point of view VMI Vendor-Managed Inventory

iv
Table of contents 1 Introduction ........................................................................................................ 1
1.1 Background ................................................................................................. 1 1.2 Purpose and research questions ................................................................... 4 1.3 Delimitations ............................................................................................... 4 1.4 Thesis outline .............................................................................................. 5
2 Method ............................................................................................................... 6 2.1 The start of the study and a brief overview ................................................. 6 2.2 Scientific approach and selection of methods ............................................. 6 2.3 Research design ........................................................................................... 8 2.4 Defining replenishment methods .............................................................. 10 2.5 Quality in the study: Validity and reliability ............................................. 10
3 Theoretical framework and the analysis model ............................................... 12 3.1 The supply chain and common terms ........................................................ 12 3.2 Decisions concerning logistics and replenishment. Logistics models. ..... 14 3.3 What factors are important for evaluating how effective replenishment methods are? ........................................................................................................ 16
3.3.1 Planning environment ......................................................................... 16 3.3.2 Product characteristics ........................................................................ 16 3.3.3 Materials planning methods and the material flow ............................ 18 3.3.4 Communication, trust, and geographical proximity ........................... 21 3.3.5 Visualizing .......................................................................................... 22 3.3.6 Logistics goals .................................................................................... 23
3.4 A model for analyzing the application of replenishment methods ........... 25 4 Case studies: Descriptions and analysis ........................................................... 27
4.1 In-House Delivery (IHD) .......................................................................... 27 4.2 Mobile Inventory (MI) .............................................................................. 33 4.3 Call-Off Production (COP) ....................................................................... 40 4.4 Material Requirements Planning (MRP) ................................................... 48 4.5 Factors to consider when selecting replenishment methods ..................... 55
5 Factors important for analyzing replenishment methods ................................. 56 6 Characteristics of visually oriented replenishment methods ........................... 58
6.1 Summarizing and comparing the methods ................................................ 58 6.2 Discussion ................................................................................................. 64
7 A tentative decision tool for selecting replenishment methods ....................... 66 8 Conclusions, contributions, and further research ............................................. 72
8.1 Conclusions ............................................................................................... 72 8.2 Contributions ............................................................................................. 77 8.3 Suggestions for future research ................................................................. 77
References Appendix 1 Guide for the interviews

1
1 Introduction
The chapter provides background, presents the purpose, research questions, and delimitations, and ends with a thesis outline.
1.1 Background
The fields of logistics, supply chain management, and lean production/lean supply are all given prominent attention today. How the terms are related to each other and how they are described and defined varies in the literature, but the essential meaning of them all could be seen as reducing waste and improving the production system and the supply chain in different aspects. This is important to focus on, since today’s market is characterized by turbulence and uncertainty; the need nowadays is more volatile than was the case in earlier periods (Tachizawa and Thomsen, 2007; Christopher, 2005). Therefore, it is essential to establish a supply chain that can meet this kind of environment to fulfill customers’ requests. To become competitive, companies must adapt to new prerequisites and possibilities in the supply chains, the companies' roles, and their relations within the supply chains (Mattsson, 2002). However, a supply chain is complex and involves several aspects and actors; it consists of all parties involved, directly or indirectly, not only the manufacturers and suppliers, but also transporters, warehouses, retailers, and even customers themselves (Chopra and Meindl, 2013). Furthermore, Lee (2002) stresses that managing a supply chain effectively is a complex and challenging task. Although it is complex, the aim of every supply chain should be to maximize the overall value generated (Chopra and Meindl, 2013). According to Persson (1997), supply chain management goals such as reduced lead times, efficient use of resources, and enhanced customer service will reduce companies’ costs and increase revenues. Concerning customer service Tachizawa and Thomsen (2007) stress the need for supply flexibility in terms of volume, mix, and delivery date of purchase components, and assert that this is a key to competitiveness. They also emphasize that supply chain flexibility is an under-investigated area. An essential issue related to supply chain flexibility is how to manage the replenishment process of raw materials and components from supplier to customer effectively. In almost all supply chains, materials need to be stored or buffered. This means inventory management plays an essential role in a company’s logistics success (Koster et al., 2007) and therefore they are in need of replenishment systems that improve customer service and reduce inventory costs (Myers et al., 2000). The strategy may also be adjusted to meet specific needs of the customers (Lee, 2002). Lee (2002) also finds that when a company faces difficulties with excessive inventory, decreased customer service, increasing costs and reduced profits, or a poor return on assets, its supply chain is out of control. Thus, inventory management is a challenge dealing with problems of balancing inventory costs and customer service in complex and different environments.

2
Various terms are associated with the process of replenishment of material: materials planning methods, inventory replenishment system, materials supply, planning methods, inventory management, etc. This study uses the term replenishment method, which concerns materials supply from suppliers to use in production, from a manufacturer’s point of view. One well-known and widely used method is the traditional principle called Material Requirements Planning (MRP). MRP is regarded as one of the most widely used principles in industry (see for instance Guide and Srivastava, 2000). The prerequisites for making MRP work are data consisting of production plans/anticipated demands, production structure, inventory on hand, lot-sizing principles, and lead times (Mattsson and Jonsson, 2003). These data are very important in MRP and must be current and accurate for correct calculations (Kumar and Meade, 2002). Kumar and Meade (2002) stress that there are problems with MRP because of the constant changes in volume and the demand for immediate deliveries, both of which MRP have some difficulties responding to. Aldridge and Betts (1995) also point out problems with MRP and stress that all manufacturers need to question their planning system. Because of these problems with MRP, and the fact that it is so widespread, it is of interest to explore alternative replenishment methods. The best-known and widely used methods/principles can be applied in various ways. Many companies have difficulty applying methods to their processes, and less effort has been put into exploring how to use these methods to achieve an efficient material flow (Jonsson and Mattsson, 2006). According to Jonsson and Mattsson (2006, p. 993), “…it is important to carry out research that improves our knowledge about successful and unsuccessful uses of planning systems and methods”. Furthermore, Jonsson and Mattsson (2000) also point out that more knowledge of planning methods in practice gives a base for achieving demand-oriented applied research and that more state-of-the-art studies about planning methods in Swedish industry are desirable. There are very few studies about applications of planning methods in industry. Dong and Xu (2002) also mention the need for more case studies in this area. Moreover, Småros et al. (2003) pay attention to the need for more case studies focusing on vendor-managed inventory systems (a concept for materials supply), including both advantages and problems in practice for the company. Additionally, Silver (1981) stresses that more research efforts should address problems whose solution would be of important advantage to practitioners. Jonsson (2007) explores problems related to the materials planning user environment and suggests that case studies could be carried out to better understand the difficulty in the user environment characteristics. It is important to choose materials planning methods that fit the actual planning environment, yet Jonsson and Mattsson (2003) mention in their study that “only a very limited amount of research linking planning method to specific environments has been found” (p. 872). Since replenishment methods play an essential role in the supply chain, one must select and design methods carefully. Musalem and Dekker (2005) focus on the

3
importance of decisions made in inventory management, because they affect the material flow and the availability of products. Similar, Dolguia and Prodhonb (2007) stress that inventory control in a supply chain is crucial for companies in order to satisfy their customers’ demands and also for controlling their own costs. An improper policy results in either shortages, which generate expenses, or unnecessary stocks, which decrease capital assets. Thus, efficient supply planning methods should be developed, and therefore the choice of replenishment method is essential. Different situations or environments could mean that different methods should be applied (see Huataniemi and Pirttilä, 1999; Dolguia and Prodhonb, 2007; Lee, 2002). In relation to this Wänström and Jonsson (2006) focus on using different materials planning strategies for different engineering change situations and materials planning characteristics. Bellgran and Säfsten (2005) mention that the choice of replenishment method also could contribute to what characterizes a good production system. Important are factors such as the least possible handling of materials and opportunities for different types of material supply. Moreover, Jonsson and Mattsson (2006) show in their study of application of materials planning methods that motives when selecting methods vary. Examples of motives could be availability in an ERP system, the method being what has always been used, recommendation from a consultant, or no special reason. In order to describe, analyze, and make decisions about replenishment methods, a lot of factors must be considered. To facilitate this, a logistics model mixing different areas can, according to Toivonen et al. (2006, p. 125), “play an important role in identifying and evaluating alternative courses of logistical actions”. Johansson and Johansson (2006) have developed a model for describing and analyzing materials supply systems, but here the focus is on product development projects. There is a lack of such models related to materials supply systems. Moreover, Silver (1981) emphasizes the need for understandable decision rules in inventory management. The company in this study has tested and implemented different types of replenishment methods, here named as visually oriented replenishment methods. The reason for testing different methods is partly due to increased competition, increasing demands for delivery service, and a need to reduce costs in the supply chain, and a desire to achieve closer links between the production and supply of materials. The more traditional method, MRP, has difficulties meeting these challenges. MRP has previously been the dominant method for materials supply at the company, but over the years it has become less and less important. According to research, MRP is widespread but also has deficiencies. The literature review shows that it is of interest to increase the understanding of how different methods are applied and how they can contribute to a more effective flow. In the literature study, no complete descriptions or analyses in context were found regarding visually oriented replenishment methods. So this is an in-depth study of some methods and the environment they operate in. The literature also shows that many different factors are important when analyzing and selecting/designing

4
replenishment methods. There is a need for developing support systems for decisions regarding selection of methods.
1.2 Purpose and research questions
The purpose of this study is to analyze the application of visually oriented replenishment methods in the manufacturing industry and further to design a tentative decision tool for selecting methods. The research aims to provide some answers to three key questions: RQ1: What factors are important for evaluating how effective replenishment methods are? RQ2: What characterizes visually oriented methods according to these factors? RQ3: What might a tentative decision tool for selecting replenishment methods look like?
1.3 Delimitations
The study is focused on a manufacturer’s point of view. The empirical study is limited to four different replenishment methods in one company within the electronics industry. The study does not include detailed cost analysis.
5
1.4 Thesis outline
Chapter 1, Introduction, presents the background, gaps in the research area, and purpose, research questions, and delimitations of the study. Chapter 2, Method, discusses the scientific approach and selection of methods, describes how data is collected, defines the term replenishment methods and ends with a quality discussion of the study. Chapter 3, Theoretical framework and the analysis model, outlines the theoretical basis for the study and presents the analysis model which is used for analyzing the methods. The chapter contributes to the answer of RQ1. Chapter 4, Case studies: Descriptions and analysis, describes the four case studies and contains the corresponding analysis of them. The chapter ends with some separate views from interviews about selection of methods. Chapter 5, Factors important for analyzing replenishment methods, discusses factors important for evaluating replenishment methods and the usability of the analysis model. Chapter 6, Characteristics of visually oriented replenishment methods, summarizes and compares the methods. The chapter ends with a discussion. The chapter contributes to the answer of RQ2. Chapter 7, A tentative decision tool for selecting replenishment methods, from the analysis, different important aspects and factors emerged that are used to design a decision tool, thus answering RQ3. Chapter 8, Conclusions, contributions and further research, summarizes the conclusions and contribution of the study, and gives suggestions for further research.
6
2 Method
After an overview of how the study was performed, the scientific approach and selection of methods and research design is described. The chapter concludes with a discussion of the quality of the study.
2.1 The start of the study and a brief overview
The work began with a pilot study including a literature review. During the work, I deepened my literature studies and specified the gap and research questions more completely. My interest in the field is also rooted in an earlier job at the company where the case studies were done. This prior employment enabled some initial understanding and facilitated establishing contacts for interviews, etc. In parallel with the study of the literature, contacts were also made with some different employees at other manufacturing companies. The purpose of the discussions with some other companies was to determine the practical relevance of this field of research. I also spoke with various researchers in logistics, industrial management, and industrial production at some universities to discuss the research area. In addition to discussions with my supervisor and examiner, University of Gävle research seminars at the Department of Industrial Engineering and Management also helped to narrow the study’s focus. During the feasibility study, I wrote early drafts of the purpose and research questions, as well as a rough plan for the work. Purpose, research questions and planning were adjusted during the work. Besides literature studies and interviews, I made observations for data collection. The company has experimented with different methods for materials supply, so I also studied internal documents. Furthermore, in order to carry out the analysis of the empirical material I developed an analysis model to analyze replenishment methods in use in the industry.
2.2 Scientific approach and selection of methods
According to Remenyi et al. (2003) a research strategy might be considered as providing the overall course of the research containing the process by which the research is conducted. When a strategy is decided, attention can be given to the specific research methods that will be used. Arbnor and Bjerke (1994) describe three different approaches: analytical, systems, and actors. The analytical approach has its origin in classical analytic philosophy and means that reality is summative in nature, that the whole is the sum of the parts. With this approach, if you know the parts, it is possible to summarize them and get
7
the whole picture. This approach is independent of subjective experiences. The second approach, the systems approach, states that the whole is not equal to the sum of the parts, which means that the relationships between the parts are important, since they give plus or minus effects. A systems approach explains the parts from the properties of the whole. The system can be defined as a system with a variety of components and the relationships between them. The third approach, the actors approach, takes no interest in explanation and is instead focused on understanding the social wholes; reality is a social construction. Wholes and parts are multifaceted and regularly reinterpreted (Arbnor and Bjerke, 1994). This study is based on the systems approach because when analyzing a replenishment method it is necessary to study the different parts, how they are connected to each other, and how they relate to the whole. Depending on how it looks, it can give different effects. Relations between elements (or principles, structures) in a replenishment method must be analyzed as well as analyzing the whole when it comes to the application. For instance, the context/environment where the method is going to be used may be decisive for selecting a suitable method. The selection of research method for data collection is closely linked to the purpose and research questions (see, for example, Yin, 2009). In order to collect information a quantitative or qualitative approach could be used, where qualitative often is associated with soft data and quantitative with figures (Silverman, 2006). Therefore, based on this study's purpose and research questions a qualitative approach is appropriate, as it is in the form of soft data (descriptions of how different supply methods work and what factors influence their effectiveness, for instance). Silverman (2006) argues further that in the case of soft data, a qualitative approach often provides a deeper understanding than a quantitative approach, which is why this qualitative approach is justified in this study. Data collection methods in a qualitative approach are observations, textual analysis, interviews, and audio/video recordings (ibid.). The first two are used in this study. To some extent, the third method textual analysis is also used, but more in terms of gathering information from documents (secondary materials). Silverman (2006) argues that a qualitative approach is closely related to case studies. This study includes examining the application of different replenishment methods, how they work and why they work the way they do, etc., motivating why a case study approach is applied. The case study is useful when contextual conditions are important (Yin, 2009) which is the case with different replenishment methods for different situations. Furthermore, there are different ways to draw conclusions. The inductive approach is based on conclusions from empirical data, while deduction is a logical conclusion (Eriksson and Wiedersheim-Paul, 2001). This study is inspired by both approaches, in that it alternately jumps between theory and empiricism (adduction).
8
2.3 Research design
Selection of case studies The purpose of this study is to investigate the application of visually oriented replenishment methods in industry. A case study is an appropriate approach when it, according to Yin (2009), is suitable for questions about why and how. A single case study can represent an important contribution to knowledge and theory development and also contribute to a new focus for future studies (Yin, 2009). Dyer et al. (1991) also argues that case studies are very powerful and that single case studies allow the researcher to go into depth. Sometimes a single case study is enough and sometimes multiple case studies are preferred, but one case study is increasingly considered to be sufficient (Remenyi et al., 2003). Differing views can be found. Yin (2009) argues that more cases tend to be stronger than one case and therefore it is worthwhile to pursue a two- or multi-case design. The actual choice of case is very important in order to build theory from the case study (Yin, 2009; Eisenhardt, 1989). The case studies are collected from a large international company in the electronics industry. The company applies different methods for materials supply in their production units. The company is particularly interesting as they have tested different methods. In this study, four case studies cover three similar methods and a divergent one, so the study can be said to use a multiple case study, where the unit of analysis is replenishment methods. The three similar case studies illustrate variations in how visually oriented methods are designed, and by these variants various characteristics are highlighted. Each case study can be regarded as unique. The different case study about MRP is included in this thesis to illustrate contrasts that contribute to deeper understanding (see Silverman, 2006) and because it strengthens the generally developed decision support tool. Data Collection The main data collection for empirical data was conducted through interviews. But information was also gathered by observation and from different documents. Interviews Most of the interviews were conducted individually with respondents, but complementary data collection occurred by telephone and e-mail. Notes were taken and later rewritten; afterwards there was opportunity to confirm the answers by the respondents. The number of respondents was 14 belonging to the following categories: purchaser, purchase assistant, purchase manager, process owner, planner, project leader, and process leader/developer. The reason for interviewing people in different categories was to get a broad and clear picture, catch different aspects, etc. Interviews lasted from approximately half an hour to two hours. Shorter interviews were also conducted. The degree of structure in the questions varied (see e.g. Patel and Davidson, 2003). Some questions were fixed, while some questions were based on key

9
words/topics, where the respondent was freer to develop answers and from that follow-up questions were created. Some issues concerning valuation were asked, such as how they perceive the advantages and disadvantages of a certain method. The questions were prepared based on what was found in the prestudy, but also from regular literature reviews and discussions with various people in the company. Not all questions were asked of everyone, since some questions or topics were directed specifically to certain professions. Observations The purpose of an observation is to capture an entire situation (Holme and Solvang, 1996). An observation can be described as "an act of recognizing and noting or recording an occurrence…" (Remenyi et al., 2003; p.286). To get a more complete picture I observed how work is done with different replenishment methods in the production warehouse. This concerns particularly material handling activities about flows, functionality of principles, ordering procedures, entering materials into storage, order picking, registrations, and responsibilities/roles. Associated with that, I took notes on technical equipment such as storage types, load carriers, information documents, and IT support. In the observations, I also asked questions of material handling and production staff. Notes were made on paper and afterwards rewritten. Documents Secondary data in the form of various documents/prints was part of the collected material. These are screenshots from the ERP system with different planning images and internal training documents. These documents have helped to increase the understanding and to obtain a more complete picture and are a complement to the empirical material from interviews and observations. Literature review and the analysis model The theoretical framework was designed on the basis of scientific articles and other literature. Searches of different databases were conducted with different terms and combinations of terms. In order to clarify the gap that motivates this study, many different keywords were used, including materials planning methods, supply planning methods, materials supply, replenishment methods, inventory replenishment systems, visually and manually oriented planning methods, materials supply decision, decisions inventory management, and materials supply decision tool. In addition, for the theoretical framework, a variety of search terms were used in logistics and topics like supply chain management, lean production and purchasing, with a focus on materials planning and related concepts/terms. Based on the literature study and its general concepts and principles, I designed a research model. The purpose of the model is to analyze the case studies included in this study as they help to answer the research questions. The model itself is not related to any particular industry sector and is intended to be a general model for analyzing replenishment methods in manufacturing.

10
2.4 Defining replenishment methods
In this study, replenishment methods concern materials supply from a supplier to use in production, from a manufacturer’s point of view (see Figure 1). Replenishment refers to products being stored (stock items). Deliveries concern the product/item being delivered and information about forecasts, call-off orders, and purchase orders. Supplier could also refer to a 3PLP. Figure 1. Replenishment methods and the included flow
2.5 Quality in the study: Validity and reliability
Validity Validity can be said to be a measure of whether a particular issue measures or describes what you want it to measure or describe (Bell, 2006). Validity can be improved by having several case studies (Yin, 2009) as in this study. Another thing that increases the validity of the study is that the interviews were done with people who have different roles/positions in the supply of materials, allowing the capture of aspects from different angles. The same interview guide was also used in all interviews. The aim was to interview and talk to as many people as possible. A total of 14 people were interviewed, and some of them more than once. Afterwards, the respondents had the opportunity to confirm that the correct understanding was obtained. There have also been separate interviews and talks with certain key employees of the company about the understanding of the empirical material. Triangulation means that the data collection is done in several ways in order to get as full a picture as possible (Patel and Davidson, 2003). In addition to interviews, the observations and documents studied also strengthen the validity. In addition, during the study three conference papers were written that underwent review processes and
Supplier Deliveries
Production
store Production
Main store
Customer/focal company
End
customer
Information
Included flow
Invoice
11
were accepted in different conference proceedings. (This thesis is a monograph that does not directly include the papers, but rather their content.) External validity concerns being able to generalize the results beyond the study itself (Remenyi et al., 2003). Research question one (RQ1) is about factors that are important when analyzing/evaluating replenishment methods. The answer to this is based on different general concepts and principles from the literature. On this basis, an analysis model was designed, which is also generally useful because it is based on general knowledge. The model has been tested with four methods, which shows the model's usability and that in itself it is not tied to any specific industry or situation. RQ2 highlights the characteristics of visually oriented methods from the case studies. It is possible for other companies with similar situations to apply them. Nothing is found in the analysis that indicates that these methods would only be applicable to the company where the case studies were conducted. RQ3 is about developing a tentative decision tool based on the results from RQ1 and RQ2. The study doesn’t include testing the decision tool at a company. This is a subject for further research. Herein lies a limitation. Furthermore, there is a limitation that it is a total of three similar explored methods. The study could be complemented with more studies about visual methods. What’s more, data collection has not been from the suppliers as this study is limited to a customer/manufacturer’s perspective. It might be useful to include aspects from the suppliers in further research. Reliability Reliability is about a study that can be repeated with the same results (Yin, 2009; Remenyi et al., 2003). Reliability can also be explained as consistency, that the measurements are correct (Thurén, 2007). Indications of good reliability in this study are reflected in that interviews have been conducted with different people using the same interview guide, and that the respondents were given the opportunity to confirm the results from the interviews. Furthermore, the study documents the categories of staff interviewed and the interview guide. This creates opportunities for someone else to repeat the study. The developed flow charts could also be compared with other studies. But even if these conditions exist there are also other factors that affect the reliability. Yin (2009) stresses that individual dependency is important to consider. This means that the study's quality depends on the individual researcher's ability and skills. For example, it is important to ask good questions, have a clear picture of the questions, interpret the answers as correctly as possible, be a good listener, and not be influenced by one’s own presumptions (ibid.). This allows for variations based on who performs the study. But in this study the aim was to carefully apply attention to the above-mentioned factors.

12
3 Theoretical framework and the analysis model
The chapter is divided into four main sections. To help promote understanding, terms like supply chain management, logistics, lean production, lean supply and inventory management/control are explained in the first section. After that, different aspects of decisions within logistics/replenishment are presented. The third section describes factors important for evaluating how effective replenishment methods are; the last section presents the developed analysis model, which will be used to analyze the case studies.
3.1 The supply chain and common terms
Effective logistics and supply chain management can be a main source of competitive advantage (Christopher, 2005). Therefore, it is essential to understand what a supply chain really is. In a supply chain many parties and functions are involved, both directly and indirectly, in order to fulfill customer’s requests. Different issues need to be considered when designing, planning, and operating a supply chain. A supply chain is very extensive and includes customers, manufacturers, and suppliers on different levels. A lot of issues must be handled concerning sourcing, planning, information, inventory/warehouses, distribution, transport, new product development, finance, customer service, etc. The objective of every supply chain should be to maximize the overall value generated (Chopra and Meindl, 2013). This can be difficult to achieve, since today’s market is characterized by turbulence and uncertainty with volatile demands (Tachizawa and Thomsen, 2007; Christopher, 2005). Additionally, Christopher and Towill (2000) bring up the point that a major problem in most supply chains is the tendency to be forecast driven instead of demand driven with real, visible demands. Additionally, Lee (2002) stresses that managing a supply chain effectively is a complex and challenging task. Because of these challenges and difficulties, there are great demands on managing the supply chain and developing effective logistics. Supply chain management (SCM) and logistics are given many definitions. The terms are also closely related to each other. Christopher (2005, p. 5) presents the following definition of SCM: “The management of upstream and downstream relationships with suppliers and customers to deliver superior customer value at less cost to the supply chain”. According to Persson (1997), supply chain management goals, such as reduced lead times, efficient use of resources, and enhanced customer service, will reduce companies’ costs and increase revenues. Concerning customer service, Tachizawa and Thomsen (2007) stress the need of supply flexibility in terms of volume, mix, and delivery date regarding purchase components and assert that this is a key for competitiveness. Logistics could be defined as “planning, organizing and controlling all activities in the material flow, from raw material acquisition to final consumption and return flows of manufactured product, which aims to satisfy customers and other stakeholders' needs and desires, thus provide good customer service, low costs, low tied-up capital
13
and small environmental consequences” (Jonsson and Mattsson, 2005, p. 20). More briefly, logistics can be described as the science of efficient flow of materials. By focusing on and improving logistics activities, companies have the opportunity to increase efficiency and profitability, and improve customer service. So there are major similarities between logistics and SCM. Lean production is strongly related to logistics and SCM. However, according to the literature, there are problems defining it and the lack of definitions has led to misunderstanding (see Hines et al., 2004; Pettersen, 2009). Pettersen (2009) explores the definition of lean production based on a literature review and lists several characteristics: lead time reduction, kaizen, just in time, kanban/pull system, production leveling, standardized work, visual control and management, 5S, waste elimination and inventory reduction, supplier involvement, teamwork, improvement circles, root cause analysis, and employee involvement. In brief, it could be described as striving to reduce waste. When focusing on Lean it is also vital to have a supply chain perspective, so manufacturers are not looking at operations in isolation from the rest of the supply chain (Naylor et al., 1999). Liker (2009) also means that one of the reasons for Toyota’s success is their cooperation with the suppliers. In line with this, Basu and Wright (2008) describe lean in a supply chain management perspective as focusing on integration upstream and downstream with suppliers/customers, where high emphasis on efficiency and minimum stocks are vital. Hines (1996) also focuses on purchasing processes and extends the lean production philosophy to include the many-tiered supplier network. The goal should be an integrated supply chain, where boundaries are removed in order to ease the flow of material, cash, resources, and information (Naylor et al., 1999). In this context, the term lean supply is used to mean the relationship between a manufacturer and its suppliers, where the flow of goods, services, and technology and information exchange between them should be without waste (Lamming, 1996). A focus on lean production principles could lead to reducing different forms of waste, reducing inventory, higher inventory turnover, enabling flow and transparency, better ways to create value, awareness of problems/costs, enabling better cooperation between supplier and customer, and emphasizing the importance of human dimensions and “Respect for people” principle (see e.g. Demeter and Matyusz, 2011; Stratton and Warburton, 2003; Eroglu and Hofer, 2011; Womack and Jones, 1996; Emiliani, 2006). Practicing lean principles in the supply process, concerning different material planning methods, implies the potential for better results and becoming more competitive. Supply chain management, logistics, and lean production/supply are all connected to inventory and how it is controlled and managed. In almost all supply chains, materials need to be stored or buffered. When there is a more detailed focus on inventory and how it is controlled and replenished, the terms inventory management and inventory control are often in use. Different materials planning methods are also related to that.

14
As mentioned in the introduction, the term replenishment method was selected for this study. An essential issue in the supply chain is how to manage the replenishment process of raw materials and components from supplier to customer in an effective way. This means inventory management plays an essential role in a company’s logistics success (Koster et al., 2007). Inventory management is a challenge dealing with problems of balancing inventory costs and customer service in complex environments (Musalem and Dekker, 2005; Myers et al., 2000). This is in line with Lee (2002), who expresses that when a company faces difficulties with excessive inventory, decreased customer service, increasing costs and reduced profits, or a poor return on assets, its supply chain is out of control. The strategy therefore needs to be adjusted to meet specific needs of the customers (ibid.). So companies need inventory replenishment systems in order to improve customer service and at the same time reduce inventory costs (Musalem and Dekker, 2005; Myers et al., 2000).
3.2 Decisions concerning logistics and replenishment. Logistics models.
Decisions in logistics and the supply chain on both strategic and operational levels are crucial, since they affect the companies’ competitiveness, profitability, and customer service. Decision issues may be categorized as design, planning, or operational. They concern a wide range of factors related to product, information, planning, sourcing, purchasing, supplier selection, distribution/transportation, warehousing/inventories, etc. (Chopra and Meindl, 2013). Furthermore, Grant et al. (2006) point out decision areas like customer service, transportation, warehousing, order processing, and inventory. All of these factors are of concern in replenishment systems.
Musalem and Dekker (2005) focus on the importance of decisions made in inventory management since they affect the material flow and the availability of products. Similar, Dolguia and Prodhonb (2007, p. 269) mention that “Inventory control in a supply chain is crucial for companies desiring to satisfy their customers’ demands as well as controlling costs” and that “improper policy of inventory control leads either to shortages, which generate expenses, or to needless stocks, which decrease capital assets” (p. 270). Thus, efficient supply planning methods should be developed (ibid.). So the choice of replenishment policies is important. Different situations/environment could mean that different methods should be applied (Huataniemi and Pirttilä, 1999; Dolguia and Prodhonb, 2007; Lee, 2002). For instance, Wänström and Jonsson (2006) focus on using different materials planning strategies for different engineering change situations and materials planning characteristics. Furthermore, Bellgran and Säfsten (2005) mention that the choice of replenishment method could also contribute to what characterizes a good production system. The system should involve the least possible material handling and opportunities for
15
different types of material supply. Moreover, Jonsson and Mattsson (2006) show in their study of application of materials planning methods that motives when selecting methods vary. Examples of motives could be availability in an ERP system, the method being what has always been used, recommendation from a consultant or no special reason.
So, decisions in logistics and materials supply are important. But how do you make good decisions? Toivonen et al. (2006) discuss improvement in logistical decision making and they discuss “the lack of good methods which take qualitative text information into account in the decision-making process of [a] company. This also concerns logistical activities.” (p. 124). They stress that a “logistics model can play an important role in identifying and evaluating alternative courses of logistical actions…” (p. 125). Thus, a model could be useful when making decisions. That kind of decision support is not often found in the literature. Johansson and Johansson (2006) deal with materials supply systems design in product development projects, involving decisions about the production system and the supply chain before the product is completely developed. Their model contains six areas: materials feeding, storage, transportation, handling, packaging, and manufacturing planning, as well as control at four levels: supply chain, plant, sub-unit, and utility. Increasing demand for more frequent product introductions and the need to offer a wide range of variants calls for effective project management and the adoption of efficient methods. However, there is a lack of such design models and methods related to MSS design. This model does not highlight the design of material flows for the specific components and modules, but relates the design issues to six design areas and levels. Grant et al. (2006, p. 87) define modeling as “the process of developing a symbolic representation of a total system. A model must accurately represent the ‘real world’ and be managerially useful”. So a model supports the decision-making process and allows considering many different alternatives and testing the outcome (ibid.). Furthermore, Grant et al. (2006) present a decision support system (DSS) covering a wide variety of models, simulations, and applications that are designed to ease and improve decision making. However, DSS is more a framework for analytical processing dependent on data and calculations. Other models or support systems found in the literature for decisions concerning different areas within logistics are: a practical tool for supply chain improvement (Netland and Alfnes, 2007), a decision support framework for supply chain collaboration (Barros et al., 2008), a tool for choosing an effective third party logistics provider (Aghazdeh, 2003), a warehouse operation decision support model (Gu et al., 2006) and a supplier selection model (Choy and Lee, 2002). What’s more, Tangen et al. (2008) presents a four-step guide for decisions on automatization. Decision making is an important part of operations management. Decision theory is a general approach to decision making that is useful in many different aspects. Different

16
elements are characterized in the theory: possible future conditions, a list of alternatives to choose from, and a known payoff for each alternative. It is important to evaluate alternatives according to some decision criterion and then select the best alternative. One useful tool is the decision tree, which is a schematic representation of available alternatives and their possible consequences. Decision theory gives a framework for the analysis of decisions. A decision process undergoes different steps and may cause failures due to failure to focus enough on each step (Stevenson, 2005). Another term which could be useful is QFD (Quality Function Deployment), which is a system for specifying a customer’s wishes, yielding for the company relevant specifications at each step of the product development process, from marketing to development, production, and sales and service. Here, the quality house can enhance the process for describing and analyzing the connection between the customer’s wishes and the product’s characteristics (Bergman and Klefsjö, 2007).
3.3 What factors are important for evaluating how effective replenishment methods are?
The section gives an account of important factors and areas, collected from the literature, to consider when evaluating how effective replenishment methods are, thus answering RQ1, what factors are important for evaluating how effective replenishment methods are. These factors are important to reflect on when describing and analyzing replenishment methods in industrial applications. The last section in this chapter contains the developed analysis model, which is built on the factors presented here. The term effective includes in this study, what the characteristics are for a certain replenishment method, what the planning environment/conditions for using it are, and what effects its application leads to.
3.3.1 Planning environment
In order to describe and analyze the application of replenishment methods it is important to include the planning environment. The planning environment can be described as “the conditions that characterize the products, production and material flows, which are the basic requirements for planning” (Mattsson and Jonsson, 2003, p. 26). Another way to explain the term is “The planning environment is the environment which the planning is conducted in and which defines its conditions and limitations” (Mattsson, 1994, p. 12).
3.3.2 Product characteristics
When analyzing a solution for materials supply, different characteristics of purchased products should be taken into account in order to characterize the replenishment

17
method and its applicability. Examples of important issues could include product complexity, availability on the supplier market, cost, volume (high/low, evenness), the need for quality control, and the product’s size/shape. Bulky goods can be described as goods with low density, having a large volume and small mass (Lumsden, 2006). The size/shape of the product could perhaps necessitate different solutions for storing and handling (Institute for Transport Research, 2002), and thereby influence the design. Whether there should be quality control of purchased products is also an essential parameter, because quality control takes time and demands resources, and could influence decisions and the configuration of the replenishment model. According to Oskarsson et al. (2003), a company often exercises control over a product’s quality/functioning, but quality control can also include control over the quantity delivered, to ensure that sufficient inventory is on hand. The extent of the quality control depends on the product’s price, its complexity, and the supplier’s ability to deliver high-quality goods. In order to segment suppliers and select or design supply solutions for different items, the so-called Kraljic matrix (Figure 2) could be used. In the matrix presented by Bjornland et al. (2003), the x-axis indicates the complexity of the supplier market, which includes aspects concerning the number of suppliers, availability on the market, and the speed of technology development. The y-axis symbolizes the product’s economic importance (Bjornland et al., 2003).
Figure 2. Kraljic matrix, from Bjornland et al. (2003). The matrix is divided into four squares. Noncritical parts mean most standard parts with little economic importance and of least importance for the company. Since these parts are least important for the company, they should not spend much on them and instead should establish simple forms of collaboration, agreement, and routines (Mattsson, 2002). Leverage parts have many suppliers and are plentiful materials on the market. These items make up a large part of the total procurement costs. The bottleneck parts have a small impact on the company’s budget (low price per part) but high complexity, low availability on the market, and a small number of suppliers. The last square contains the strategic parts that are most important for the company and characterized by high complexity, a small number of suppliers, and a great economic impact (Bjornland et al., 2003).
low
Noncritical parts
Leverage parts
Bottleneck
parts
Strategic parts
Complexity of supplier market
high
low
high
Importance of purchase
18
3.3.3 Materials planning methods and the material flow
This section describes different materials planning methods and related terms regarding the material flow. This is useful when characterizing a certain replenishment method in industry, such as to see what basic principles the method is related to. Materials planning methods The most known and used materials planning methods are material requirements planning (MRP), re-order point systems, run-out time production planning, order-based planning, and kanban (Jonsson and Mattsson, 2002). Material Requirements Planning (MRP) MRP is regarded as one of the most widely used principles in industry. MRP is a method which in principle relies on scheduling time for new deliveries according to calculations of when the net requirement occurs. Planning for materials belonging to the end product is calculated through the product structure (BOM). The start for this process is the production plan of the end products. The production plan consists of quantities and when these must be produced. From this, material needs for raw materials and other purchased parts in the structure are calculated based on inventory on hand and already planned orders. The prerequisites for MRP are data consisting of production plans/anticipated demands, production structure, inventory on hand, lot-sizing principles and lead times (Mattsson and Jonsson, 2003). These data are very important in MRP and must be current and accurate for correct calculations (Kumar and Meade, 2002). All these data and calculations with MRP are handled through the companies' ERP system. According to Kumar and Meade (2002) there are some problems with MRP. They state that in theory the principles of MRP would work, but in practice there are several problems with making MRP function well. This is due among other reasons to the fact that manufacturers today are in an environment of constant changes in volumes, demands for shorter lead times, the need for immediate delivery, and increased complexity in products. MRP also requires a great number of employees to maintain accuracy. The mechanism behind MRP is also complex to understand, since the information is inside the computer, and its use is unknown to many people. The basis of MRP is a forecast at the finished goods level. This is something that has been proven to be very difficult, if not impossible, to do with a reasonable level of accuracy. It is clear that the day of being able to accurately predict what the customers will buy and when they will buy it has passed. MRP also requires current and accurate data for calculations. Today there are powerful computers for these calculations, but because there are a lot of changes, manual entries and maintenance are needed in the data records. Aldridge and Betts (1995) also give indications of problems with MRP and stress that all manufacturers need to question their planning system.
19
Re-order point Different types and performances of re-order point systems exist. In each variant of the re-order point system, consumption initiates the replenishment. Expected demand must be determined for instance with consumption statistics, forecasts, or summarized gross requirements on an item level, derived from production plans. One variant continuously compares inventory on hand with a defined re-order point (a reference quantity). Comparisons are made on the basis of stock transactions. Another one is the periodic review system, which makes comparisons with stock inspections at predetermined constant intervals. If the quantity on hand is lower than the reference quantity, a replenishment process or order/refill process is initiated. With the periodic review system, administration can be more efficient and ordering and transportation can cost less, due to the opportunities for consolidating orders and deliveries (Jonsson, 2008). Another form of re-order point system is the two-bin system. When the first bin is consumed a new order is initiated, and the other bin then covers the needs until the first bin is replenished (Mattsson and Jonsson, 2003). Run-out time planning Run-out time planning is closely related to the re-order point method, but uses a time expression instead of quantity. This could lead to a better understanding of how long a stock quantity will last and an improved ability to decide when ordering is necessary. Time period coverage is the term that describes the time that the available quantity on hand is expected to cover; it is calculated by dividing the available quantity on hand by expected demand per some time unit (Mattsson and Jonsson, 2003). Order-based planning This means that material flows are initiated by new orders directly corresponding to a customer order or a manufacturing order. When a new customer order is registered in the materials planning system, a manufacturing or purchase order is automatically created for the corresponding manufacturing item and purchase item (Mattsson and Jonsson, 2003). Kanban Kanban is related to the re-order point method and is an uncomplicated method where a visible card signals the need for replenishment. To use kanban, demand should be high and even, fluctuations in demand must be limited, and products should be fairly standardized. Expensive and physically large components may be controlled with other principles (Olhager, 2000). Kanban is clearly a pull method, meaning needs are directly initiated from a supply point, only when materials are required, due to consumption. With a kanban system, registration in the system is not necessary (Mattsson and Jonsson, 2003). Kanban is also closely related to just in time (JIT) (Sykes, 1994; Kouri et al., 2008). Besides low levels of tied-up capital or control of tied-up capital, additional advantages with the kanban pull system can be shorter lead times, increased efficiency of the system, ease of control, lower costs, and higher customer satisfaction (Wan and Chen, 2008).

20
Besides the traditional kanban based on some form of physical and visual initiation of new orders, there are also electronic kanban systems where initiation is carried out through a computerized planning system (kanban could e.g. be a printout, a piece of paper) (Jonsson, 2008; Jonsson and Mattsson, 2002). Wan and Chen (2008) also describe forms of electronic kanban that have been developed based on existing ERP systems, electronic data interchange (EDI), or web-based technology. According to Wan and Chen (2008) the weaknesses with a conventional kanban system are: lost kanbans, incorrect kanban deliveries, delivering kanbans with inaccurate information, less efficiency in long-distance delivery, no visibility in long-distance delivery, limiting tracking and monitoring capability, limited support for performance measurements, and consuming work time in managing the cards. They state that an automated process with electronic kanbans can solve or reduce these weaknesses. Other studies also point out weaknesses with the purely traditional kanban system, such as problems with lost cards and dealing with the cards (see Drickhamer, 2005; Jarupathirun et al., 2009). Jarupathirun et al. (2009) also describe a variant of electronic kanban where an EDI system (using scanned bar codes from the card) transferring information to the supplier reduces steps in the work process of kanban, lead times, amount of materials, inventory costs, waste, and storage area. In addition, electronic kanbans create better and more immediate results when data is bar-coded directly into the system, which also enables real-time supplier performance measurements (Moody, 2006). It is essential to be aware that many versions of kanban solutions exist and they vary from company to company (Kouri et al., 2008). Concerning EDI solutions, according to Lim and Palvia (2001) kanban can improve customer service in the supply chain. Pull and push The principle of pull means that no products should be made nor components ordered until there is a requirement. The opposite is push, where anticipated demands start production or ordering of components (Christopher, 2005). Some advantages with pull are that it is demand driven and can be controlled with fewer resources, as well as that throughput lead times and tied-up capital can be reduced (Oskarsson et al., 2003). Material handling According to Jonsson (2008) the flow of materials can be linked to transport, materials handling, storage, and packaging. The design of packaging influences the other mentioned aspects and is thus related to the logistics system. Material handling can be defined as physical handling, moving, storing, and packaging of material (Institute for Transport Research, 2002). All these aspects have impacts on the flow. Delivery patterns In the supply chain materials flows from supplier to customers downstream. How the materials flow to the customers’ point of use may vary related to e.g. which activities the supplier is responsible for and to the customers’ direct needs. Therefore, a company can have different delivery patterns within the supply structure and the sourcing strategy. Different patterns are: (1) batch delivery to stock (some economic

21
order quantity is delivered to the customers stock for later use, on order from the customer), (2) direct delivery to production (a more integrated pull delivery pattern where the supplier can have different responsibilities, (3) delivery through a logistics center, (4) vendor-managed inventory (VMI), (5) in-plant stores, and (6) direct delivery to customers (Jonsson, 2008). VMI (Vendor-Managed Inventory) Different solutions for replenishment can mean different responsibilities and activities for the supplier, and also different integration aspects between supplier and customer. With the concept of VMI, the suppliers take responsibility for the management and replenishment of inventory and no orders are received at the supplier, unlike the traditional way. Benefits to using this concept include reduced inventory levels for both the customer and the supplier, and a reduction of risk that an item will be out of stock at the customer’s storage. The supplier can also much better plan and schedule his own activities. So there are benefits for both supplier and customer. Applying VMI in most cases reduces the total cost in the customer and supplier relationship compared to the traditional way, and better enables the supplier’s planning and scheduling activities. (Christopher, 2005; Pohlen and Goldsby, 2003; Mattsson, 2002). Mattsson (2002) states that the most common approach for industrial companies is to combine VMI with an IT basis. In that context a prerequisite is IT-based information exchange. This information could include inventory balances, forecasts, and historical consumption. However, Mattsson (2002) also refers to another manual form of VMI solution that is applied in food stores and for indirect materials (such as office supplies) for companies where the supplier regularly visits customers. Deliveries directly to production and 3PLP It is possible for manufacturing companies to let the supplier provide materials directly to the production line. Due to the demands on lead time, this could be difficult to achieve. However, a 3PLP (third-party logistics provider) could gather the material flow from different suppliers and store them, delivering materials when the need arises. This allows opportunities for small and frequent deliveries from suppliers across long distances, which would otherwise have been difficult economically (Oskarsson et al., 2003). Aghazadeh (2003) also stresses that in today’s business world, the use of third-party logistics provides a competitive advantage.
3.3.4 Communication, trust, and geographical proximity
As a result of technological advances, supply chain partners can now work in tight coordination, where information sharing is an essential prerequisite (Lee and Whang, 2000). Mattsson (2002) and Christopher and Lee (2004) also draw attention to the great importance of sharing information of good quality between supplier and customer. For an effective supply chain there is a need for access to information about orders, delivery, inventory status, plans/forecasts, and history of consumption. The information should be highly accurate and timely so that it can be used to take control
22
of supply chain operations, thereby reducing uncertainties and providing prerequisites for a demand-driven chain. Vigtil (2007) emphasizes the importance of information in a VMI relationship to accomplish an effective replenishment situation. Her findings are that information about current inventory balance is most important. Other important elements are, according to her, production schedule, stock withdrawals, incoming orders, and point of sales data. She also emphasizes that the frequency of information exchange should be related to the supplier’s need for replanning. In this context, Pohlen and Goldsby (2003) point out that trust is necessary between the parties to make the relationship work. According to the literature, geographical proximity between supplier and customer is also important. Among others, Mattsson (2002) and Stevenson (2005) stress the need for short distances for effectiveness in the supply chain. The benefits could be lower transportation costs, higher frequency and flexibility of deliveries, and better prerequisites for effective communication and development work. Additionally, Karlsson and Norr (1994) point out that suppliers in a just-in-time system have an advantage if they are located close to the buyer’s plant.
Reliable and trustful suppliers are essential for an effective supply chain. Therefore it is important to select a supplier carefully. More and more businesses are looking for partnerships, implying fewer suppliers and more long-term relationships, which could mean improved operations (Stevenson, 2005). In this context single source is often mentioned. According to Gadde and Håkansson (1998), single source could lead to a more effective materials supply where supplier adjustments are easier.
3.3.5 Visualizing
Different aspects of visualizing are discussed in the literature, from visibility through the whole supply chain down to a detailed, effective visual control system in a production environment (see Petersson et al., 2008; Liker, 2009; Greif, 1992; Emiliani and Stec, 2005). The literature has emphasized that visual systems could contribute to increased productivity, better information and control, lower costs, and reduced defects and mistakes. According to Dreyer et al. (2009), visualizing involves representing information in order to clarify and easily abstract, transfer, and exchange knowledge. They also state that efforts should be applied to what and how to visualize. Furthermore, according to Bellgran and Säfsten (2005), visual solutions could contribute to a good production system, where the visibility helps avoid problems and could mean satisfaction for employees. Liker (2009) states that the company should use simple and visual solutions to support the flow and the pull system. Moreover, he says that visual control could be used to uncover problems and help employees to determine whether their work meets standards or not. The computer screen should be avoided if it distracts the operator and reduces the number of reports to one single paper. According to Greif (1992), the term visual control does not rule out using a
23
computer-controlled warehouse or other storage. Visual control is not just about techniques, but also concerns communication between people and logistics systems.
3.3.6 Logistics goals
The goal with logistics is to achieve a high level of delivery service with low costs (Oskarsson et al., 2003). Furthermore, logistics aims to create competitiveness and high performance by improving companies’ efficiency and effectiveness so as to positively affect profits, where performance can be expressed in different terms (Jonsson, 2008). The connection between the goals of logistics or supply chain management and profitability is clarified by Persson (1997). She stresses that increased profitability is achieved by reducing costs and improving revenue, which is achieved by efficient use of resources, reduced inventory, reduced lead time, and increased customer service. According to Jonsson (2008), the service related to carrying out the order-to-delivery process is usually called delivery service and is included in customer service. In this section different elements of logistics goals will be described, starting with different delivery service elements. Delivery service elements Jonsson (2008) mentions five common delivery service elements. The first element is Inventory service level (or fill rate), which describes to what extent stock items are actually available in stock when they are demanded. The next one is Delivery time (often called lead time) which expresses the time from receipt of customer order to completed delivery. The lead time could include the administration of orders, order processing time, dispatch, transportation, and receiving activities. Another element is Delivery precision (or on-time delivery), which describes to what extent the delivery takes place at the agreed-upon delivery time. Delivery reliability is used to measure the quality of delivery in terms of the right product being delivered in the right quantity. The fifth common element is Delivery flexibility, which refers to the supplier’s ability to adapt and comply with changes in customer requirements (e.g., changes in delivery times, order quantities or contents, and the performance of the product delivered). It is essential to be aware that delivery service is not just important for deliveries externally between supplier and customer, but also for the internal flow (deliveries between different departments) (Oskarsson et al., 2003). Focus on delivery service elements is of great importance because risks in the supply chain can be caused by problems with the service delivered (Christopher and Lee, 2004). Capital tied up Many authors/researchers stress that reducing inventory is important, since inventory ties up money and has an impact on profitability. Among others, Grant et al. (2006) and Crocker et al. (2012) state that holding inventory does not add value to the company and ties up money that could be used for other purposes. Although the predominant cost for tied-up capital is the capital cost itself (the cost for the purchase of raw material), there are also costs for material handling, facilities and equipment, insurance, and the warehouse employees (Olhager, 2000).
24
Use of resources and the flow Use of resources could include a lot of aspects, but here the focus is on resources associated with purchasing and administration. According to Gadde and Håkansson (1998), a company’s ability to earn revenue depends on how its purchase activities are handled, since the purchase costs are a large part of the total costs in a company. Besides the cost of the product itself there are also indirect costs, such as tied-up capital, administration, claims, and material handling, which could affect how purchase activities are carried out. Examples of indirect costs that could be high is cost related to planning and administration of orders and activities regarding invoicing. Especially for products of small economical value, these costs could be relatively large. But if supplier and customer closely develop an effective system for these activities and cooperate more thoroughly and with a long-term perspective, savings is possible. This could also imply better coordination and commitment. Grant et al. (2006) present the total cost concept, focusing on how logistics activities drive total logistics costs. That model includes costs related to areas such as the order process, transport, inventory, and warehousing. Furthermore, different models exists on a supply chain management level (see e.g. Christopher, 2005; Beamon, 1998). Oskarsson et al. (2003) also stresses that all material handling is associated with costs and that the performance of material handling has an influence on costs, delivery reliability, and lead time. This implies that effective material handling is essential. Attention must also be given to how the materials flow. In a storehouse or stockyard, savings of time and space can be made if the flow is a straight line, avoiding corners, etc. (Crocker et al., 2012). Inventory accuracy Inventory inaccuracy is a well-known phenomenon. It is generally difficult to maintain a good inventory balance (Wild, 2004; Axsäter, 1995). This problem could affect the whole company, from stockroom operations to sales, reducing profits (Fleisch and Tellkamp, 2005; Wild, 2004). Different reasons/sources for inaccuracy are administrative errors, in and out registrations, misplaced items, theft, or items that are out of date (Axsäter, 1995; Fleisch and Tellkamp, 2005). For example, registering a product in the ERP system erroneously could result in the wrong data for the ordering process and according to Oskarsson et al., (2003) possibly lead to material shortages or other problems. However, implementing simple processes to operate inventories could increase inventory accuracy. Factors could include ease of use, bar coding, avoiding movements, using kanban methods, and maintaining low stock levels (Wild, 2004).
25
3.4 A model for analyzing the application of replenishment methods
In the literature review, no general analysis models or complete framework that allows analyzing the application of replenishment methods as a whole were found. Although Johansson and Johansson (2006) have developed a model for describing and analyzing materials supply systems design focusing on product development projects, that model does not fit this study. The literature discusses a lot of important factors concerning materials supply (gathered in section 3.3). Based on these factors a general analysis model was designed (see Figure 3). The intention with the model is to characterize and evaluate replenishment methods in industrial applications according to these factors. In use, the studied replenishment method is put into the oval in the figure and will be discussed with each square (which contains theory from section 3.3). The model is applied on the studied methods. The model consists of three main parts: Basic principles: identifies basic principles the studied replenishment methods consist of or are related to. This is important in order to get to know the method. Identifying these principles facilitates the later discussion of the effects of using the method. Planning environment/conditions: essential conditions or other contextual circumstances for making the method work properly are discussed concerning the products characteristics and issues related to the supplier. The area is related to the term planning environment (see Mattsson, 1994). Effects: the effects of using the replenishment models are analyzed in relation to different logistics goals.

26
Figure 3. The analysis model.
Basic principles
Effects
Replenishment method in industry
1 Product
-Fit in the Kraljic matrix -Volume (high/low, evenness) -Need for quality control -Size/shape
5 Logistics goals
-Delivery service elements -Capital tied up -Inventory accuracy -Use of resources and the flow -Other
4 Visualizing
3 Materials planning methods and the material
flow -Materials planning methods -Pull/push -Material handling -Delivery patterns
2 Information, trust, and geographical proximity
between supplier and customer
Planning environment/conditions

27
4 Case studies: Descriptions and analysis
This chapter presents and analysis the four replenishment methods IHD, MI, COP, and MRP. The analysis is made with the developed analysis model from Chapter 3. The chapter ends with a short presentation of general factors that emerged from interviews, to consider when selecting replenishment methods
4.1 In-House Delivery (IHD)
With IHD (see Figure 4) the supplier has free access to the plant and delivers products directly to the IHD production storeroom (A in the figure). In IHD no receiving activities take place, nor are products stored in the main warehouse. Furthermore, inventory on hand is not available in an ERP system, but physically visible. The supplier visits the plants regularly (every other week) and is responsible for replenishment of the production store. The supplier inspects the inventory on hand physically and refills it if necessary. Thus the supplier brings material with him and takes care of the material handling activities, including transportation.
Figure 4. The material flow with IHD. In IHD storage smaller goods are stored in small plastic boxes and larger materials in other larger pallets (for instance, larger plastic boxes or half pallets). The production personnel pick material themselves from the production store (A in the figure) which is put into smaller stores (B) next to the production line. The IHD store (A) is a separately marked area within the production storeroom, to reduce the risk that IHD items could be mixed with other non-IHD material.
Invoice
Customer
Check
Production store
Material
A. IHD store
C. Square for empty boxes/ pallet flags
Empty boxes and pallet flags
Supplier
B Forecast Produc-tion line
28
Furthermore, the IHD store is controlled by a two-bin system (each bin covers some weeks of consumption) which means that when one bin is empty the other bin is used. For smaller items the empty bin (plastic box), marked with the part number and quantity needed, is put into a square (C) to indicate the need for replenishment. For larger items, a so-called pallet flag (attached to the pallet) is moved to the same square whereas the pallet itself remains in the production storeroom. The pallet flag is a piece of plastic marked with part number and replenishment quantity. The responsibility to move empty boxes or pallet flags to the square is the production personnel’s. When the supplier arrives, he refills the store (A), checks the square (C), and brings the empty boxes and pallet flags to his plant. This indicates the need for replenishment at the next replenishment occasion, when the supplier then puts the refilled boxes in location in the store and refills the pallets with the corresponding pallet flag then attached to the pallet. At the visit the supplier also checks if there is some bin starting to get empty and if so replenishes it. The supplier has the responsibility to make the dimensioning of the bins based on the forecasts that buyers send monthly via e-mail as a Microsoft Excel file. The supplier modifies the forecast to quantities per week (average values per week, covering a time period), but lets the dimensioning be influenced by peak values. The supplier then sends a note to the buyers to confirm the new bin levels. In IHD the company uses materials such as screws, nuts, packet bands, packaging materials, labels, and plastic bags. These are uncomplicated, standard materials with high yearly requirements, no need for quality control, fairly even consumption, and a cheap price, and there is no focus on capital being tied up. The items should not be bulky (voluminous) either. Similarly, to make IHD work supplier and customer must not be too far apart. Another important prerequisite to make the concept work well is mutual confidence and trust between customer and supplier and that the parties are engaged. One reason for the case company to apply this model is to avoid the need for registration of items in an ERP system and not to have inventory stock balances, since it is difficult and time consuming to maintain such a system for these kinds of products. No purchase orders need to be made or tracked in systems, and the buyer does not need to control shipped deliveries or similar activities. So information regarding inventory on hand or other issues concerning inventory control or traditional purchase activities does not exist for the concept of IHD. Also, no shipping documents need to be handled. The design system, on the other hand, contains information on the value of the IHD products that are added to the cost of the end product. This is an average value and is a very small part of the end product material costs. Besides that, system is used to document economic transactions. After the supplier has replenished the store, an invoice is sent corresponding to the refilled amount. A frame order is used to handle
29
the payment, so when the invoice arrives the correct amount of money is deducted. The frame order covers a period of time such as one-half or one-quarter year. The following indications of benefits and deficiencies with IHD emerged from the empirical study: Benefits:
• Easy to understand and work with. • Visuality (marks/squares/easy triggering for replenishment). • No inventory balances/No registrations/No need for checking inventory
balances/No need for counting items. • No main storing/No quality control. • Small resources regarding material handling/administration (no orders/no
delivery control). Simplification for the purchasing department. • Good access for materials, volume flexibility. • Tied-up capital unimportant (meaning the design is not regulated to that factor). • Counting with automatic.
Deficiencies:
• Takes time to design a working concept. • Single source could be a disadvantage because of the dependencies to the
supplier. Switching supplier. • Some problems (tricky) to get the IHD items’ cost into the finished products’
cost. • Risks employees taking too much material to the line. • Switching products means risk for obsolete materials (unclear routines and
responsibilities).
Analysis The method is here analyzed with the analysis model from section 3.4.
Planning environment/conditions: Product (1)
IHD items belong in the noncritical parts cell of the Kraljic matrix, since they have low economic importance and high availability on the market. Also, because these items are standard, noncritical parts, there is no need for quality control. The concept of IHD means that the supplier will visit his customer regularly in person to replenish the storeroom, but this cannot take place very often because of transport costs and other costs/activities related to the replenishment, so the bin levels have to suffice for a period of time to prevent material shortages. The same reasons imply that the items should not be too bulky and should have a high yearly requirement (items with a low yearly requirement have no need to use this concept). Regarding evenness in volume, IHD can manage irregularities in requirements, but within the limits given by the peak values forecast.
30
Planning environment/conditions: Information, trust, and geographical proximity between supplier and customer (2) The supplier must be provided with accurate and regularly updated forecast plans, since the supplier is responsible for dimensioning the bin system (which must be synchronized to manufacturing plans) and also for dimensioning his own process. This is important for avoiding material shortage, excess inventory, and obsolescence. All of this is in line with Christopher and Lee (2004), who declare the importance of shared and highly accurate information for control in the supply chain, as well as with Vigtil's (2007) emphasis on the frequency of information exchange and the supplier's need for planning. Vigtil (2007) also declares that current inventory balance is most important regarding information. In IHD this information is observed visually, and must clearly indicate actual consumption. Therefore, it is necessary to arrange a separate storeroom for IHD items according to that and also in order to avoid interference with items controlled by other planning principles. Concerning the relationship in a VMI situation, Pohlen and Goldsby (2003) explain the need for trust. Trust is important when using IHD, since the supplier has access to the plant and passes through the production area, plus has the responsibility for dimensioning the store. Trust is also necessary because the manufacturer will rely on the supplier sending an accurate invoice. In IHD the supplier has to deliver at a predetermined time with a limited number of replenishment occasions per year (because of the periodic nature of the system). Geographical proximity reduces disturbances such as late deliveries that possibly result in material shortages, which could, according to Christopher and Lee (2004) lead to problems drawing up an optimal production schedule. Besides that, geographical proximity is important since the supplier takes care of the transportation and will not have any other cargo to transport in return on his way back to his plant. A separate transport solution is necessary. Furthermore, it is especially desirable to keep the transportation costs low for these noncritical materials. So geographical proximity is of importance in IHD.
Basic principles: Material planning methods and the material flow (3)
The principle of pull is characteristic for IHD, because no replenishment will take place unless it is necessary (if the bins are empty), so IHD is demand driven. The replenishment is also periodic, with fixed delivery days and normally fixed order quantities. No purchase orders are created and it is the supplier’s responsibility to check/control and refill the store. The characteristics for VMI include that the customer does not place orders and the responsibility for replenishment is with the suppliers (Christopher, 2005). According to Mattsson (2002) different kinds of VMI designs are usually characterized by IT-based solutions regarding information exchange between supplier and customer. IHD, in contrast to this, could be recognized as a manual VMI solution similar to the form discussed by Mattson (2002) for its use

31
e.g. in food stores, but for direct materials for industrial applications. IHD is easy to understand and not dependent on data/figures. The supplier takes care of material handling activities for the replenishment process at his customer's plant and the material flows directly from the receiving area to the separate IHD store (deliveries directly to production), without registrations in an ERP or other IT system. In IHD there are no inventory balances in systems, either. When the production personnel later picks from the store, no transactions are necessary. IHD works with a two-bin system similar to the kanban principle. Bins are dimensioned according to the run-out time planning principle. When a bin is empty, it is the production personnel’s responsibility for placing the empty boxes (or pallet flags) in the special marked area to indicate the need for replenishment. Another bin then covers the material needed until the next replenishment. Basic principles: Visualizing (4)
Visual solutions characterize IHD. In the logistics flow there are no inventory balances or registrations/transactions in ERP or other IT systems, only visually viewed bins (with boxes and pallet flags), which also provide the basis for triggering replenishment. The bins are inspected visually/manually. Empty boxes (or pallet flags) are placed in a specially marked area to indicate the need for replenishment clearly. The store is also a marked and delimited area, in order to separate it from other flows and stores. Effects: Logistics goals (5)
Delivery service elements Fill rate: The two-bin system allows for a high fill rate and the possibility for picking when needed. The idea behind IHD (and the two-bin system) is that material is always available in store for production. It is also dimensioned according to peak levels. Lead time: Externally no lead time of the sort expected with traditional purchase orders exists in IHD. Instead, the lead time for the supplier's planning process and the lead time for transportation are of importance. According to Christopher and Lee (2004), a longer lead time could lead to larger risks, so in IHD it is important to minimize these lead times, which could be possible with a trustful relationship and geographical proximity between supplier and customer. The internal lead time from receiving area to production store and between the production store and the IHD storage can be kept very small because of the direct flow and the close position of the storage to the production area. Additionally, no time-consuming inventory transactions are necessary. Delivery precision: The supplier must follow the agreement about the time for the periodic replenishment. Fixed days for deliveries create good conditions for on-time deliveries and make planning easier for the supplier. Late deliveries also become more obvious.
32
Delivery reliability: IHD allows for high delivery reliability. The two-bin system provides correctly replenished amounts of material and an empty bin indicates a very clear need. Each bin (or pallet flag) is also dedicated to a certain product number. Specially marked IHD storage reduces the risks of interference with other material and putting items in the wrong places. Delivery reliability does admittedly depend on whether the production personnel fetch an amount from storage that matches the need for production; if not, the store may not be replenished correctly. Delivery flexibility: Dimensioning the bin system by peak forecast values allows for the possibility of varying or increasing the material issued from the store, yet within the limit given by the peak value. With frequent information exchange about forecast plans there are good opportunities to react quickly to volume changes. Since IHD is used for standard products, the items could be used for several end products (finished goods), implying high product mix flexibility. IHD allows for high delivery service, but on the other hand IHD is dependent on a single-source supplier (with high integration), which could mean difficulties if the supplier gets into a situation that leads to delivery problems. Switching to another supplier also takes time. Furthermore, changing the products delivered with IHD must be planned properly in order to avoid disturbances in deliveries. Since the method does not rely on figures in an ERP system, it could also be difficult to measure delivery performance. Capital tied up Although the literature pays considerable attention to reducing capital that is tied up, in the case of IHD this is of no interest because IHD materials are of low economic value. There are other aspects of interests with this concept. In addition, the idea behind IHD is that material is always available at a certain inventory level due to the periodic review system. Inventory accuracy The clearly visual bin system automatically reduces the possibilities of material shortages regarding replenishment. Although some screws (or other types of items) might be scrapped or lost, the bins, not figures in an ERP/IT system, provide the basic data for replenishment. Furthermore, having no need for registrations eliminates errors that would demand resources to handle and correct. The easy visual kanban system has potential for reducing errors. Axsäter (1995) points out that it is generally difficult to maintain a good inventory balance and that the most usual source of error is that employees do not register transactions properly. This and difficulties having correct inventory balance are reasons to use IHD. Use of resources and the flow Gadde et al. (1998) imply that administrative costs and handling of materials regarding purchased products could be high even for low-cost products. But in IHD there is no

33
need to create purchase orders, control the delivery schedule, or administer orders. In addition no shipping documents are handled. Material handling is generally costly (Oskarsson et al., 2003), but in IHD these costs are low since there is no quality control, nor any use of a main warehouse. Related activities there and a straight flow from receiving area to the production store imply savings. Furthermore, no time-consuming registrations of items or activities concerning inventory control are necessary. The kind of administrative resources that the customer must handle are small and include information exchange with the supplier (e.g., forecasts, procedures when changing products). Some administration is also necessary for adding the IHD item cost to the end product cost. IHD is also used for items that are not bulky, meaning low demand for facilities (e.g. store equipment). Since IHD could be recognized as a manual form of VMI and Mattsson (2002) implies that in most cases the costs will decrease with VMI, IHD can be expected to utilize a minimal amount of resources. The IHD principle is in line with what Wild (2004) points out about having simple processes to manage the inventory efficiently. Furthermore, several aspects indicate that IHD is easy to understand and operate efficiently for replenishment: the direct flow, working without ERP, the clearly visual bin system and other visual parts of IHD. According to the literature, visual solutions can contribute to increased productivity, clarify knowledge, reduce defects and mistakes, yield better information, and lower costs.
4.2 Mobile Inventory (MI)
Mobile Inventory (see Figure 5) at the plant works together with a third-party logistics provider (3PLP) located around 200 kilometers from the plant. The 3PLP provides the customer with electronic components such as resistors, capacitors, and integrated circuits used in the surface mount department, where printed circuit boards are produced in high volumes. The components used in Mobile Inventory are predominantly standard/noncritical and leverage parts. The 3PLP gathers the material flows from different suppliers and stores the items. The 3PLP stores materials for several plants and could be considered as the main store for the company for these kinds of components. The 3PLP also stores components for other companies, even competing companies.
The items will later be delivered to the customer with specially designed carts (the size of a big refrigerator) with wheels. The carts are equipped with tracks so a forklift can lift the cart and also handles to enable moving the cart by hand. Inside the carts there are pins attached horizontally on the wall to hold the electronic components, which are packed in rolls (with a hole in the middle for the pin). Electronic circuits are stored in pipes or small boxes and placed on shelves in the cart. Each cart has Excel spreadsheets of the contents, i.e. part numbers and the maximum inventory level, and product number labels inside.
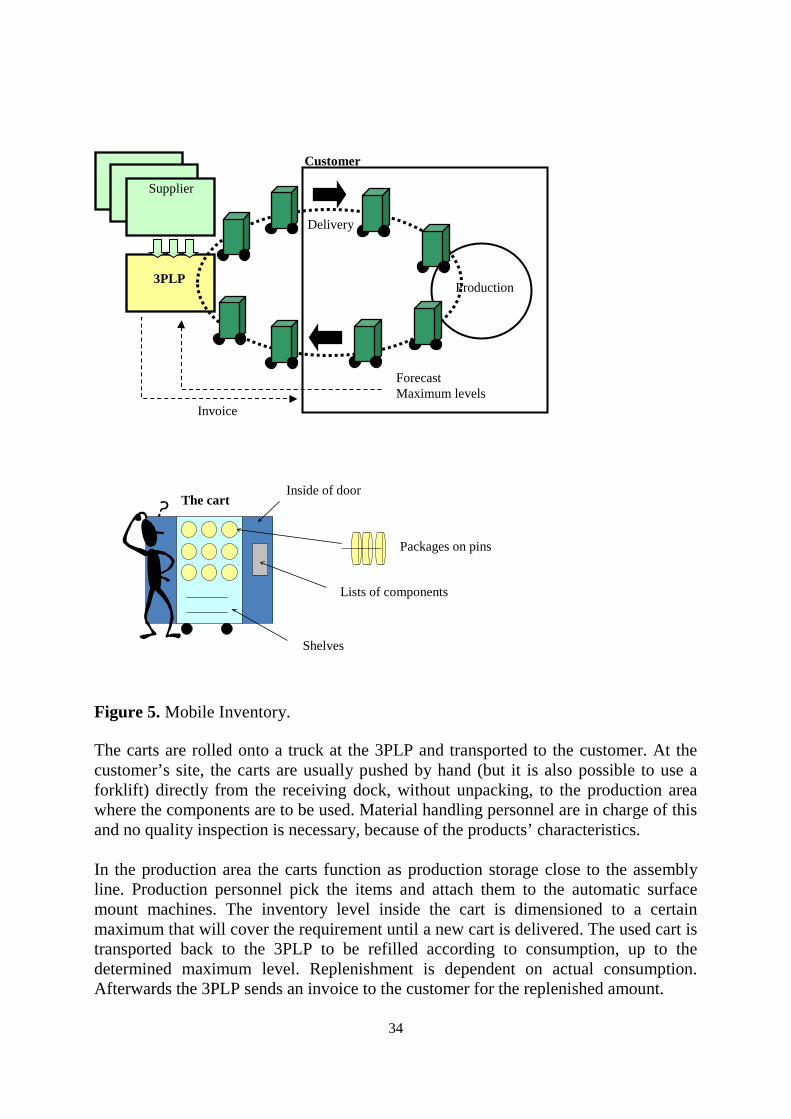
34
Figure 5. Mobile Inventory. The carts are rolled onto a truck at the 3PLP and transported to the customer. At the customer’s site, the carts are usually pushed by hand (but it is also possible to use a forklift) directly from the receiving dock, without unpacking, to the production area where the components are to be used. Material handling personnel are in charge of this and no quality inspection is necessary, because of the products’ characteristics. In the production area the carts function as production storage close to the assembly line. Production personnel pick the items and attach them to the automatic surface mount machines. The inventory level inside the cart is dimensioned to a certain maximum that will cover the requirement until a new cart is delivered. The used cart is transported back to the 3PLP to be refilled according to consumption, up to the determined maximum level. Replenishment is dependent on actual consumption. Afterwards the 3PLP sends an invoice to the customer for the replenished amount.
Forecast Maximum levels
Production 3PLP
Customer
Delivery
Supplier
Invoice
Inside of door
Packages on pins
Lists of components
The cart
Shelves
35
A number of carts circulate like this and are delivered once or twice per week at fixed delivery occasions without any traditional purchase orders being placed through the ERP system. To make this work the purchasing department sends a forecast via e-mail and Excel spreadsheets of coming requirements to the 3PLP, as well as information about changes regarding maximum inventory levels. The maximum levels are calculated with respect to the forecast and peak values of upcoming requirements, expected to cover a given time. The 3PLP is then responsible for maintaining these levels inside the carts. The inventory inside the cart then must cover the requirement until the next delivery occasion. The inventory also includes safety stock. Inventory on hand is always in the customer’s ERP system, regardless whether the cart is in transport or at the supplier’s location. When the carts are delivered to the receiving area, the list/document placed inside the cart by the 3PLP with information about the refilled amount must be registered; thereby, the corresponding item’s inventory level in the system is adjusted. The maximum level is then monitored in the ERP system. A frame order is used to handle the economic transactions. Except for that, no other transactions/registrations need to be done. After the electronic components are used in manufacturing, the printed circuit boards are registered in the ERP system as finished, and then the used items are deducted from the inventory. The following indications of benefits and deficiencies with Mobile Inventory emerged from the empirical study: Benefits:
• A simple flow easy to work with. The 3PLP-solution itself also means a simplified and gathering flow with less administration.
• Fewer resources are required for material handling/administration (no orders/no delivery control/no unpacking/no put away activities). Simplification for the purchasing department.
• Only one registration. • No main storage/No quality control. • Control of and low levels of tied-up capital. • Good access for materials, volume flexibility. • Flexible/mobile storage. Can be placed close to the line.
Deficiencies: • Half-full carts may be in transport. • Ergonomic aspects, manual movement and heavy to pull. • “Single source” could be a disadvantage because of the dependencies to the
supplier. • Takes time to design a working concept. • Tricky when rearranging for new items or in heavy volume rises (and unclear
routines).
36
Analysis
Planning environment/conditions: Product (1)
In the Kraljic matrix items appropriate for Mobile Inventory fit into the cells named noncritical (standard parts) and leverage parts. One reason for that is that the complexity on the supplier market should be low, since the 3PLP takes care of the flow, operating with several suppliers where there is a high availability on the market for these kinds of items. The 3PLP also stores and provides materials for different customers/companies, even competing companies, so strategic and bottleneck parts could be inappropriate for Mobile Inventory because of their sensitive matter. Strategic and bottleneck parts could be of greater interest for the company to control by themselves and not to replenish through Mobile Inventory, since these items are characterized by high complexity in the supplier market and strategic parts also have a great economic effect. Furthermore, strategic and bottleneck parts could be identified as products with rapid technology development, implying the possibility of numerous changes to the products in the carts, which would engender higher lead times and extra effort. Additionally, the aim with Mobile Inventory is to move products quickly from receiving dock to production area, without quality control and main storing, making the internal lead time low. Besides these aspects, Mobile Inventory is suitable when there is a high yearly requirement (for items with a low yearly requirement, and a low frequency of need, a more traditional process would be appropriate). The concept can manage irregularities in demand, but within the restrictions of the maximum levels, which must suffice until the next replenishment occasion, and limited by how the safety stock is dimensioned. A fair amount of evenness is preferable. Moreover, the carts’ limited dimensions mean that the items cannot be too big. Nor can the number of carts be too great, since that would make pallets more suitable than carts for transportation and storage reasons. For Mobile Inventory to work well, deliveries cannot take place too often either, due to the costs of transport and other activities related to replenishment.
Planning environment/conditions: Information, trust, and geographical proximity between supplier and customer (2) Christopher and Lee (2004) emphasize shared and highly accurate information for control in the supply chain. In Mobile Inventory the supplier must be provided with accurate and regularly updated information. Furthermore, trust is important when using Mobile Inventory, because the supplier has the responsibility for replenishment of the carts (and upholding FIFO when refilling, which can be difficult), keeping maximum levels, updating the levels in the cart/store, and handling the information sent by the customer for the concept to work. A high level of trust is also necessary so that the customer can rely on the 3PLP, sending an accurate invoice and ensuring good collaboration with its own suppliers.

37
Geographical proximity reduces disturbances such as late deliveries that could, according to Christopher and Lee (2004), lead to problems drawing up an optimal production schedule. In Mobile Inventory geographical proximity prevents disturbances in deliveries that could cause problems; the carts are expected to be delivered at predetermined times, and there is a limited safety stock to manage variations in demand. The inventory is calculated to cover the needs until the next replenishment occasion. Additionally, in case of increased volumes it could be necessary to quickly increase the frequency of deliveries, which is easier if the supplier is close. Furthermore, it is best to keep the distance short so the transportation costs can be kept low (especially since a separate transport solution is desirable). A separate transport solution is also desirable because mixing with other forms of pallets/orders could mean problems with loading/unloading the truck and using the volume inside the truck optimally. The concept relies on direct transport between the 3PLP and the customer at predetermined times, so combining with other supply solutions could decrease the delivery precision and increase the costs. However, its proper functioning relies on the accuracy of both the registration of refilled amounts and the information in the lists.
Basic principles: Materials planning methods and the material flow (3) The planning principle behind Mobile Inventory is a manual form of re-order point system with fixed days for deliveries and varying order quantities. The inspection/check of inventory on hand takes place manually at the supplier, a 3PLP. The cart is itself the stock. Furthermore, replenishment is not based on reports on the consumption during the last period. According to these aspects Mobile Inventory could be considered as a variant of a periodic ordering system (see Mattsson and Jonsson, 2003). Another characteristic of Mobile Inventory is that the lead time for replenishment from a system point of view is zero, because old carts are immediately replaced with carts that have been refilled to the maximum level. This means that the maximum level is calculated according to expected consumption during the interval between the delivery days, without adding the lead time. The maximum level is calculated according to the principle of run-out time planning, representing coverage for a particular time period. The calculation of the safety stock is also affected, since the uncertain time only includes the time between deliveries and not the interval between deliveries plus lead time, as in the normal case. Mobile Inventory could also be related to a VMI system, since the supplier is responsible for and takes an active role in the replenishment process (at his plant), which takes place without any traditional ordering process. With Mobile Inventory no unpacking is necessary. Instead the flow is quick and direct from the receiving area to production, where the carts can be placed close to the assembly line. No separate boxes or cartons are needed; the carts themselves constitute the store. The attached lists in the carts display the refilled amount to be registered; no
38
other transactions are necessary on the component level. Even if the carts are at the 3PLP or in transport, the inventory on hand is always in the customer’s ERP system. Furthermore, in Mobile Inventory there is no main storage. Instead the point is to limit storing to only a movable production store. When the production personnel later pick from the movable store, no registrations/transactions are necessary. Basic principles: Visualizing (4)
Mobile Inventory is partly a visual solution. The carts themselves constitute the store and function as a pallet. The carts are also movable and are placed close to the line on a specially marked area and physically distinct from other stores. The cart itself is clearly visual and has an obvious appearance. When picking from the store the corresponding product number is visually viewed with labels inside the carts and the actual consumption is visually observed. When refilling at the supplier’s site, need for replenishment is visually triggered in combination with comparison with the lists inside the cart.
Effects: Logistics goals (5)
Delivery service elements Fill rate and delivery reliability: The principle allows for high fill rate and delivery reliability, offering the possibility to pick the right product in the right quantity when needed. The inventory levels in the carts are expected to cover the requirement until the next refill, due to the principle of run-out time planning. A safety stock assures that variations in demand are handled. Special labels inside the cart showing the product number, in combination with the lists of maximum levels, indicate very clear need and afford correct replenishment. However, all of that is dependent on the dimensioning and updating process. Delivery time: No lead time as is the case with traditional ordering process exists in this method (except of course for the transportation time). Instead, from a system perspective the lead time could be regarded as zero for the customer, since old carts are exchanged without delay with new carts refilled to the maximum level. This could mean advantages in line with Christopher and Lee (2004), who argue that a longer lead time could lead to larger risks. The internal lead time between the production line and the mobile store is very small because the carts are positioned close to the production area and no time-consuming inventory registrations are necessary when picking from the carts. Lead time elements regarding administration include the time to update the maximum levels, to manage forecasts to 3PLP, and to register the refilled amount. Delivery precision: In this method delivery precision concerns the 3PLP’s contracted time and day for the periodic replenishment occasions. Scheduling periodic replenishment increases the possibility of reliability because planning for the supplier becomes easier. Late deliveries become more obvious in Mobile Inventory.

39
Flexibility: Dimensioning the system in consideration of peak forecast values allows for the possibility of varying or increasing the amount of material issued from the store, yet within the limit given by the maximum levels including safety stocks. With frequent information exchange about forecast plans and maximum levels, it is possible to update the volumes quickly. Since the concept is used for standard/leverage products, the items could be used for several end products (finished goods), implying high flexibility in the product mix. Another reason for the high availability of items is that the 3PLP stores components for several customers and therefore has inventory levels covering that situation. The frequency of delivery occasions can also be changed, but adding carts could take some time. Capital tied up Previous research has paid considerable attention to reducing capital tied up. For instance, Persson (1997) points out the relation between reduced inventory and reduced costs in her model, and Grant et al. (2006) state that reducing inventory is of great importance because excess inventory does not add value to the company. In Mobile Inventory no main store is used, just the production store (the carts), dimensioned for a certain maximum level. Therefore, it is possible to control and keep a certain amount of capital tied up, and potentially to reduce it. Furthermore, since the 3PLP stores components for several plants and other customers it could be considered as a main store, enabling reduced inventory levels for the whole. Inventory accuracy Mobile Inventory could result in good inventory accuracy by eliminating registration in the system when production personnel pick from the store and by cutting out the transactions that would have occurred between a main store and a production store. Since inventory balance is observed physically by comparing the list in the cart and the corresponding position of the products in the cart, this provides the basic data for replenishment, not figures in an ERP system, which could hide problems. Furthermore, the store is in a delimited place/surface, allowing for good control. Of course manual handling could also mean errors. Use of resources and the flow Even for low-cost purchased products administrative costs can be high (Gadde et al., 1998). Since there is no need to create purchase orders or shipping documents, control the delivery schedule, or administer orders, Mobile Inventory enables savings in these aspects. The system runs by itself to a large extent. The administrative resources that the customer must handle are small, but include information exchange with the supplier regarding forecasts and updating maximum levels. Normally material handling activities are costly (Oskarsson et al., 2003; Gadde et al., 1998), but in Mobile Inventory these costs are low, since there is no unpacking, no quality control, nor any use of a main warehouse and related activities there. There is a simple flow direct from the receiving dock to the assembly line. Although the refilled amount must be recorded at the receiving area, no time-consuming registrations of items or

40
activities concerning inventory control within production (on a component level) are necessary, which in turn eliminates errors that would demand resources to handle and correct. Since the cart also functions as a pallet and is reused all the time, no separate boxes or cartons are needed. The easy visual system also reduces errors. The carts are used for nonbulky items, necessitating less space to store equipment. The carts also are flexible when changing the layout, because of their mobility, which means cost reductions in that sense. Just as Mattsson (2002) implies that in most cases the costs will decrease with VMI, the similar Mobile Inventory can be expected to utilize only a small amount of resources. Also the 3PLP solution implies cost reduction, since flows is gathered etc. Furthermore, the concept implies opportunities for consolidating orders (here replenishment occasions) with deliveries, as with periodic review systems, meaning also a more efficient use of transport (see Jonsson, 2008).
The resource utilization is expected to be low in total. However, half-full carts could be in transport or at the supplier, if consumption is smaller than was expected. Furthermore, if there are quick and large changes in volume, the volume of the cart could be a limitation. More carts could be used, but still there is a limit where this could be unpractical, take too much time to arrange, or cost too much. Rearranging with new components in the cart and upholding FIFO also takes time. Additionally, from an ergonomic aspect it could be disadvantageous to roll the cart by hand.
4.3 Call-Off Production (COP)
In call-off production (see Figure 6), replenishment takes place through call-off orders initiated from the production area. The products are in the production stores organized in a two-bin system; when one bin is consumed, a call-off order is triggered by a kanban principle. Bins are dimensioned to cover a number of days’ consumption (including a safety time). Each bin is of the same size. The call-offs are submitted directly through EDI to a 3PLP. The call-off order will be delivered within 24 to 48 hours, depending on what point within a twenty-four-hour period the call-off is made. The supplier needs forecasts for internal and long-term planning. Forecasts are sent through the ERP system. A frame order is used to handle the economic transactions. The bins must also be updated when plans are changed. The company uses this concept for standard/leverage parts, electronic components such as resistors, capacitors, and integrated circuits. In call-off production no quality control takes place, nor are products stored in a main warehouse, so from the receiving area products flow directly (after registration) to the production store. Internal transportation is done by the customer’s material handling personnel.

41
Figure 6. Call-Off Production. The production stores are located near the production line and are known as paternoster storage (see Figure 7), controlled by a separate computer system integrated in the storage (for registrations, inventory on hand, location, etc.) in combination with the kanban principle. The products/bins are located on different shelves, which can rotate. The computer system communicates with the ERP system and provides it with stock information. Furthermore, the specific plant in the case study has several production stores, some using traditional kanban and others electronic kanban. The study includes both variants. Traditional kanban is also in use for other situations than COP and 3PLP. To separate, different colors of kanban are in use.
Figure 7. Paternoster storage.
Call-off order
Production store
Production
Customer
Delivery
3PLP
Supplier
Forecast
Invoice

42
Triggering replenishment with traditional kanban Figure 8 shows the principle with the two-bin system and traditional kanban. When the last package has been picked in the bin, the need for replenishment is made visual through this physical card attached to the last package in the bin. Material handling employees remove the kanban from the package, scan the bar code on the card, and submit a call-off electronically to the supplier.
Figure 8. The principle shown with traditional kanban in a two-bin system. Figure 9 shows the flow of kanban and materials. X and Y are in the figure symbols used to describe stock location in the ERP system. At the receiving area (1) the materials (delivered by the call-off) are registered in the ERP system (whereupon the delivered quantity has stock location X in the production area). A forklift then transports the delivery to a special square in the production area (2). A material handling employee picks the corresponding kanban from a certain box (7) and tapes the kanban to the package. Then the packages are moved to the production store (3). Before the material goes into storage, the computer system is updated with stock information (part number and quantity) through bar coding at the storage terminal. Then the stock location of the product is also changed to Y. On the terminal a display shows the location/position (what shelf and where on the shelf) the material will be stored in; the corresponding shelf is moved so the material can be placed there. In the storage it is not necessary that the bins are physically located close to each other, since the system controls the positions. It is important that the package with the kanban is placed as the last package in the bin. Material handling personnel are responsible for all of the activities mentioned.
1 bin Picking/Issue
Kanban
Package
1 bin
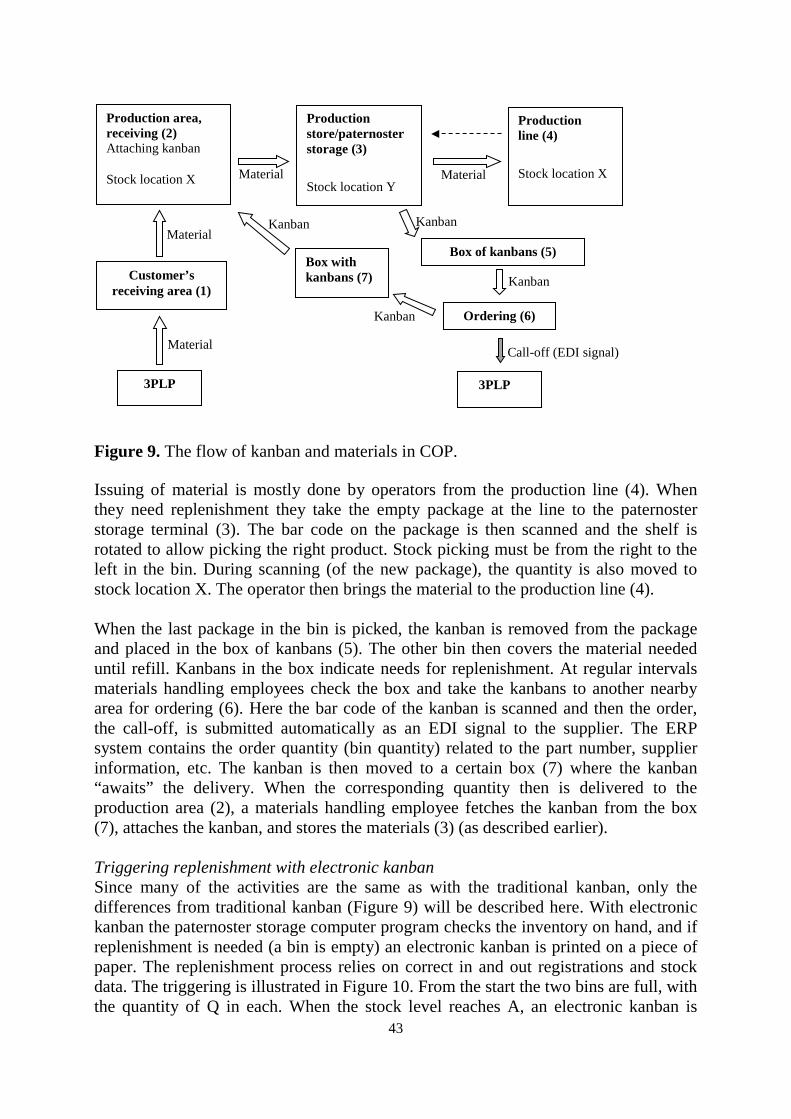
43
Figure 9. The flow of kanban and materials in COP. Issuing of material is mostly done by operators from the production line (4). When they need replenishment they take the empty package at the line to the paternoster storage terminal (3). The bar code on the package is then scanned and the shelf is rotated to allow picking the right product. Stock picking must be from the right to the left in the bin. During scanning (of the new package), the quantity is also moved to stock location X. The operator then brings the material to the production line (4). When the last package in the bin is picked, the kanban is removed from the package and placed in the box of kanbans (5). The other bin then covers the material needed until refill. Kanbans in the box indicate needs for replenishment. At regular intervals materials handling employees check the box and take the kanbans to another nearby area for ordering (6). Here the bar code of the kanban is scanned and then the order, the call-off, is submitted automatically as an EDI signal to the supplier. The ERP system contains the order quantity (bin quantity) related to the part number, supplier information, etc. The kanban is then moved to a certain box (7) where the kanban “awaits” the delivery. When the corresponding quantity then is delivered to the production area (2), a materials handling employee fetches the kanban from the box (7), attaches the kanban, and stores the materials (3) (as described earlier). Triggering replenishment with electronic kanban Since many of the activities are the same as with the traditional kanban, only the differences from traditional kanban (Figure 9) will be described here. With electronic kanban the paternoster storage computer program checks the inventory on hand, and if replenishment is needed (a bin is empty) an electronic kanban is printed on a piece of paper. The replenishment process relies on correct in and out registrations and stock data. The triggering is illustrated in Figure 10. From the start the two bins are full, with the quantity of Q in each. When the stock level reaches A, an electronic kanban is
Kanban
Material
Kanban
Kanban
Material
Kanban Material
Material
Call-off (EDI signal)
Customer’s receiving area (1)
Production store/paternoster storage (3)
Stock location Y
Production line (4)
Stock location X
Box of kanbans (5)
Ordering (6)
Box with kanbans (7)
3PLP
Production area, receiving (2) Attaching kanban Stock location X
3PLP

44
generated. Until replenishment, bin 2 covers the need. The computer system controls the bins to uphold the FIFO principle. The display on the terminal will show the right position for picking, and the right shelf will be moved so picking is possible. Figure 10. Triggering replenishment with electronic kanban. The following indications of benefits and deficiencies with call-off production emerged from the empirical study: Benefits for call-off production (with both kanban types):
• Easy to understand and operate. • Short internal/external lead times. • Orders initiated directly from production (where the consumption is). • High availability of materials, frequent deliveries, and volume flexibility. • Low level of stock and control of tied-up capital. • Low level of administration/simplifies for the purchasing department. • No time-consuming quality control/No main storage. • Particular solutions, including indications of the inventory status, visible
cards/paper, separate squares/boxes, empty packages for issuing, bar coding. Benefits of traditional kanban:
• Visibility indicates needs clearly. • Positive influence on inventory accuracy. • Reduces the possibilities of material shortages. Figures in an IT system do not
provide data for replenishment. Deficiencies of traditional kanban:
• Requires more handling than electronic kanban. • Lost kanban. Forgetting to attach kanban. • The one who picks the last package with the kanban must release it and put the
kanban in the box. • Picking from right to left must be upheld.
Bin 1: Q
Bin 2: Q
Time
Stock level
A
Delivery of Q (before the level reaches zero)
45
Benefits of electronic kanban: • Requires less manual handling. • Picking from right to left in the bin is not necessary.
Deficiencies of electronic kanban:
• Basic data for replenishment are figures in an IT system. This could lead to material shortages or inaccurate orders, and consequently to inventory inaccuracy. It relies on correct in and out registrations and stock data in the paternoster storage; electronic kanban could hide problems in the stock.
• Not the same visibility as conventional kanban. Analysis
Planning environment/conditions: Product (1)
Referring to the Kraljic matrix, products appropriate for call-off production fit into the segments called noncritical and leverage parts. One reason is that the concept works well together with a 3PLP. According to Oscarsson et al. (2003), the idea with a 3PLP is to gather the flow from several suppliers and store items, allowing for small, quick, and frequent deliveries. A 3PLP can function as a main warehouse and also deliver to competitive companies. Strategic and bottleneck parts are therefore not appropriate for call-off production because of their complex and sensitive nature. Additionally, working with call-off production assumes a high yearly requirement and fairly even consumption due to limited bin sizes. Furthermore, there should not be any quality control, which delays the deliveries, since the idea is to have fast deliveries to production. Moreover, in this concept the item’s size/shape is not of importance. In this case electronic components, which by nature are small, are used with COP. Because of this the stores are also adapted to that, but in principle call-off production could use other types of storage for larger products. Planning environment/conditions: Information, trust, and geographical proximity between supplier and customer (2) The 3PLP in call-off production must be provided with accurate and regularly updated forecast plans and bin levels, so the 3PLP can dimension its own process and communicate with its own suppliers. Trust between supplier and customer is important when using call-off production, because the supplier relies on the 3PLP, keeping a well-dimensioned store and sending accurate deliveries in response to the call-off. In a just-in-time system this is very important, since the customer’s production stores are strongly limited and depend on small, quick, and frequent deliveries. Trust is also important because the 3PLP stores material for other companies, so there must be no interference between dedicated items or providing other customers (competitors) with sensitive information. Furthermore, the geographical proximity between customer and supplier is a good way to ensure the high frequency of deliveries with short lead times, reducing disturbances such as late deliveries and keeping the inventory levels low. The 3PLP must also maintain good communication and relationship with its own suppliers.
46
Basic principles: Materials planning methods and the material flow (3) Call-off production is a pull method, closely related to JIT, where kanbans and a two-bin system are used for triggering replenishment directly from a 3PLP. The internal flow is direct from the receiving area to production, without quality control or main storing (direct deliveries). Except for the kanbans, the call-off process is supported by ERP, bar- coding, EDI and a separate IT storage system. Items in the production store are organized in a two-bin system where the bin sizes are dimensioned according to the principle of run-out time planning. Two different variants of the kanban system are in use (at different production stores) in call-off production: Traditional kanban with the physical card being a clear indication of need for replenishment, and the electronic kanban (a printout). When the bin is consumed the storage computer system will initiate the printout by checking inventory on hand. Material handling contains of removing/attaching and controlling kanban, placing traditional kanbans in the right positions, initiating the call-offs, refilling the store, and doing its associated registrations. In the bins FIFO concerns picking from right to the left (manually controlled) and between bins with electronic kanban FIFO is upheld automatically through the IT storage system. Material handling personnel take care of the mentioned activities (including internal transportation) while production personnel take care of issuing from the store. Basic principles: Visualizing (4)
In call-off production different visual solutions were identified to support the flow and the replenishment processes: the two-bin system itself indicates inventory status, the visual kanbans show need for replenishment, there are separate squares and boxes for kanbans and materials, and empty packages are bar-coded for issuing new materials from the paternoster storage. Furthermore, to identify and separate different flows, different colors for the manual kanbans are in use. Effects: Logistics goals (5)
Delivery service elements Fill rate and delivery reliability: The Call-off production principle allows for high fill rate due to the two-bin system. The inventory levels in the bins are expected to cover the requirement until the next refill, due to the principle of run-out time planning. However reliability depends on the accuracy of the dimensioning and updating process. The kanban principle with clear information about product number and quantities also allows for delivery reliability. Delivery time: The call-off order will be delivered with a short lead time, in accordance with a just-in-time system. The time from call-off to delivery is 24 to 48

47
hours. The supplier is also located close enough to the plant, around 200 km, making this possible. Frequent deliveries are possible. Delivery precision: In this method delivery precision concerns deliveries within 24 to 48 hours. The lead time is in that sense fixed, implying good conditions for delivery precision to be high. The concept relies on low stock levels and frequent deliveries, and these aspects must be confirmed with the supplier before implementation. In case of late deliveries it becomes obvious due to the visible kanbans that accumulate. Since there are registrations in systems, delivery precision is also possible to measure. Flexibility: The two-bin system allows for the possibility of varying or increasing the amount of material issued from the production store, yet within the limits given by the maximum levels. With frequent information exchange about forecast plans and bin levels, it is easy to update the volumes quickly. Since the concept is used for products with high availability on the supplier market, updating bins and responding to call-offs should not become a problem. Furthermore, the parts could be used for several end products, implying high flexibility in the product mix. Capital tied up In call-off production no main store is used, implying low stock levels. There is just a production store dimensioned for a certain maximum level controlled by the kanban principle, meaning control of and low levels of tied-up capital. Inventory accuracy The visual parts of the replenishment method can reduce errors and contribute to uncomplicated processes. The system uses bar coding, which also eliminates errors and is easy to operate and understand, aspects that Wild (2004) and Fleisch and Tellkamp (2005) assert are beneficial for inventory accuracy. Traditional kanban in call-off production, with the visible card being a clear indication of need for replenishment, could also reduce risks for material shortages and inventory inaccuracy, since the basic data for replenishment are not figures in an IT system. Different colors of kanban also reduce risks. Regarding the electronic kanban, incorrect figures in the IT system could lead to material shortages or inaccurate orders, and consequently to inventory inaccuracy. Using electronic kanban could mean that problems in the stock are hidden. This is similar to the problems that can appear in MRP, where data must be current and accurate for correct calculations (Kumar and Meade, 2002; Jonsson, 2008). Even if visual solutions are generally beneficial, mistakes do happen, such as lost kanban cards and errors in the handling of cards and materials. Use of resources and the flow Call-off production used with kanbans is an uncomplicated pull method. According to Wan and Chen (2008), kanban solutions lead to efficiency, lower costs, and ease of control. In call-off production a 3PLP provides materials frequently and with short lead times from suppliers at a distance. A 3PLP can in many cases perform this at a lower cost than the company itself could (Oskarsson et al., 2003). In the replenishment method there is no need to create traditional purchase orders, control the delivery
48
schedule or administer orders, perform quality control, nor use a main warehouse and with its related activities, enabling savings in these aspects. Call-off production runs by itself to a large extent, except for some activities concerning forecasts and updating bins, as well as setting up frame orders for economic purposes. Regarding kanbans, handling and registrations are necessary. The conventional kanban requires more handling activities than the electronic kanban. In both variants registrations are necessary, but these occur through bar-coding, which is easy to handle. Moreover, the replenishment method utilizes EDI for the call-off to the supplier, which is also efficient (see Jarupathirun et al., 2009). Some deficiencies with the conventional kanban are the need to pick the package with the attached kanban as the last one, the potential for lost kanbans, and time-consuming handling activities. Other studies have brought attention to other problems with conventional kanban, e.g., distance to supplier, limitations in tracking/monitoring, and inaccurate measurements (see Wan and Chen, 2008; Jarupathirun et al., 2009). However, since call-off production with conventional kanban is combined with an automated process with bar coding and an EDI/ERP system, these problems are reduced. Turning to the electronic kanban used in call-off production, the benefits include no need for picking parts in a special order and attaching and releasing activities. Electronic kanbans also signal clearly the need for replenishment (but only when they are printed out). This variant also reduces the risk of lost cards (even if there is a possibility of losing the kanban printouts).
4.4 Material Requirements Planning (MRP)
The following description of the flow with MRP will help in understanding the other methods and their characteristics, and for getting inputs to the decision tool. The principle (see Figure 11) means that the supplier delivers specified purchase orders that are decided in advance and calculated by the ERP system’s MRP function. So deliveries are according to individual orders. The fixed purchase orders lie within a frozen time period dependent on the lead time. Beyond the frozen period there are forecasts. The basis for the MRP process consists of main plans/forecasts and sales orders on finished products which are going through a breakdown procedure into needs for specific parts. The MRP process requires data concerning BOM, lead time, lot sizing, inventory, and safety stock level/buffer lead time. Order quantities may vary. How the orders and forecasts plans are transferred to different supplier varies and different solutions are used: EDI, fax/automatic fax, file transfers, and e-mail.

49
Figur 11. The MRP flow.
The MRP principle has been used at the case company throughout the whole article range (electronic components, printed circuit boards, screws, mechanics etc.), but alternative methods such as those included in this study, IHD, MI, and COP, are now used in parallel. The MRP principle is used to a decreasing extent at the company but is applied in situations with low volumes, where there are few occasions or needs per year, for project materials, when products change frequently (in/out-phasing of products) and for strategic/complex materials (especially very expensive products). One of the respondents expressed that it might be important to "keep the eyes extra on a complex product", motivating the use of MRP. The way that the flow with MRP is structured means that deliveries are put into the main storage after goods receipt and quality control activities (if needed). Related to these activities, registrations are made in the ERP system with bar code scanning. Also, manual registration takes place to confirm the delivered quantity. Main storage is used in order to reduce the amount of material in the production warehouse. Registrations are done in ERP to update the system with inventory balance information, storage locations, location in storage, movement, and different status. In some cases, part numbers are changed (when the supplier and the customer have different part numbers for the same product). Compared with the other replenishment methods MRP practices more registrations and has more need for parameter settings. It is important that staff is careful with registrations and parameter settings in order to maintain the correct data in the ERP system, since this data is the basis for generating orders. Furthermore, correct handling of registrations/parameters is important to display correct information in the system and keep good inventory accuracy. However, the company has problems with data accuracy with this MRP method. The MRP method also requires more administration in operation compared to other studied supply methods.
Forecast plan
Delivery
Purchase order
Production store
Main store
Production Supplier
Customer
Receiving area/quality control
Invoice
50
Delivery checking is continuous and requires that the buyer or planner actively controls planning messages, the order situation, and the inventory stock balance in the ERP system. Example of planning messages can be signals of future shortages of materials, which can lead to the need for replanning and contacting the supplier, unless the safety stock covers the shortage. Especially when it comes to changes in plans it is important to have good collaboration/communication between planning staff and buyers and suppliers. The supplier must also announce delays. One reason for using safety stock is if the supplier cannot meet the demand. The supplier also often has a safety stock. Regarding the actual consumption in production, the supplier does not “see” that in the MRP-case. For instance, the supplier keeps delivering according to the orders even if there are production disturbances (stops) or rapid changes in volume happening in the near future, unless re-planning and communication with the supplier takes place. When it comes to delivery service especially, the lack of flexibility is a disadvantage with MRP. Below, some benefits and deficiencies are described in brief, emerged from the empirical study. Some factors are not directly linked to the MRP principle itself, but in context they can be a consequence of the application of just MRP.
Benefits:
• Traditional and habitual way of working. Requires little training effort. Low implementation cost (besides EDI costs and the cost for the ERP itself), since ERP systems usually contain the MRP function. Can be used with the existing equipment (e.g. storage systems) and the established internal flows (no new principles/practices for flows need to be established). Requires less work for implementation when compared to other replenishment methods.
• When changing suppliers, no big reworking due to low degree of integration. Need not reflect long-term effects in the same way as in the other methods.
• In allocating situations (e.g., purchase of certain strategic materials when shortages occur in the market and in discount situations) orders and replenishment can be controlled effectively.
• When lead times are uncertain and when there is uncertainty about suppliers' delivery performance, because with this principle the supplier can focus on specific orders.
• Exact deliveries.
Deficiencies:
• High administration/resource utilization (compared to IHD, MI, COP). Resources for delivery checking/control and parameter setting/control (and since this is demanding it does not always occur). Administration may also involve “chasing materials” due to material shortages and making changes to

51
planning in the ERP system. In comparison, there are also higher costs to maintain and operate the systems.
• Low flexibility when there are changes in volumes/plans • High dependency on accurate data in the ERP system for good-quality MRP
calculations/generating orders and other information in the ERP system. • Inaccurate registrations/records can cause errors in inventory balance accuracy
(which is a common problem causing uncertainty in reliance of monitored data in the ERP system).
• Suppliers do not always inform about changes in order/delivery status. • "Wall" between supplier and customer because there is a focus on the generated
purchase orders. The supplier does not know/see real needs. • Risk of high levels of tied-up capital when deliveries do not always reflect real
consumption (MRP method does not give good prerequisites for low levels of tied-up capital).
Analysis
Planning environment/conditions: Product (1) Referring to the Kraljic matrix, products fit into all segments, since the concept itself is not dependent on issues of type of product, complexity, volume, and size of product. In situations with very low volumes, needs of only a few times per year or when products are in and out phased frequently (included project material), MRP could be especially appropriate. Besides these, if there are stable or fixed requirements/orders on the finished-product level, MRP could be suitable. It is unnecessary to build up a special supply solution in those cases, since MRP functionality is integrated into most ERP systems and is a well-known principle. Furthermore, MRP is motivated if there is a need for controlling special items, strategic and bottleneck items, or there are other aspects concerning discount or allocating situations. Other reasons could include factors concerning the supplier’s ability or if there are doubts about a long-term relationship. MRP could be especially suitable when there are dedicated orders that could be handled and controlled more easily through the system. But a long lead time for the purchased product makes the situation complex with MRP, because it could mean that the volume requirement and the purchase order do not match, if there are changes within lead time. Using MRP implies low flexibility. This is in line with Kumar and Meade (2002) about the problems with MRP. Of course, a safety stock can compensate for that, but that ties up capital, while lacking transparency and push tendencies.

52
Planning environment/conditions: Information, trust, and geographical proximity between supplier and customer (2) The supplier must be provided with forecasts and orders, and the customer must assume that the supplier delivers the orders properly. Changed plans after submitted orders must be handled and informed manually (for both customer and supplier) if the deliveries are to match with the production plan, unless the safety stock covers the situation. How the information is transmitted varies. EDI is an expensive solution, and using other methods (e-mail, fax, file transmission) also necessitates correct manual handling. The techniques and routines for information exchange must be carefully considered in order to support communication properly. In general, trust is of course important, but compared to other replenishment methods, using MRP requires less trust when it comes to the replenishment process/activities and the customer’s involvement in that. There is a low level of integration between supplier and customer. The interface is relatively uncomplicated because the supplier receives an order picture (with purchase orders and forecasts) of future demands and delivers in accordance with these orders. In MRP the supplier can focus on the determined orders, but is not aware of the real consumption. MRP could be easier to work with if suppliers do not fully understand the pull concept or have gaps in logistics competence. On the other hand, if MRP is in use and, for example, requirements change, MRP can be difficult to manage and the supplier may have difficulties comprehending the order flow. The case study indicated that with MRP there could be a “wall” between the supplier and customer. Geographical proximity is always beneficial, but its importance in MRP is less compared to how the other supply solutions are designed. Basic principles: Materials planning methods and the material flow (3)
MRP is not associated with pull; instead, the push principle could be characteristic for MRP since delivered orders can be difficult to match with real consumption. However, this is depending on lead times and the stability in demand. In MRP, purchase orders are generated according to different data in the ERP system. In the case described, material flows from the receiving area through quality control and is stored in main storage until it is delivered to the production store. How this flow is configured may vary. The company’s own material handling employees take care of the flow. In the materials flow, several registrations and transactions are done in the ERP system. Inventory balance and other information are shown in the ERP system. Using MRP also mean a lot of administration for the purchasing department, for example parameters to handle in the system. MRP is very dependent on IT. The other methods in this study, IHD, COP, and MI, are methods with more integration between supplier and customer.
53
Basic principles: Visualizing (4)
The way replenishment takes place with the MRP principle is not visual. With this method employees may find it difficult to acquire a feeling for it and understand the underlying calculations clearly, since MRP is very dependent on data and calculations. Compared with the other methods in the study, MRP is complicated. Effects: Logistics goals (5) Delivery service elements In the case of delivery service, it can be difficult to decide what it means precisely for MRP. MRP is used for many different suppliers and products. Many different factors affect the lead time (external/internal) such as supplier maturity, geographical distance, product complexity, etc. However, MRP does mean good opportunities to measure data about orders, since it is stored in the ERP system. The other methods also mean more integration between suppliers and customers. The methods are also designed for specific situations, which makes conditions for a better delivery service. Availability of materials in MRP is dependent on whether the orders correspond to an actual need for the production and how the safety stock is dimensioned. If there are volume changes within lead time, there is a risk of material shortages or exceeding stocks. A longer lead time means more difficulties than a shorter lead time in that sense. Since the concept includes several material handling activities from receiving area to the point of need, the internal lead time must be taken into account and increases the total lead time. Achieving volume flexibility could be a difficulty with MRP (of course depending on lead time and how the safety stock is dimensioned). The lower level of integration between supplier and customer could also mean difficulties with delivery service, since the supplier only sees the “sharp” orders and not a picture of the actual consumption (for instance, as is the case with consumption from a store or bin). A higher integration means that the supplier also can learn and see patterns in consumption more easily, and understand the customer’s situation better.
Regarding delivery precision there could in some respect be advantages, since the supplier has specified orders to handle/focus on. It also provides a good basis for measuring delivery precision, because all orders (with their data) and corresponding registrations are stored in the ERP system. However, this is of course depending on registrations/transactions and other activities with the ERP being done correctly and on changed plans showing up properly in the system. But if orders are delayed and dates are adjusted in the system, this could mean that the measurement of the precision will be erroneous since the orders are replanned to how the supplier is able to deliver. However, there are difficulties expressing how using MRP influences delivery service elements owing to a lot of factors: how orders correspond to actual needs, lead time, safety stock, internal lead times, level of supplier integration, data accuracy (risks for inaccurate orders) and administration in the ERP system.

54
Capital tied up MRP could lead to a high level of tied-up capital for several reasons, such as push tendencies, lack of integration between supplier/customer, the internal lead time and the safety stock. The concept also means difficulties controlling stock levels. (Some reasons are not directly related to MRP itself, but to the environment MRP is used in). Inventory accuracy MRP is a complex method dependent on a lot of data (calculations, transactions, and registrations), which could lead to the potential for inventory inaccuracy. For calculations in MRP to work well, data must be current and accurate (Kumar and Meade, 2002; Jonsson, 2008), which could be difficult to achieve with MRP. The method is not in line with Wild (2004), who declares that simple processes should be in use in order to avoid inventory accuracy. Use of resources and the flow Compared to the other studied methods, MRP uses more resources for administration/purchase activities (administer orders, set up planning parameters, control deliveries, control of planning parameters, etc.), use of system/registrations, material handling activities, quality control, and main storage and its related facilities. Since the purchase orders might not always correspond to the real need, efforts/administration are needed to handle these situations (if they are handled at all). The study also indicates that “chasing material” could be a time-consuming activity. Furthermore, the production planners must make efforts to provide the purchasing department with information about changes in order and vice versa. Furthermore, the basis for generating orders is a lot of data which the ERP system must be provided with. This also means potential for errors. The low degree of visibility and the complicated process for replenishment of material mean more resource utilization.
55
4.5 Factors to consider when selecting replenishment methods
Various factors may be crucial for choosing a proper replenishment method. Factors could concern the supplier's maturity and logistics knowledge about topics such as innovation, adaptability, understanding that stock in several places is ineffective, understanding pull in practice, and insight into the idea of win-win. Furthermore, it is important that the customer and supplier work together in development projects. Other important aspects to take into account related to the supplier are: long-term approach, IT skills, communication/information exchange, and capability concerning delivery performance, lead times, flexibility, quality, volume, transport times and geographical proximity. The aim is also that the supplier sees and knows the real need/demand in production (which may mean that some other method is more suitable). This means that the supplier will be able to better act, but this also requires more trust of the supplier. Furthermore, in order to work in a long-term perspective, the number of suppliers must be optimized, phasing out those that are not considered developable and deepening cooperation with others. It is important to pursue for long-term relationships with the most important suppliers in a win-win situation. The characteristics of the product itself are often a determining factor. Product complexity can be about functionality, if it is a unique/strategic or standard product. The complexity may also include availability on the market and the existing number of suppliers. Another factor relates to design issues — how often a product is developed, changed, or replaced. Different aspects of volume/demand are also significant: low versus high, how frequent the needs are, and evenness. Another factor of importance is that over time, products become more standardized, which means that more components fit more end products and can mean that some replenishment methods increase in use. Different products have different circumstances, and as one respondent put it, “there are playing rules for products”. Thus, there may be different replenishment methods for different circumstances. Other factors concern requirements about resources/systems (purchasing activities, material handling, etc.) and what the goals and motives are for the materials supply. Resources for introducing a particular method are also of importance and various human skills may be required to apply different methods. Furthermore, resources are needed to work with differentiated and improved approaches. This requires expertise and innovation among employees, who should be characterized by responsibility, carefulness, communication skills, and a customer-focused approach.

56
5 Factors important for analyzing replenishment methods
The section discusses factors that are important for evaluating the qualities of replenishment methods and the usability of the developed analysis model. Research question one (RQ1) deals with factors important for evaluating how effective replenishment methods are, which is an important question since companies need replenishment systems in order to improve customer service and reduce inventory costs (see e.g. Myers et al., 2000). Methods can be applied in various ways, but many companies have difficulties applying methods to their processes, and less effort has been exerted in exploring how to use them to achieve an efficient material flow (Jonsson and Mattsson, 2006). Therefore it is of interest to explore factors influencing how effective replenishment processes are. The literature discusses a lot of important factors to consider, but often separately or in a specific situation, e.g. in optimization or simulation models. Examples of factors are different delivery service elements, tied-up capital, material handling, product characteristics, use of resources, and inventory accuracy. Maybe inventory accuracy could be seen as a limited issue, but inaccuracy could affect the whole company (see Fleisch and Tellkamp, 2005; Wild, 2004), which is why it is important to discuss it in materials supply. The type of supplier also affects the supply. For instance the use of third party logistics provider could be a competitive advantage (Aghazadeh, 2003). Several of the mentioned factors are also directly related to cost aspects. An additional factor to reflect on is the planning environment, meaning the conditions on and limitations of the planning (see Mattsson, 1994; Mattsson and Jonsson, 2003). In this study this is discussed under the term planning environment/conditions and contains aspects of the prod uct (characteristics, volume, etc.) and relations between supplier and customer (information, trust, etc.). Furthermore, it is essential to identify the basic principles that a particular method is related to. Examples of this are known materials planning methods, material handling aspects, delivery patterns, and principles of visuality, enabling acquaintance with the method and a discussion of the various effects it brings. The literature indicates that there is a need to increase the knowledge of methods in industry and pay attention to the need for more case studies (see Dong and Xu, 2002; Småros, 2003; Jonsson and Mattsson, 2006; Jonsson and Mattsson, 2000). To increase the knowledge of applications in practice there is a need to analyze in a structured way, which is why an analysis model could be helpful. Johansson and Johansson (2006) have developed a model, but their study focuses on product development projects and does not fit the purpose of this study. No suitable model was found in the literature. Therefore, in order to evaluate how effective replenishment methods are in their application in industry, an analysis model was developed based on a detailed literature review of general factors.
57
In use, the analysis model provides a clear structure to follow when characterizing or analyzing replenishment methods. The model helps to identify and sort out the various factors essential for materials supply. The model was fruitful when it was tested on the four case studies, three similar and one divergent, in the electronics industry. Since the model is built on general principles, it could be regarded as a general analysis model, not dependent to any special industry sector or type of product. The strength with the analysis model is that it covers a lot of different factors in a framework that contributes to an overall picture; replenishment must be seen as a whole and not with isolated principles alone. The factors in the model are sorted under three main areas: basic principles, planning environment/conditions, and effects. The area of planning environment/conditions is particularly interesting, as methods usability is strongly related to the environment they are used in (see Mattsson, 1994). In the literature study, only two researchers were found using the term “planning environment” in the perspective of materials supply. Although this study does not cover detailed cost analysis (calculations with figures) and the analysis model’s resource elements are not expressed directly with different cost terms, the factors are related to costs. Gadde and Håkansson (1998) stress that besides the product itself there are also indirect costs, such as for tied-up capital, storing, administration, and material handling, which this study covers but in the form of resource discussions. Different cost models exist that could be combined with the analysis model. Both implementation and running costs are of interest. For instance, Grant et al. (2006) presents the total cost concept, focusing on how logistics activities drive total logistics costs. That model includes costs related to areas such as the order process, transport, inventory, and warehousing. Moreover, different models exist on a supply chain management level, which can be studied further in order to cover more aspects of the relationship between supplier and customer (see e.g. Christopher, 2005; Beamon, 1998). Furthermore, the analysis model can be added with areas such as issues about initial motives, implementation aspects, routines/documentations, and employee roles. It should also be of interest to include discussions about the term "respect for people", which is a vital part of the Toyota Production System philosophy (see for instance Emiliani, 2006). "Respect for people" could include humans in the planning environment and how they affect the materials supply. Moreover, the basis for the current analysis model is a customer/manufacturer’s perspective, giving potential for including a supplier perspective to a greater extent. In summary, the study shows that it is essential to include different factors in a framework in order to evaluate how effective replenishment methods are. The study contributes with an analysis model which also could be supportive for industry.
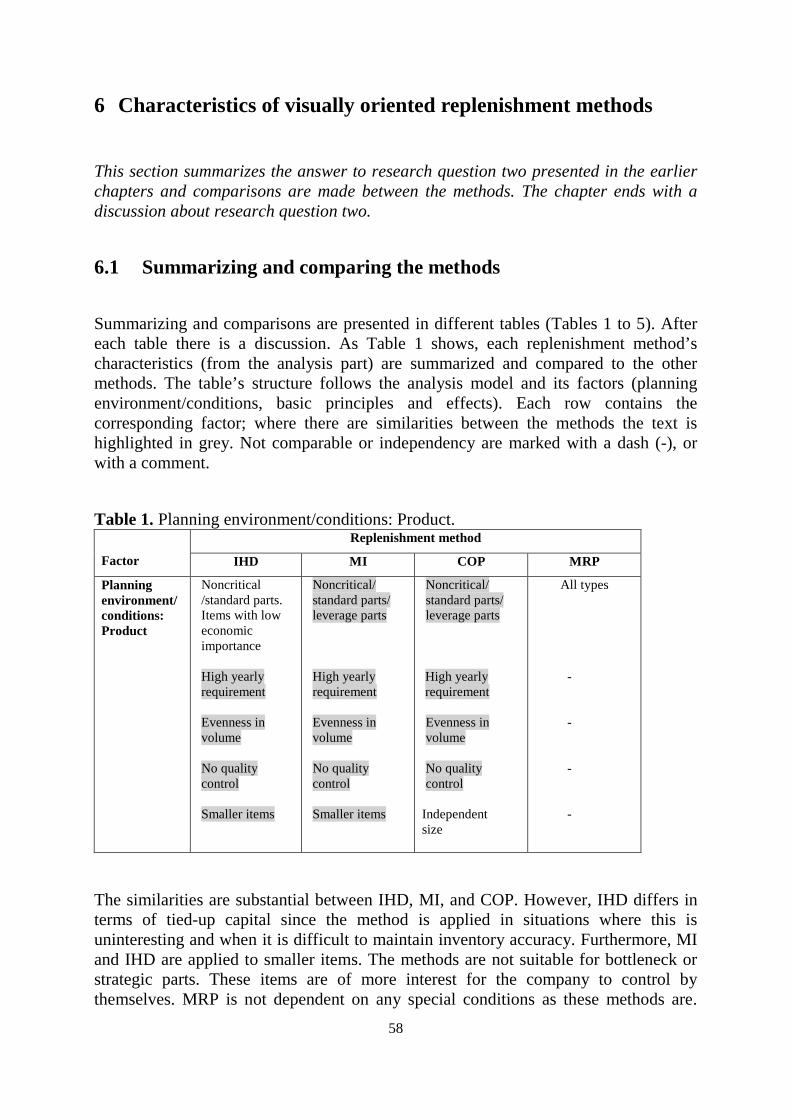
58
6 Characteristics of visually oriented replenishment methods
This section summarizes the answer to research question two presented in the earlier chapters and comparisons are made between the methods. The chapter ends with a discussion about research question two.
6.1 Summarizing and comparing the methods
Summarizing and comparisons are presented in different tables (Tables 1 to 5). After each table there is a discussion. As Table 1 shows, each replenishment method’s characteristics (from the analysis part) are summarized and compared to the other methods. The table’s structure follows the analysis model and its factors (planning environment/conditions, basic principles and effects). Each row contains the corresponding factor; where there are similarities between the methods the text is highlighted in grey. Not comparable or independency are marked with a dash (-), or with a comment. Table 1. Planning environment/conditions: Product.
Factor
Replenishment method
IHD MI COP MRP
Planning environment/ conditions: Product
Noncritical /standard parts. Items with low economic importance
High yearly requirement
Evenness in volume
No quality control Smaller items
Noncritical/ standard parts/ leverage parts
High yearly requirement
Evenness in volume
No quality control Smaller items
Noncritical/ standard parts/ leverage parts
High yearly requirement
Evenness in volume
No quality control
Independent size
All types
- - - -
The similarities are substantial between IHD, MI, and COP. However, IHD differs in terms of tied-up capital since the method is applied in situations where this is uninteresting and when it is difficult to maintain inventory accuracy. Furthermore, MI and IHD are applied to smaller items. The methods are not suitable for bottleneck or strategic parts. These items are of more interest for the company to control by themselves. MRP is not dependent on any special conditions as these methods are.

59
However, there are special situations where MRP is more suitable (e.g. low frequency of needs, project material, need to control separate orders). Table 2. Planning environment/conditions: Information, trust, and geographical proximity between supplier and customer.
Factor
Replenishment methods
IHD MI COP MRP
Planning environment/ conditions: Information, trust, and geographical proximity between supplier and customer
Customer regularly sends updated forecast plans to supplier Bin levels updated regularly by supplier Trust Geographical proximity Separate transport solution
Customer regularly sends updated forecast plans to supplier Store levels updated regularly by customer and transmitted to supplier Trust Geographical proximity Separate transport solution
Customer regularly sends updated forecast plans to supplier Bin levels updated regularly by customer and transmitted to supplier Trust Geographical proximity No separate transport solution
Customer regularly sends updated forecast plans and sharp orders to supplier
-
lesser
lesser -
IHD, MI, and COP mean close collaboration with the supplier, where regular information exchange, geographical proximity, and trust are important. IHD especially requires more in terms of trust because of the personal visits/access to the production area, the invoicing process, the responsibility for dimensioning the bin levels, and the fact that inventory on hand is not available to check in any system. IHD and MI also require a separate transport solution. Compared to the other methods there is a lower degree of integration between supplier and customer with MRP. Even if trust and geographical proximity are important in MRP, it is not as important as in the other methods. These methods mean a higher degree of supplier responsibility and need for understanding the concept and new ways of working. Using MRP could also mean an increased need for information exchange regarding changed plans and delivery problems. In MRP, transport solutions are not integrated with the principle itself as they are in IHD and MI. COP and MI rely on and are integrated with a 3PLP solution; IHD on a single-source supplier. But MRP is a traditional method, not dependent on a particular supplier solution. MRP has been in use for a long time and is well known, implying it could be suitable in situations where the supplier does not have the maturity for other methods or lacks the competence.

60
Table 3. Basic principles: Materials planning methods and the material flow.
Factor
Replenishment methods
IHD MI COP MRP
Basic principles: Materials planning methods and the material flow
Pull
No purchase orders
Run-out time planning
Periodic replenishment
Manual form of re-order point system, (with two-bin system)
Fixed quantity (mainly)
Supplier responsible for replenishment/ inspection on site
Deliveries directly to production area (no main storing/no quality control)
A separate supplier
No registration in systems (no IT support in the replenishment flow)
No inventory balance in ERP
Fixed store
Pull
No purchase orders
Run-out time planning
Periodic replenishment
Manual form of re-order point system
Varied quantity
Supplier responsible for replenishment/ inspection at supplier’s site
Deliveries directly to production area (no main storing; no quality control)
Concept with 3PLP
One registration in systems (ERP) (low level of IT-support in the replenish-ment flow)
Inventory balance in ERP
Movable store
Pull
No purchase orders
Run-out time planning
Call-off from production
“Pure” kanban method (traditional with two-bin system, electronic kanban)
Fixed quantity
Customer replenishes the store. Inspection by own material handling personnel
Deliveries directly to production area (no main storing/no quality control)
Concept with 3PLP
Registration in systems (IT support in the flow: Bar code, ERP, paternoster storage system, EDI)
Inventory balance in ERP
Fixed store
Push tendencies Purchase orders
- - -
Varied or fixed quantity Customer replenishes the store. Flow through quality control/main storing
- Registrations in system Inventory balance in ERP Fixed store
IHD, MI and COP are all demand driven, fulfilling the pull principle. Unlike MI and COP, it is interesting that IHD works without stock balance. In IHD there are no registrations made either, in MI only one. COP, on the other hand, is more dependent on registrations/transactions where more systems are in use. The supplier’s

61
involvement and responsibility differ among the methods. In IHD, the supplier has the responsibility for replenishment at the customer’s site, while in MI the supplier replenishes at his own site. COP, on the other hand, looks more like a traditional (with MRP) relationship between customer and supplier in that sense. COP is more dependent on IT than the other methods. MRP is very dependent on IT and data, and unlike the triggering process with IHD, MI and COP, purchase orders are initiated and created in the ERP system and administrated/controlled by the purchasing department. MRP is associated with push tendencies (unless the lead time allows for correspondence to the customer’s needs/fluctuations). MRP is not connected to any special type of “supplier-solution” as the other methods are. Some of the aspects may not be directly associated with MRP but can be regarded as consequences of using it. For instance, main storing could be a consequence, since MRP has difficulties matching real need, whichtherefore leads to higher stock levels, implying a need for main storage. Table 4. Basic principles: Visualizing.
Factor
Replenishment methods
IHD MI COP MRP
Basic principles: Visualizing
Inventory levels visually viewed Need for replenishment visually triggered Separately marked areas/delimited surfaces
Inventory levels visually viewed Need for replenishment visually triggered Separately marked areas/delimited surfaces. The cart is itself the stock and is movable, functioning as a pallet.
Inventory levels visually viewed to some extent Need for replenishment visually triggered in manual kanban case. Electronic kanban only visible when printed out. Empty packages used to quickly issue items. Special colors on kanban Separately marked areas/delimited surfaces (separate boxes/squares for kanbans and materials)
Inventory levels in system
-
-
IHD, MI and COP are all supported by different visual solutions. All methods mean triggering physically, but in different ways. IHD does not use an IT system for replenishment at all; instead, it relies on visual and manual activities for triggering and viewing stocks. In COP, with the manual kanban, stock levels are viewed by the bins. IHD relies entirely on the physical bins (empty boxes or a pallet flag), while MI also needs (except by looking) a separate list as a complement. Except for the electronic

62
kanbans, in all methods the basic data for triggering do not depend on figures in an IT system. The idea with the methods is also to gather the corresponding materials/items in the same place clearly. Unlike these methods, the MRP principle uses no visual signals for triggering replenishment or in other situations. In MRP figures in the system provide the basic data for triggering and creating orders. There are also a lot of transactions/registrations. Stock levels are only viewed via the system. In MRP items are not gathered in stock as is the case with the other methods.

63
Table 5. Effects: Logistics goals.
Factor
Replenishment methods
IHD MI COP MRP
Effects: Logistics goals
Allows for high fill rate, delivery reliability and delivery precision
High volume flexibility, yet within maximum levels
Low internal lead time/direct flow
Replenishment not dependent on figures in IT system, meaning e.g. reduced risk for material shortages
Capital tied up is of no interest
Simple pull flow, easy to understand/operate
Low level of administration/ resource utilization
Potential for reducing errors concerning inventory accuracy
Allows for high fill rate, delivery reliability and delivery precision
High volume flexibility, yet within maximum levels
Low internal lead time/direct flow
Replenishment not dependent on figures in IT system,meaning e.g. reduced risk for material shortages
Control of capital tied up, potential for low stock levels
Simple pull flow, easy to understand/operate
Low level of administration/ resource utilization
Potential for reducing errors concerning inventory accuracy
Allows for high fill rate, delivery reliability and delivery precision, short lead time, frequent deliveries
High volume flexibility, yet within maximum levels
Low internal lead time/direct flow
Replenishment dependent on figures in IT system to some extent
Control of capital tied up, potential for low stock levels
Simple pull flow, easy to understand/operate
Low level of administration/ resource utilization
Potential for reducing errors concerning inventory accuracy (to some extent)
Dependent on different factors*
Low volume flexibility
High internal lead time
Replenishment dependent on figures in IT system
Risk for a high level of tied-up capital. Difficult control levels
Complex flow
High level of administration/ resource utilization
Risk for errors concerning inventory accuracy
* Many factors make it difficult to express how MRP influences delivery service elements: the extent to which orders correspond to actual needs, lead time, safety stock, internal lead times, level of supplier integration, data accuracy (risks for inaccurate orders), and administration in an ERP system. Compared to the other methods, MRP could be expected to have lower delivery service due to how the other concepts’ are designed and are working. However, focusing on separate orders could mean advantages with MRP.

64
IHD, MI, and COP all have potential for achieving high delivery service. Of course, different factors influence this, e.g. the supplier and customer must follow an agreement, understand the concept, and work according to routines. In terms of volume flexibility, variation must be within the maximum limits of stock levels. In that matter, IHD and MI are more sensitive because of the fixed predetermined delivery occasions (periodic replenishment). On the other hand, predetermined deliveries make planning easier and late deliveries more obvious. Unlike the other methods, IHD works without registrations, which in itself is an advantage, but there could be difficulties measuring delivery performance. All methods imply control for tied-up capital and potential for low tied-up capital, but for IHD this is of no interest. The pull principle, the visual parts of the methods, the uncomplicated direct flow, few or no registrations all have the potential to reduce errors and contribute to an uncomplicated process that is easy to understand and operate. All these aspects enable low administration costs and additional savings. MI’s special advantage, its mobility, could be useful when there are frequent layout changes. All these aspects are in contrast with using MRP. However COP is more IT-dependent and more complicated than IHD and MI, implying there could be more mistakes here and need of resources. MRP needs a lot of data/parameters for fulfilling orders. Lack of data quality and changed plans mean manual handling in the ERP system, requiring resources. But replanning is not always done, meaning there could be other problems, such as the information in the ERP system not showing the right data. Unlike the MRP case the other studied methods are all very integrated with the supplier, which can enhance the flow. MI and COP are also used with a 3PLP, which allows for lower costs and short lead time.
6.2 Discussion
The literature indicates that there is a need to increase the knowledge of methods in industry and devote attention to the need for more case studies (see Dong and Xu, 2002; Småros, 2003; Jonsson and Mattsson, 2006; Jonsson and Mattsson, 2000), which is what motivated this study. Three of these case studies focus on visually oriented replenishment methods, while a fourth study about MRP was included to facilitate comparison, thereby to both identify the characteristics of the other methods and also develop a basis for the decision tool. MRP is regarded as one of the most used principles (see e.g. Guide and Srivastava, 2000), but MRP has problems with flexibility (Kumar and Meade, 2002) indicating a reason to explore alternatives. The descriptions and analysis of the replenishment methods contributes to knowledge of methods in practice. Not just the pure principles behind the methods are covered, but also the context. The analysis model’s three areas (planning environment/conditions, basic principles, and effects) provide a structure for the description and analysis. In particular, this study pays attention to knowledge of
65
visually oriented methods. In the literature review, no complete descriptions or analyses in context were found regarding visual replenishment methods for manufacturing industry applications. Although different kanban case studies can be found in the literature (see e.g. Jarupathirun et al., 2009), these were not in a complete context. But the literature does contain discussions of visualizing (see e.g. Petersson et al., 2008; Liker, 2009; Greif, 1992; Emiliani and Stec, 2005) more generally or with specific details. Tables 1-5 show that the different methods and how they work have a lot of similarities, such as the direct, uncomplicated pull flow to the point of use in the production area, the use of separate marked areas, and visual triggering. All of the methods use re-order point system/kanbans in different ways and are working with run-out time planning. There are also similarities in the conditions for applying them regarding products and suppliers, as well as the potential for fulfillment of various logistical goals. But there are also differences such as the use of ERP or other IT systems. One of the methods, IHD, does not use an IT system at all for the replenishment process. IHD works without stock balances in the system; the method is useful for situations where it is difficult to keep high inventory accuracy and where there is a need to avoid registrations. In contrast to IHD, COP uses ERP, EDI, bar coding, and special software for the production store. Of course, using an IT system means that data is handled, which may be a source for inaccuracies, as is the case with MRP. But of course, using IT support can be beneficial. For instance, using bar coding eliminates errors and is easy to operate (see Wild, 2004; Fleisch and Tellkamp, 2005). Moreover, EDI can provide benefits, e.g. regarding improved customer service (Lim and Palvia, 2001). So the use of visual methods does not rule out IT solutions (see Greif, 1992) and the case studies show that the degree of IT solutions may vary as well. In this study, the explored methods are used in the electronics industry, but they could be useful for other types of manufacturing companies with similar conditions, since the methods and the principles they are based on are not dependent on any special type of industry. The study also shows that it could be of interest for companies to apply different methods for different situations. In the application of these methods the specific equipment and systems described may vary in other situations. Silver (1981) stresses that more research efforts should address problems whose solution would be an advantage to practitioners, and companies have problems applying methods to their processes (Jonsson and Mattsson, 2006). Therefore this research can be of interest to industry, since it provides an analysis model covering a structure of several factors to consider for a successful application. The presented case studies could also be useful as they are, or as a basis for the further design of replenishment methods.
66
7 A tentative decision tool for selecting replenishment methods
This section answer RQ3, what a tentative decision tool for selecting replenishment methods might look like. Decisions in logistics and supply chain at various levels are critical, as they affect companies’ ability to compete. Various factors in the supply of materials are important to consider in decisions (Chopra and Meindl, 2013; Grant et al., 2006). A lack of policy can for example, lead to material shortages or overstock with cost implications, so the choice of policy is important (Dolguia and Prodhonb, 2007). And different situations/contexts can also mean that different methods should be used (Huataniemi and Pirttilä, 1999; Dolguia and Prodhonb, 2007; Lee, 2002). So having good basis for decisions and make the right decisions is important. According to Toivonen et al. (2006) and Silver (1981), a model for decision making is an important part of evaluating options. From research questions one and two, factors emerged that are important in the application of different replenishment methods. These factors could also be essential to consider when choosing a replenishment method (or in the design of a new method). Section 4.5 in this thesis also contains a few opinions from the interviews about decisions. Companies need to consider these factors in in order to get a suitable and effective materials supply. Figure 12 provides an overview of the designed decision tool (described in more detail later). The tool contains of four steps. The studied methods in this study are used as examples of replenishment methods in the tool (but other methods could be added). Costs are related to such elements as resource terms and tied-up capital. But different factors in the tool are also directly related to costs. The structure of the tool is inspired by various areas within the literature, including decision theory (Stevenson, 2005), QFD and quality housing (Bergman and Klefsjö, 2007), decision guide for automation (Tangen et al., 2008) and supply chain maturity assessment (Netland and Alfnes, 2007). Formulation of the decision tool was influenced by how Grant (2006) defines modeling as the process of developing a symbolic representation of a total system representing the "real world" and that the model must be managerially useful. Step 1 of the decision tool involves examining the planning environment and conditions related to the product, and choosing appropriate replenishment methods on that basis. The methods themselves must also be examined in relation to the planning environment/conditions and how they fit in. Step 2 is an assessment of the importance of different goals/motives for the company and its supply of materials, and of how the different replenishment methods are related to the goals/motives. Motives are important to consider and can vary. For instance, Jonsson and Mattsson (2006) stress that motive vary among companies about the choice of planning methods. In step 3, issues related to the supplier are evaluated. After each step different potential methods are available.
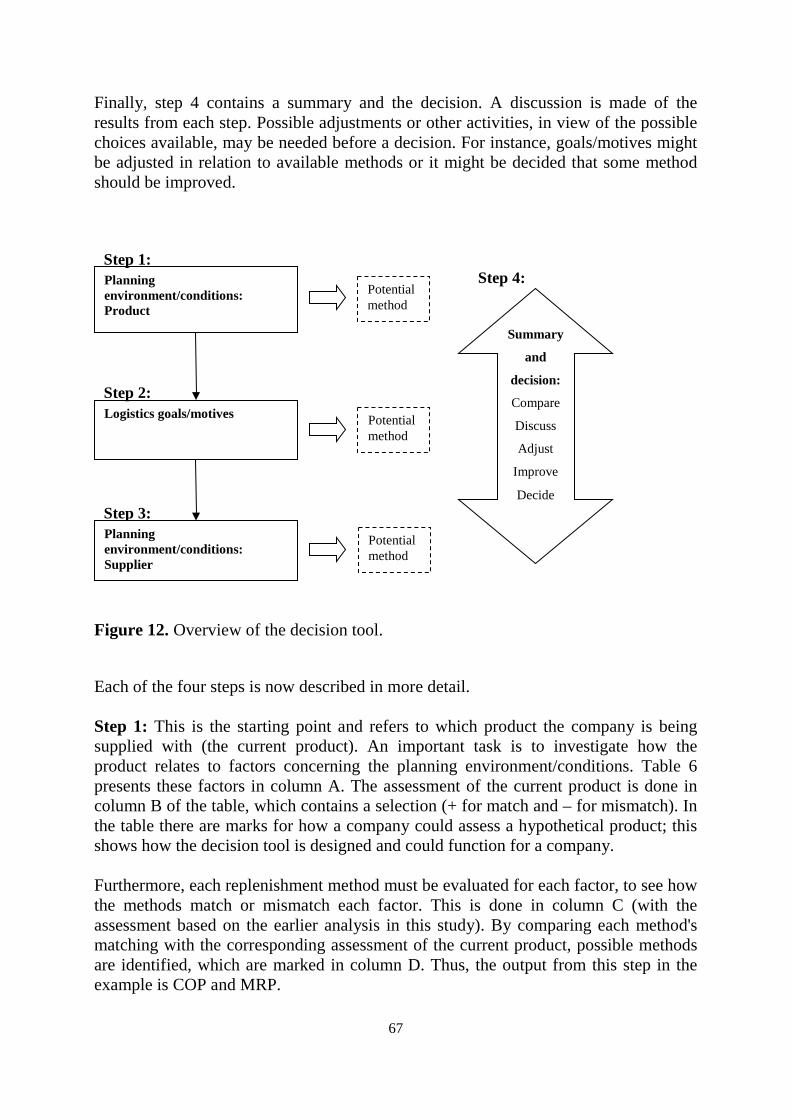
67
Finally, step 4 contains a summary and the decision. A discussion is made of the results from each step. Possible adjustments or other activities, in view of the possible choices available, may be needed before a decision. For instance, goals/motives might be adjusted in relation to available methods or it might be decided that some method should be improved.
Figure 12. Overview of the decision tool. Each of the four steps is now described in more detail. Step 1: This is the starting point and refers to which product the company is being supplied with (the current product). An important task is to investigate how the product relates to factors concerning the planning environment/conditions. Table 6 presents these factors in column A. The assessment of the current product is done in column B of the table, which contains a selection (+ for match and – for mismatch). In the table there are marks for how a company could assess a hypothetical product; this shows how the decision tool is designed and could function for a company. Furthermore, each replenishment method must be evaluated for each factor, to see how the methods match or mismatch each factor. This is done in column C (with the assessment based on the earlier analysis in this study). By comparing each method's matching with the corresponding assessment of the current product, possible methods are identified, which are marked in column D. Thus, the output from this step in the example is COP and MRP.
Planning environment/conditions: Product
Step 1:
Logistics goals/motives Step 2:
Step 3: Planning environment/conditions: Supplier
Potential method
Summary
and
decision:
Compare
Discuss
Adjust
Improve
Decide
Step 4:
Potential method
Potential method

68
When doing assessments, it is important that key staff members are involved and discuss the process together. In Table 6, the studied methods IHD, MI, COP and MRP are assessed. However, the purpose of the decision tool is to be general, so other methods can be added in column C of the table. Table 6, Step 1 A Planning environment B: Assess factors for D:
/conditions: Product the current product + match - mismatch + possible method
Factor + match - mismatch IHD MI COP MRP IHD MI COP MRPYearly volume low - - - - + - - - -
moderate - + + + + - - - -high + + + + + + + + +
Evenness volume low - - - - + - - - -moderate + + + + + + + + +high + + + + + + + + +
Items fit in the standard - + + + + - - - -Krajlics matrix leverage + - + + + - + + +
bottleneck - - - - + - - - -strategic - - - - + - - - -
Need for quality control - - - - + - - - -
Size of product small - + + + + - - - -moderate - - - + + - - - -big + - - + + - - + +
Frequent change of high - - - - + - - - -component moderate + + + + + + + + +(product life cycle) low + + + + + + + + +
Output: COP, MRP
C: Each method
Step 2: The company’s goals and motives for its material supply are considered here, since they influence the choice of method. Various methods can meet various goals/motives. The company needs to consider the importance of different factors and how the methods relate to them. In Table 7, column A, logistics goals/motives are marked. The goals/motives are divided into competitive goals/motives and design goals/motives. In column B, a sample score shows how a company could evaluate different goals/motives (just to demonstrate how the support tool works). In column C, each method is judged according to how it meets each goal/motive (here based on the earlier analysis of the studied methods). In column D, a weighted value is shown (B x C), thus showing how each method meets the corresponding factor. At the
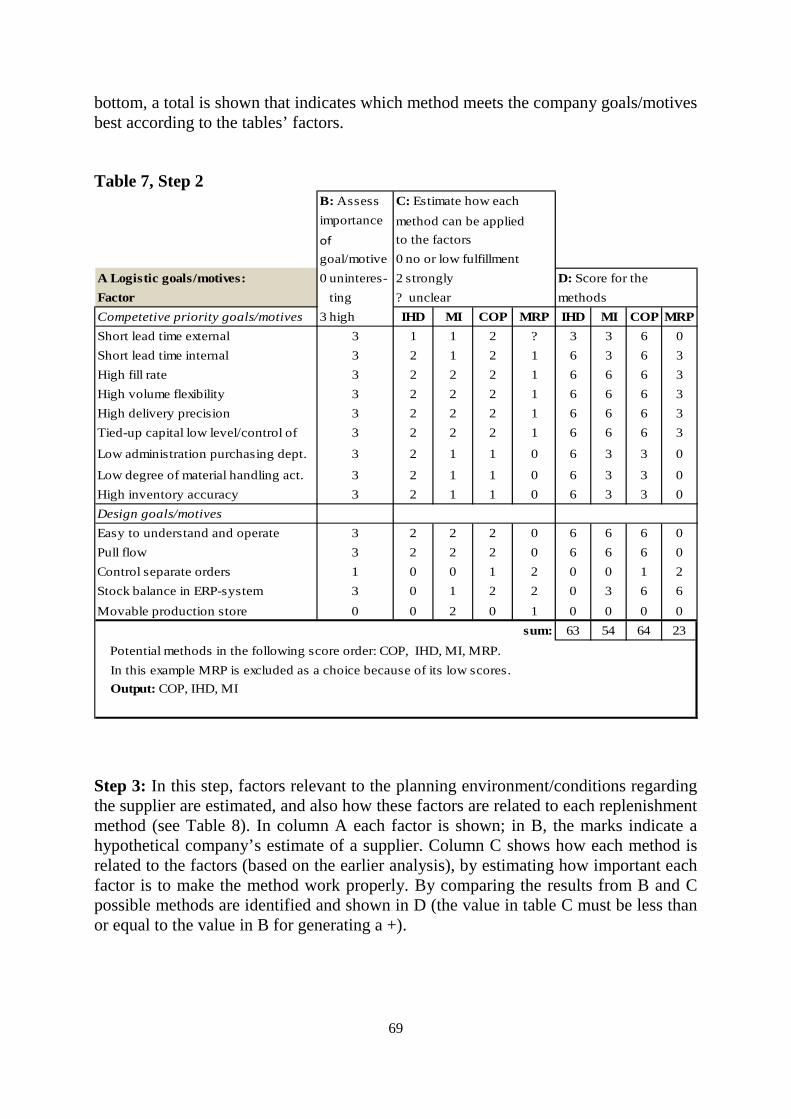
69
bottom, a total is shown that indicates which method meets the company goals/motives best according to the tables’ factors. Table 7, Step 2
B: Assess C: Estimate how eachimportance method can be appliedof to the factorsgoal/motive 0 no or low fulfillment
A Logistic goals/motives: 0 uninteres- 2 strongly D: Score for theFactor ting ? unclear methodsCompetetive priority goals/motives 3 high IHD MI COP MRP IHD MI COP MRPShort lead time external 3 1 1 2 ? 3 3 6 0Short lead time internal 3 2 1 2 1 6 3 6 3High fill rate 3 2 2 2 1 6 6 6 3High volume flexibility 3 2 2 2 1 6 6 6 3High delivery precision 3 2 2 2 1 6 6 6 3Tied-up capital low level/control of 3 2 2 2 1 6 6 6 3
Low administration purchasing dept. 3 2 1 1 0 6 3 3 0
Low degree of material handling act. 3 2 1 1 0 6 3 3 0High inventory accuracy 3 2 1 1 0 6 3 3 0Design goals/motivesEasy to understand and operate 3 2 2 2 0 6 6 6 0Pull flow 3 2 2 2 0 6 6 6 0Control separate orders 1 0 0 1 2 0 0 1 2Stock balance in ERP-system 3 0 1 2 2 0 3 6 6Movable production store 0 0 2 0 1 0 0 0 0
sum: 63 54 64 23 Potential methods in the following score order: COP, IHD, MI, MRP. In this example MRP is excluded as a choice because of its low scores. Output: COP, IHD, MI
Step 3: In this step, factors relevant to the planning environment/conditions regarding the supplier are estimated, and also how these factors are related to each replenishment method (see Table 8). In column A each factor is shown; in B, the marks indicate a hypothetical company’s estimate of a supplier. Column C shows how each method is related to the factors (based on the earlier analysis), by estimating how important each factor is to make the method work properly. By comparing the results from B and C possible methods are identified and shown in D (the value in table C must be less than or equal to the value in B for generating a +).

70
Table 8, Step 3 B: How can the factors C: Each method, relativebe fulfilled by the importance of the factors
A Planning environment/ actual/planned supplier 3 high degree D :conditions: 3 high degree 0 not at all + possible methodSupplier 0 not at all IHD MI COP MRP IHD MI COP MRPGeographical proximity 2 2 3 2 0 + - + +Long-term relationship 3 3 3 3 0 + + + +IT-maturity 2 0 1 2 1 + + + +Information exchange 3 2 2 3 2 + + + +Trust 2 3 3 2 1 - - + +Supplier integration 3 3 3 3 0 + + + +Knowledge maturity 2 3 3 2 1 - - + +Separate transport solution 2 3 3 1 0 - - + +High delivery service 3 3 3 3 3 + + + +
Output: MRP, COP
Step 4: Summary and discussion of the results from each step, followed by the decision. The example above shows that only COP is an output for all three steps, and is thus a possible choice. But steps 1-3 can yield more than one replenishment method. In a situation where several methods are possible, there is a need to make a choice. To select the appropriate method, it may be necessary to go back to individual factors, revise assessments and comparisons, etc., before the decision and the start of planning the implementation process. A discussion could concern adjusting goals/motives in relation to available methods, or improving a method to fit some goals/motives. Discussion of the decision tool Previous studies have stressed that materials supply plays an essential role in companies and different factors in materials supply are essential to consider in decisions (see Chopra and Meindl, 2013; Grant et al., 2006). The literature also indicates that different situations/contexts may mean different methods should be used (see e.g. Huataniemi and Pirttilä, 1999; Dolguia and Prodhon, 2007; Lee, 2002), a finding of this study as well. So having a good basis for decisions and making the right decisions is important. But no complete framework or tool for selecting replenishment methods similar to the developed tool in this study was found in the literature, motivating the development of this tool. The developed tool covers different important factors and contextual aspects to reflect on, in a structured, step-by-step process. Different replenishment methods can be assessed in the tool. The marked data in the example above was just to show how the tool works; the tool can be tested and developed further. Moreover, it is important to

71
note that this tool is not a mathematical algorithm with a fixed and automatic output; instead the intention is that it should enable support and discussion. Costs in the tool relate to such elements as resource terms and tied-up capital. Different factors in the tool are directly related to costs. However, the tool does not contain detailed cost analysis in numbers. Further studies could include implementing and running costs to complement the tool. Different cost models in logistics exist (see, for instance, Grant et al. (2006) and their cost model) whose content could be combined with this decision tool.

72
8 Conclusions, contributions, and further research
This chapter presents the major conclusions and contributions of this study, ending with proposals for future research.
8.1 Conclusions
The purpose of this study was to analyze the application of visually oriented replenishment methods in the manufacturing industry and further to design a tentative decision tool for selecting methods. Replenishment methods involve materials supply from suppliers to use in production, from a manufacturer’s point of view. The purpose is broken down into three different research questions, as follows. RQ1: What factors are important for evaluating how effective replenishment methods are? In order to evaluate how effective replenishment methods are, it is important to get to know each method by relating it to basic principles. Different basic principles involve:
• Materials planning methods (MRP, Re-order point, run-out time planning, order-based planning, and kanban).
• Pull/push. • Material handling (internal transport, internal flow, storage systems, storing,
packaging, and other activities related to the handling of material). • Delivery patterns (batch delivery to stock, direct delivery to production,
delivery through a logistics center, VMI, in-plant stores, direct delivery to customers).
• Visualizing (what parts of the flow are supported by visual solutions and how are they designed).
In relation to some of the above-mentioned factors, the use of ERP or another IT system could be of interest to include. Furthermore, essential conditions or other contextual circumstances for making the method work properly must be discussed concerning the products and issues related to the supplier. In this study, the term planning environment/conditions covers factors involving:
• Type of product according to the Kraljic matrix: noncritical, leverage, bottleneck, or strategic.
• Volume aspects (high/low, evenness). • Need for quality control. • The product’s size/shape.

73
• Information exchange. • Geographical proximity. • Trust of the supplier.
When analyzing the effects applying a replenishment method has on logistics goals, the following areas are essential to include:
• Delivery service elements (fill rate, lead time, delivery precision, delivery reliability, delivery flexibility)
• Capital tied up. • Use of resources and the flow (among other aspects, resources associated with
purchasing/administration and material handling). • Inventory accuracy. Inaccuracy could affect the whole company, from
stockroom operations to profit aspects.
All the mentioned factors are summarized in a developed analysis model (Figure 13). With the model, replenishment methods in manufacturing industry can be analyzed. The model was tested on four case studies and provides a tool including several different aspects/factors necessary to get a broad picture. A broad picture is important when analyzing a replenishment method, because only focusing on a single principle itself is not enough for evaluating how effective it is. The context or environment the method works in is important.
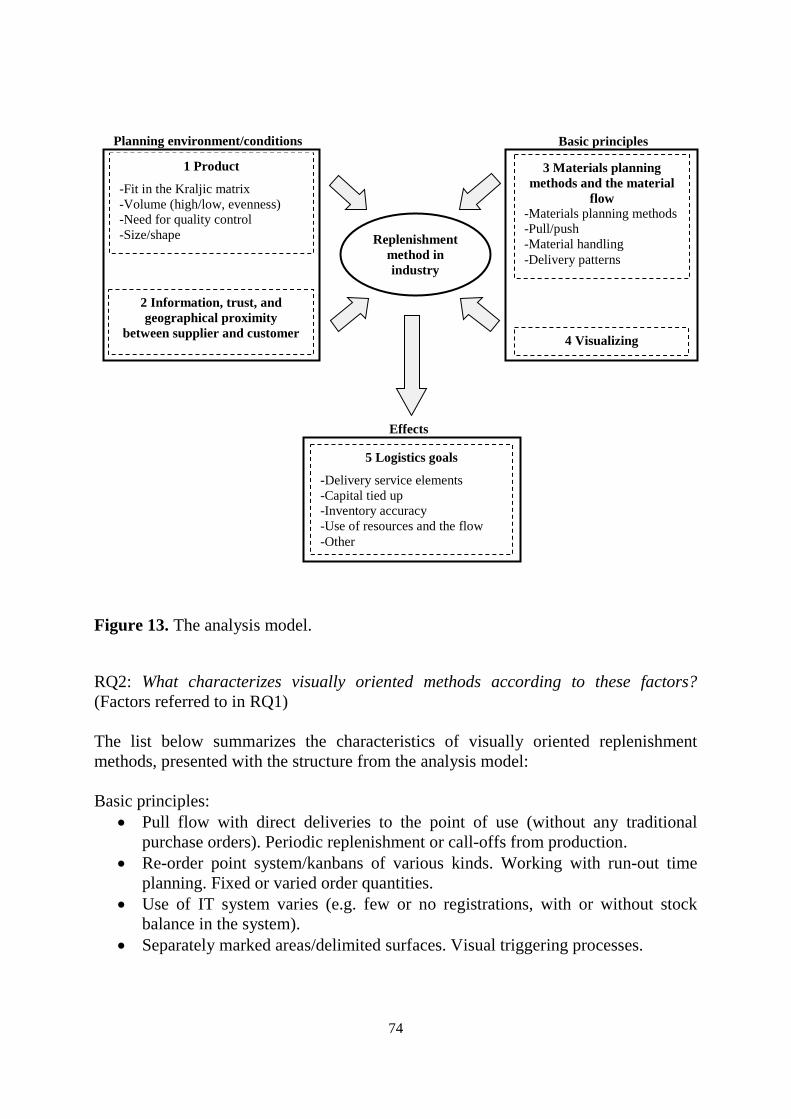
74
Figure 13. The analysis model. RQ2: What characterizes visually oriented methods according to these factors? (Factors referred to in RQ1) The list below summarizes the characteristics of visually oriented replenishment methods, presented with the structure from the analysis model: Basic principles:
• Pull flow with direct deliveries to the point of use (without any traditional purchase orders). Periodic replenishment or call-offs from production.
• Re-order point system/kanbans of various kinds. Working with run-out time planning. Fixed or varied order quantities.
• Use of IT system varies (e.g. few or no registrations, with or without stock balance in the system).
• Separately marked areas/delimited surfaces. Visual triggering processes.
Basic principles
Effects
Replenishment method in industry
1 Product
-Fit in the Kraljic matrix -Volume (high/low, evenness) -Need for quality control -Size/shape
5 Logistics goals
-Delivery service elements -Capital tied up -Inventory accuracy -Use of resources and the flow -Other
4 Visualizing
3 Materials planning methods and the material
flow -Materials planning methods -Pull/push -Material handling -Delivery patterns
2 Information, trust, and geographical proximity
between supplier and customer
Planning environment/conditions
75
Planning environment/conditions: • Substantially applicable for noncritical and leverage parts, with high volume,
fairly even consumption and no need for quality control. • High integration with supplier is needed, with trust, geographical proximity,
and high-quality information exchange. Supplier’s maturity/knowledge is important. Separate transport solutions may be necessary.
Effects: • Potential for high delivery service and for a low level of capital tied up (and
control of it) • Potential for a low need for administration and material handling, thus a
potential for savings in resources and money. • Potential for reducing errors in the store/warehouse and in the flow • Easy to understand and operate.
This study focused on the explored methods in the electronics industry, but the methods could be useful for other types of manufacturing companies with similar conditions, since the methods and the principles they are based on are not dependent on any special type of industry. RQ3: What might a tentative decision tool for selecting replenishment methods look like? From the study, factors emerged that are essential when selecting replenishment methods. These factors are organized in a step-by-step procedure (Figure 14), which describes the decision tool briefly. The output from each step is potential methods.

76
Figure 14. The decision tool. In step 1, the product is examined in relation to factors such as yearly volume, volume evenness, fit in the Kraljic matrix, need for quality control, size, and product life cycle. The methods themselves must also be examined in relation to those factors and how they match them. Step 2 involves an assessment of the importance of different goals/motives for the company and its supply of materials, and how the different replenishment methods are related to the goals/motives. Goals/motives can involve lead time, delivery service elements, tied-up capital, resource utilization, inventory accuracy, ease of understanding and operation, pull, controlling separate orders, stock balances in the ERP system, and movable production store. In step 3, different factors in relation to the supplier that are important when selecting a method are evaluated. Factors can be about geographical proximity, the long-term relationship, IT maturity, information exchange, trust, supplier integration, knowledge maturity, the need for separate transport solutions, and fulfillment of delivery service. How important those factors are for making the method work is also estimated. In step 4, a summary and discussion is made of the results from each step. Possible adjustments or other activities, in view of the possible choices available, may be needed before a decision. For instance, one might decide to adjust goals/motives in relation to available methods or to improve a method.
Planning environment/conditions: Product
Step 1:
Logistics goals/motives Step 2:
Step 3: Planning environment/conditions: Supplier
Potential method
Summary
and
decision:
Compare
Discuss
Adjust
Improve
Decide
Step 4:
Potential method
Potential method
77
8.2 Contributions
The thesis provides knowledge of visual replenishment methods, their characteristics, how they are applied in practice, and what the effects are of their use. Besides detailed descriptions and analysis, the study also focuses on the importance of the whole, how different factors together in an environment must be considered. It is not enough to only study pure principles for materials supply or schematic descriptions. Details and the whole must be taken into consideration simultaneously, an aim of this study. The presented case studies could be applied to companies or be a basis to develop alternative or similar solutions. The study also shows that it could be of interest for companies to apply different methods for different contexts. By applying the results in manufacturing, a company’s materials supply process could be made more efficient and the company more competitive. In order to describe and analyze different replenishment methods, the thesis provides an analysis model with several factors/aspects that are important to consider. The model gives a structure to follow and is easy to work with. Furthermore, the developed decision tool covers factors essential to reflect on when selecting a method, while the step-by-step procedure provides a structured way of working.
8.3 Suggestions for future research
Here are some suggestions for future research:
• Study more variants of visually oriented replenishment methods in industries other than the electronics industry, in order to extend the knowledge of more variants.
• Develop the analysis model. Expand it to include detailed cost analysis, “Respect for people” (a term from the Toyota Production System), roles and competences, routines and documentations, and a stronger supplier focus.
• Test the decision tool and develop it further with, for example, detailed cost
analysis.
• Deepen the knowledge about inventory accuracy and its connection to different replenishment methods.
• Implementation aspects.
78
References Aghazadeh, S-M. (2003), “How to choose an effective third party logistics provider”, Management Research News, Vol. 26, No. 7, pp. 50-58. Aldridge, D. and Betts, J. (1995), “Flexibility and responsiveness in relation to the use of MRPII”, Logistics Information Management, Vol. 8, No. 6, pp. 13-19. Arbnor, I. and Bjerke, B. (1994), Företagsekonomisk metodlära [Methodology for Creating Business Knowledge], Studentlitteratur, Denmark. Axsäter, S. (1995), Lagerstyrning, Studentlitteratur-Transportforskningen, Lund. Barros, A-C., Povoa A.P., Castro, A. (2008), Decision support framework for supply chain collaboration. POMS 19th Annual Conference, 9-12 May 2008, La Jolla, California, USA. Basu, R. and Wright, J.N. (2008), Total Supply Chain Management, Elsevier, Oxford, UK. Beamon, M.B. (1998), “Supply chain design and analysis: Models and methods”, International Journal of Production Economics, Vol. 55, pp. 281-294. Bell, J. (2006), Introduktion till forskningsmetodik [Introduction to Research Methodology], Studentlitteratur, Malmö. Bellgran, M. and Säfsten, K. (2005), Produktionsutveckling- Utveckling och drift av produktionssystem [Production Development: Development and Operation of Production Systems], Studentlitteratur, Lund. Bergman B. and Klevsjö, B. (2007), Kvalitet från behov till användning [Quality from Need to Use], Studentlitteratur, Poland. Bjornland, D., Persson G., Virum, H. (2003), Logistik för konkurrenskraft ett ledaransvar [Logistics for Competitiveness and Responsibility to Lead], Liber Ekonomi, Lund. Chopra, S. and Meindl, P. (2013), Supply Chain Management: Strategy, Planning and Operation, Pearson Education, UK. Choy, K.L. and Lee, W.B. (2002), “A generic tool for the selection and management of supplier relationships in an outsourced manufacturing environment: The application of case based reasoning”, Logistics Information Management, Vol. 15, No. 4, pp. 235-253.

79
Christopher, M. (2005), Logistics and Supply Chain Management: Creating Value-Adding Networks, Pearson Education, UK. Christopher, M. and Lee, H. (2004), “Mitigating supply chain risk through improved confidence”, International Journal of Physical Distribution & Logistics Management, Vol. 34, No. 5, pp. 388–396. Christopher, M. and Towill, D.R. (2000), “Supply chain migration from lean and functional to agile and customized”, Supply Chain Management: An International Journal, Vol. 5, No. 4, pp. 206-213. Crocker, B., Jessop, D., Morrison, A. (2012), Inbound Logistics Management, Storage and Supply of Materials for the Modern Supply Chain, Pearson, Essex, UK. Demeter, K. and Matyusz, Z. (2011), “The impact of lean practices on inventory turnover”, International Journal of Production Ecomomics, Vol. 133, No. 1, pp. 154-163. Dolguia, A. and Prodhonb, C. (2007), “Supply planning under uncertainties in MRP environments: A state of the art”, Annual Reviews in Control, Vol. 31, No. 2, pp. 269-279. Dong, Y. and Xu, K. (2002), “A supply chain model of vendor managed inventory”, Transportation Research Part E, Vol. 38, No. 2, pp. 75-95. Dreyer, C.H., Romsdal, A., Strandhagen, J.O. (2009), “Real-time, integrated supply chain operations: An example from distribution of pharmaceuticals”, Proceedings of POMS, May 1-4, Orlando, Florida, USA. Drickhamer, D. (2005), “The kanban e-revolution”, Material Handling Management, March, pp. 1-5 Dyer, W.G.J., Wilkins, A.L., Eisenhardt, K.M. (1991), “Better stories, not better constructs, to generate better theory: A rejoinder to Eisenhardt”, The Academy of Management Review, Vol. 16, No. 3, pp. 613-619. Eisenhardt, M.K. (1989), “Academy of Management”, The Academy of Management Review, Vol. 14, No. 4, pp. 532-550. Emiliani, M.L. (2006), “Origins of lean management in America: The role of Connecticut business”, Journal of Management History, Vol. 12, No. 2, pp. 167-184. Emiliani, M.L. and Stec, D.J. (2005), “Leaders lost in transformation”, Leadership & Organization Development Journal, Vol. 26, No. 5, pp. 370-387.
80
Eriksson L-T. and Finn-Wiedersheim, P. (2001), Att utreda forska och rapportera [Preparing to Research and Report], Liber, Karlshamn, Sweden. Eroglu, C. and Hofer, C. (2011), “Lean, leaner, too lean? The inventory-performance link revisited”, Journal of Operations Management, Vol. 29, No. 4, pp. 356-369. Fleisch, E. and Tellkamp, C. (2005), “Inventory inaccuracy and supply chain performance: A simulation study of a retail supply chain”, International Journal of Production Economics, Vol. 95, pp. 373-385. Gadde, L.E. and Håkansson, H. (1998), Professionellt inköp [Professional Purchasing], Studentlitteratur, Lund. Grant, D.B., Lambert M.D., Stock J.R., Ellram L.M. (2006), Fundamentals of Logistics Management, McGraw-Hill, Maidenhead, UK. Greif, M. (1992), Det visuella företaget [The Visual Firm], TQM Produktionsskolan AB, Eskilstuna, Sweden. Gu, J., Goetschalckx, M., McGinnis, L.F. (2006), “Research on warehouse operation: A comprehensive review”, European Journal of Operational Research, Vol. 177, No. 1, pp. 1-21. Guide, V.D.R. and Srivastava, R. (2000), “A review of techniques for buffering against uncertainty with MRP systems”, Production Planning and Control, Vol. 11, No. 3, pp. 223-233. Hines, P. (1996). “Purchasing for lean production: The new strategic agenda”, International Journal of Purchasing and Materials Management, January, pp. 2-10. Hines, P, Holweg, M., Rich, N. (2004), “Learning to evolve: A review of contemporary lean thinking”, International Journal of Operations & Production Management, Vol. 24, No. 10, pp. 994-1011. Holme I.M. and Solvang, B.K. (1996), Forskningsmetodik: Om kvalitativa och kvantitativa metoder [Research Methodology: On Qualitative and Quantitative Methods], Studentlitteratur, Malmö. Huataniemi, P. and Pirttilä, T. (1999), “The choice of replenishment policies in an MRP environment”, International Journal of Production Economics, Vol. 59, pp. 85-92. Institute for Transport Research. (2002), Materialhantering [Material Handling], Industrilitteratur, Stockholm.

81
Jarupathirun, S., Ciganek, A.P., Chotiwankaewmanee, T., Kerdipitak, C. (2009), “Supply chain efficiences through e-kanban: A case study”, International Conference on IT to Celebrate S. Charmonman’s 72nd Birthday, March 2009, Thailand. Johansson, E. and Johansson, M.I. (2006), “Materials supply systems design in product development projects”, International Journal of Operations & Production Management, Vol. 26, No. 4, pp. 371-393. Jonsson, P. (2007), “Exploring problems related to the materials planning user environment”, International Journal of Production Economics, Vol. 113, pp. 383-400. Jonsson, P. (2008), Logistics and Supply Chain Management, McGraw-Hill, Maidenhead, UK. Jonsson, P. and Mattsson, S-A. (2000), Planeringsmetoder i tillverkande företag [Planning Methods in Manufacturing Firms], PLAN, Föreningen för Produktionslogistik, KFS i Lund AB, Stockholm. Jonsson, P. and Mattsson, S.-A. (2002), “The selection and application of material planning methods”, Production Planning and Control, Vol. 13, No. 5, pp. 438–450. Jonsson, P. and Mattsson S-A. (2003), “The implications of fit between planning environments and manufacturing planning and control methods”, International Journal of Operations & Production Management, Vol. 23, No. 8, pp. 872-900. Jonsson, P. and Mattsson, S-A. (2005), Logistik- läran om effektiva materialflöden [Logistics: Theory of Effective Material Flow], Studentlitteratur, Lund. Jonsson, P. and Mattsson, S-A. (2006), “A longitudinal study of material planning applications in manufacturing companies”, International Journal of Operations & Production Management, Vol. 26, No. 9, pp. 971-995. Karlsson, C. and Norr, C. (1994), “Total effectiveness in a just-in-time system”, International Journal of Operations & Production Management, Vol. 14, No. 3, pp. 46–65. Koster R., Le-Duc, T., Roodbergen K.J. (2007), “Design and control of warehouse order picking: A literature review”, European Journal of Operational Research, Vol. 182, No. 2, pp. 481-501. Kouri, I.A., Salmimaa, T.J., Vilpola, I.H. (2008), “The Principles and Planning Process of an Electronic Kanban System”, Novel Algorithms and Techniques in Telecommunication, Automation and Industrial Electronics, Springer Science Business Media B.V., Berlin, pp. 99-104.

82
Kumar, S. and Meade, D. (2002), “Has MRP run its course? A review of contemporary developments in planning systems”, Industrial Management & Data Systems, Vol. 102, No. 8, pp. 453–462. Lamming, R. (1996), “Squaring lean supply with supply chain management”, International Journal of Operations & Production Management, Vol. 16, No. 2, pp. 183-196. Lee, L.H. (2002), “Aligning supply chain strategies with product uncertainties”, California Management Review Reprint Series, Vol. 44, No. 3, pp. 104-119. Lee L. and Whang, H.S. (2000), “Information sharing in a supply chain”, International Journal of Manufacturing Technology and Management, Vol. 1, No. 1, pp. 79-93. Liker, J. K. (2009), The Toyota way, Liber, Malmö. Lim, D. and Palvia, P.C. (2001), “EDI in strategic supply chain: Impact on customer service”, International Journal of Information Management, Vol. 21, No. 3, pp. 193-211. Lumsden, K. (2006), Logistikens Grunder [Fundamentals of Logistics], Studentlitteratur, Poland. Mattsson, S.-A. (1994), Materialplaneringsmetoder i svensk industri [Materials Planning Methods in Swedish Industry], Institutet för Transportekonomi & Logistik, Ekonomihögskolan, Växsjö, Sweden. Mattsson, S.-A. (2002), Logistik i försörjningskedjor [Logistics in Supply Chains], Studentlitteratur, Lund. Mattsson, S.-A. and Jonsson, P. (2003), Produktionslogistik, Studentlitteratur, Lund. Moody, P.E. (2006), “With supply management, technology rules!”, Supply Chain Management, May/June, pp. 41-48. Musalem, E.P. and Dekker, R. (2005), “Controlling inventories in a supply chain: A case study”, International Journal of Production Economies, Vol. 93-94, pp. 179-188. Myers M.B., Daugherty, J.P., Autry, C.W. (2000), “The effectiveness of automatic inventory replenishment in supply chain operations: Antecedents and outcomes”, Journal of Retailing, Vol. 76, No. 4, pp. 455-481. Naylor, J.B., Mohammed, M., Naim,N., Berry, D. (1999), “Leagility: Integrating the lean and agile manufacturing paradigms in the total supply chain”, International Journal of Production Economics, Vol. 62, pp. 107-118.
83
Netland, T. and Alfnes, E. (2007), “A practical tool for supply chain improvement — Experiencies with the supply chain maturity assessment test”, Proceedings of the 14th International EurOMA Conference Managing Operations in an Expanding Europe, 17-20 June 2007, Ankara, Turkey. Olhager, J. (2000), Produktionsekonomi [Production Economy], Studentlitteratur, Lund. Oskarsson, B., Aronsson, H., Ekdahl, B. (2003), Modern logistik för ökad lönsamhet [Modern Logistics for Increased Profitability]. Liber Ekonomi, Malmö. Patel, R. and Davidson, B. (2003), Forskningsmetodikens grunder: att planera, genomföra och rapportera en undersökning [Fundamentals of Research Methods: Planning, Executing, and Reporting an Investigation], Studentlitteratur, Lund. Persson, U. (1997), A conceptual and empirical examination of the management concept supply chain management, Licentiate thesis, Department of Business Administration and Social Sciences, University of Technology, Luleå, Sweden. Pettersen, J. (2009), “Defining lean production: some conceptual and practical issues”, The TQM Journal, Vol. 21, No. 2, pp. 127-142. Petersson, P., Johansson, O., Broman, M., Blücher, D., Alsterman, H. (2008), LEAN gör avvikelser till framgång [Lean — Turn Deviations into Success], Part Development AB, Kristianstad, Sweden. Pohlen, T.L. and Goldsby, T.J. (2003), “VMI and SMI programs: How economic value added can help sell the change”, International Journal of Physical Distribution & Logistics Management, Vol. 33, No. 7, pp. 565–581. Remenyi D., Williams B., Money, A., Swartz, E. (2003), Doing Research in Business and Management, SAGE Publications, London. Silver, E. (1981), “Operations research in inventory management: A review and critique”, Operations Research, Vol. 29, No. 4, pp. 628-645. Silverman, D. (2006), Interpreting Qualitative Data, SAGE Publications, London. Småros J., Lehtonen J-M., Appelqvist, P., Holmström, J. (2003), “The impact of increasing demand visibility on production and inventory control efficiency”, International Journal of Physical Distribution & Logistics Management, Vol. 33, No. 4, pp. 336-354.
84
Stevenson, W.J. (2005), Operations Management. McGraw-Hill, Irwin, New York. Stratton, R. and Warburton, R.D.H. (2003), “The strategic integration of agile and lean supply”, International Journal of Production Economics, Vol. 85, pp. 183-198. Sykes, D. (1994), “Planning for excellence in materials handling”, Logistics Information Management, Vol. 7, No. 6, pp. 10-12. Tachizawa, E.M. and Thomsen, C.G. (2007), “Drivers and sources of supply flexibility: An exploratory study”, International Journal of Operations & Production Management, Vol. 27, No. 10, pp. 1115-1136. Tangen, S., Axelsson, J., Dencker, K., Gröndahl, P. (2008), Strategi och produktionsutveckling. Handbok för utformning av produktionsstrategi och det framtida produktionssystemet [Strategy and Production Development: Handbook for the Creation of Production Strategy and the Future Production System], Woxen Centrum, Dept. of Industrial Production, Royal Institute of Technology, Stockholm. Thurén, T. (2007), Vetenskapsteori för nybörjare [Scientific Theory for Beginners], Liber, Malmö. Toivonen, J.A., Kleemola, H., Vanharanta, A., Visa, A. (2006), “Improving logistical decision making – Applications for analyzing qualitative and quantitative information”, Journal of Purchasing & Supply Management, Vol. 12, pp. 123-134. Vigtil, A. (2007), “Information exchange in vendor managed inventory”, International Journal of Physical Distribution & Logistics Management, Vol. 37, No. 2, pp. 131-147. Wan, H. and Chen F. (2008), “A web-based kanban system for job dispatching, tracking and performance monitoring”, International Journal of Advanced Manufacturing Technology, Vol. 38, pp. 995-1005. Wild, T. (2004), Improving Inventory Record Accuracy, Elsevier Butterworth-Heinemann, Oxford, UK. Womack, J.P. and Jones, D.T. (1996), Lean Thinking: Banish Waste and Create Wealth in your Corporation, Simon and Shuster, New York. Wänström, C. and Jonsson, P. (2006), “The impact of engineering changes on materials planning”, Journal of Manufacturing Technology Management, Vol. 17, No. 5, pp. 561-584. Yin, R.K. (2009), Case Study Research Design and Method, 4th edition, SAGE Publications, Thousand Oaks, California, USA.

85
Appendix 1: Guide for the interviews
Date:
Name: Position:
Questions:
• What replenishment methods are applied here?
• What is the background/motive for applying/developing (new) alternatives to MRP?
• What are the proportions of the methods in use?
• Why use different replenishment methods for different materials/situations?
• What factors are of importance when selecting methods?
• Have different methods been evaluated? If so, what are the results of that?
• What competences are necessary for applying different methods (internally/externally)?
• What are the relationships between production (on an operational level) and different replenishment methods?

86
Appendix 1, continued Questions around key words for the examined replenishment method Functioning/description: Principle? The flow? Characteristics? Technology to realize Procurement: Administration? Logistics goals (resources, lead times, delivery precision, flexibility, other delivery service elements)? System support? Order process? Dimensioning? Forecasts? Information? Measurements? Agreements/contracts? Supplier: Conditions/prerequisites? Relations? Trust? Integration? Maturity? Engagement? Supplier development? Lead times? Location? Transport? IT maturity? System support? Information? Single/multiple sourcing? Culture? Long-term issues? Material handling and the flow: Resources? The flow? Roles? Equipment? System support? Layout? How to make orders? Packaging? Placing into storage/issuing? Handling inventory balance? Inventory accuracy? Lead times, etc.? Quality control? Visuality? Information? Application area: Type of production? Requirement patterns (volume, high/low/evenness)? Prototypes? Product life cycle? Variants? Unique/standard etc.? Size of product? Issues about supplier dependency? Advantages/strengths: Disadvantages/weaknesses: