voicelive: a phoneme localization based liveness …ww2.cs.fsu.edu/~tan/paper/ccs2016.pdfvoicelive:...
TRANSCRIPT
VoiceLive: A Phoneme Localization based LivenessDetection for Voice Authentication on Smartphones
Linghan Zhang†, Sheng Tan†, Jie Yang†, Yingying Chen∗†Florida State University, Tallahassee, FL 32306, USA
∗Stevens Institute of Technology, Hoboken, NJ 07030, USA†{lzhang, tan, jie.yang}@cs.fsu.edu, ∗[email protected]
ABSTRACTVoice authentication is drawing increasing attention and
becomes an attractive alternative to passwords for mobileauthentication. Recent advances in mobile technology fur-ther accelerate the adoption of voice biometrics in an arrayof diverse mobile applications. However, recent studies showthat voice authentication is vulnerable to replay attacks,where an adversary can spoof a voice authentication systemusing a pre-recorded voice sample collected from the vic-tim. In this paper, we propose VoiceLive, a practical livenessdetection system for voice authentication on smartphones.VoiceLive detects a live user by leveraging the user’s uniquevocal system and the stereo recording of smartphones. Inparticular, with the phone closely placed to a user’s mouth,it captures time-difference-of-arrival (TDoA) changes in asequence of phoneme sounds to the two microphones of thephone, and uses such unique TDoA dynamic which doesn’texist under replay attacks for liveness detection. VoiceLiveis practical as it doesn’t require additional hardware buttwo-channel stereo recording that is supported by virtuallyall smartphones. Our experimental evaluation with 12 par-ticipants and different types of phones shows that VoiceLiveachieves over 99% detection accuracy at around 1% EqualError Rate (EER). Results also show that VoiceLive is ro-bust to different phone placements and is compatible to dif-ferent sampling rates and phone models.
KeywordsVoice recognition; Liveness detection; Phoneme localization
1. INTRODUCTIONAs a primary way of communication, our voice is a partic-
ularly attractive biometric for identifying users. It reflectsindividual differences in both behavioral and physiologicalcharacteristics, such as the inflection and the shape of thevocal tract [23]. Such distinctive behavioral and physiologi-cal traits could be captured by voice authentication systemsfor differentiating each individual [17]. Voice authentication
Permission to make digital or hard copies of all or part of this work for personal orclassroom use is granted without fee provided that copies are not made or distributedfor profit or commercial advantage and that copies bear this notice and the full cita-tion on the first page. Copyrights for components of this work owned by others thanACM must be honored. Abstracting with credit is permitted. To copy otherwise, or re-publish, to post on servers or to redistribute to lists, requires prior specific permissionand/or a fee. Request permissions from [email protected].
CCS’16, October 24-28, 2016, Vienna, Austria© 2016 ACM. ISBN 978-1-4503-4139-4/16/10. . . $15.00
DOI: http://dx.doi.org/10.1145/2976749.2978296
leveraging built-in microphones on mobile devices is partic-ularly convenient and low-cost, comparing to the passwordsauthentication that is difficult to use while on-the-go andrequires memorization. Recent advances in mobile technol-ogy further accelerate the adoption of voice biometrics in anarray of diverse mobile applications.
Indeed, voice authentication has been introduced recentlyto mobile devices and apps to provide secure access and lo-gins. For example, Google has integrated it into Androidoperating systems (OSs) to allow users to unlock mobile de-vices [2], and Tencent has updated its WeChat mobile appto support voice biometric logins [8]. Another appealinguse case of voice authentication is to support mobile finan-cial services. For instance, SayPay provides voice biometricsolution for online payment, e-commerce, and online bank-ing [5]. And an increasing number of financial institutions,HSBC, Citi, and Barclays for example, are deploying voiceauthentication for their telephone and online banking sys-tems [3]. This trend is expected to continue growing at arate of 22.15 percent yearly until 2019, and will result in anestimated $113.2 billion market share by 2017 [4]. Voice au-thentication thus becomes an attractive alternative to pass-words in mobile authentication and is increasingly popular.
Voice authentication however has been shown to be vul-nerable to replay attacks in recent studies [16, 33, 14]. Anadversary can spoof a voice authentication system by us-ing a pre-recorded voice sample collected from the victim.The voice sample can be any recording captured inconspic-uously. Or, an adversary can obtain voice samples from thevictim’s publicly exposed speeches. The attacker could evenconcatenate voice samples from a number of segments inorder to match the victim’s passphrase. Such attacks aremost accessible to the adversary due to the proliferation ofmobile devices, such as smartphones and digital recorders.They are also highly effective in spoofing authentication sys-tems, as evidenced by recently work [32, 33]. Replay attackstherefore present significant threats to voice authenticationand are drawing increasing attention. For example, Googleadvises users on the vulnerability of their voice logins bydisplaying a popup message “... a recording of your voicecould unlock your device.” [1]
Prior work in defending against replay attacks is to uti-lize liveness detection to distinguish between a passphrasespoken by a live user and a replayed one pre-recorded bythe adversary. For example, Shang et al. propose to com-pare an input voice sample with stored instances of pastaccesses to detect the voice samples have been seen beforeby the authentication system [31]. This method, however,
1080

cannot work if the attacker records the voice samples duringa non-authentication time point. Villalba et al. and Wang etal. suggest that the additional channel noises introduced bythe recording and loudspeaker can be used for attack detec-tion [32, 33]. These approaches however have limited effec-tiveness in practice. For example, the false acceptance ratesof these approaches are as high as 17%. Chetty and Wag-ner propose to use video camera to extract lip movementsfor liveness verification [13], whereas Poss et al. combinethe techniques of a neural tree network and Hidden MarkovModels to improve authentication accuracy [28]. Aley-Razet al. develop a liveness detection system based on “Intra -session voice variation” [10], which is integrated into NuanceVocalPassword [6]. In addition to a user-chosen passphrase,it requires a user to repeat one or more random sentencesprompted by the system for liveness detection.
In this paper, we introduce and evaluate a phoneme soundlocalization based liveness detection system on smartphones.Our system distinguishes a passphrase spoken by a live userfrom a replayed one by leveraging (i) the human speech pro-duction system and (ii) advanced smartphone audio hard-ware. First, in human speech production, a phoneme is thesmallest distinctive unit sound of a language. Each phonemesound can be viewed as air waves produced by the lungs, andthen modulated by the movements of vocal cords and vocaltract including throat, mouth, nose, tongue, teeth, and lips.Each phoneme sound thus experiences unique combinationof place and manner of articulation. Consequently, differ-ent phoneme sounds could be located at different physicalpositions in the human vocal tract system with an acous-tic localization method. Second, smartphone hardware isnow supporting advanced audio capabilities. Virtually allsmartphones are equipped with two microphones for stereorecording (one on the top and the other one at the bottom),and are capable of recording at standard 48kHz and 192kHzsampling rates. For example, with the latest Android OSs,Samsung Galaxy S5 and Note3 are capable of stereo record-ing at 192kHz, which yields 5.21 microseconds’ time reso-lution or millimeter-level ranging resolution1. We thus canleverage such stereo recording or dual microphones on smart-phones to pinpoint the sound origin of each phoneme withinhuman vocal system for liveness detection.
Ideally, locating a phoneme sound requires at least threemicrophones with three individual audio channels. Althoughcurrent two-channel stereo recording cannot uniquely lo-cate the phoneme sound origin, it can capture the time-difference-of-arrival (TDoA) of each phoneme sound to thetwo microphones of the phone. With the phone closelyplaced to user’s mouth, the differences in TDoA betweenmost phoneme sounds are distinctive and measurable withmillimeter-level ranging resolution. Very importantly, eachpassphrase (usually 5 to 7 words [7, 30]) consists of a se-quence of different phoneme sounds that will produce a se-ries of TDoA measurements with various values. We referto the changes in TDoA values as TDoA dynamic, whichis determined by the specific passphrase, the placement ofthe phone, and a user’s unique vocal system. Such TDoAdynamic, which doesn’t exist under replay attacks, is thenutilized for liveness detection.
In particular, when a user first enrolled in the system,the TDoA dynamic of the user-chosen or system prompted
1Assuming the speed of sound is 340m/s, each digital samplerepresents a distance of 1.77mm.
passphrase is first captured by the smartphone stereo record-ing, and then stored in the system. During online authen-tication phase, the extracted TDoA dynamic of an inpututterance will be compared to the one stored in the sys-tem. A live user is detected, if that produce a similarityscore higher than a pre-defined threshold. By relaxing theproblem from locating each phoneme sound to measuringthe TDoA dynamic for a sequence of phonemes, we enableliveness detection on a single phone without any additionalhardware. Our system does have the limitation of requiringa user to hold the phone close to her/his mouth with thesame pose in both enrollment and authentication processes.The contributions of our work are summarized as follows:
• We show that the origin of each phoneme can be uniquelylocated within the human vocal tract system by us-ing a microphone array. It lays the foundation of ourphoneme localization based liveness detection system.
• We develop VoiceLive, a practical liveness detectionsystem that extracts the TDoA dynamic of the passphrasefor live user detection. VoiceLive takes advantages ofthe user’s unique vocal system and high quality stereorecording of smartphones.
• We conduct extensive experiments with 12 participantsand three different types of phones under various ex-perimental settings. Experimental results show thatVoiceLive achieves over 99% detection accuracy at around1% EER. Results also show that VoiceLive is robust todifferent phone placements and is compatible to differ-ent sampling rates and phone models.
The remainder of this paper expands on above contribu-tions. We begin with system and attack model, and a briefintroduction to phoneme sounds localization.
2. PRELIMINARIES
2.1 System and Attack ModelThere exists two types of voice authentication systems:
text-dependent and text-independent. We primarily focuson the text-dependent system as it is currently the mostcommercially viable method and produces better authen-tication accuracy with shorter utterances [31]. In a text-dependent system, the text to be spoken by a user is thesame one for enrollment and verification. Such text couldbe either a user-chosen or system prompted one. Figure 1shows the processes of a typical voice authentication sys-tem. Our method can also be extended to text-independentsystems, which will be discussed in Section 5.
For the attack model, we consider replay attacks, whichare the most accessible and effective attacks aiming at spoof-ing the system by replaying a pre-recorded voice sample ofthe victim [32]. We consider the replay attacks that takeplace at two locations, at the microphone point and at thetransmission point, as shown in Figure 1. For the sake ofsimplicity, we refer to the former as a playback attack andthe latter as a replace attack. In a playback attack, an adver-sary uses a speaker to replay the pre-recorded voice samplein front of the microphones. In a replace attack, an ad-versary replaces his/her own speech signal as the victim’sbefore or during transmission. This can be done by lever-aging the availability of the virtual recorder to bypass thelocal microphones, or by intercepting and replacing speechsignal during transmission.
1081

�������� �� ������ �����������������
���������������� �� ��� �� ���
�� ���������������� �� �� ���
���������� �������
�!������ ����
Figure 1: A typical voice authentication system withtwo possible places of replay attacks.
�����
����� ���
����������
(a) Example
���
���
��
���
����
���� ����
���� ����
���� ����
���������
���
�����
�����
������
����
�����
(b) Vowel chart
Figure 2: Tongue positions of English vowels withinthe oral cavity, and the vowel chart.
2.2 Human Speech Production and PhonemesThe human speech production system involves three vi-
tal physiological components: lungs, vocal cords, and vocaltract [27]. When someone exhales, air is expelled from thelungs, and then passes over the vocal cords, which dilate orconstrict to allow or impede the air flow to produce unvoicedor voiced sound. Such sound is then resonated and reshapedby the vocal tract that consists of multiple organs such asthroat, mouth, nose, tongue, teeth, and lips. The vocal cordsmodulation, interaction and movement of these organs canalter sound waves and produce unique human sounds.
A phoneme is the smallest distinctive unit sound of a lan-guage [27]. The two major phoneme categories are vow-els and consonants. In particular, vowels are the phonemesounds produced when vocal cords constrict air flow (i.e.,voiced sound) but with an open vocal tract. The tongueposition is the most important physical feature that distin-guishes one vowel from another [27]. As different tongue po-sitions lead to different multipath environments inside theoral cavity, we can locate the sound origins of different vow-els at different physical locations inside the human oral cav-ity. As illustrated in Figure 2 (a), when the tongue movesto lower right corner, vowel [A] can be pronounced, whereaswhen the tongue moves to upper left corner and backward,vowels [i] and [o] can be produced, respectively. More gen-erally, Figure 2 (b) shows the vowel chart which involvestwo dimensions of tongue movements: up/down movements(i.e., height) and back/forth movements (i.e., backness). Ex-tending or retracting the tongue forward or backward to-wards the teeth produces a more front or back vowel sound,whereas lowering or raising the tongue towards lower jaw ortowards the roof of mouth produces a more open or closevowel.
Unlike vowels, consonants are produced when vocal cordseither constrict or dilate air flow and with significant con-striction of the air flow in the oral cavity. The articulationplace and manner are two major factors that distinguish one
���������
����������
�����
���������������
����� �� �� �
�� �� � �� !� ��
"� ��
#� $�
%� &� '� (� )�
*� � +� ��
Figure 3: Place of articulation and correspondingconsonants.
�� ���� � ���������� � ����� � � ��� ��� �� ��� � �� ������� � �� �� +������� �������� �������� �������� ����� ��
!��"������ ������� #���#��� ����$���%%��"���� �����&��
�����'�(���� ��������� � ���
� �"��)������
Figure 4: Consonants chart based on place and man-ner of articulation.
consonant from another [27]. The combined effect of placeand manner of articulation and voiced/unvoiced sound leadto different consonant sounds emitted from different loca-tions within the human vocal tract system. In particular,place of articulation is the location where the constrictionsor obstructions of air stream occur, and can be categorizedinto 6 groups: bilabial, labiodental, dental, alveolar, palatal,and velar. Figure 3 shows each group and the correspondingconsonants. For example, the consonants [p][b][m][w] can bepronounced when the obstruction of air stream occurs at up-per and lower lips. The consonants within each group can befurther distinguished by the manner of articulation, whichdescribes the configuration and interaction of the speech or-gans (e.g., the tongue, lips, and palate). There are 6 typesof articulation manners including nasal, stop, fricative, af-fricate, approximate and lateral. For instance, nasal con-sonant [m] is produced when the air stream is completelyblocked by mouth and only passes through the nose. Fig-ure 4 summarizes the categorization of different consonantsbased on place of articulation and manner of articulation.The bolded font in the figure shows the voiced sounds (e.g.,[b] and [v]), whereas the rest are unvoiced sounds (e.g., [p]and [f ]).
2.3 Phoneme Localization using MicrophoneArray
We next conduct experiments to study how the origin ofphoneme sound is located within the human vocal tract sys-tem by leveraging a microphone array. We utilize six ex-ternal microphones organized in three pairs A, B, and C.As shown in Figure 5 (a), the microphones are distributedin the X-Z plane2 with 5cm and 10cm horizontal distances,and 5cm and 7.6cm vertical distances. Such a distributioncould cover the size of a human vocal tract. Each pair issynchronized to measure the TDoA of the sound origin tothe two microphones. These pairs produce three indepen-dent TDoA values, which could uniquely locate the soundorigin in a 3D space. We measure the TDoA in terms of the
2Note that the sectional view of the human vocal tract inFigure 5 (b) is on the Y-Z plane.
1082

��������
��*������
�+����*�� ����
��,��
�����-�� ���
�.��
�������
�/���0����1�2����
�3��
�$�������*��
�(���
45"(�
678"(�
9"(�
9"(�
)�4�
9"(�
:�
;�<� :�
<�;�
)�=
)>4�
)>=� )�=�
)�4�
������������� ���������� ��������� �������������������
����
Figure 5: Phonemes localization using microphonearray.
number of delayed samples to the two microphones. As weuse 192kHz for recording, the TDoA ranging resolution is1.77mm. Before the phoneme localization, we test the local-ization accuracy by emitting chirp sounds at different fixedlocations in front of the microphones. We observe that itproduces an averaged localization error within 2mm.
We recruit two participants to pronounce each phonemesound in front of the microphone array multiple trials. Fig-ure 5 (b) illustrates the localized phoneme sound origins forone participant. It shows the sectional view of human vocaltract on Y-Z plane. The red dots show the localized vowelsound origins, whereas the green dots show these of conso-nant ones. We obtain several important observations fromFigure 5. First, the located sound origins of vowels matchthe tongue positions very well. For example, the vowels con-nected by the dotted lines in Figure 5 (b) have similar rel-ative positions and overall shape as that of the vowel chartin Figure 2 (b). This is because the tongue position is thedeterministic factor of vowel production. Second, some ofthe consonants have the origins close to the place of articu-lation, while others are significantly affected by the mannerof articulation. For instance, [s],[z] and [t] have the local-ized sound origins close to alveolar, which is the place ofarticulation of these sounds, whereas [m] is located in thenasal cavity where the airflows out (i.e., manner of articu-lation). Moreover, we observe the located phoneme originsare mainly distributed within the mouth and nasal cavitieswith the size of about 4cm by 4cm, and they show littlechanges in X axis (i.e., lateral direction of mouth). We alsofind that different participants produce different localizedsound origins for the same phoneme due to the individualdiversity in the human vocal tract (e.g., shape and size) andthe habitual way of pronouncing phonemes.
3. SYSTEM DESIGNIn this section, we introduce our system design and its
core components and algorithms.
3.1 Approach OverviewThe key idea underlying our liveness detection system is
to perform TDoA ranging for a sequence of phoneme soundsat the two microphones on the phone. As illustrated inFigure 6, a user first speaks an utterance, say “voice” tothe phone that closely placed to the user’s mouth. Eachphoneme sound (i.e., [v] [A] [I] [s] in the example) is thenemitted from the user’s vocal system and picked up by the
)�"4�)�"=�
�����
�������� �*���
?�������
?����@���
?������� ?�������
�����
����� ��� �*��� �����
47�A��������B�����.������"�C��7 7C�D���"�E�������/��F��F���(��G�������@����7�
�
H7��F��������.�F����"�������I���(����."���?������%���"F��F���(������F���/��(�"���F����7�
=7�J�"F��F���(����.�������� ����������F���/��(�"� �%��F���F���7�
K7�J'���"��� �?�����I��(�"��%��F���(���������%��� ������������"����7�
Figure 6: Illustration of phoneme localization usinga single phone.
two microphones of the phone with stereo recording. Thephone processes the recorded sound to deduce the TDoAof each phoneme sound to the two microphones. As mostphoneme sounds have measurable TDoA differences to thetwo microphones, a sequence of phonemes will produce seriesof TDoA with various values, as shown in Figure 6. We referto the changes in TDoA measurements as “TDoA dynamic”,which is then used for liveness detection.
In particular, the measured TDoA dynamic will be com-pared with the one extracted when the user enrolled in thesystem. A live user is detected if the similarity score exceedsthe pre-defined threshold. Under playback attacks, the mea-sured TDoA dynamic will be very different from that of a liveuser due to different sound production systems (i.e., loud-speaker v.s. human vocal system). Under replace attacks,it is extremely unlikely, if not impossible, for an adversaryto place a stereo recorder (e.g., smartphone) very close, say5cm, to the victim’s mouth to collect voice samples. Dueto the origins of the phoneme sounds are crowded in themouth and nasal cavities as shown in Figure 5 (b), the TDoAdynamic diminishes rapidly with the increased distance be-tween the recorder and the user’s mouth. For example, ifthe phone is placed 30cm away from the user’s mouth, themaximum achievable TDoA range among all phonemes isless than 1cm. With such a small range, most phonemeshave the same TDoA measurement to the two microphonesof the phone. The measured TDoAs under replace attackthus cannot match the one extracted when the user enrolledin the system.
Virtually all smartphones are equipped with two micro-phones and are capable of stereo recording. By leveraginga sequence of phoneme sounds in an utterance/passphrase,our approach relaxes the problem of locating each phonemesound to tracking TDoA dynamic for live user detection.We thus enable the phoneme localization based liveness de-tection on a single phone without requiring any additionalhardware.
Our system does require the user to place the smartphoneclose to the mouth with the same pose in both enrollmentand authentication processes. The effects of different phonesand phone displacement are studied in experiment evalua-tion. Moreover, data protection mechanisms or secure com-munication protocols should be in place to prevent an at-tacker from obtaining the plain-text of TDoA dynamic andthe dual-channel audio samples [18]. For example, TDoAdynamic could be extracted locally without storing the dual-channel audio sample, and only the encrypted one-channel
1083

������,� ����
�-�� ��,� �������
����������
�
�������������
.����/������*�
�����0����������
,� ������/�0� �������
������/� ������"�����
Figure 7: The flow of our liveness detection system.
����
����
��
� � � ��� ��� ��� ��� ��� � �
�
�
�
�
������ ����������
����
Figure 8: Example: spectrogram of phonemes.
audio sample together with the encrypted TDoA dynamicare transmitted or used for verification and liveness detec-tion.
3.2 System FlowRealizing our system requires four major components: Pho-
neme Segmentation, TDOA Calculation, Similarity Compar-ison, and Detection. As shown in Figure 7, the voice sampleacquired by two microphones first passes through phonemesegmentation, which extracts phonemes existing in the voicesample. In particular, we combine Hidden Markov Model-ing techniques to perform forced alignment on the wordsrecognized from the voice sample to identify each phonemesound. The words in the voice sample are recognized byacoustic modeling and language modeling algorithms.
Next, the TDOA calculation component is used to calcu-late the number of delayed samples of each phoneme soundto the two microphones. As acoustic signals can be eas-ily distorted due to multipath propagation, simply corre-lating phonemes between two channels will result in largeerror. To address this challenge, we adopt generalized cross-correlation and heuristic-based phase transform weightingapproaches for accurate TDoA estimation.
After that, the similarity comparison component measuresthe similarity of the calculated TDoA dynamic to the onestored in the system. It results in a similarity score, which isthen compared with a pre-defined threshold. If the score islarger than the threshold, a live user is detected, otherwisea replay attack is declared. The detection result can be thencombined with the traditional voice authentication systemto verify the claimed identity of a user.
3.3 Phoneme SegmentationThe underlying principle for phoneme segmentation is that
the sound of a phoneme contains a number of different over-tone pitches simultaneously, known as formants [23]. Byanalyzing the sound spectrogram, we are able to discoverthese overtone pitches or formats to identify each individualphoneme sound. Although the most informative formantsare the first three formants, the two first formants, F1 and
Time (s)0 1.401
0
5000
Freq
uenc
y (H
z)
0 0.3 0.6 0.9 1.20
1000
2000
3000
4000
5000
AUTH
EN
TI
CA
TIO
N
Figure 9: Example of segmented phonemes.
F2, are enough to disambiguate the vowel. As illustrated inFigure 8, it is easy to observe the first two formants, F1 andF2, which contribute to the overtone of each vowel most.It is thus feasible to segment different vowels by looking atthe F1 and F2 in the spectrogram. Unlike vowels, conso-nants’ spectrograms display as random mixture of differentfrequencies, as showed in Figure 8. This static noise-likesound makes it difficult to accurately identify each conso-nant by simply utilizing formants. We thus adopt forcedalignment by using HMM (Hidden Markrov Models), whichaligns the input voice spectrogram with existing voice sam-ples to distinguish different consonants [20].
In particular, we first recognize the words existing in thevoice sample, which could be done by using automatic speechrecognition (ASR). We use advanced CMUSphinx [29] to au-tomatically recognize each word in the user’s voice sample.More specifically, the voice sample is first parsed into fea-tures, which are a set of mel-frequency cepstrum coefficients(MFCC) that model the human auditory system. Then, theMFCCs are combined together with the dictionary, acousticmodel, and language model to recognize the words in thevoice sample [29].
Given the recognized words, we utilize MAUS as primarymethod for phoneme segmentation and labeling [21]. In par-ticular, the recognized words are first transferred into ex-pected pronunciation based on standard pronunciation model(i.e., SAMPA phonetic alphabet). Then, the generated canon-ical pronunciation together with the millions of possible ac-cents of users yield a probabilistic graph including all possi-ble hypotheses and the corresponding probabilities. At last,the system searches the graph space for the path of pho-netic units that have been spoken with highest probabilityusing a Hidden Markrov Model. Outcomes of the search aresegmented and labeled phonetic units. Figure 9 illustratesone example of the resulted phoneme segmentation whenone user pronounces the word “authentication”. We observethat the segmentation accurately captures both the vowelsand the consonants.
3.4 TDOA CalculationThe basic idea of TDoA calculation is to count the num-
ber of delayed samples to the two microphones by correlatingeach segmented phoneme sound between smartphone’s twochannels. Let’s denote mic1 and mic2 as the two micro-phones/channels of the phone, and Δt as the TDoA of onephoneme sound to the two microphones. Given the phonemesound mic1(t) recorded at mic1, we correlate such phonemesound to the sound signal mic2(t+ d) recorded at the mic2,with d varying from 0 to N − 1. Once the best match isfound, the corresponding d value is the number of delayedsamples between mic1 and mic2. In particular, such correla-
1084

Phoneme Sound
O s car di dn t li ke s wee p day
TDoA
in T
erm
s of
Sam
ples
-50
-45
-40
-35
-30 data1data2data3data4data5data6data7data8data9data10
Figure 10: TDoAs of one passphrase for 10 trials.
tion can be done by using a cross-correlation technique [25],as shown below:
CC(d) =
∑i[(mic1(i) − mic1(i)) ∗ (mic2(i + d) − mic2(i + d))]
√∑i(mic1(i) − mic1(i))2
√∑i(mic2(i + d) − mic2(i + d))2
,
(1)
The TDoA Δt can be obtained as:
Δt = argmaxd
CC(d), (2)
However, simply applying the cross-correlation methodresults in an inaccurate estimation of Δt due to the mul-tipath propagation and reverberation effect of acoustic sig-nals. To improve the accuracy, we further utilize general-ized cross correlation with phase transformation techniques(PHAT) [22]. By adding a weighting function into cross cor-relation calculation process, it suppresses the frequency com-ponents whose power spectra carry intense additive noises.Meanwhile, PHAT utilizes the cross-power spectral densityof two different acoustic signals to improve the system’s ro-bustness to reverberation effect. Existing work has shownPHAT can further mitigate the spreading effect that causedby uncorrelated noises at two microphones [22].
Figure 10 shows one example of the TDoA values whenone participant performs 10 trials of authentication with thepassphrase “Oscar didn’t like sweep day”. The X axis showseach phoneme sound, whereas Y axis shows the TDoA interms of number of delayed samples. We observe that TDoAdynamics of these trials are highly similar and stable, withonly 1 to 2 samples variation under 192kHz sampling rate.The results show that TDoA calculation is able to catch theuser’s unique speech production system accurately.
3.5 Similarity ComparisonOnce the TDoA dynamic is extracted, we first normalize
these TDoA values to the same scale as those stored in theuser profile. Such normalization is used to deal with the is-sues of device diversity and phone displacement. The phonea user used to enroll in the system could be different fromthe one he/she used for authentication. As different phonesdiffer in size or distance between the two microphones, theabsolute TDoA values of the same phoneme could be dif-ferent. Similarly, if the user places the phone at a locationslightly different from that when he/she enrolled in the sys-tem, the absolute TDoA values vary slightly. Normalizingthe TDoAs to the same scale could effectively mitigate theseissues.
To compare the similarity of the TDoA dynamic withthe user profile, we utilize both the correlation coefficientand the probability. In particular, the correlation coefficient
Figure 11: Two different phone placements diagram.
measures the degree of linear relationship between two se-quences [35]. Other than calculating the absolute difference,it quantifies the similarities in the changes of two sequences.The correlation coefficient ranges from -1 to +1. A valueof near +1 indicates a high degree of similarity, whereas avalue near 0 indicates a lack of similarity.
For the probability based method, we assume the TDoAranging error of each phoneme follows an independent stan-dard Gaussian distribution. Given the TDoA value TDoAi
in the extracted TDoA dynamic, the probability that itmatches the one in the user profile is represented as:
P (TDoAi) =1
σ√2π
e−(TDoAi−TDoAi)2
(3)
whereas σ is the standard deviation of the error and TDoAi
is the corresponding TDoA value in the user profile. Dur-ing the user enrollment phase, we ask each user to speak apassphrase three times to extract the averaged TDoA andthe standard deviation of each phoneme for similarity com-parison. Given the probability value of each phoneme, wesimply average the probability values of all phonemes as theindicator of the similarity score.
Correlation coefficient and probability are two metrics tar-geting on different characteristics of the TDoA dynamic. Werefer to the former as Correlation, and latter as Probability.Moreover, we develop a combined scheme that simply com-bines the similarity scores of the correlation and probabilitybased methods. We refer to such a method as Combinedmethod, which takes advantages of both the correlation co-efficient and the probability.
4. PERFORMANCE EVALUATIONIn this section, we evaluate our liveness detection system
under replay attacks including both playback and replaceattacks3. We also evaluate the robustness of our systemto different types of phones, sampling frequencies, phonedisplacements, and lengths of passphrases.
4.1 Experiment MethodologyPhones and Placements. We evaluate our system with
three types of phones with different sizes and audio chipsets.In particular, we experiment with Samsung Galaxy Note3,Galaxy Note5 and Galaxy S5. The distance between thetwo microphones (i.e., one on the top and one at the bot-tom) for stereo recording is about 15.1cm for Note3, 15.3cmfor Note5, and 14.1cm for S5. The audio chipset of Note3 isQualcomm Snapdragon 800 MSM8974, whereas it is Wolf-son WM1840 for Note5, and Audience’s ADNC ES704 forS5. The operating system of these phones is Android 6.0Marshmallow, which enables the phones to perform stereorecording at 48kHz, 96kHz and 192kHz sampling frequen-cies. These frequencies represent ranging resolutions of 7.08mm,
3This project has obtained IRB approval.
1085
"��� ���� �#��� ���� �
���� ���� �
#!������� �
$%&'�
(%)�*%+�
,%+�
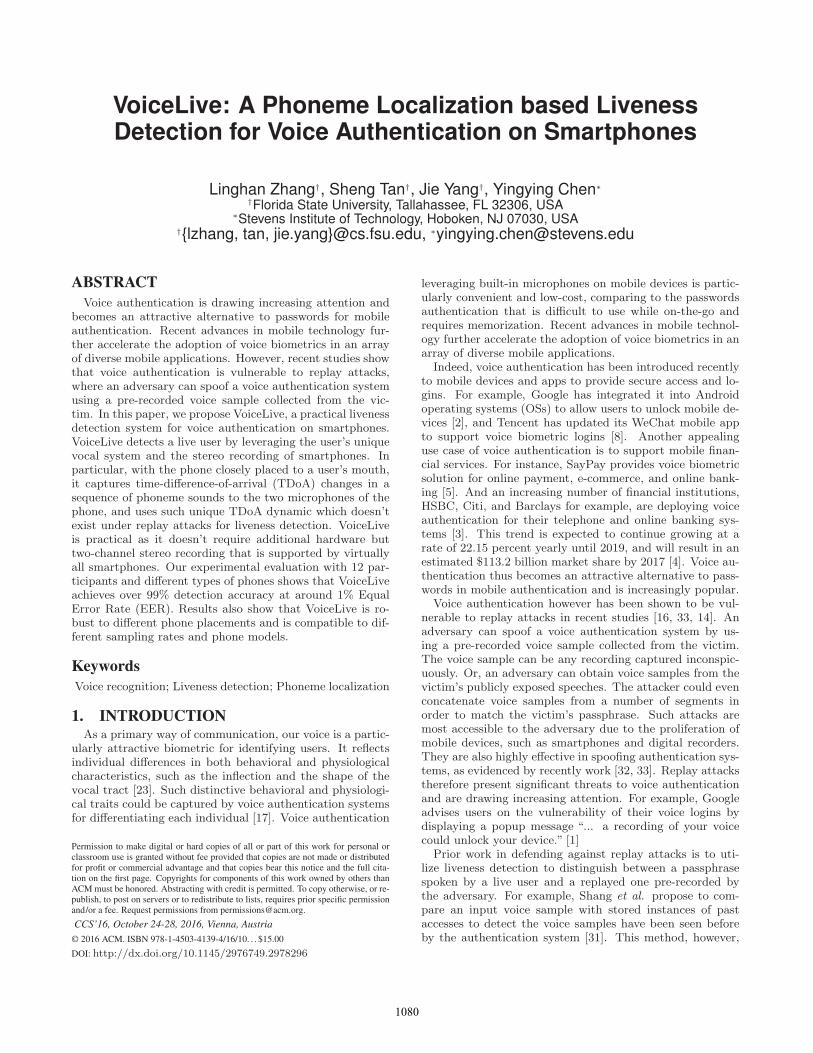
Figure 12: Illustration of locations of replace attacksand different types of social distances.
3.54mm, and 1.77mm, respectively. We use 192kHz as ourprimary sampling frequency and present the correspondingresults unless otherwise stated. We also experiment withtwo types of phone placements, as shown in Figure 11. Oneis vertical placement with the phone placed close to user’smouth vertically. We call such placement our primary place-ment and present the performance of such placement unlessotherwise specified. For the vertical placement, the phoneis about 3cm and 1cm away from user’s mouth on Z andY axis, respectively. The other one is horizontal placementwith the phone placed close to the user’s mouth horizontally.The phone is about 6cm and 1cm away from user’s mouthon Z and Y axis, respectively. We choose these placementsbecause they have relatively large achievable TDoA ranges,which is discussed in Section 5.
Data Collection. Our experiments involve 12 partici-pants including 6 males and 6 females whose ages range be-tween 25 to 38. These participants are either graduate stu-dents or university researchers, who are recruited by emails.The participants are informed of the purpose of our exper-iments and are required to act as if they were conductingvoice authentication. Each participant chooses 10 differentpassphrases of their own and performs 10 times legitimateauthentications for each passphrase after enrollment. To en-roll in the system, each participant speaks a passphrase threetimes to extract the averaged TDoA and the standard devi-ation of each phoneme for similarity comparison. For onlineverification, users only speak the passphrase once. Each par-ticipant speaks the passphrase with her/his habitual way ofspeaking. The lengths of the passphrases are ranging from2 words to 10 words with proximately half of them are 2-4 words, one quarter of them are 5-7 or 8-10 words. Theexperiments are conducted in both the office and home en-vironments with background and ambient noises, such aspeople chatting and HVAC noise.
Attacks. We experiment with two types of replay at-tacks: playback attacks and replace attacks. For playbackattacks, we replay participants’ voice samples in front of thesmartphone that performs stereo recording for authentica-tion. We utilize three different types of loudspeaker includ-ing DELL AC411 wireless speaker system, Samsung Galaxynote5 and S5 speakers, to replay each pre-recorded voicesample. In addition, half of the playback attacks are con-ducted with stationary loudspeakers that are within 10cmaway from the smartphone (i.e., Static Playback Attacks);while the other half are conducted with mobile loudspeakerstargeting on mimicking TDoA changes of users by movingthe loudspeakers around the smartphone (i.e., Mobile Play-back Attacks).
For replace attacks, we place a smartphone with stereo
False Accept Rate (%)0 0.02 0.04 0.06 0.08 0.1
True
Acc
ept R
ate
(%)
80
85
90
95
100
CorrelationProbabilityCombined method
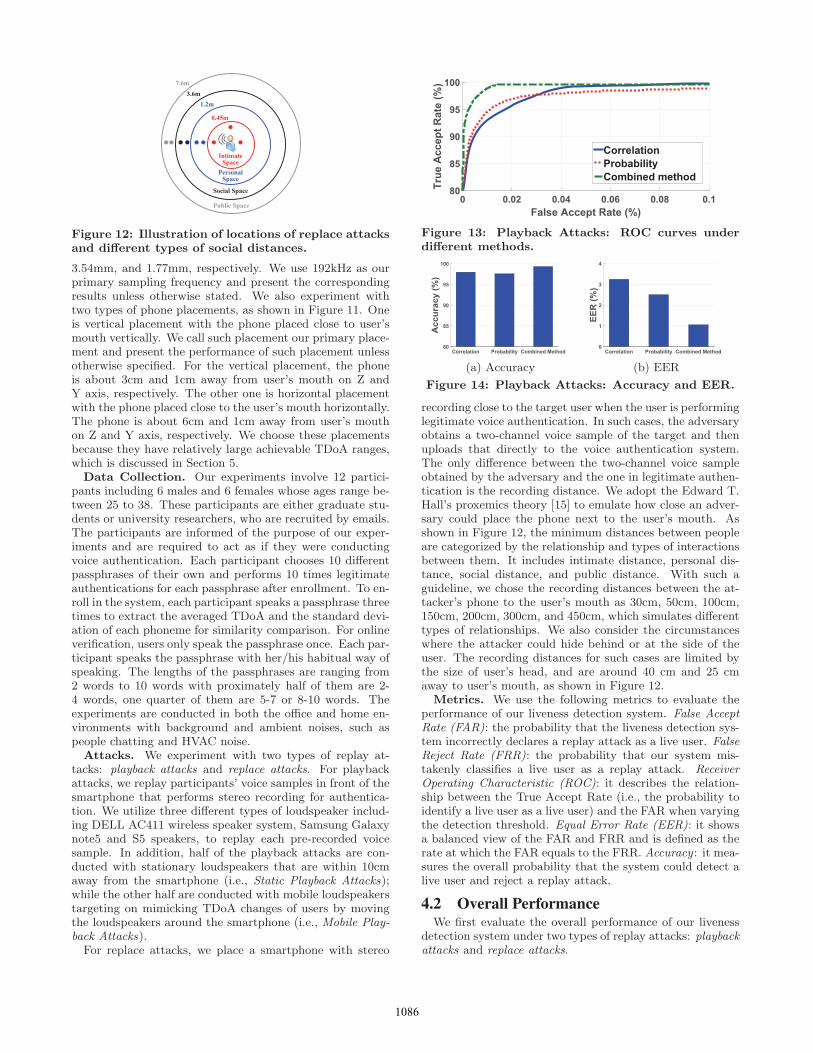
Figure 13: Playback Attacks: ROC curves underdifferent methods.
Correlation Probability Combined Method
Acc
urac
y (%
)
80
85
90
95
100
(a) Accuracy
Correlation Probability Combined Method
EER
(%)
0
1
2
3
4
(b) EER
Figure 14: Playback Attacks: Accuracy and EER.
recording close to the target user when the user is performinglegitimate voice authentication. In such cases, the adversaryobtains a two-channel voice sample of the target and thenuploads that directly to the voice authentication system.The only difference between the two-channel voice sampleobtained by the adversary and the one in legitimate authen-tication is the recording distance. We adopt the Edward T.Hall’s proxemics theory [15] to emulate how close an adver-sary could place the phone next to the user’s mouth. Asshown in Figure 12, the minimum distances between peopleare categorized by the relationship and types of interactionsbetween them. It includes intimate distance, personal dis-tance, social distance, and public distance. With such aguideline, we chose the recording distances between the at-tacker’s phone to the user’s mouth as 30cm, 50cm, 100cm,150cm, 200cm, 300cm, and 450cm, which simulates differenttypes of relationships. We also consider the circumstanceswhere the attacker could hide behind or at the side of theuser. The recording distances for such cases are limited bythe size of user’s head, and are around 40 cm and 25 cmaway to user’s mouth, as shown in Figure 12.
Metrics. We use the following metrics to evaluate theperformance of our liveness detection system. False AcceptRate (FAR): the probability that the liveness detection sys-tem incorrectly declares a replay attack as a live user. FalseReject Rate (FRR): the probability that our system mis-takenly classifies a live user as a replay attack. ReceiverOperating Characteristic (ROC): it describes the relation-ship between the True Accept Rate (i.e., the probability toidentify a live user as a live user) and the FAR when varyingthe detection threshold. Equal Error Rate (EER): it showsa balanced view of the FAR and FRR and is defined as therate at which the FAR equals to the FRR. Accuracy : it mea-sures the overall probability that the system could detect alive user and reject a replay attack.
4.2 Overall PerformanceWe first evaluate the overall performance of our liveness
detection system under two types of replay attacks: playbackattacks and replace attacks.
1086

Static Mobile
Acc
urac
y (%
)
0
20
40
60
80
100
CorrelationProbabilityCombined Method
Figure 15: Static and Mobile Playback Attacks: Ac-curacy under different methods.
Intimate Personal Space Social and Beyond
Acc
urac
y (%
)
90
92
94
96
98
100
CorrelationProbabilityCombined Method
Figure 16: Replace Attacks: Accuracy of differentmethods with different social distances.
Playback Attack. Figure 13 shows the ROC curves ofdifferent methods in detecting live users under playback at-tacks. We observe that our system is highly effective indetecting live users and rejecting playback attacks. Thesethree methods provide more than 94% detection rate withless than 1% FAR. In particular, the correlation and prob-ability based methods have comparable performance. Thecorrelation method provides a detection rate of 95% with 1%FAR. The combined method has the best performance andresults in over 99% detection rate with less than 1% falseaccept rate.
Moreover, Figures 14 depicts the overall accuracy andEER of different methods under playback attacks. We ob-serve that the combined method provides the best accuracyand EER, which are 99.30% and 1.05% respectively. Thecorrelation method produces an accuracy of 97.95%, whichis slightly better than that of the probability method (i.e.,97.54%). However, probability method results in a betterEER than that of the correlation method. In particular,probability method has an EER of 2.50% and correlationmethod has an EER of 3.24%. The above results show thatVoiceLive is highly accurate in detecting live users underplayback attacks, and the combined method provides thebest results since it takes advantages of both the correctionand the probability based methods.
We next take a closer look at how our system performsunder static and mobile playback attacks. In our experi-ments, we observe the static playback attacks produce simi-lar TDoA values for different types of phoneme sounds. Al-though playback attacks under mobile scenarios could re-sult in TDoA changes, the resulted changes in TDoA can-not match with the ones in the user profile. It is becausethe attacker couldn’t mimic the sound position transitionthe same as that of the human vocal system. As shown inFigure 15, our system is highly effective in live user detec-tion under both static and mobile playback attacks. Thecombined method achieves 99.2% accuracy under static sce-narios and 99.65% accuracy under mobile cases.
Replace Attack. We next evaluate the effectiveness ofour system in defending against the replace attacks. Fig-ure 16 illustrates the accuracy of different methods with re-
30 50 100 150 200 300 450
Acc
urac
y (%
)
99.4
99.5
99.6
99.7
99.8
99.9
100
EER
(%)
0
0.1
0.2
0.3
0.4
0.5
0.6
AccuracyEER
99.47
0.43
0.10
0.00 0.00 0.00 0.00
100100100100
0.09
99.7299.72
Figure 17: Replace Attacks: EER and Accuracy ofCombined method under different distances.
Passphrase Length2-4 5-7 >7
Acc
urac
y (%
)
95
96
97
98
99
100
CorrelationProbabilityCombined Method
98.78
96.11
99.6599.60
100.00
96.60
98.42
98.77
Figure 18: Accuracy under different lengths ofpassphrase.
place attacks conducted under different social distances. Inparticular, the testing positions of replace attacks fall intothree categories: intimate (<45cm), personal space (45cmto 1.2m), and social and beyond(>1.2m). We observe thatour system can effectively detect the live users and reject thereplace attacks under each category of social distances. Forexample, the combined method provides 99.47% detectionaccuracy under intimate relationship, 99.82% under personalrelationship, and 100% under social relationship and publicspace. And all the methods provide over 98.95% detectionaccuracy across different categories.
Figure 17 shows the details on the accuracy and EERof the combined method under each social distance. Wefind that both the accuracy and EER are improved with anincreased social distance. In particular, the EER decreasesfrom 0.43% to 0% and the accuracy is improved from 99.47%to 100% when the distance is increased from 30cm to 150cm.When the attacker is further away, our system can detect allthe live user cases and reject all the replace attacks. Thisis because when increasing the distance between the phoneand user’s mouth, the TDoA dynamic diminishes rapidly.
We also investigate the replace attacks launched from 25cmbehind the user and 40cm from the side of user. The EER ofthe combined method under these two cases are 0.33% and0%, respectively. Such results are comparable to the EERin Figure 17. This shows our system is capable of detectingreplace attack conducted from different directions.
4.3 Impact of Passphrase LengthGenerally, a passphrase with longer length provides stronger
security. It also produces more phoneme sounds that gen-erate more changes in the TDoA measurements. We thusstudy the performance of our system with different lengthsof passphrases. In particular, we sort all the passphrasesinto three categories including short passphrases with 2 to 4words, appropriate passphrasses with 5 to 7 words, and longpassphrases with 8 to 10 words. Note that researchers andprofessionals in voice authentication suggest that a passphraseshould contain at least 5 words so as to provide sufficient se-curity level [7].
Figure 18 and Figure 19 illustrate the accuracy and EER
1087

Passphrase Length2-4 5-7 >7
EER
(%)
0
1
2
3
4
5CorrelationProbabilityCombined Method
4.24
3.93
1.78
1.00
2.50
1.62
0.320.00
Figure 19: EER under different lengths ofpassphrase.
Sampling Frequency (kHz)48 96 192
Acc
urac
y (%
)
80
85
90
95
100
CorrelationProbabilityCombined Method
Figure 20: Accuracy under different sampling fre-quencies.
for different lengths of passphrases, respectively. We observethat both the accuracy and EER are improved for all themethods when we increase the length of the passphrase. Inparticular, the accuracy is improved from 98.78% to 100%and the EER is reduced from 1.78% to 0% for combinedmethod, when we increase the length from 2-4 words tomore than 7 words. In addition, with an appropriate lengthof passphrase (i.e., 5 to 7 words), the combined method re-sults in 99.65% accuracy and 1% EER. The results con-firm our observation that a longer passphrase leads to moreTDoA changes of phoneme sounds, which improves the per-formance of the live user detection.
4.4 Effect of Sampling FrequencyAs not all the smartphones are installed with the latest
OS, older version of OSs can only support the standard sam-pling frequency at 48kHz or 96kHz. We thus study how ro-bust our system is to lower sampling frequencies. Figure 20and Figure 21 show the accuracy and EER under differ-ent sampling frequencies respectively. We observe that oursystem works effectively under all of these three samplingfrequencies. Although with higher sampling rates, it doeshave better accuracy and EER due to higher ranging reso-lution. In particular, for combined method the accuracy isover 95% under 48kHz, and over 97% under 96kHz, whereasthe EER is at around 3% for both 48kHz and 96kHz. Theseresults show that our liveness detection system could workwith both the state-of-the-art smartphones as well as low-end smartphones.
4.5 Impact of Different PhonesAs one user may use one phone to enroll in the system but
uses another one to perform online authentication, we studyhow our system behaves under different phones. Specifically,we experiment with users to use either Note5, Note3, or S5 toenroll in the system and then utilize the other two for onlineauthentication. These three types of phones differ in size andaudio hardware as described in the experimental setup. Fig-ure 22 shows the accuracy of different methods when usingone phone as enrollment and the others as online authenti-cation. We observe that our system still provides accurate
Sampling Frequency (kHz)48 96 192
EER
(%)
0
5
10
15CorrelationProbabilityCombined Method
Figure 21: EER under different sampling frequen-cies.
Acc
urac
y (%
)
0
20
40
60
80
100
Note5Note3/S5
Note3Note5/S5
S5Note5/Note3
CorrelationProbabilityCombined method
Figure 22: Accuracy of using one phone as enroll-ment and the other two as online authentication.
liveness detection. In particular, the combined method re-sults in accuracy of 97.82%, 96.67%, 96% when using Note5,Note3, and S5 as the phone for enrollment while the othertwo for authentication, respectively. Moreover, we observethat these three methods have comparable performance nomatter which phone is used for enrollment or authentica-tion. Although the accuracy is slightly higher when usingthe same phone (i.e., about 99%), our system still producesvery accurate detection results with different phones. Suchobservations show that our system is robust and compatibleto different phone models.
4.6 Robustness to Phone DisplacementWhen performing online authentication, our system re-
quires the user to place the phone at a similar position tothat when the user enrolled in the system. We thus studyour system’s performance if there exists displacement of thephone between the position for enrollment and online au-thentication. Specifically, we experiment with different de-grees of phone displacements when performing authentica-tion, i.e., 1cm, 2cm, and 3cm away from the position thatuser enrolled in the system. Such displacements occur oneach axis: Left (X axis), Down (Z axis), and Forward (Yaxis). Figure 23 and Figure 24 show the accuracy and EERunder different degrees of phone displacements, respectively.We observe that although a higher degree of displacementresults in lower accuracy and higher EER, our system over-all still provides accurate detection results: the accuracyis more than 98% for all the displacements and EER is alsomaintained at a very low rate, ranging from 1% to 3%, whenusing combined method. Moreover, we find that our systemis more sensitive to the displacements on Y axis (i.e., For-ward) and less sensitive to X axis (i.e., Left). This is be-cause by moving the phone forward, the maximum achiev-able TDoA range will be reduced quickly with the increaseddistance, as shown in Section 5. The results may also indi-cate VoiceLive is not sensitive to the small movements of thephone (e.g., hand movements). In addition, the time dura-tion of speaking a passphrase is usually about 2-3 seconds.The movements of the phone within such a short durationare usually small and may have limited effect.
1088

1cm 2cm 3cm 1cm 2cm 3cm 1cm 2cm 3cm
Acc
urac
y (%
)
90
92
94
96
98
100
CorrelationProbabilityCombined Method
Left Down Forward
Figure 23: Accuracy under different degree of phonedisplacement.
1cm 2cm 3cm 1cm 2cm 3cm 1cm 2cm 3cm
EER
(%)
0
2
4
6
8
10CorrelationProbabilityCombined Method
Left Down Forward
Figure 24: EER under different degrees of phonedisplacement.
4.7 Effect of Phone’s PlacementDifferent users might have different ways to place the
phone close to their mouths during the authentication pro-cess. We thus compare the performance of our system un-der two types of placements, vertical and horizontal, as de-scribed in experimental setup. Figure 25 illustrates the ac-curacy comparison of these two placements. We observethat our system achieves very high accuracy for both place-ments, with the accuracy slightly higher when the phone isplaced vertically. Specifically, the accuracy under horizontalplacement is 97.41%, 97.26%, and 99.13% for correlation,probability, and combined method respectively. Figure 26shows the EER under two displacements. We have simi-lar observation to that of the accuracy. In particular, EERis 3.3%, 2.69%, and 1.33% for correlation, probability, andcombined method respectively. Results show that our sys-tem works very well for different phone placements includingboth horizontal and vertical placements.
5. DISCUSSION AND FUTURE WORKAchievable TDoA Range. The achievable TDoA range
is determined by the distance between two microphones andis affected by the relative position between the phone anduser’s mouth. Figure 27 shows the achievable TDoA rangewith Samsung Galaxy Note3 by using the sound origin modelwe built in Figure 5. The distance between two microphonesis 15.1cm. Figure 27 plots the sectional view on Y-Z planeand the coordinate (0,0) is the location of the mouth. Each(y, z) point in vertical placement indicates the center of thephone when place the phone vertically, whereas it representsthe bottom microphone of the phone when place phone hor-izontally. The color at each position represents the achiev-able TDoA range at that position. As we can see from Fig-ure 28, the maximum achievable TDoA range is around 6cmfor vertical placement, whereas it is about 4cm for horizontalplacement if we place the phone very close to user’s mouth.The reason we cannot achieve maximum TDoA range as thedistance between two microphones is that the origin of the
Horizontal Vertical
Acc
urac
y (%
)
0
20
40
60
80
100
CorrelationProbabilityCombined Method
Figure 25: Accuracy of horizontal and vertical place-ments.
Horizontal Vertical
EER
(%)
0
1
2
3
4CorrelationProbabilityCombined Method
Figure 26: EER of horizontal and vertical place-ments.
phoneme sound is crowded in user’s mouth and nasal cavities(i.e., all are at similar directions to the two microphones).Such maximum achievable TDoA ranges (i.e., 6cm and 4cm)could ideally distinguish 33 and 23 different phoneme soundsunder 192kHz sampling rate, respectively. We also find thatthe achievable TDoA range decreases rapidly when increas-ing the distance between the phone and the mouth. Forexample, with the phone placed at 30cm away from user’smouth, the achievable TDoA range decreases to less than1cm, which makes it hard to capture any TDoA dynamicof a passphrase. This is why our system is robust to thereplace attack, where an adversary attempts to record theTDoA dynamic under different social distances.
Potential Active Attacks. In our experiments, we onlyevaluate our system under the scenarios that an adversaryuses similar recording hardware as the one used by the le-gitimate users. However, it is possible for an attacker to useadvanced hardware to record the voice samples and furtherdeduce the TDoA dynamic that can match the victim’s pro-file. In particular, an attacker can leverage a microphone ar-ray to locate each phoneme within the victim’s vocal system.As the maximum achievable TDoA range decreases rapidlywith the increased distance between the recorder and theuser’s mouth, it requires the microphone array to supportan ultra-high sampling rate so as to have sufficient rangingresolution to uniquely locate each phoneme. For example,with the microphone array placed 30cm away from the user,the maximum achievable TDoA range is less than 1cm. Touniquely locate each phoneme, the ranging resolution shouldbe at least 0.2mm, which is ten times of that supported by192kHz. Current professional digital recorders (e.g., Direct-Stream Digital (DSD) recorders that worth thousands ofdollars and have the sizes similar to a desktop mainframe)that support 2.8224MHz and 5.6448MHz sampling rates canbe leveraged to locate each phoneme without placing therecorder very close to victim’s mouth.
After locating each phoneme, the attacker can deduce theTDoA dynamic of the victim based on the relative positionbetween the phone and the victim’s mouth. This does re-quire the attacker to observe how the phone is placed tothe victim’s mouth. Given the obtained TDoA dynamic,
1089

(a) Vertical placement (b) Horizontal place-ment
Figure 27: The achievable TDoA range under bothvertical and horizontal placements.
the attacker is further required to reproduce the voice sam-ples that satisfy the TDoA constraints. It could be done bycreating a synthetic two-channel audio stream. With suchan audio stream, the attacker can either conduct a replaceattack or a playback attack to bypass the VoiceLive.
In our future work, we will study the feasibility of con-ducting such active attacks. Particularly, we will evaluatewhether or not current acoustic localization systems couldachieve the level of localization accuracy required in the ac-tive attacks. The potential countermeasure is to detect thesynthetic two-channel audio stream. VoiceLive could inte-grate with existing speaker verification techniques, such asthe higher order Mel-cepstral coefficients [14, 12], which areable to detect speech synthesize attacks. We will evaluatethe effectiveness of detecting the synthetic two-channel au-dio stream with these techniques in our future work.
Extension to Text-Independent System. As a text-independent system operates on arbitrary utterances, wecannot rely on the TDoA dynamic of a passphrase for live-ness detection. However, a text-independent system requirescollecting a large number of utterances from the user to trainits speaker models. We therefore can extract the TDoAvalue of each phoneme sound to build a model similar tothat of the Figure 5 by re-using the training data when thesystem trains the speaker models. During the online authen-tication phase, we extract the TDoA value of each phonemefrom the incoming utterances and then could build anothermodel. Such a model (could be a sub-model of the trainedmodel) can then be matched with the one trained duringthe training phase. It is thus still possible to use the loca-tion of each phoneme sound for liveness detection in text-independent systems.
Diversity in Human Vocal System. An individual’svocal system differs in the shape and size of the larynx,nasal passages and vocal tract. In addition, different in-dividuals have their own habitual ways of pronouncing thesame word, which results in different cadences, accents andpronunciations. We thus investigate how similar are the ex-tracted TDoA dynamics for different users with the samepassphrase. Figure 28 depicts the similarity of the extractedTDoA dynamics for the same passphrase between four users:A, B, C, and D. Each user speaks the same passphrase 10times, and we measure the similarity within each user andbetween users using Pearson correlation coefficients. We ob-serve that the correlation coefficients for the same user underdifferent trials are very high, at around 0.9, whereas they aregenerally below 0.6 between different users. This indicatesthat the diversity in TDoA dynamic does exist, which issimilar to that of individual vocal system and user’s habit-
1 10 1 10 1 10 1 101
101
101
101
10
-0.8
-0.6
-0.4
-0.2
0
0.2
0.4
0.6
0.8
1
B CA D
D
C
B
A
Figure 28: Similarity of TDoA dynamics betweendifferent users.
ual way of pronouncing. It also shows that it is promisingto use the TDoA dynamic or the location of phoneme as anew biometric trait for user authentication. In our futurework, we will study the possibility of verifying or identify-ing the speaker by making a model using the location of thephoneme sound.
6. RELATED WORKIn recent years, more and more mobile devices and apps
are embracing voice biometric for mobile authentication.However, voice authentication is subject to spoofing attacks,as indicated in recent studies [16, 33, 14, 26]. Voice spoof-ing attacks can be divided into four categories, which aredescribed below together with countermeasures.
Replay Attack. An adversary can spoof a voice authen-tication system by using a pre-recorded voice sample of thevictim [24]. To defend against such attacks, Shang et al.propose to compare a new access voice sample with storedinstances of past access attempts [31]. If this results in anextremely high similarity score, a replay attack is identified.As an alternative, Villalba et al. utilize the increased noiseand reverberation of replaying far-field recordings for attackdetection [32], whereas Wang et al. use the additional chan-nel noise of the recording and loudspeaker for attack detec-tion [33]. However, the effectiveness of these approaches isvery limited in practice (e.g., the FAR rate could be as highas 17%.). Chetty and Wagner utilize video camera to detectlip movements for liveness detection [13], whereas Poss etal. aim to improve authentication accuracy by combiningthe techniques of a neural tree network and Hidden MarkovModels [28]. Aley-Raz et al. develop a liveness detectionsystem, which requires a user to repeat one or more randomsentences prompted by the system for attack detection [10].
Impersonation Attack. It refers to attacks where anadversary tries to mimic the victim’s voice without utilizingany computer or professional devices. Recent work showsthat impersonation attack could be defended very efficientlyby using advanced speaker models, such as GMM-UBM [11]and i-vector models [16]. Existing voice authentication sys-tems with such advanced speaker models thus are resistantto impersonation attacks.
Speech Synthesize Attack. This type of attack indi-cates an attacker has the ability to synthesize the victim’svoice by utilizing speech synthesize technologies. Earlierwork done by Lindberg and Blomberg [24] shows that theFAR can be increased to as high as 38.9% with less sophisti-cated speaker models. Recent work done by De Leon et al.shows that by adopting both GMM-UBM and SVM tech-
1090

nologies, voice authentication systems are able to lower theFAR of the system to 2.5% [14]. Also, Chen et al. [12] showthat by employing higher order Mel-cepstral coefficients, theEER can be lowered to 1.58%.
Voice Conversion Attack. It aims at manipulatingor converting existing voice samples from other users sothat they would resemble the target’s voice. In the earlywork, researchers demonstrate such attacks can significantlyaffect the authentication system [19]. Recent studies byMukhopadhyay et al. show that current speaker verifica-tion systems based on UBM-GMM and ISV speaker modelsare vulnerable to voice conversion attacks [26]. To defendagainst voice conversion attacks, Wu et al. [34] developedan authentication system with PLDA component that couldachieve 1.71% FAR, whereas Alegre et al. utilize PLDA andFA technologies, which result in the FAR rate of 1.6% [9].
7. CONCLUSIONIn this work, we developed a liveness detection system
for voice authentication that requires only stereo recordingon smartphones. Our system VoiceLive is practical as noadditional hardware is required during the authenticationprocess. VoiceLive performs liveness detection by measur-ing TDoA changes of a sequence of phoneme sounds fromthe two microphones of a smartphone. It distinguishes a liveuser from a replay attack by comparing the TDoA changesof the input utterance to the one stored in the system. Ourexperimental evaluation demonstrates the viability of dis-tinguishing between a live user and a replay attack undervarious experimental settings. Our experimental results alsoshow the generality of our system, as we experiment with dif-ferent phone types, placements and sampling rates. Overall,VoiceLive can achieve over 99% accuracy, with an EER aslow as 1%.
8. ACKNOWLEDGEMENTSWe thank our shepherd, Dr. Nitesh Saxena, and the
anonymous reviewers for their insightful feedbacks. Thiswork was partially supported by the National Science Foun-dation Grants CNS-1514436, SES-1450091, CNS-1505175,CNS-1652447 and CNS-1514238.
9. REFERENCES[1] Android voice recognition. http:
//www.popsci.com/new-android-can-recognize-your-voice.[2] Google smart lock. https://get.google.com/smartlock/.[3] Hsbc offers voice biometric.
http://www.bbc.com/news/business-35609833.[4] Mobile voice biometric security. http://voicevault.com/
hsbc-embraces-mobile-voice-biometric-security-technology/.[5] Saypay technologies. http://saypaytechnologies.com/.[6] Vocalpassword.
http://www.nuance.com/ucmprod/groups/enterprise/@web-enus/documents/collateral/nc 015226.pdf.
[7] Voicekey mobile applications. http://speechpro-usa.com/product/voice authentication/voicekey#tab2.
[8] Wechat voiceprint. http://blog.wechat.com/2015/05/21/voiceprint-the-new-wechat-password/.
[9] F. Alegre, A. Amehraye, and N. Evans. A one-classclassification approach to generalised speaker verificationspoofing countermeasures using local binary patterns. InIEEE BTAS, 2013.
[10] A. Aley-Raz, N. M. Krause, M. I. Salmon, and R. Y. Gazit.Device, system, and method of liveness detection utilizingvoice biometrics, May 14 2013. US Patent 8,442,824.
[11] T. B. Amin, J. S. German, and P. Marziliano. Detectingvoice disguise from speech variability: Analysis of threeglottal and vocal tract measures. The Journal of theAcoustical Society of America, 2013.
[12] L.-W. Chen, W. Guo, and L.-R. Dai. Speaker verificationagainst synthetic speech. In 2010 IEEE Chinese SpokenLanguage Processing (ISCSLP), 2010.
[13] G. Chetty and M. Wagner. Automated lip featureextraction for liveness verification in audio-videoauthentication. Proc. Image and Vision Computing, 2004.
[14] P. L. De Leon, M. Pucher, J. Yamagishi, I. Hernaez, andI. Saratxaga. Evaluation of speaker verification security anddetection of hmm-based synthetic speech. IEEE Processingof Audio, Speech, and Language, 2012.
[15] E. Hall. Handbook for proxemic research. AnthropologyNews, 1995.
[16] R. G. Hautamaki, T. Kinnunen, V. Hautamaki, T. Leino,and A.-M. Laukkanen. I-vectors meet imitators: onvulnerability of speaker verification systems against voicemimicry. In INTERSPEECH, 2013.
[17] A. Jain, R. Bolle, and S. Pankanti. Biometrics: personalidentification in networked society. Springer Science &Business Media, 2006.
[18] T. Kevenaar. Protection of biometric information. InSecurity with Noisy Data. 2007.
[19] T. Kinnunen et al. Vulnerability of speaker verificationsystems against voice conversion spoofing attacks: The caseof telephone speech. In IEEE ICASSP, 2012.
[20] A. Kipp, M.-B. Wesenick, and F. Schiel. Automaticdetection and segmentation of pronunciation variants ingerman speech corpora. In IEEE ICSLP, 1996.
[21] T. Kisler, F. Schiel, and H. Sloetjes. Signal processing viaweb services: the use case webmaus. In Digital HumanitiesConference, 2012.
[22] C. H. Knapp and G. C. Carter. The generalized correlationmethod for estimation of time delay. IEEE Processing ofAcoustics, Speech and Signal, 1976.
[23] P. Ladefoged. A course in phonetics. Hardcourt BraceJovanovich Inc. NY, 2014.
[24] J. Lindberg, M. Blomberg, et al. Vulnerability in speakerverification-a study of technical impostor techniques. InEurospeech, 1999.
[25] J. Liu, Y. Wang, G. Kar, Y. Chen, J. Yang, andM. Gruteser. Snooping keystrokes with mm-level audioranging on a single phone. In ACM MobiCom, 2015.
[26] D. Mukhopadhyay, M. Shirvanian, and N. Saxena. All yourvoices are belong to us: Stealing voices to fool humans andmachines. In European Symposium on Research inComputer Security, 2015.
[27] J. P. Olive, A. Greenwood, and J. Coleman. Acoustics ofAmerican English speech: a dynamic approach. SpringerScience & Business Media, 1993.
[28] J. C. Poss, D. Boye, and M. W. Mobley. Biometric voiceauthentication, June 10 2008. US Patent 7,386,448.
[29] M. K. Ravishankar. Efficient algorithms for speechrecognition. Technical report, DTIC Document, 1996.
[30] M. A. Redford. The handbook of speech production. JohnWiley & Sons, 2015.
[31] W. Shang and M. Stevenson. Score normalization inplayback attack detection. In IEEE ICASSP, 2010.
[32] J. Villalba and E. Lleida. Detecting replay attacks fromfar-field recordings on speaker verification systems. InBiometrics and ID Management. 2011.
[33] Z.-F. Wang, G. Wei, and Q.-H. He. Channel pattern noisebased playback attack detection algorithm for speakerrecognition. In IEEE ICMLC, 2011.
[34] Z. Wu, T. Kinnunen, E. Chng, and H. Li. A study onspoofing attack in state-of-the-art speaker verification: thetelephone speech case. In IEEE APSIPA ASC, 2012.
[35] J. Yang, Y. Chen, and W. Trappe. Detecting spoofingattacks in mobile wireless environments. In SECON, 2009.
1091