volta: voltage over-scaling based … voltage over-scaling based lightweightauthentication for...
TRANSCRIPT

VOLtA: Voltage Over-scaling Based Lightweight Authentication for
IoT Applications
Md Tanvir Arafin, Mingze Gao, and Gang Qu
University of Maryland, College Park
{marafin, mgao1, gangqu}@umd.edu

eshSec Lab
Internet of Things
2
Image source: ST Microelectronics
Smart Grid
Smart Car
Smart Home
Smart City
Smart Me
SecurityIoT
Dr. Gang Qu ([email protected])

eshSec Lab
Authentication: Why and What?
Why authentication?
What to authenticate?device, user, data, and process
3Dr. Gang Qu ([email protected])

eshSec Lab
Voltage Over-Scaling
Reducing Vdd for power reductionP=Pstat+Pdyn=CeffVdd
2f+Vdd(Isub+Igate)
Quadratic dependence of power to Vdd
Critical VoltageCell delay dgate∝Vdd/β(Vdd-Vt)α
Scaling below critical voltageError due to path delay
Incorrect computation
Dr. Gang Qu ([email protected]) Han et al. ETS’13

eshSec Lab
VOS for DRAM Deanonymization
Key idea:Use DRAM at a lower voltage
Cell decay rate is a function of process variation
Lowering Vdd will create errors in the data
Similar error pattern on the same chip
Profile the error for deanonymizing DRAMs
Dr. Gang Qu ([email protected])
Figure 2: DRAM fingerprints on data
Rahmati et al. ISCA’15

eshSec Lab
Motivation of the Work
Fabrication variation impacts VOSTransistor size shrinking makes Vt variation wider
σΔVt=AΔVt/(WL)1/2
Path delay error is a function of process variationdgate∝Vdd/β(Vdd-Vt)α
�observe (Vt) variation by VOS?!Variation is believed to be unique, random, unclonable
Security applicationsDevice fingerprint/identifierDevice authenticationHardware PUF and other security primitives
Dr. Gang Qu ([email protected]) 6
Challenges
eshSec Lab
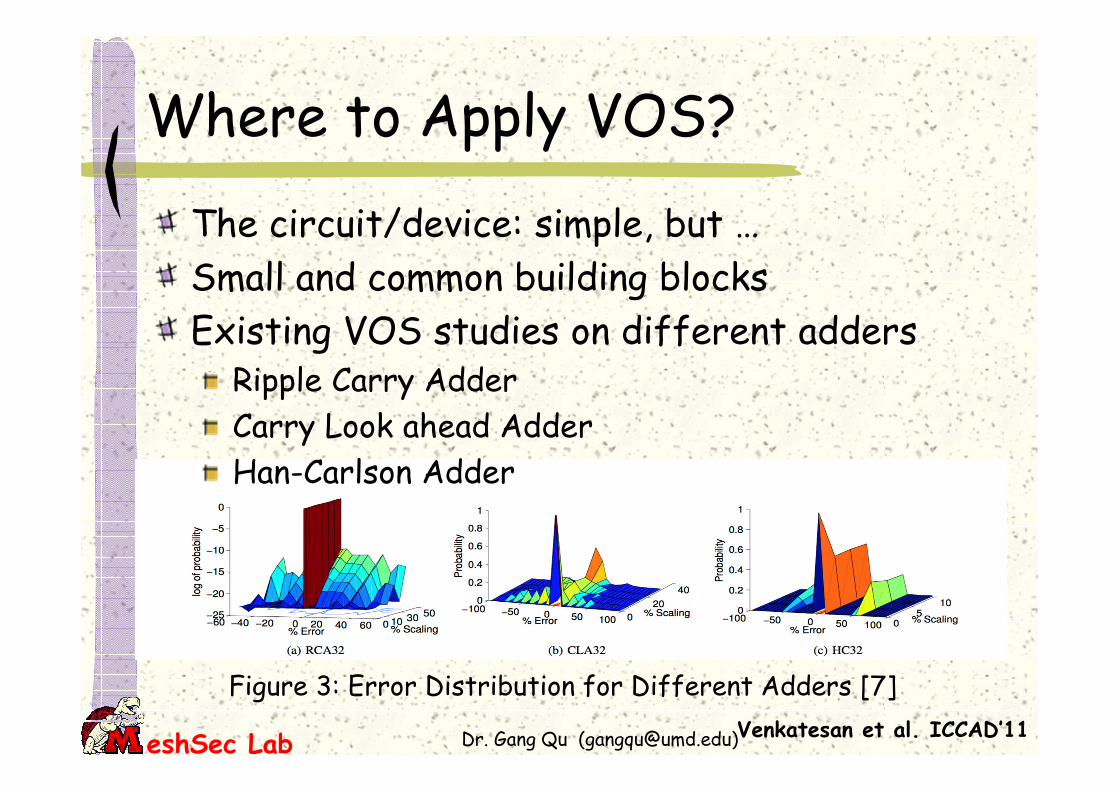
Figure 3: Error Distribution for Different Adders [7]
Where to Apply VOS?
The circuit/device: simple, but …
Small and common building blocks
Existing VOS studies on different adders Ripple Carry Adder
Carry Look ahead Adder
Han-Carlson Adder
Dr. Gang Qu ([email protected])Venkatesan et al. ICCAD’11

eshSec Lab
VOS on Adders
All inputs are equi-probable
Error probability increase with scaling
Output error depends on both current input and the previous input
Dr. Gang Qu ([email protected])Venkatesan et al. ICCAD’11

eshSec Lab
VOS Errors on RCA
Why RCA?One of the simplest designs
Error probability is higher with scaling
Show our proposed ideas only
8-bit for reduced simulation time
Goals of the experimentUniqueness
Robustness
Dr. Gang Qu ([email protected]) 9

eshSec Lab
Experimental Setup
HSpice platform with FreePDK 45nm libraries 200 modified NMOS and PMOS models with a ±7.5% standard variation in Vt
NMOS and PMOS transistor models are randomly chosen to build 100 different versions of each cell standard cell library. Circuits designed in Verilog and synthesized with Cadence Virtuoso RT compiler. The synthesized design is converted into an HSpice netlist with standard cells randomly chosen from the modified library
Dr. Gang Qu ([email protected]) 10

eshSec Lab
Experimental Parameters
Parameter Name Value(s)
Supply voltage (VDD) 0.4V/0.45V/1V
NMOS threshold voltage (Vtn) 0.322±0.02415V
PMOS threshold voltage (Vtp) -0.302±0.02265V
Operating temperature (T) 25 deg. C
Clock Period (Tclk) 1ns
Dr. Gang Qu ([email protected]) 11

eshSec Lab
Uniqueness of Error under VOS
Dr. Gang Qu ([email protected]) 12
A1 A2 A3 A4 A5 A6 A7 A8
A1 0 18.82 18.24 18.04 19.44 18.38 18.33 17.52
A2 18.82 0 5.36 5.21 5.67 5.65 3.89 5.39
A3 18.24 5.36 0 4.62 5.98 5.11 5 6.79
A4 18.04 5.21 4.62 0 5.73 3.53 4.13 6.44
A5 19.44 5.67 5.98 5.73 0 6.04 5.59 6.28
A6 18.38 5.65 5.11 3.53 6.04 0 4.96 6.64
A7 18.33 3.89 5 4.13 5.59 4.96 0 5.41
A8 17.52 5.39 6.79 6.44 6.28 6.64 5.41 0
Table 1. Pairwise Hamming distance (in percent) between the output from 8 devices at 0.4V.

eshSec Lab
65
43
21
65
43
21
0
20
10
5
15
Robustness with Vdd Variation
With voltage increasesError probability decreases
Output converges to the correct value
Noise in Vdd can have detrimental effect
Dr. Gang Qu ([email protected]) 13
Figure 7. Hamming distance (in percent) between devices at 0.45V .
eshSec Lab
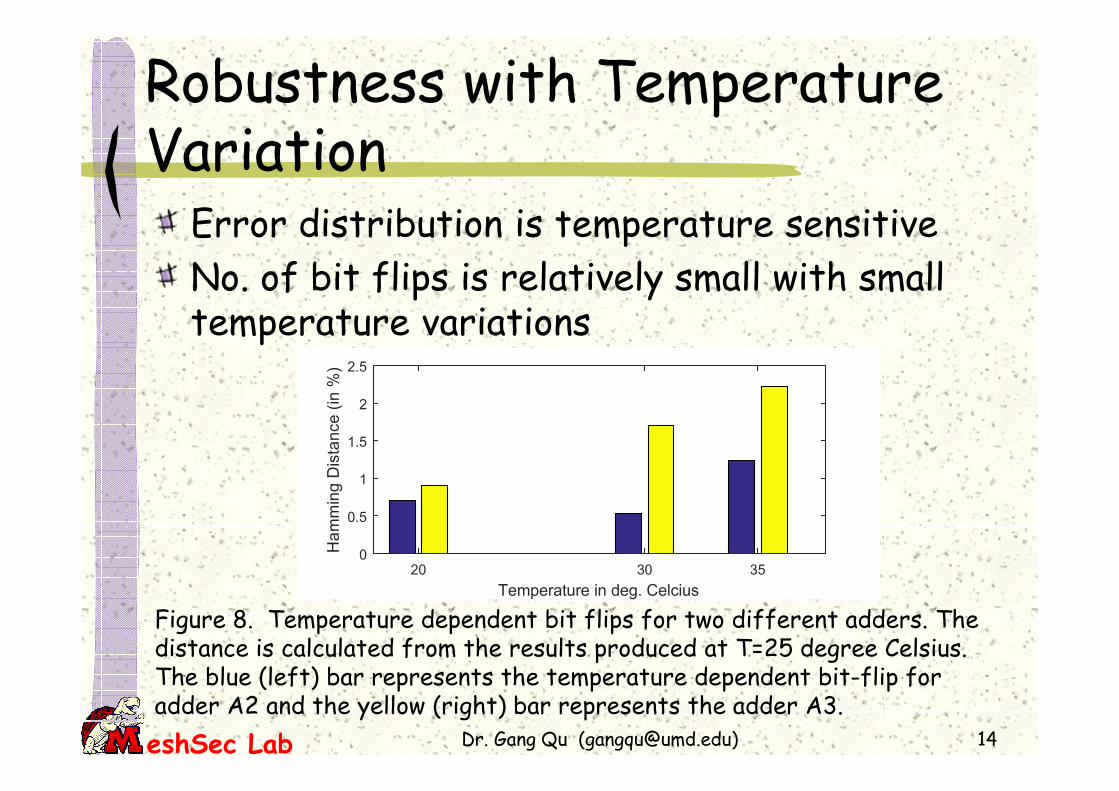
Robustness with Temperature Variation
Error distribution is temperature sensitive
No. of bit flips is relatively small with small temperature variations
Temperature in deg. Celcius
20 30 35
Ha
mm
ing
Dis
tan
ce
(in
%)
0
0.5
1
1.5
2
2.5
Dr. Gang Qu ([email protected]) 14
Figure 8. Temperature dependent bit flips for two different adders. The distance is calculated from the results produced at T=25 degree Celsius. The blue (left) bar represents the temperature dependent bit-flip for adder A2 and the yellow (right) bar represents the adder A3.
eshSec Lab
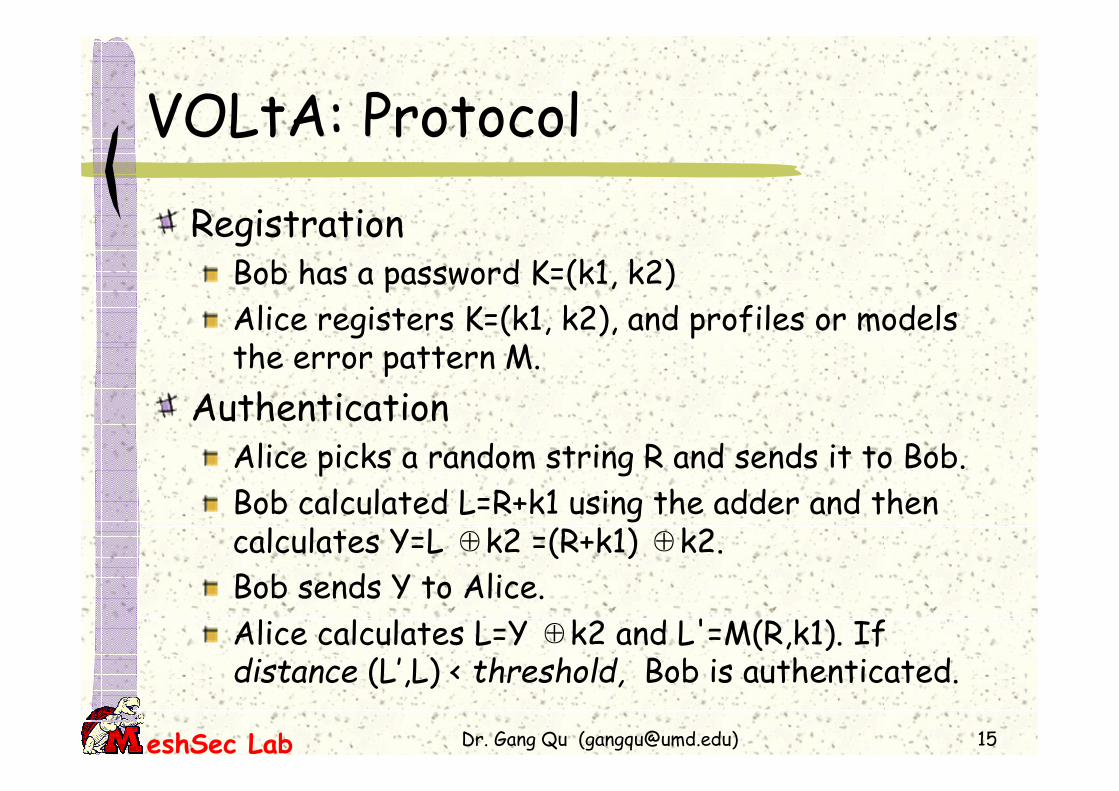
VOLtA: Protocol
RegistrationBob has a password K=(k1, k2)
Alice registers K=(k1, k2), and profiles or models the error pattern M.
AuthenticationAlice picks a random string R and sends it to Bob.
Bob calculated L=R+k1 using the adder and then calculates Y=L ⊕k2 =(R+k1) ⊕k2.
Bob sends Y to Alice.
Alice calculates L=Y ⊕k2 and L'=M(R,k1). If distance (L’,L) < threshold, Bob is authenticated.
Dr. Gang Qu ([email protected]) 15

eshSec Lab
VOLtA: Analysis
Effectiveness
Choice of Key
AttacksRandom Guessing
Eavesdropping
Side-channel Attack
Learning Attack
Dr. Gang Qu ([email protected]) 16

eshSec Lab
VOLtA: Illustrative Example
Example on Image ProcessingSuperimposition
(b) (c)(a)
Dr. Gang Qu ([email protected]) 17
Figure 4. An example of superimposing two images. We have used two gray scale images (a) trees and (b) snowflakes from MATLAB
library to generate the superimposed image (c) Snowfall.
(a) (b) (c)
(d) (e) (f)
eshSec Lab
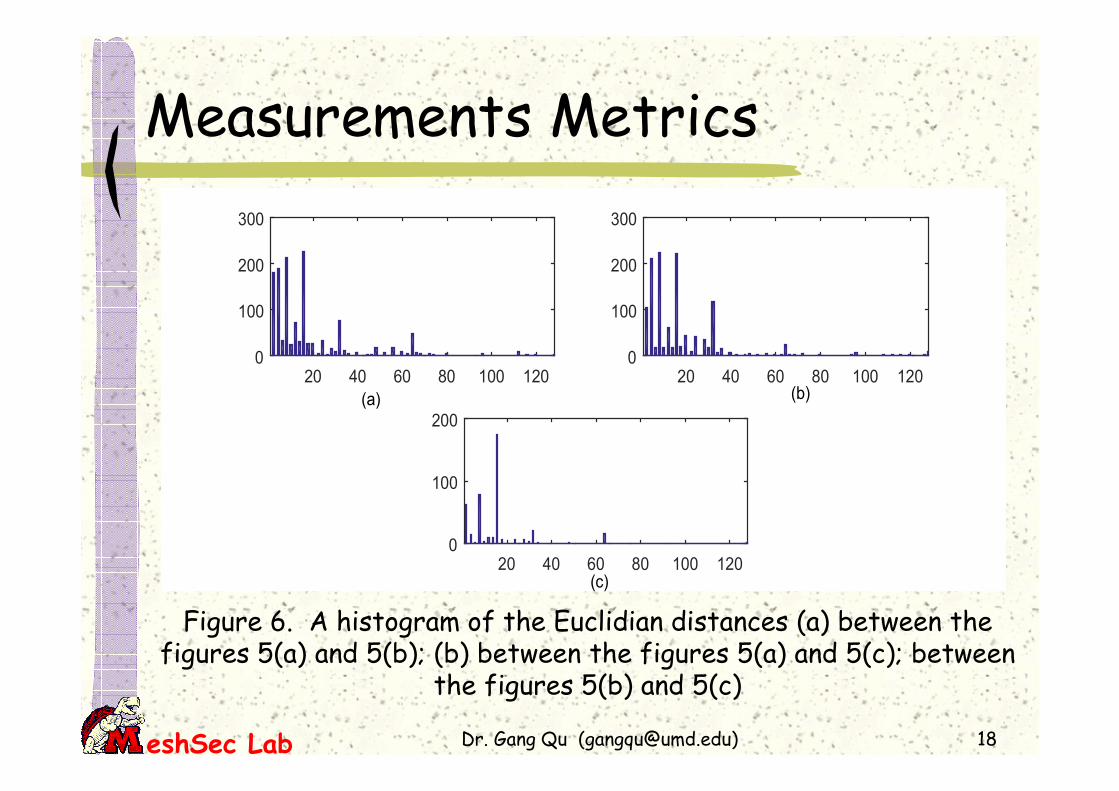
Measurements Metrics
20 40 60 80 100 1200
100
200
300
20 40 60 80 100 1200
100
200
300
20 40 60 80 100 1200
100
200
(c)
(a) (b)
Dr. Gang Qu ([email protected]) 18
Figure 6. A histogram of the Euclidian distances (a) between the figures 5(a) and 5(b); (b) between the figures 5(a) and 5(c); between
the figures 5(b) and 5(c)

eshSec Lab
Conclusions
Hardware for lightweight security in IoT
Voltage Over-ScalingA popular approximate computing method
Leaves a process variation dependent device signature in the approximate results
Drawbacks: information leak, deanonymization
�A new security primitive!
VOS based Device authenticationLightweight: low cost, (low level of) security
Good for certain IoT applications
Dr. Gang Qu ([email protected]) 19

eshSec Lab
AFOSR MURI under award number FA9550-14-1-0351.
Thank You!