volume 11 number 16 28 april 2015 pages 3085–3288 … 11 number 16 28 april 2015 pages...
TRANSCRIPT

Soft Matterwww.softmatter.org
ISSN 1744-683X
PAPERC. Benjamin Renner and Patrick S. Doyle Stretching self-entangled DNA molecules in elongational fi elds
Volume 11 Number 16 28 April 2015 Pages 3085–3288

Soft Matter
PAPER
Publ
ishe
d on
02
Febr
uary
201
5. D
ownl
oade
d by
Sta
nfor
d U
nive
rsity
on
20/0
5/20
15 2
0:19
:47.
View Article OnlineView Journal | View Issue
Stretching self-e
Department of Chemical Engineering, M
Cambridge, Massachusetts 02139, USA. E-m
† Electronic supplementary information (relaxation time, strain rate calibration,effects, and movies. See DOI: 10.1039/c4s
Cite this: Soft Matter, 2015, 11, 3105
Received 9th December 2014Accepted 1st February 2015
DOI: 10.1039/c4sm02738h
www.rsc.org/softmatter
This journal is © The Royal Society of C
ntangled DNA molecules inelongational fields†
C. Benjamin Renner and Patrick S. Doyle*
We present experiments of self-entangled DNA molecules stretching under a planar elongational field, and
their stretching dynamics are compared to identical molecules without entanglements. Self-entangled
molecules stretch in a stage-wise fashion, persisting in an “arrested” state for decades of strain prior to
rapidly stretching, slowing down the stretching dynamics by an order of magnitude compared to
unentangled molecules. Self-entangled molecules are shown to proceed through a transient state where
one or two ends of the molecule are protruding from an entangled, knotted core. This phenomenon
sharply contrasts with the wide array of transient configurations shown here and by others for stretching
polymers without entanglements. The rate at which self-entangled molecules stretch through this
transient state is demonstrably slower than unentangled molecules, providing the first direct
experimental evidence of a topological friction. These experimental observations are shown to be
qualitatively and semi-quantitatively reproduced by a dumbbell model with two fitting parameters, the
values of which are reasonable in light of previous experiments of knotted DNA.
1 Introduction
Advances in nanofabrication, microscopy, and molecularbiology have both motivated and enabled the direct observationof the static and dynamic properties of single DNA molecules.These experiments help guide applications such as direct linearanalysis1 or nanopore translocation2 for sequencing genomes.Experiments on single DNA molecules have a rich history inaddressing a number of fundamental questions in polymerphysics.3–5 Optical tweezers have been used to stretch mole-cules,6 and the data were well described by the theory of Markoand Siggia for semiexible chains.7 A wide range of microuidicdevices have been designed to actively manipulate DNA mole-cules with hydrodynamic ows or electric elds for analysis8,9
such as t-junctions,10 cross-slots,11–13 posts,14–16 contractions,17–19
and nano-scale slits20,21 and channels.22 In particular, cross-slotmicrouidic devices have been used as a way to stretch mole-cules without bulky probes for detection of specic DNAsequences23 or to understand the subsequent relaxation ofpolymers in slits24 or collapse of polymers in poor solvents.25
These devices have also been used to study the transientdynamics of polymer molecules in well-controlled elongationalows/elds, and experiments have revealed surprising cong-urational diversity26,27 and hysteresis in the coil–stretchtransition.28
assachusetts Institute of Technology,
ail: [email protected]
ESI) available: Channel schematic, DNAupper and lower extension thresholdm02738h
hemistry 2015
One of the most dramatic ndings of such experiments isthat polymer molecules unraveling in elongational ows do soat distinct rates that are largely controlled by a diverse set oftransient congurations,26,27 referred to as molecular individu-alism.29 These transient congurational classes, dumbbells,half-dumbbells, kinks, hairpins/folds, and coils, were investi-gated in the simulations of Larson and coworkers.30 Theyshowed that a bead-spring polymer model with only polymerconnectivity, hydrodynamic drag of the solvent, and Brownianuctuations can recreate the qualitative features of DNAexperiments. From an applications perspective, the intrinsicvariance in the rate of stretching DNA molecules due tomolecular individualism has complicated the design of ow-based stretching devices for DNA analysis. In response, cross-linked gels31 or post array32 “preconditioning” devices have beendeveloped to reduce this variability.
More recently, there has been a focus on how the topology ofa polymer molecule can affect polymer properties.33 Topologicalentanglements are found in biological contexts;34 knots occur inDNA conned to the tight spaces of viral capsids35,36 as well as infolded proteins.37 Simulations have investigated the statistics ofknots on polymers in conning geometries at equilibrium.38–40
In dynamical processes, simulations have indicated knots cansignicantly slow the ejection of viral DNA,41 slow or jam thesequencing of DNA through nanopores,42 and reduce the rate atwhich a protein is digested by the proteasome.43 Theory sug-gested that topological entanglements can arrest the swelling ofpolymer globules,44 and simulations supported this idea.45,46
More recently, Tang et al. reported an experimental techniquefor compressing DNA with electric elds and demonstrated an
Soft Matter, 2015, 11, 3105–3114 | 3105

Soft Matter Paper
Publ
ishe
d on
02
Febr
uary
201
5. D
ownl
oade
d by
Sta
nfor
d U
nive
rsity
on
20/0
5/20
15 2
0:19
:47.
View Article Online
arrested state prior to expanding back to a swollen coil, whichthey attributed to self-entanglements.47
In this work, we present experiments in which DNA moleculesare initially preconditioned to a self-entangled state and are thensubjected to a planar elongational eld. We compare these resultswith DNA molecules which are stretched in a planar elongationaleld starting from an equilibrium (unentangled) state. We ndsubstantial differences between these two cases, and we quantifythese differences by analyzing their different rates of stretching.Finally, we present a simple model that is shown to semi-quan-titatively capture the mean stretching behavior of the self-entan-gled molecules in our experiments.
Fig. 1 Schematic for stretching self-entangled DNA. (a) A molecule isbrought to an inlet arm and allowed to equilibrate for �30 s with noapplied field. (b) A square-wave AC electric field (F�) of strength Erms¼200 V cm�1 and frequency f ¼ 10 Hz is turned on for 30 s to compressand self-entangle a molecule in the channel arm. (c) The elongationalfield is switched on (F+ > Fo), and the self-entangled molecule rapidlytranslates to the stagnation point and is trapped there. (d) The mole-cule stretches some time after the translation step shown in (c).
2 Experimental methods
The experimental buffer consisted of 4% (vol) b-mercaptoetha-nol (BME, Cabiochem), 0.1% 10 kDa polyvinylpyrrolidone (PVP,Polysciences) in 0.5� Tris–borate–EDTA (TBE, Accugene).T4GT7 DNA (165.6 kbp, Wako) and l-DNA (48.502 kbp, NewEngland Biolabs) were uorescently labeled with YOYO-1intercalating dye (Invitrogen) at a 4 : 1 base pair to dye ratio inthe experimental buffer, leading to a nal contour length of75 mm, 38% larger than bare DNA.48 This mixture was allowed tostain for 12–48 hours prior to viewing. Cross-slot channels, 1.65mm in height, were manufactured in PDMS (Sylgard 184, DowCorning) using so lithography on a silicone master template(SU8-2 photoresist). Channels were soaked overnight in theexperimental buffer at 40 �C to mitigate permeation-drivenow,31 quickly rinsed with RO water, dried with argon, andsealed to a glass cover slide. Stained DNA solutions were dilutedin the experimental buffer 10 to 25-fold for optimal viewingconcentrations and loaded in the channel reservoirs. Thechannel was ushed with buffer for a minimum of 30 minutesprior to collecting data via the application of a moderate (�50 V)electric potential at the reservoirs.
A planar elongational eld may be used to linearize acharged macromolecule such as DNA,12,49,50 and the kinematicsof this eld are described by the following equation:
Vx ¼ _3x; Vy ¼ �_3y (1)
where Vx and Vy are the x and y components of velocity and _3 isthe strain rate of the eld. We used a cross-slot device togenerate a homogeneous elongational eld within a �100 �100 mm eld of view. The strain rate was controlled by varyingthe voltages applied at the reservoirs. Molecules were trapped atthe metastable stagnation point at the center of the eld bymanually perturbing the potential (�2 V) of the right reservoir.See the ESI† for device layout and strain rate calibration curve.
For a molecule in an elongational ow or eld, the relevantdimensionless group is the Deborah number, De h _3l, where lis the longest relaxation time of the polymer molecule. In suchelds, a polymer will undergo the coil–stretch transition at Decz 0.5, and the critical strain rate for the onset of this transition
is 3:c ¼ 1
2l. The longest relaxation time of DNA was measured as
l ¼ 2.6 s by tting the long time decay of the autocorrelation
3106 | Soft Matter, 2015, 11, 3105–3114
function of orientation angles of DNA molecules at equilib-rium51 (see ESI†).
For molecules with unentangled initial conditions, themolecule was brought to the stagnation point and there allowedto relax for �30 s > 10l, allowing the molecule to thoroughlysample its equilibrium congurations. The elongational eldwas then turned on, and the molecule was stretched. Theprocedures for generating the initial self-entangled molecularstates are more complex and are shown in Fig. 1. For a self-entangled initial condition, the molecule was brought to achannel arm and allowed to relax for �30 s. An AC square-waveelectric eld of strength Erms ¼ 200 V cm�1 and frequency f¼ 10Hz was applied for 30 s to compress and self entangle a mole-cule in a fashion demonstrated by Tang et al.47 Aer entangle-ment, the reservoir potentials were switched to generate anelongational eld, and the molecule was quickly (<5 s) sweptinto the straining region of the device. The molecule was held inthis region until it stretched.
3 Results and discussion3.1 Differences due to entanglements
Representative snapshots of the initial, transient, and fullystretched congurations of both initially unentangled and self-entangled molecules are shown in Fig. 2. Several stark differ-ences between the stretching processes for each type of mole-cule are immediately apparent. The initial congurations forunentangled molecules are visually diverse and somewhatanisotropic since the molecules are exploring the full congu-rational space of a polymer in a good solvent prior to the onsetof the eld. The initial conditions of the self-entangled mole-cules are highly isotropic “globules,” and the important
This journal is © The Royal Society of Chemistry 2015

Fig. 2 Snapshots of initially unentangled and self-entangled mole-cules stretching under an electric field of De ¼ 2. The white arrowsindicate the presence of a persistent, localized knot along the fullystretched contour of the DNA molecule. The white numbers are theaccumulated strain experienced in each snapshot.
Fig. 3 Extension vs. strain trajectories for initially unentangled (top)and self-entangled (bottom) DNA at De¼ 2. The snapshots to the rightcorrespond to the bolded trace in each graph. The white numbers arethe accumulated strain experienced in each snapshot. The reportedextension is the maximum distance along the extensional axis of twopoints on the molecule, indicated in the snapshots. Note the differentscales of the x-axes.
Paper Soft Matter
Publ
ishe
d on
02
Febr
uary
201
5. D
ownl
oade
d by
Sta
nfor
d U
nive
rsity
on
20/0
5/20
15 2
0:19
:47.
View Article Online
differences between their individual congurations exist at alength scale smaller than can be resolved by uorescencemicroscopy. It is important to emphasize that the subsequentdifferences in stretching behavior of unentangled and self-entangled molecules arise solely due to these differences in theinitial conditions. The so-called “half-dumbbell”, “kink”,“hairpin/fold”, and “dumbbell” congurations emerge as tran-sient congurations of unentangled molecules. This phenom-enon as well as the corresponding differences in the rates ofstretching grouped by transient congurational class is the keyconcept behind molecular individualism. The transient cong-urations of self-entangled molecules are less diverse, all con-sisting of a knotted core from which one or two ends of thechain unravel. The differences between initially unentangledand self-entangled molecules even persist in their fullystretched conformations. While absent in the vast majority ofunentangled molecules, a region of increased uorescence(indicated with arrows) can be seen in the stretched confor-mation of an initially self-entangled molecule. These regionsare persistent and suggest that a topological knot has beenpulled tight in the chain. See the ESI† for movies initiallyunentangled and self-entangled molecules stretching.
Selected trajectories of extension versus strain are plotted forboth initially unentangled and self-entangled DNAmolecules inFig. 3. The trajectories of initially unentangled moleculesdemonstrate that their stretching dynamics are progressive – themolecule orients, aligns, and immediately begins stretchinguntil fully extended. Initially self-entangled molecules exhibitstage-wise stretching dynamics – the molecule persists in a lowextension arrested state before rapidly stretching. The
This journal is © The Royal Society of Chemistry 2015
snapshots corresponding to the bolded trajectory in each plotare shown on the right further illustrate this point. The unen-tangled molecule immediately begins stretching, and within 2units of strain, the transient “dumbbell” conguration can beeasily seen. The self-entangled molecule persists in its arrestedstate until a strain of 15. At a strain of 15, the nascent ends ofthe molecule can be seen to rst clearly protrude from thehighly knotted core. This event immediately precedes the onsetof a comparably rapid stretching phase of this molecule,indicative of a nucleation phenomenon. Nearly all molecules inexperiments follow this general nucleation then stretchbehavior, a phenomenon with qualitative similarities to theonset of stretching in collapsed polymers in elongationalows.52,53
In Fig. 4, stretching trajectories are shown for both unen-tangled (red) and self-entangled (blue) molecules unraveling inelongational elds of De ¼ 1, 2, 2.9, and 5. The immediatedifference in time scales associated with stretching the twopopulations is evident at all eld strengths, indicating that evenat relatively strong elds of De ¼ 5, the presence of topologicalrestrictions can dramatically slow the stretching process. At alleld strengths, the trajectories clearly indicate signicant dis-persity in the times to reach a fully stretched conformation forboth initially unentangled and self-entangled molecules. Forunentangled molecules, this dispersity is referred to as molec-ular individualism and can be largely associated with thedifferences in transient congurations. For initially self-entan-gled molecules, the variation in the time to fully stretch amolecule arises almost entirely from the different lengths oftime spent in the arrested state.
Soft Matter, 2015, 11, 3105–3114 | 3107

Fig. 4 Extension vs. strain trajectories for initially unentangled (left) or self-entangled (right) DNA for all Deborah numbers (De¼ 1, 2, 2.9, and 5) inthis study.
Fig. 5 Experimental trajectories are decomposed into three stages:arrested, stretching, and extended. (top) The molecule is “arrested”until its extension passes and remains above a lower extensionthreshold. Afterwards, the molecule is “stretching” until its extensionpasses an upper extension threshold for the first time. A molecule isconsidered stretched thereafter. The extension thresholds werechosen empirically to best segregate the phases. The lower extensionthreshold used was 10 mm. The upper extension threshold was chosenas 30, 42, 46, or 50 mm for De ¼ 1, 2, 2.9, and 5, respectively.
Soft Matter Paper
Publ
ishe
d on
02
Febr
uary
201
5. D
ownl
oade
d by
Sta
nfor
d U
nive
rsity
on
20/0
5/20
15 2
0:19
:47.
View Article Online
3.2 Stage-wise decomposition of trajectories
The images and trajectories in Fig. 2–4 all indicate a stage-wisestretching of a self-entangled molecule. In general, eachtrajectory can be decomposed into three distinct stages: ametastable arrested state, a transient stretching phase, and anextended steady state, shown in Fig. 5. We now present themethod by which we algorithmically dened these stages for allexperimental trajectories.
The arrested state is the initial phase of a molecule, and themolecule is considered to remain in this state until its extensionpermanently passes a lower extension threshold. The durationof the arrested state is deemed the nucleation time, denotedtnuc, since the end of the arrested state corresponds to thenucleation events described in the previous section. To bestdelineate the arrested state from the stretching phase, the valuefor the lower extension threshold should be chosen to be thesmallest extension where molecules all immediately stretchupon passing the threshold for the last time. A value of 10 mmwas found to be suitable for our ensemble of experimental data.
The stretching phase of the molecule begins at the end of thearrested state and continues until the extension of the moleculepasses an upper extension threshold. The value of the upperextension threshold is again chosen so that all molecules in theensemble continue to stretch rapidly. As the steady stateextension of DNA is a function of De, this parameter, too, is afunction of De. Values for the upper extension threshold of 30,42, 46, and 50 mm for De ¼ 1, 2, 2.9, and 5 were used in thefollowing analysis. Both the upper and lower extensionthresholds were chosen empirically to best segregate thephases.
In Fig. 6, the distributions of nucleation times are shown forboth unentangled and self-entangled molecules. The x-axes ofthese distributions are scaled by the here-called “excess strain”rate. The strain, _3t, time scaled by the strain rate, relates theexponential increase in separation between tracers alongstreamlines in an elongational eld, x(t + dt) ¼ x(t)exp(_3dt). Theexcess strain, (_3 � _3c)t, time scaled by the strain rate exceedingthe onset of the coil–stretch transition, relates the exponentialincrease in separation between two points connected by aHookean spring with the same entropic elasticity as the DNA
3108 | Soft Matter, 2015, 11, 3105–3114
molecule, x(t + dt) ¼ x(t)exp((_3 � _3c)dt). This quantity has beenshown to reasonably scale the stretching kinetics in experi-ments26,27 and nucleation-type behavior of the coil stretch
This journal is © The Royal Society of Chemistry 2015

Fig. 6 Probability distributions of the excess strain required tonucleate (begin stretching) a molecule for initially unentangled (left)and self-entangled (right) DNA at all Deborah numbers (De ¼ 1, 2, 2.9,and 5) in this study. The excess strain to nucleate is defined as (_3 � _3c)tnuc. Note the different scales for the x-axes.
Paper Soft Matter
Publ
ishe
d on
02
Febr
uary
201
5. D
ownl
oade
d by
Sta
nfor
d U
nive
rsity
on
20/0
5/20
15 2
0:19
:47.
View Article Online
transition in simulations.54 In Fig. 6, the x-axes thus correspondto the amount of excess strain accumulated until the nucleationevent occurs at tnuc, i.e. (_3 � _3c)tnuc.
For initially unentangled molecules, the “nucleation time,”also called the transition time by others,54 represents the timerequired for a molecule to begin to align, orient, and immedi-ately stretch to the lower extension threshold. Although thisprocess is fundamentally different than the nucleation-typeevents seen in initially self-entangled molecules, we will use theterm “nucleation time,” still the time required to pass the 10 mmlower extension threshold, for the sake of consistency. Thedistributions of nucleation times for unentangled moleculesappear to be properly scaled by the excess strain, in agreementwith the simulations results of Cifre and de la Torre.54 For alleld strengths, �1.5 “excess strain” is the characteristic quan-tity required to nucleate the unentangled molecules, and�3 “excess strain” is approximately the characteristic width ofthe distributions. The simulations of Cifre and de la Torre54
found (_3 � _3c)httransi ¼ 3.23 � 0.04, where (_3 � _3c)httransi isanalogous to the nucleation time of an unentangled molecule.This result appeared universal for ideal chains or chains withexcluded volume as well as chains with and without hydrody-namic interactions. However, the results of these simulationsshow some disagreement with our result of 1.5, the reason forwhich is not immediately clear.
For initially self-entangled molecules, the nucleation timerepresents the time for the ends of the molecule to free them-selves from an entangled core a sufficient distance to initiatestretching. The distributions of nucleation times for initiallyself-entangled molecules are similarly scaled by the excess
This journal is © The Royal Society of Chemistry 2015
strain rate, and interestingly, this quantity appears to be able toreasonably scale these distributions as well, although thephysical reason is not as clear. For all eld strengths,�15 excessstrain is required to stretch these tangled globules and thewidth of the distributions is �30 excess strain. These quantitiesare an order of magnitude larger than their counterparts ininitially unentangled molecules, underscoring the fundamen-tally different physics in the arrested state that is present in theself-entangled molecules.
We now turn our attention to the stretching phase. Thedistributions of nucleation times in Fig. 6 are useful in quan-tifying the differences between the initially unentangled andself-entangled populations, but the main result, the existence ofa the arrested state in self-entangled molecules, is alreadyapparent when viewing the images in Fig. 2 or the trajectories inFig. 3 and 4. Less obvious, however, are the differences in therapid stretching phase between the two populations. Using thedecomposition criteria described in Fig. 5, the stretching phaseof each molecule can be separated from the prior nucleationprocess. This decomposition affords the ability to indepen-dently analyze this phase.
In Fig. 7a, trajectories of the stretching phase for initiallyself-entangled molecules are shown at a eld strength of De¼ 2.From the ensemble of trajectories, a master stretching curvewas created by sorting the extensions of themolecules into 2 mmbins and calculating the average strain of all trajectories as theypass through each bin. Such a master curve is shown super-imposed over the underlying trajectories in Fig. 7a.
The process of generating master stretching curves wasrepeated for all initial conditions and eld strengths. Thesecurves are plotted versus excess strain in Fig. 7b. The affect ofvarying the lower and upper extension thresholds is shown inthe ESI.† For both initially unentangled and self-entangledmolecules, the master curves collapse when scaled by theexcess strain, consistent with previous experiments of unen-tangled molecules in extensional ows.27 Interestingly,initially self-entangled molecules stretch �50% more slowlythan initially unentangled molecules. Initially self-entangledmolecules appear to have a localized, knotted core thatshrinks and is tightened during stretching, as can be seen inFig. 2, 3b, and 5. However, such a structure is very rare instretching unentangled molecules. It follows that the differ-ence in the rate of stretching between initially unentangledand self-entangled molecules corresponds to this topologicaldifference. In other words, pulling the strands through atangled core introduces and additional “topological friction”into the stretching process. The concept that knots canintroduce an effective topological friction has been seen incomputer simulations of knots slowing (or even jamming) thetranslocation of DNA through nanopores,42 the ejection ofviral capsids,41 and the pulling of knotted proteins throughthe proteasome.43 To our knowledge, the results in Fig. 7b arethe rst direct experimental observation that is suggestive ofthe phenomena of topological friction due to a knotteddomain at the molecular scale.
Aer exiting the stretching window, a molecule will remainin an extended state as long as the elongational eld is applied.
Soft Matter, 2015, 11, 3105–3114 | 3109
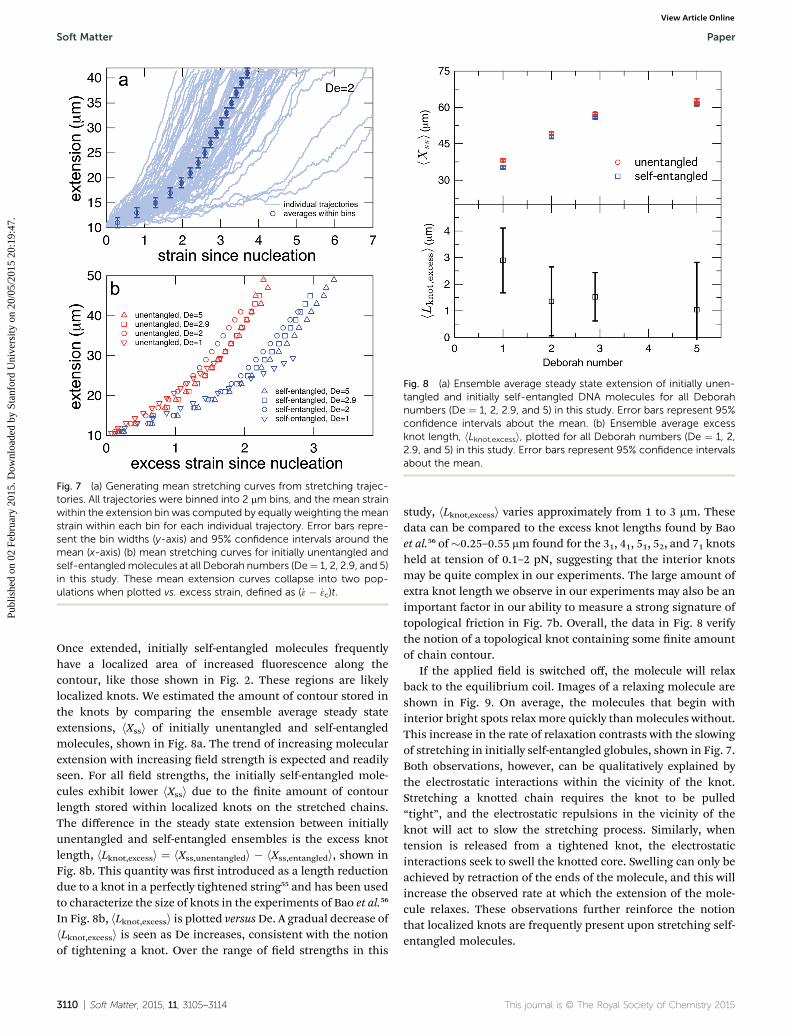
Fig. 8 (a) Ensemble average steady state extension of initially unen-tangled and initially self-entangled DNA molecules for all Deborahnumbers (De ¼ 1, 2, 2.9, and 5) in this study. Error bars represent 95%confidence intervals about the mean. (b) Ensemble average excessknot length, hLknot,excessi, plotted for all Deborah numbers (De ¼ 1, 2,2.9, and 5) in this study. Error bars represent 95% confidence intervalsabout the mean.
Fig. 7 (a) Generating mean stretching curves from stretching trajec-tories. All trajectories were binned into 2 mm bins, and the mean strainwithin the extension bin was computed by equally weighting the meanstrain within each bin for each individual trajectory. Error bars repre-sent the bin widths (y-axis) and 95% confidence intervals around themean (x-axis) (b) mean stretching curves for initially unentangled andself-entangledmolecules at all Deborah numbers (De¼ 1, 2, 2.9, and 5)in this study. These mean extension curves collapse into two pop-ulations when plotted vs. excess strain, defined as (_3 � _3c)t.
Soft Matter Paper
Publ
ishe
d on
02
Febr
uary
201
5. D
ownl
oade
d by
Sta
nfor
d U
nive
rsity
on
20/0
5/20
15 2
0:19
:47.
View Article Online
Once extended, initially self-entangled molecules frequentlyhave a localized area of increased uorescence along thecontour, like those shown in Fig. 2. These regions are likelylocalized knots. We estimated the amount of contour stored inthe knots by comparing the ensemble average steady stateextensions, hXssi of initially unentangled and self-entangledmolecules, shown in Fig. 8a. The trend of increasing molecularextension with increasing eld strength is expected and readilyseen. For all eld strengths, the initially self-entangled mole-cules exhibit lower hXssi due to the nite amount of contourlength stored within localized knots on the stretched chains.The difference in the steady state extension between initiallyunentangled and self-entangled ensembles is the excess knotlength, hLknot,excessi ¼ hXss,unentangledi � hXss,entangledi, shown inFig. 8b. This quantity was rst introduced as a length reductiondue to a knot in a perfectly tightened string55 and has been usedto characterize the size of knots in the experiments of Bao et al.56
In Fig. 8b, hLknot,excessi is plotted versusDe. A gradual decrease ofhLknot,excessi is seen as De increases, consistent with the notionof tightening a knot. Over the range of eld strengths in this
3110 | Soft Matter, 2015, 11, 3105–3114
study, hLknot,excessi varies approximately from 1 to 3 mm. Thesedata can be compared to the excess knot lengths found by Baoet al.56 of�0.25–0.55 mm found for the 31, 41, 51, 52, and 71 knotsheld at tension of 0.1–2 pN, suggesting that the interior knotsmay be quite complex in our experiments. The large amount ofextra knot length we observe in our experiments may also be animportant factor in our ability to measure a strong signature oftopological friction in Fig. 7b. Overall, the data in Fig. 8 verifythe notion of a topological knot containing some nite amountof chain contour.
If the applied eld is switched off, the molecule will relaxback to the equilibrium coil. Images of a relaxing molecule areshown in Fig. 9. On average, the molecules that begin withinterior bright spots relax more quickly thanmolecules without.This increase in the rate of relaxation contrasts with the slowingof stretching in initially self-entangled globules, shown in Fig. 7.Both observations, however, can be qualitatively explained bythe electrostatic interactions within the vicinity of the knot.Stretching a knotted chain requires the knot to be pulled“tight”, and the electrostatic repulsions in the vicinity of theknot will act to slow the stretching process. Similarly, whentension is released from a tightened knot, the electrostaticinteractions seek to swell the knotted core. Swelling can only beachieved by retraction of the ends of the molecule, and this willincrease the observed rate at which the extension of the mole-cule relaxes. These observations further reinforce the notionthat localized knots are frequently present upon stretching self-entangled molecules.
This journal is © The Royal Society of Chemistry 2015

Fig. 9 Relaxation of a stretched DNA molecule. Selected snapshotsfor an initially unentangled and self-entangled molecule relaxing afterthe shutoff of the field.
Paper Soft Matter
Publ
ishe
d on
02
Febr
uary
201
5. D
ownl
oade
d by
Sta
nfor
d U
nive
rsity
on
20/0
5/20
15 2
0:19
:47.
View Article Online
3.3 Modeling stretching dynamics of entangled DNA
The preceding discussion has emphasized key differences instretching of initially self-entangled and unentangled DNA,both qualitative (initial, transient, and stretched congura-tions) and quantitative (nucleation times and stretching rates)in nature. Here, we lay out a physical framework that isconsistent with these observations, and show that a simpledumbbell model motivated by this framework can semi-quan-titatively capture the mean nucleation times and stretchingcurves for the experimental data.
Consider a highly self-entangled blob. The topologicalentanglements can be thought to form a transient networkstructure. In order to stretch such a blob, this network must beresolved by transporting contour from a centrally entangledregion to an unentangled region near the ends of the molecule.We suggest that this transport can occur via two mechanisms:(i) diffusive release of entanglements via cooperative motions ofthe DNA ends and entangled loops and (ii) convective transportof contour to the ends via pulling contour out of the centralentangled region. This process will result in the gradual “so-ening” of an initially inextensible blob until so enough to beextended by the ow, which could reproduce the initial arrestedstate.
We will seek to model this process by the stretching of asingle non-Brownian dumbbell. The contour of the molecule ispartitioned into both “free” and “entangled” regions such thatLf + Le ¼ Lc, where Lf, Le, and Lc are the contour lengths of thefree portion, entangled portion, and entire molecule, respec-tively. We will consider only the free portion of the molecule asbeing able to directly interact with the external eld. The beadsof the dumbbell, therefore, have drag coefficients that vary as
zf ¼ z
�LfLc
�. Here, z¼ 4Hl is the total drag on the DNAmolecule
This journal is © The Royal Society of Chemistry 2015
at equilibrium and H ¼ 3kBT2lpLc
is spring constant of the totalmolecule.49
Given the concept of a varying length of extensible contour,the Deborah number, De ¼ _3l, cannot describe the transientdynamics of an entangled strand; the relaxation time, l is thatof unentangled state. We therefore dene a “free” Deborahnumber as
Def ¼ De
�Lf
Lc
�2
(2)
as an estimate for the effective dumbbell of containing Lf lengthof contour, assuming a freely-draining dumbbell. For a xed _3,De is constant while Def changes in time as Lf changes from asmall fraction of Lc to nearly the entire contour length of themolecule as contour is progressively freed. Given an initiallyhighly entangled state, Lf z 0, Def will progress from Def z 0 attime t ¼ 0 to Def ¼ De as time t/N. The dumbbell will persistin a low extension (coiled) state until Def z 0.5, giving rise to anapparent arrested state.
We now turn to the specics of the model that give rise to theevolution equation of the total extension of the molecule. Theinitially entangled state is considered to have an extensionbetween the ends of Xknot ¼ 1.6 mm (experimental diameter ofgyration), and we assume that the extension in this region doesnot change. We consider the free contour on each end to betethered to this inextensible core. The cumulative extension ofboth ends from their tethers is R, and the total extension of themolecule is R + Xknot. By neglecting inertia, the evolutionequation for the dumbbell becomes
dðRþ XknotÞdt
¼�ðRþ XknotÞ � 0:5
Deff
�R
Lf
�R
�3:
(3)
where
f
�R
Lf
�¼
�Lf
6R
�"�1� R
Lf
��2
þ 4R
Lf
� 1
#(4)
is the dimensionless force law for a wormlike chain of fractional
extensionRLf. The rst term in the right hand side of eqn (3)
corresponds to the affine deformation of two points separatedby R + Xknot, and the second term slows this deformation rate
due to a nonlinear spring of fractional extensionRLf.
In order to solve eqn (3), an expression for Lf(t) is needed. Weconsider two factors can free entangled contour from theknotted core: (i) cooperative diffusion of the ends and knot and(ii) “pulling” of the ends out of the globule by the external ow.While both factors (particularly (i)) are quite complex in reality,we considered the simplest estimates of each for the purpose ofthis model, described as follows.
We estimate the rate of diffusive release of entangledcontour to the free ends as
Lf ;diffðtÞ ¼ffiffiffiffiffiffiffiffiffiffiffiffiDknott
pwhile Def\0:5; (5)
where Dknot is diffusion coefficient for release of contour, t is theresidency time in the elongational eld. The constraint on Def
Soft Matter, 2015, 11, 3105–3114 | 3111

Fig. 10 (a) Stretching curves for generated by the model all Deborahnumbers (De¼ 1, 2, 2.9, and 5) in this study with d¼ 0.5z andDknot¼ 22mm2 s�1. Note the presence of an arrested state followed by a rapidstretching phase and finally a fully extended state. (b) Comparison ofthe rates of stretching for curves in themodel vs. the experimental datafrom Fig. 7b. Error bars represent the bin widths (y-axis) and 95%confidence intervals around the mean (x-axis). (c) Comparison of thenucleation times from the model vs. the mean nucleation time fromthe data in Fig. 6. Error bars represent 95% confidence intervals aroundthe mean (y-axis).
Soft Matter Paper
Publ
ishe
d on
02
Febr
uary
201
5. D
ownl
oade
d by
Sta
nfor
d U
nive
rsity
on
20/0
5/20
15 2
0:19
:47.
View Article Online
prevents the diffusive release of contour once the dumbbellstretches and the entangled globule is localized. In this scenario(Def < 0.5), the ends have been extended and cannot easilyfurther relax knots via diffusion.
We estimate the rate at which contour is pulled out of theentangled center due to the eld is
Lf ;pullðtÞ ¼ 1
d
ðt0
Fspringdt0; (6)
where d is a topological friction coefficient and Fspring is thetime-dependent stretching force experienced by thedumbbell.
The total contour that has been freed from the initiallyentangled globule is then written as
Lf(t) ¼ min(Lf,diff(t) + Lf,pull(t), Lc � Xknot), (7)
where Xknot now represents the contour remaining in the knoton a fully stretched strand, which is taken to be approximatelythe initial diameter of gyration of the entangled globule Xknot ¼1.6 mm.
Eqn (7) was solved simultaneously with eqn (5) and (6) via amidstepping Euler integration scheme. The resulting stretchingcurves are shown in Fig. 10a. These curves qualitatively repro-duce three key experimental ndings. (1) Each curve persists inan arrested state for some time. (2) The duration of the arrestedstate decreases as De increases. (3) The arrested state is followedby a rapid stretching phase.
The values of d¼ 0.5z and Dknot ¼ 22 mm2 s�1 were chosen tobest match the ensemble average nucleation times and themaster stretching curves from experiments. The results fromthe model are compared to the experimental results for averagenucleation times andmaster stretching curves in Fig. 10b and c.The model does predict a slowed rate of stretching, seen inFig. 10b. It captures the slowed rate of stretching well at highDe, but fails to capture the experimental curve at De ¼ 1. Thisdiscrepancy is likely due to the documented difficulty in asimple dumbbell model in capturing polymer dynamics overranges of De (regardless of entanglements); additionalcomplexity such as congurationally dependent drag is oenneeded to capture this behavior.57 The model and experimentnd good agreement for the average nucleation time over theentire range of eld strengths, De ¼ 1, 2, 2.9, and 5, seen inFig. 10c. This quantity depends only on the rate of diffusiverelease of the contour coupled with convective release due toow on a globule of low and nearly constant extension, furthersupporting the notion that congurationally dependent dragcauses the discrepancy in Fig. 10b.
Given the simplicity of the dumbbell model, the results inFig. 10 are encouraging. We now turn to discuss the limitationsof this modeling approach. Foremost, by seeking to captureaverage properties, this model ignores the wealth of informa-tion encoded in the distributions of nucleation times orstretching rates. This issue seems likely intractable by anymodel of such simplicity. Fine-scaled simulations by Larsonand others30 were the rst successful attempt to recreate thequalitative congurational classes seen in the molecular
3112 | Soft Matter, 2015, 11, 3105–3114
individualism experiments.26,27 We expect that even ner-grained simulations that preserve the topology of individualentanglements will be necessary to make further progress intoour experimental work. Also, the assumptions of constantdiffusion coefficients and friction coefficients for the diffusiveand convective transport of contour out of the entangledstructure are oversimplications. Both the rate of disentanglingand the friction of pulling an end through an entangled core
This journal is © The Royal Society of Chemistry 2015

Paper Soft Matter
Publ
ishe
d on
02
Febr
uary
201
5. D
ownl
oade
d by
Sta
nfor
d U
nive
rsity
on
20/0
5/20
15 2
0:19
:47.
View Article Online
should be functions of the entangled state, but the functionaldependence of each is likely complex and not presently clear.
We now seek to put the values of d¼ 0.5z and Dknot ¼ 22 mm2
s�1 in proper context. With similar experimental conditions,Tang et al.47 found the relaxation of an initially entangledmolecule to the equilibrium state to proceed via a two stageprocess with average durations of 19.7 s and 20 s, giving a totaldisentanglement time of �40 s. From our model, the value ofDknot ¼ 22 mm s�1 would give a characteristic time of
sunknot zLc2
Dknot¼ 256 s:While this discrepancy appears large at
rst, it can be understood in context of experimental results.The 40 s disentanglement time of Tang et al.47 corresponds tothe average time when the uctuations and size of the moleculeare indistinguishable from the equilibrium state under noexternal forces. In Fig. 10, the experimental nucleation time forDe ¼ 1 is �80 s. These results suggest that in the process ofdisentangling a molecule under no eld, there exists a period oftime where measurements of the molecule approach theirequilibrium values, yet entanglements signicant enough toaffect an out of equilibrium process remain. This observationunderscores the well-established fact that dynamical measure-ments, such as stretching a molecule in an elongational eld,can provide a wealth of information beyond that provided byexperiments at equilibrium.
The value of d ¼ 0.5z means that pulling contour out of theentangled glob experiences an additional friction of approxi-mately half the total friction coefficient of the molecule. Thisvalue appears eminently reasonable given the cooperativenature of pulling segments through a topological knot. Ourvalue of d can be estimated with units as
d ¼ 0:5z ¼ 2l3kBT2lpLc
¼ 8:6 pN ðmm s�1Þ�1: In experiments
where knots of specic topologies were tied with optical twee-zers, Bao et al.56 were able to directly measure the frictioncoefficients of knots via the diffusivities of the knot along anextended contour. They found frictions of �3–8 pN (mm s�1)�1
for the 31, 41, 51, 52, and 71 knots, and it is interesting to note thesimilarity between our results and their measured frictioncoefficients.
4 Conclusion
We have presented a systematic study comparing the rates atwhich initially unentangled and self-entangled DNA moleculesstretch while in elongational elds. These experiments revealedtwo striking qualitative differences between their stretchingpathways. For initially self-entangled molecules, there existsand initial topologically stabilized arrested state leading tonucleation-type behavior aer which molecules stretch at aslowed rate due to interior knots. The herein observed slowedrate of stretching represents the rst direct experimentalevidence of a topological friction in polymer molecules, seenrecently in computer simulations of driven knots.58 Wesystematically characterized the nucleation times and stretch-ing rates over a variety of eld strengths. Guided by thisexperimental data, we developed a simple dumbbell model
This journal is © The Royal Society of Chemistry 2015
which consists of a gradually soening spring due to diffusiveand convective release of contour from the knot. This model isable to semi-quantitatively capture both the average nucleationtime and stretching dynamics of an initially self-entangledmolecule, reinforcing the key physics in play. Looking forward,we anticipate this approach will stimulate future work onexpanding the model in more detail, possibly through the use ofne-grained dynamical computer simulations. From an exper-imental point of view, we hope our work motivates furtherexperimental studies of knotted polymers, such as knotted DNAin nano-scale conning geometries or knotted DNA driventhrough nanopores.
Acknowledgements
This work is supported by the Singapore-MIT Alliance forResearch and Technology (SMART) and National ScienceFoundation (NSF) grant CBET-1335938.
References
1 Y. Michaeli and Y. Ebenstein, Nat. Biotechnol., 2012, 30, 762–763.
2 J. Clarke, H.-C. Wu, L. Jayasinghe, A. Patel, S. Reid andH. Bayley, Nat. Nanotechnol., 2009, 4, 265–270.
3 E. Shaqfeh, J. Non-Newtonian Fluid Mech., 2005, 130, 1–28.4 M. D. Graham, Annu. Rev. Fluid Mech., 2011, 43, 273–298.5 A. B. Marciel and C. M. Schroeder, J. Polym. Sci., Part B:Polym. Phys., 2013, 51, 556–566.
6 S. Smith, L. Finzi and C. Bustamante, Science, 1992, 258,1122–1126.
7 J. F. Marko and E. D. Siggia, Macromolecules, 1995, 28, 8759–8770.
8 K. D. Dorfman, Rev. Mod. Phys., 2010, 82, 2903.9 D. J. Mai, C. Brockman and C. M. Schroeder, So Matter,2012, 8, 10560–10572.
10 J. Tang and P. S. Doyle, Appl. Phys. Lett., 2007, 90, 224103.11 Y.-J. Juang, S. Wang, X. Hu and L. Lee, Phys. Rev. Lett., 2004,
93, 268105.12 A. G. Balducci, J. Tang and P. S. Doyle,Macromolecules, 2008,
41, 9914–9918.13 S. Gerashchenko and V. Steinberg, Phys. Rev. E: Stat.,
Nonlinear, So Matter Phys., 2008, 78, 040801.14 G. C. Randall and P. S. Doyle, Phys. Rev. Lett., 2004, 93,
058102.15 G. C. Randall and P. S. Doyle, Macromolecules, 2006, 39,
7734–7745.16 J. Ou, J. Cho, D. W. Olson and K. D. Dorfman, Phys. Rev. E:
Stat., Nonlinear, So Matter Phys., 2009, 79, 061904.17 E. Y. Chan, N. M. Goncalves, R. A. Haeusler, A. J. Hatch,
J. W. Larson, A. M. Maletta, G. R. Yantz, E. D. Carstea,M. Fuchs, G. G. Wong, et al., Genome Res., 2004, 14, 1137–1146.
18 G. C. Randall, K. M. Schultz and P. S. Doyle, Lab Chip, 2006,6, 516–525.
19 J. M. Kim and P. S. Doyle, Lab Chip, 2007, 7, 213–225.
Soft Matter, 2015, 11, 3105–3114 | 3113

Soft Matter Paper
Publ
ishe
d on
02
Febr
uary
201
5. D
ownl
oade
d by
Sta
nfor
d U
nive
rsity
on
20/0
5/20
15 2
0:19
:47.
View Article Online
20 A. Balducci, P. Mao, J. Han and P. Doyle, Macromolecules,2006, 43, 6273–6281.
21 J.-W. Yeh, A. Taloni, Y.-L. Chen and C.-F. Chou, Nano Lett.,2012, 12, 1597–1602.
22 W. Reisner, K. J. Morton, R. Riehn, Y. M. Wang, Z. Yu,M. Rosen, J. C. Sturm, S. Y. Chou, E. Frey and R. H. Austin,Phys. Rev. Lett., 2005, 94, 196101.
23 R. Dylla-Spears, J. E. Townsend, L. Jen-Jacobson, L. L. Sohnand S. J. Muller, Lab Chip, 2010, 10, 1543–1549.
24 A. Balducci, C. Hsieh and P. Doyle, Phys. Rev. Lett., 2007, 99,238102.
25 W. Xu and S. J. Muller, Lab Chip, 2012, 12, 647–651.26 T. T. Perkins, D. E. Smith and S. Chu, Science, 1997, 276,
2016–2021.27 D. E. Smith and S. Chu, Science, 1998, 281, 1335–1340.28 C. M. Schroeder, H. P. Babcock, E. S. Shaqfeh and S. Chu,
Science, 2003, 301, 1515–1519.29 P. G. de Gennes, Science, 1997, 276, 1999–2000.30 R. Larson, H. Hu, D. Smith and S. Chu, J. Rheol., 1999, 43,
267.31 G. Randall and P. Doyle, Proc. Natl. Acad. Sci. U. S. A., 2005,
102, 10813.32 A. Balducci and P. Doyle, Macromolecules, 2008, 41, 5485–
5492.33 C. Micheletti, D. Marenduzzo and E. Orlandini, Phys. Rep.,
2011, 504, 1–73.34 D. Meluzzi, D. E. Smith and G. Arya, Annu. Rev. Biophys.,
2010, 39, 349–366.35 J. Arsuaga, M. Vazquez, S. Trigueros, D. Sumners, J. Roca,
et al., Proc. Natl. Acad. Sci. U. S. A., 2002, 99, 5373.36 J. Arsuaga, M. Vazquez, P. McGuirk, S. Trigueros,
D. Sumners, J. Roca, et al., Proc. Natl. Acad. Sci. U. S. A.,2005, 102, 9165.
37 W. Taylor, Nature, 2000, 406, 916–919.38 C. Micheletti and E. Orlandini, Macromolecules, 2012, 45,
2113–2121.39 C. Micheletti and E. Orlandini, So Matter, 2012, 8, 10959–
10968.
3114 | Soft Matter, 2015, 11, 3105–3114
40 L. Dai, J. R. van der Maarel and P. S. Doyle, ACS Macro Lett.,2012, 1, 732–736.
41 D. Marenduzzo, C. Micheletti, E. Orlandini, et al., Proc. Natl.Acad. Sci. U. S. A., 2013, 110, 20081–20086.
42 A. Rosa, M. Di Ventra and C. Micheletti, Phys. Rev. Lett., 2012,109, 118301.
43 L. Huang and D. E. Makarov, J. Chem. Phys., 2008, 129,121107.
44 Y. Rabin, A. Grosberg and T. Tanaka, Europhys. Lett., 1995,32, 505.
45 N. Lee, C. Abrams, A. Johner and S. Obukhov, Phys. Rev. Lett.,2003, 90, 225504.
46 N. Lee, C. Abrams, A. Johner and S. Obukhov,Macromolecules, 2004, 37, 651–661.
47 J. Tang, N. Du and P. S. Doyle, Proc. Natl. Acad. Sci. U. S. A.,2011, 108, 16153–16158.
48 B. Kundukad, J. Yan and P. S. Doyle, So Matter, 2014, 10,9721–9728.
49 J. Tang, S. Levy, D. Trahan, J. Jones, H. Craighead andP. Doyle, Macromolecules, 2010, 39, 7368–7737.
50 J. Tang, D. Trahan and P. Doyle, Macromolecules, 2010, 43,3081–3089.
51 C. Hsieh, A. Balducci and P. Doyle,Macromolecules, 2007, 40,5196–5205.
52 C. E. Sing and A. Alexander-Katz, Macromolecules, 2010, 43,3532–3541.
53 C. E. Sing and A. Alexander-Katz, J. Chem. Phys., 2011, 135,014902.
54 J. G. H. Cifre and J. G. de la Torre, J. Chem. Phys., 2001, 115,9578–9584.
55 P. Pieranski, S. Przybył and A. Stasiak, Eur. Phys. J. E: SoMatter Biol. Phys., 2001, 6, 123–128.
56 X. Bao, H. Lee and S. Quake, Phys. Rev. Lett., 2003, 91,265506.
57 C. Schroeder, E. Shaqfeh and S. Chu, Macromolecules, 2004,37, 9242–9256.
58 M. Di Stefano, L. Tubiana, M. Di Ventra and C. Micheletti,So Matter, 2014, 10, 6491–6498.
This journal is © The Royal Society of Chemistry 2015