von karman gas dynamics facility arnold … pilot counterflow test unit is in use at the von karman...
TRANSCRIPT

V AEDC-TR-65-132
AiiS 10 1965
«RI7-JK
INITIAL OPERATION OF THE PILOT COUNTERFLOW TEST UNIT
Henry W. Ball
ARO, Inc.
July 1965
PROPERTY OF U. S. AIR FORCE AEDC LIBRARY
AF 40(600)1000
VON KARMAN GAS DYNAMICS FACILITY
ARNOLD ENGINEERING DEVELOPMENT CENTER
AIR FORCE SYSTEMS COMMAND
ARNOLD AIR FORCE STATION, TENNESSEE
NOTICES When Li. S. Government drawings specifications, or other data are used for any purpose other than a definitely related Government procurement operation, the Government thereby incurs no responsibility nor any obligation whatsoever, and the fact that the Government may have formulated, furnished, or in any way supplied the said drawings, specifications, or other data, is not to be regarded by implication or otherwise, or in any manner licensing the holder or any other person or corporation, or conveying any rights or permission to manufacture, use, or sell any patented invention that may in any way be related thereto.
Qualified users may obtain copies of this report from the Defense Documentation Center.
References to named commercial products in this report are not to be considered in any sense as an endorsement of the product by the United Slates ^ir Force or the Government.

AEDCTR-65-132
INITIAL OPERATION OF THE
PILOT COUNTERFLOW TEST UNIT (I)
Henry W. Ball
ARO, Inc.
AEDC-TR-65-132
FOREWORD
The results of research presented herein were obtained by ARO, Inc. {a subsidiary of Sverdrup and Parcel, Inc.), contract operator of the Arnold Engineering Development Center (AEDC), AFSC, Arnold Air Force Station, Tennessee, under Contract No. AF 40(600)-1000. The research was conducted from January 1, 1964 to January 1, 1965, under ARO Projects Nos. V13516 (formerly VI3307 and VI2307) and VW2236j Program Element 62405334/8952, Task 895201; and the report was submitted by the author on June 8, 1965.
The author wishes to express his thanks to Messrs. B. G. Gilman and J. H. Haun for calibrating the shock tunnel, H. G. Harris, who developed the instrumentation systems, P. H. Dugger, who developed and calibrated the radiometers, and H. S. Brahinsky, who developed the computer program for data reduction.
This technical report has been reviewed and is approved.
Rodney W. Brown Captain, USAF Gas Dynamics Division DCS/Research
Donald R. Eastman, Jr. DCS/Research
li
AEDCTR.65.132
ABSTRACT
A small counterflow test unit which consists of a shock tunnel and a hypervelocity launcher is being evaluated at the VKF, AEDC. The results of the shock tunnel calibration, the performance of the model launcher system, counterflow operating experiences, and some pre- liminary measurements of shock-cap radiation are reported. The shock tunnel calibration data for a room-temperature, helium driver gas are shown to confirm theoretical calculations and indicate clean uniform flow during a 4- to 5-msec run time. Aluminum spheres of 0. 95-cm diam (0. 375 in.) were launched with a 2-stage, light-gas gun at velocities between 4.0 and 5.5 km/sec (13,000 and 18,000 fps). During counterflow runs, relative velocities up to 7. 5 km/sec (25,000 fps) were attained. Measurements of total radiation from the shock-caps of the small spheres are in reasonable agreement with theories and previous measurements from free-flight and shock-tube facilities.
in
AEDC-TR.65-132
CONTENTS
Page
ABSTRACT iii NOMENCLATURE vi
I. INTRODUCTION 1 II. APPARATUS
2. 1 Shock Tunnel 3 2. 2 Model Launcher 3 2.3 Instrumentation 4
III. PROCEDURE 3. 1 Test Conditions 5 3. 2 Data Reduction 5 3. 3 Precision of Measurements 8
IV. DISCUSSION OF RESULTS 9 V. SUMMARY OF RESULTS 12
REFERENCES 13
ILLUSTRATIONS
Figure
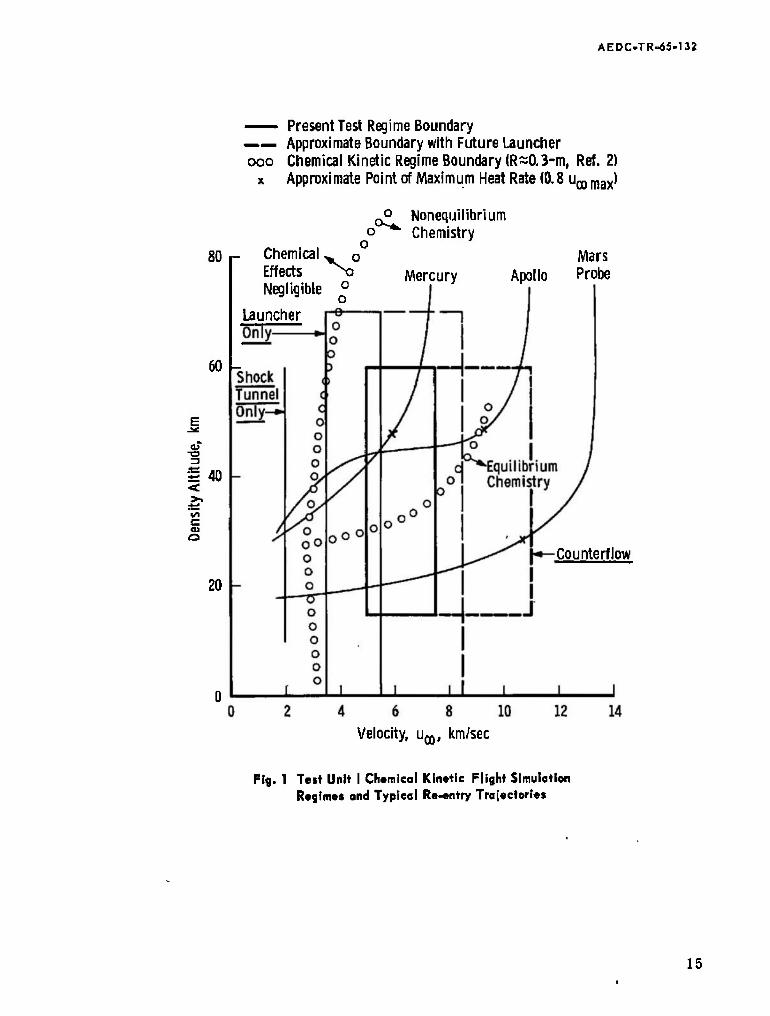
1. Test Unit I Chemical Kinetic Flight Simulation Regimes and Typical Re-entry Trajectories 15
2. Comparison of the Test Unit I Chemical Kinetic Regimes and Typical Re-entry Trajectories in Binary-Scaling Coordinates 16
3. Comparison of Theoretical Calculations of Radiance of High Temperature Equilibrium Air 17
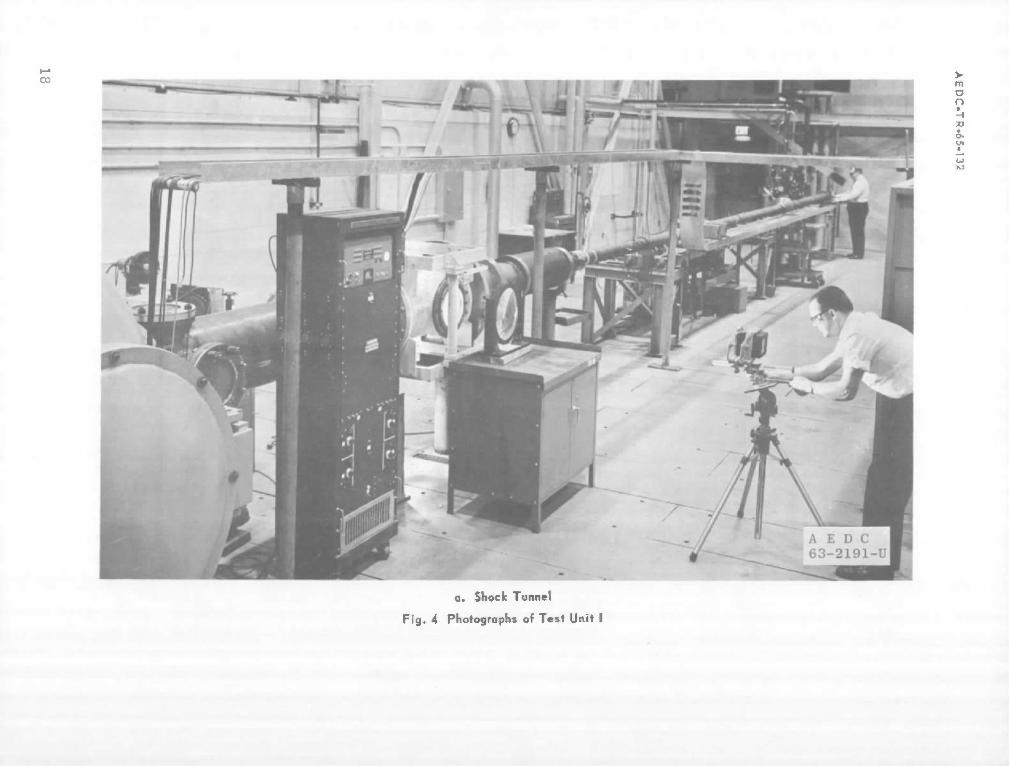
4. Photographs of Test Unit I a. Shock Tunnel 18
; b. Model Launcher 19
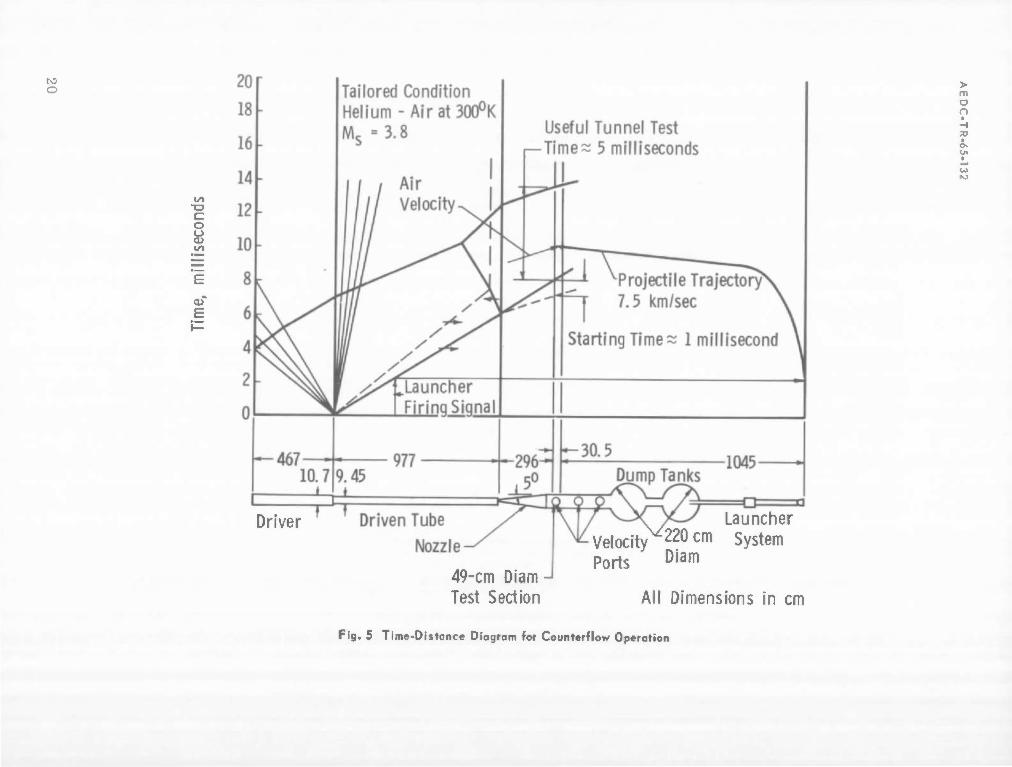
5. Time-Distance Diagram for Counterflow Operation. . 20
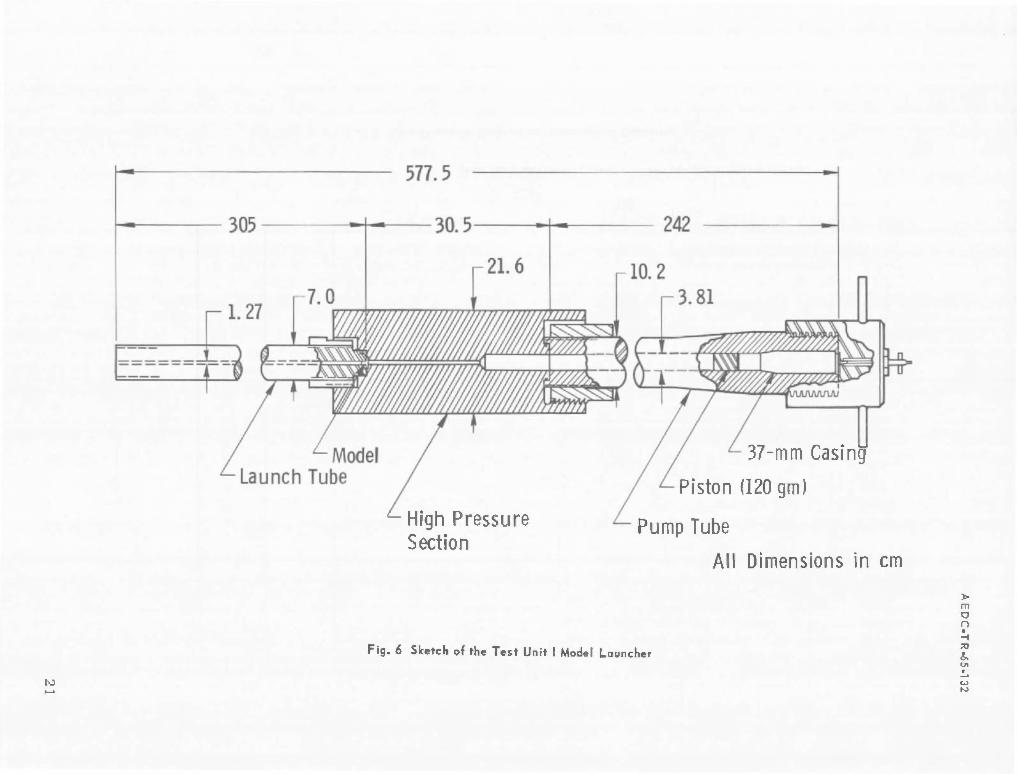
6. Sketch of the Test Unit I Model Launcher 21
7. The Aluminum Model and Polycarbonate Sabot . a. Photograph of the Sphere Model and Sabot... 22 ;. b. Sketch of the Sphere Model and Sabot 22
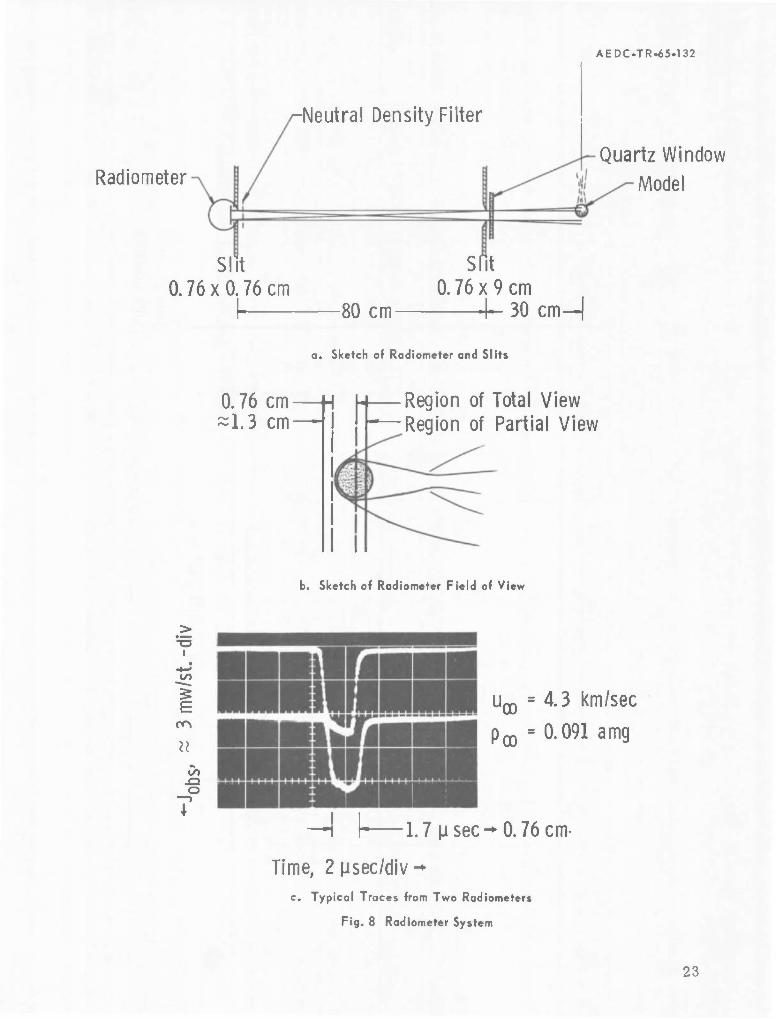
8. Radiometer System a. Sketch of Radiometer and Slits 23 b. Sketch of Radiometer Field of View '23 c. Typical Traces from Two Radiometers .... 23
AEDC-TR-65.132
Figure Page
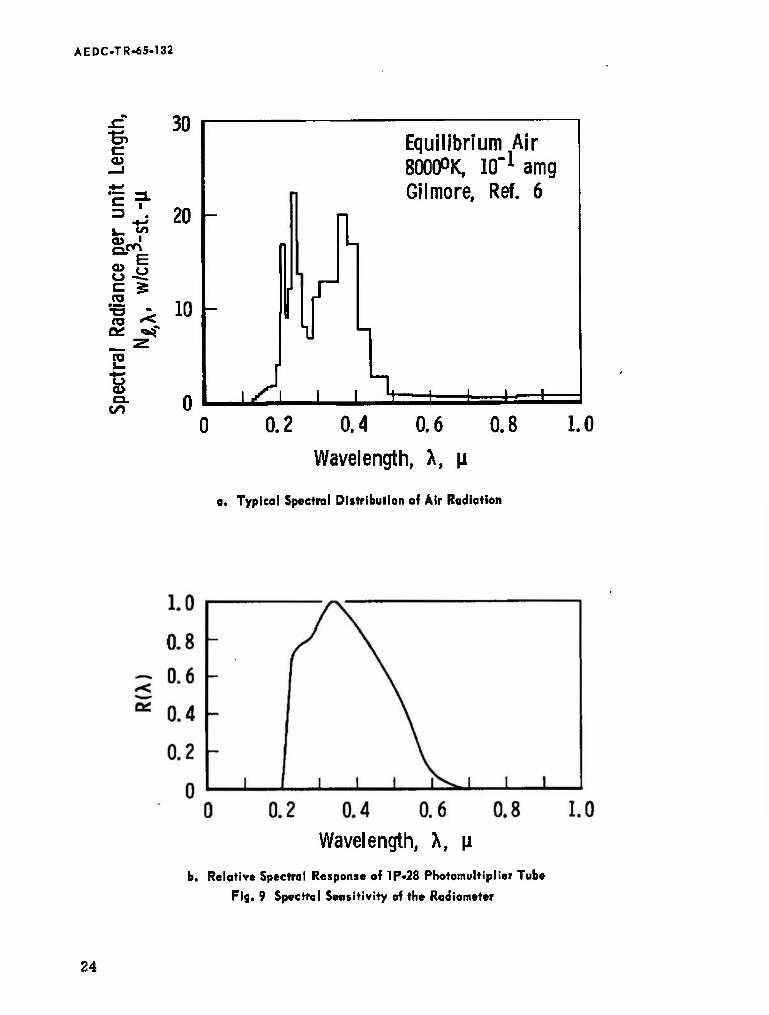
9. Spectral Sensitivity of the Radiometer a. Typical Spectral Distribution of Air
Radiation 24 b. Relative Spectral Response of 1P-28
Photomultiplier Tube 24
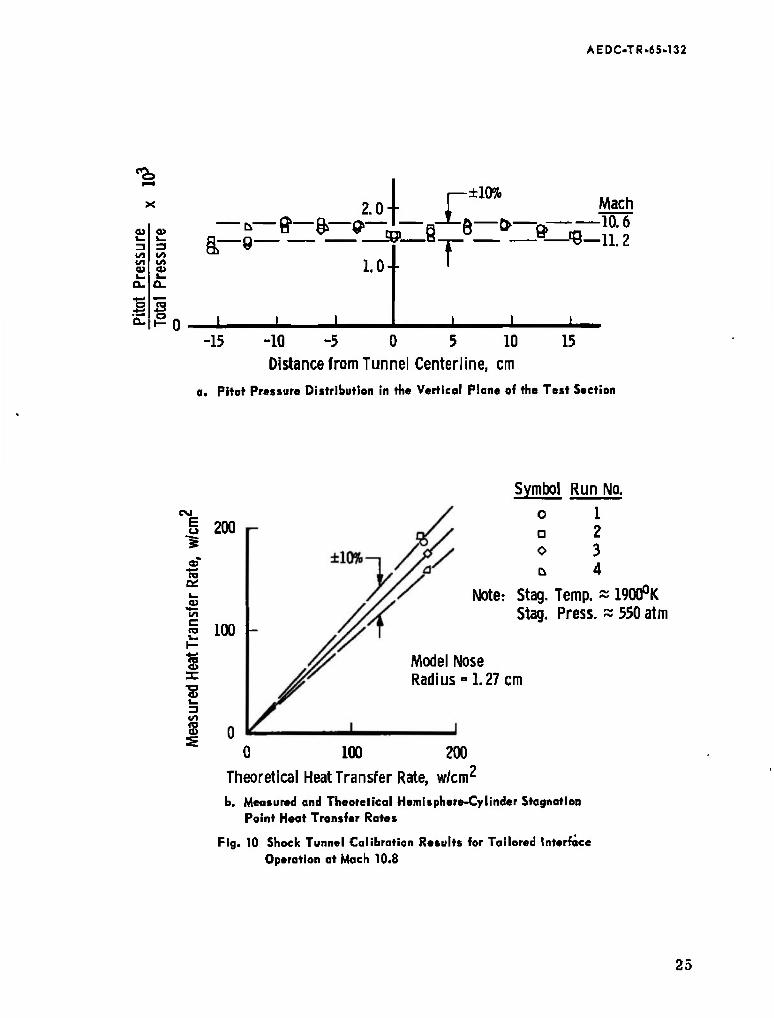
10. Shock Tunnel Calibration Results for Tailored Interface Operation at Mach 10.8
a. Pitot Pressure Distribution in the Vertical Plane of the Test Section 25
b. Measured and Theoretical Hemisphere-Cylinder Stagnation Point Heat Transfer Rates 25
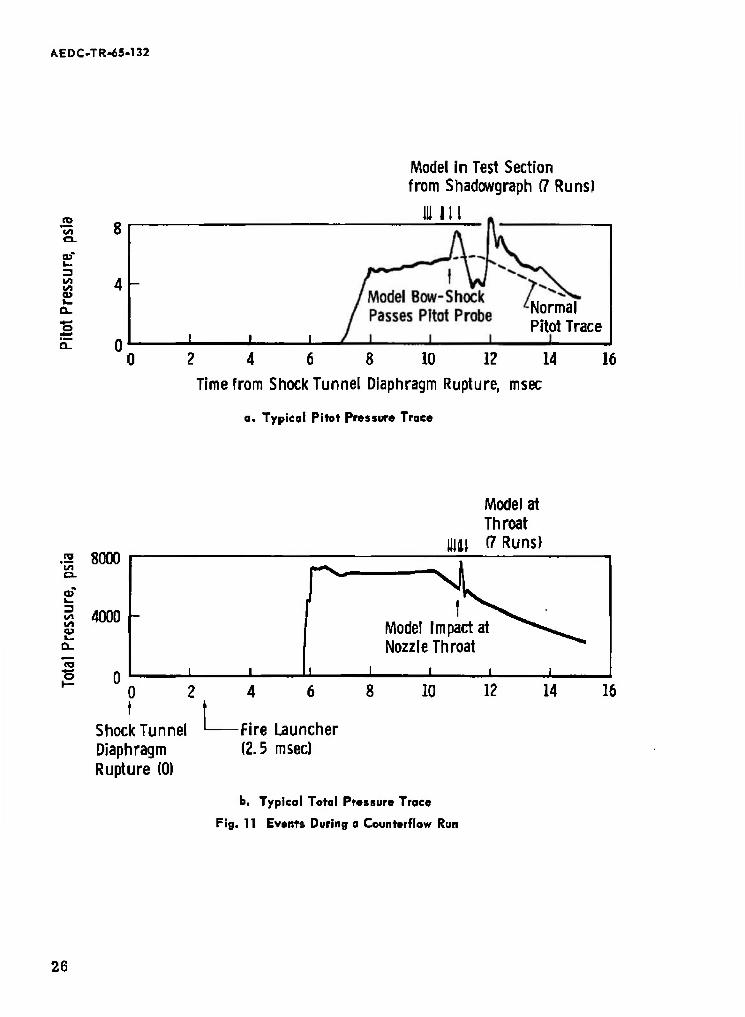
11. Events During a Counterflow Run a. Typical Pitot Pressure Trace 26 b. Typical Total Pressure Trace 26
12. Comparison of the Radiation Measurements with Theory and Data from Other Facilities 27
TABLES
I. Summary of Shock Tunnel Performance Data 29
II. Summary of Launcher Performance and Radiation Data 30
NOMENCLATURE
A Effective area of standard lamp filament, cm^
e , Measured radiometer output, volt
F Fraction of shock-cap radiation sensed by radiometer
h Enthalpy, km2/sec2
J Radiant intensity, watt/steradian
Jobs Radiant intensity observed during a run, watt/steradian
-j*T Radiant intensity per unit volume, watt/cm^-steradian
K Radiometer calibration constant, volt/watt
L Characteristic length, cm
vi

AEDOTR.65-132
Nj Radiance per unit length, watt/cm^-steradian
N^ Spectral radiance of the standard lamp, watt/cm.2- steradian-micron
p Pressure, atm or cm Hg
R Model nose radius, m
R(A) Relative spectral sensitivity of photomultiplier tube(R(A)mai=l)
T Temperature, °K
u^, Model velocity relative to the airstream, km/sec or fps
V Model shock-cap volume, cm3
VeH Effective radiating volume of shock-cap (see Eq. (7)), cm3
S Bow-shock wave standoff distance, m
A. Wavelength, micron
Q Solid angle subtended by photomultiplier tube, steradian
P Density, amagat
SUBSCRIPTS
c Conditions during calibration
f Conditions during a run
i Conditions in the shock tunnel driven tube
2 Equilibrium air conditions behind normal shock wave
X Indicates derivative with respect to wavelength
<* Free stream conditions
vii
AEDC-TR-65-132
SECTION I INTRODUCTION
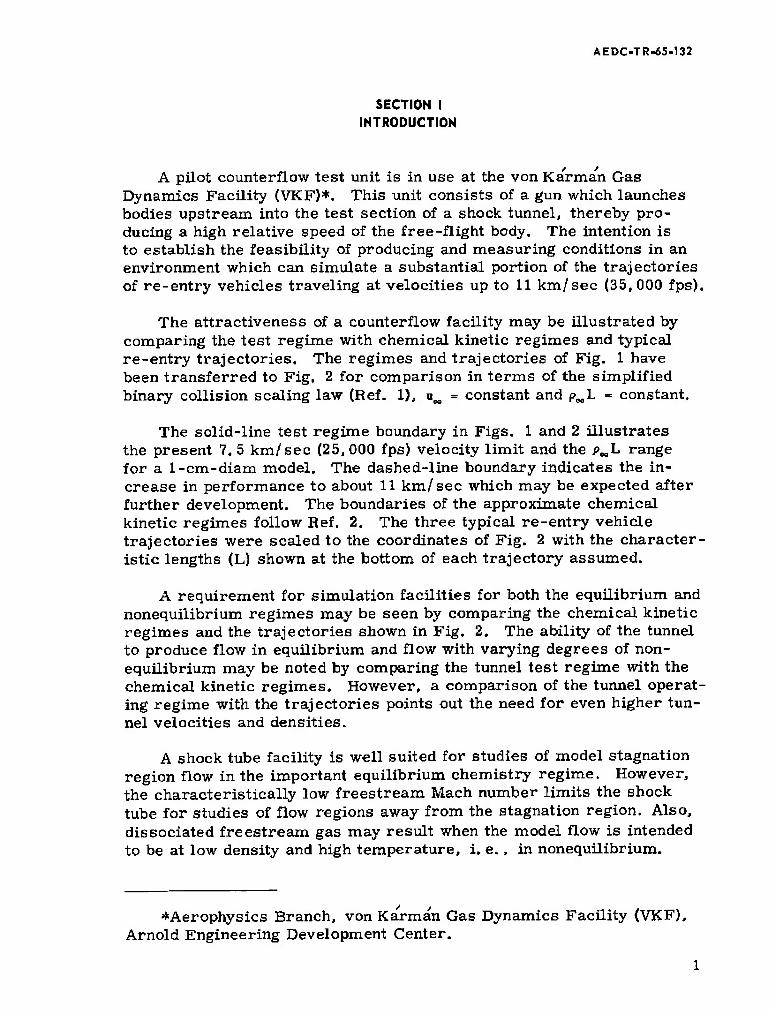
A pilot counterflow test unit is in use at the von Karman Gas Dynamics Facility (VKF)*. This unit consists of a gun which launches bodies upstream into the test section of a shock tunnel, thereby pro- ducing a high relative speed of the free-flight body. The intention is to establish the feasibility of producing and measuring conditions in an environment which can simulate a substantial portion of the trajectories of re-entry vehicles traveling at velocities up to 11 km/sec (35,000 fps).
The attractiveness of a counterflow facility may be illustrated by comparing the test regime with chemical kinetic regimes and typical re-entry trajectories. The regimes and trajectories of Fig. 1 have been transferred to Fig. 2 for comparison in terms of the simplified binary collision scaling law (Ref. 1), u^ = constant and pML = constant.
The solid-line test regime boundary in Figs. 1 and 2 illustrates the present 7. 5 km/sec (25, 000 fps) velocity limit and the PML range for a 1-cm-diam model. The dashed-line boundary indicates the in- crease in performance to about 11 km/sec which may be expected after further development. The boundaries of the approximate chemical kinetic regimes follow Ref. 2. The three typical re-entry vehicle trajectories were scaled to the coordinates of Fig. 2 with the character- istic lengths (L) shown at the bottom of each trajectory assumed.
A requirement for simulation facilities for both the equilibrium and nonequilibrium regimes may be seen by comparing the chemical kinetic regimes and the trajectories shown in Fig. 2. The ability of the tunnel to produce flow in equilibrium and flow with varying degrees of non- equilibrium may be noted by comparing the tunnel test regime with the chemical kinetic regimes. However, a comparison of the tunnel operat- ing regime with the trajectories points out the need for even higher tun- nel velocities and densities.
A shock tube facility is well suited for studies of model stagnation region flow in the important equilibrium chemistry regime. However, the characteristically low freestream Mach number limits the shock tube for studies of flow regions away from the stagnation region. Also, dissociated freestream gas may result when the model flow is intended to be at low density and high temperature, i. e. , in nonequilibrium.
*Aerophysics Branch, von Karman Gas Dynamics Facility (VKF), Arnold Engineering Development Center.
AEDCTR-65-132
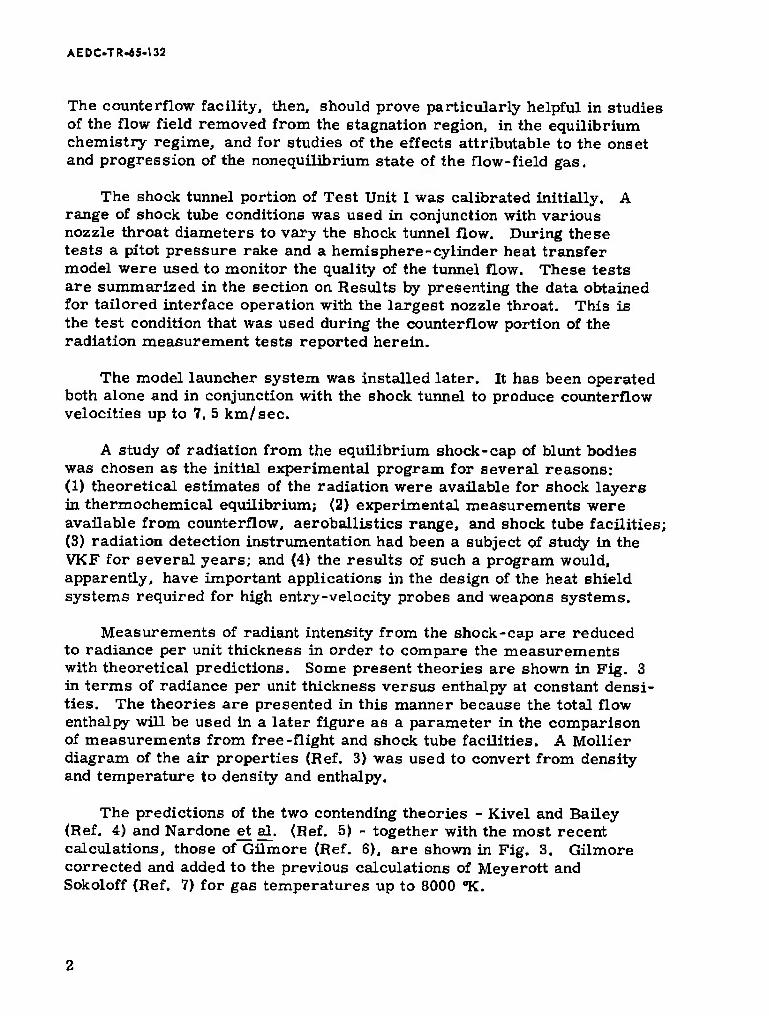
The counterflow facility, then, should prove particularly helpful in studies of the flow field removed from the stagnation region, in the equilibrium chemistry regime, and for studies of the effects attributable to the onset and progression of the nonequilibrium state of the flow-field gas.
The shock tunnel portion of Test Unit I was calibrated initially. A range of shock tube conditions was used in conjunction with various nozzle throat diameters to vary the shock tunnel flow. During these tests a pitot pressure rake and a hemisphere-cylinder heat transfer model were used to monitor the quality of the tunnel flow. These tests are summarized in the section on Results by presenting the data obtained for tailored interface operation with the largest nozzle throat. This is the test condition that was used during the counterflow portion of the radiation measurement tests reported herein.
The model launcher system was installed later. It has been operated both alone and in conjunction with the shock tunnel to produce counterflow velocities up to 7. 5 km/sec.
A study of radiation from the equilibrium shock-cap of blunt bodies was chosen as the initial experimental program for several reasons: (1) theoretical estimates of the radiation were available for shock layers in thermochemical equilibrium; (2) experimental measurements were available from counterflow, aeroballistics range, and shock tube facilities; (3) radiation detection instrumentation had been a subject of study in the VKF for several years; and {4} the results of such a program would, apparently, have important applications in the design of the heat shield systems required for high entry-velocity probes and weapons systems.
Measurements of radiant intensity from the shock-cap are reduced to radiance per unit thickness in order to compare the measurements with theoretical predictions. Some present theories are shown in Fig. 3 in terms of radiance per unit thickness versus enthalpy at constant densi- ties. The theories are presented in this manner because the total flow enthalpy will be used in a later figure as a parameter in the comparison of measurements from free-flight and shock tube facilities. A Mollier diagram of the air properties (Ref. 3} was used to convert from density and temperature to density and enthalpy.
The predictions of the two contending theories - Kivel and Bailey (Ref. 4) and Nardone et al. (Ref. 5) - together with the most recent calculations, those of Gilmore (Ref. 6), are shown in Fig. 3. Gilmore corrected and added to the previous calculations of Meyerott and Sokoloff (Ref. 7) for gas temperatures up to 8000 °K.
AEDC.TR-65-132
An extensive experimental study of both equilibrium and nonequilib- rium blunt-body, shock-cap radiation has been conducted in the counter- flow facilities at the NASA Ames Research Center, California. This work at velocities up to 12 km/sec (40, 000 fps) was recently summa- rized in Ref. 8. In a recent publication, Ref. 9, Nerem has reported the results of his shock tube measurements of equilibrium blunt-body radiation at simulated velocities up to 15 km/sec (50,000 fps). In addition, experiments have been reported at velocities up to 6 km/sec (20,000 fps) from the aeroballistics ranges of General Motors Defense Research Laboratories (Refs. 10 and 11) and the Canadian Armament Research and Development Establishment (Ref. 12).
SECTION II APPARATUS
2.1 SHOCK TUNNEL
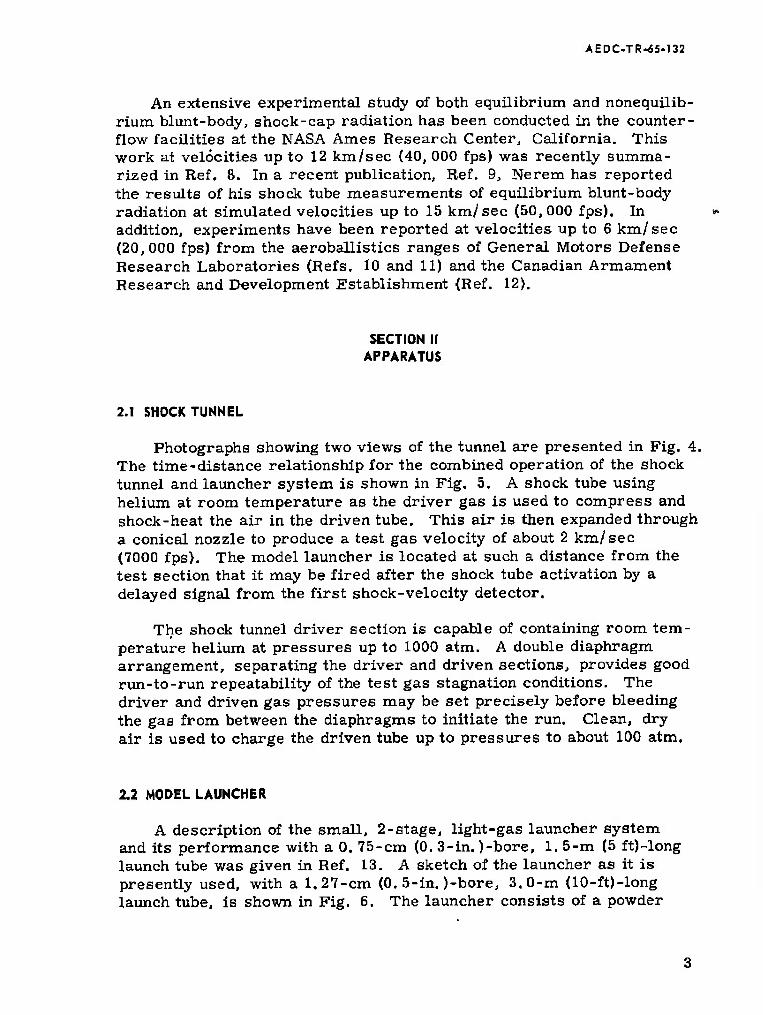
Photographs showing two views of the tunnel are presented in Fig. 4. The time-distance relationship for the combined operation of the shock tunnel and launcher system is shown in Fig. 5. A shock tube using helium at room temperature as the driver gas is used to compress and shock-heat the air in the driven tube. This air is then expanded through a conical nozzle to produce a test gas velocity of about 2 km/sec (7000 fps). The model launcher is located at such a distance from the test section that it may be fired after the shock tube activation by a delayed signal from the first shock-velocity detector.
The shock tunnel driver section is capable of containing room tem- perature helium at pressures up to 1000 atm. A double diaphragm arrangement, separating the driver and driven sections, provides good run-to-run repeatability of the test gas stagnation conditions. The driver and driven gas pressures may be set precisely before bleeding the gas from between the diaphragms to initiate the run. Clean, dry air is used to charge the driven tube up to pressures to about 100 atm.
2.2 MODEL LAUNCHER
A description of the small, 2-stage, light-gas launcher system and its performance with a 0. 75-cm (0. 3-in. )-bore, 1. 5-m (5 ft)-long launch tube was given in Ref. 13. A sketch of the launcher as it is presently used, with a 1.27-cm (0. 5-in.)-bore, 3.0-m (lO-ft)-long launch tube, is shown in Fig. 6. The launcher consists of a powder

AEDCTR^5-132
chamber, pump tube, high pressure section, and launch tube. The pump tube is initially charged to 20 atm with helium. This charge gas is separated from the powder chamber by a polyethelene piston, and the model forms the seal at the other end of the pump tube. Powder charges are used to drive the piston, compressing the second-stage gas and accelerating the model down the launch tube.
The aluminum sphere model and polycarbonate sabot are shown in Fig. 7. The flange at the rear of the sabot acts as a diaphragm between the pump-tube charge gas and the launch tube. A two-stage sabot stripper, mounted on the end of the launch tube, is used to stop the sabot. The stripper uses four steel interference pins to provide initial separation of the model and sabot and a lead bulkhead to stop the sabot.
2.3 INSTRUMENTATION
The shock tunnel instrumentation system includes several thin- film, shock-velocity detectors, a piezo-electric stagnation pressure transducer, thermocouple-type heat transfer transducers, and variable-reluctance, "wafer" type, pitot pressure transducers. Model detector systems are located at three stations, as indicated in Fig. 5. Each detector system consists of a photomultiplier tube which triggers a shadowgraph and an electronic counter.
The radiation measurement units are shown in Fig. 8. Each radiometer consists of a S-5 spectral response, IP-28 photomulti- plier tube, which is made directional by two narrow slits. The field of view, Fig. 8b, was selected to be large enough to view the entire shock- cap, but small enough to differentiate between radiation from the shock- cap and the wake. Typical traces from two identical radiometers used on the tunnel during all tests are shown in Fig. 8c. The relatively flat portion of the traces represents the period during which the entire shock-cap was within the field of view.
This particular photomultiplier tube was chosen from those com- mercially available because it senses a large spectral portion of the shock-cap radiation. The spectral response of the tube, along with a typical prediction of the spectral radiance of air, is shown in Fig. 9.
The radiometer system must be capable of very high frequency response for the 2- to 3-microsecond total exposure time. Tests of the readout circuitry associated with the photomultiplier tube showed a system rise time of about 20 nanoseconds to a square wave input. The 100-megacycle sinusoidal response quoted by the manufacturer
AEDCTR.65.132
for the photo multiplier tube itself was assumed to be adequate for these experiments.
SECTION III PROCEDURE
3.1 TEST CONDITIONS
During the counterflow tests which are described here, the shock tunnel was operated in the tailored-interface mode with room tempera- ture helium and air as the driver and driven gases, respectively. The charge conditions and the resulting flow properties are summarized in Table I. The highest available driver charge pressure (750 atm) and the largest nozzle throat calibrated at the time (1. 27-cm diam) were used in the present tests. During the launcher-only tests the tunnel pressure was set at 0.02 or 0. 1 atm (see Table II), which corresponds to free-stream densities of 0. 0182 or 0. 091 amg, respectively.
Several possible sources of flow contamination which could con- tribute errors in the radiation measurements were considered. The models and sabots were washed beforehand in distilled water, petroleum ether, and absolute ethanol after the example of Sadowski et al., Ref. 12. The inside of the tunnel was washed frequently to minimize any effect of dust particles in the range air. Before each launcher-only run, the tunnel was purged with clean, dry air. Periodic samples showed that the water vapor content was 200 to 300 ppm and that there was no leakage of helium from the launcher. Dust sampling, which consisted of pumping about 200 gm (0. 5 lb) of tunnel air through a millipore filter, showed traces which could not be weighed on standard balances (less than 0. 1 milligram of dust).
Mixing of the shock tube driver and driven gases could contribute helium as a contaminant in the shock tunnel flow. Calculations of inter- face acceleration were made, with mass flow through the nozzle throat and Mirels1 boundary layer theory, Ref. 14, considered. These calcula- tions indicated arrival of the helium 25 msec after start of the run. The radiation data-taking period, at 2 to 4 msec, was thus very conservative in this regard.
3.2 DATA REDUCTION
The gas properties were computed for each counterflow run using a real, equilibrium air program and a 7074 computer. The program

AEDC-TR-65-132
included measured values of incident shock Mach number, tunnel stag- nation pressure, pitot pressure, and model velocity. Properties in the tunnel stagnation region, freestream, and model stagnation region were computed with an equilibrium, isentropic expansion through the nozzle assumed. The real air properties of Ref. 3 and the shock crossing equations of Ref. 15 were used in the computer program.
The radiometer system was calibrated relative to a tungsten filament lamp which had been calibrated by the National Bureau of Standards. The response of the radiometer to the standard lamp is given by:
ec - K fx Sü fA NAR(X) dA dfl dA = KA Bc /A NA R(A) dA , volt (1)
where A effective area of the standard lamp filament, cm2
ec measured radiometer output, volt
K calibration constant, volt/watt
NA spectral radiance of the standard lamp, watt/cm2- steradian-micron
R(X) relative spectral response of the photomultiplier tube
(««.„-*) A wavelength, micron
nc solid angle subtended by the photomultiplier tube with apex at the standard lamp filament, steradian
Values of the integral in Eq, (1) were determined for various cur- rent settings of the standard lamp. A plot of ec versus the integral showed a linear relationship up to the saturation point of the photo- multiplier tube. The value of K was determined from the slope of the linear portion of the curve. Operation in the tunnel was limited to levels corresponding to the linear portion of the curve by the use of calibrated, neutral density filters.
When the radiometer views the model shock-cap the response is:
er = K i't-'v "Tr- R(AWV dß dA = K"r JAR(A)
JV -^~dV dx'volt (2) where er measured radiometer output, volt
-~- spectral radiant intensity per unit volume, watt/ cm3 - steradian-micron
V volume of gas in the model shock-cap, cra^
ßr solid angle subtended by the photomultiplier tube with apex at the model, steradian
u AEDC-TR-Ö5-U2
It is evident in Eq. (2) that the desired quantity, the radiant intensity
* dVdX, is modified by the photomultiplier tube response, R(X). dV
However, the observed radiant intensity, Jobg , may be calculated from:
Jobs =/XRW/v ~^- dVdX = -^- A- , watt/steradian (3)
In order to account for the tube response the quantity F was defined:
/AJh/v4irftWdVdQdA F = äjT (4)
44'»-if dVdfid* F is the fraction of the emitted intensity responded to by the photomulti- plier tube. Thus, the radiant intensity of the shock-cap, J t is:
J = J°'"' . watt/steradian (5>
For computation, the equation for F was simplified by assuming that the spectral distribution of the radiation from the gas at the model stagnation point (conditions p1 and T2) is representative of the distribu- tion of the radiation from the entire shock-cap. Thus:
F = -W <6> (~AV) *s tne radiant intensity per unit volume of the shock-cap gas behind the normal portion of the bow-shock wave, i. e. , at the conditions px
and T,, watt/cm^-steradian. Values of F were computed from Eq. (6) for the range of temperature and density encountered during the present tests using the tube manufacturer's values of R(X) and theoretical values of (dJ^/dV), and (dJ/dV), which were tabulated by Gilmore in Ref. 6.
The measurements were further reduced to radiant intensity per unit volume at the stagnation point conditions so that they could be com- pared with the theoretical values shown in Fig. 3, Calculated values of the equivalent uniform volume of air behind a normal shock wave were used, following Page and Arnold (Ref. 8). The effective volume, VeJf , can be defined mathematically by:
v JA/QJV ^f dvdfldx a Jy Hrv-dv • /r7. veff ■ 7dj7\ 7W\ ' cm <7>
where -^ is the radiant intensity per unit volume for the incremental volumes of gas in the model shock-cap, watt/cm3 - steradian.
Again, as indicated in Eq. (7), the calculation procedure was simplified by assuming that the spectral distribution of radiation from
AEDOTR-65-132
the stagnation point gas is representative of the spectral distribution over the entire shock-cap. The integral in Eq. (7) has been numerically evaluated for three of the present test conditions using values of dJ/dV from Gilmore. The following values of Veff were obtained:
u , km/sec PM. amg VeJf, cm*
0.091 0.0079
0.091 0.0070
0.0182 0.0066
4.0
5.0
5.0
The numerical evaluation was similar to the method of Page and Arnold, except that actual bow-shock wave shapes from shadowgraph pictures were used in the present evaluation. Shock wave standoff distances were computed from the correlation given in Ref. 15:
-|- = 0.75 Poa/Px (8)
Because the method for computing Veff obviously is approximate, recal- culation of ve{{ for every operating condition was not believed warranted; and an average of the computed volumes, 0. 0072 cm^ was used in the reduction of all the data (see Table II).
The radiant intensity per unit volume, dJ/dV , and radiance per unit length, dN/di , are synonymous and they are used alternately by the authors of Refs. 4 through 12. The intensity term, dJ/dV , fits very well in the equations normally given to explain the data interpretation process (see Eqs> (2) through (7)); however, the radiance term, &ti/Al, is probably a better term to relate the shock-cap radiation measurements to the normal radiometry concept of radiance of the surface of a black or grey body. Consequently, the quantity, fy , defined as the radiance per unit length of radiating gas, and computed from the relationship,
Ni = ~z*— , watt/cm — steradian (9) * »«ff
will be used in subsequent descriptions of the radiation data. Note that,
N' = ("lif) = ("dv") • Wfl»/Cm' ~ steradLan (10)
3.3 PRECISION OF MEASUREMENTS
The table on the following page gives estimates of the precision of the basic tunnel measurements.
8
AEDCTR-45-132
Precision, Measurement Percent
Driven Tube Charge Press., pt ±5
Shock Velocity ±5
Stagnation Press. ±5
Pitot Press. ±5
Heat Transfer Rate ±10
Model Velocity, ax ±2
Range Press., p„ ±2
These estimates are based upon the repeatability of the instrumentation systems from calibration to calibration, variations in individual meas- urements during a given run, and discrepancies between dual measure- ments during a given run.
Calibrations of the radiometers relative to two standard lamps agreed within ±10 percent. During 80 percent of the runs, the readings of two identical radiometers agreed within ±10%; however, differences of a factor of two have been observed. In addition, relatively large variations in radiometer sensitivity, ±20%, have been noted during periodic calibrations. These two discrepancies are known to exist but their causes have not been identified. Because of this lack of under- standing of some basic measurement problems and considering the assumptions which are made in interpreting the measurements, the present radiation data must be considered somewhat preliminary.
SECTION IV DISCUSSION OF RESULTS
The shock tunnel portion of Test Unit I has been calibrated over a range of conditions. Various combinations of driver and driven tube pressures were tested in combination with several nozzle throats. Dur- ing these tests, a pitot pressure rake and a hemisphere-cylinder heat transfer model were used to determine the quality of the test section flow.
The data presented in Fig. 10 are typical of the calibration results. These data were obtained for the test condition used during the counter- flow portion of the radiation measurement program discussed. The upper part of Fig. 10 shows that: (1) the pitot pressure profile was uniform within ±10%, over ±15 cm from the tunnel centerline and (2) the pitot pressure level was repeatable from run to run within ±10%.
9
AEDC.TR^5.132
Measured and theoretical heat transfer rates at the stagnation point of a hemisphere are compared in Fig. 10b. The theoretical rates are based upon the Fay and Riddell theory {Ref. 17) using a total flow enthalpy determined from measured values of driven tube charge pres- sure and initial shock speed. The heat transfer rates agree within the precision of the measurement, ±10%, implying agreement between actual and calculated total flow enthalpy.
The performance of the launcher system, is illustrated by the model velocities listed in Table II. Launcher powder charges between 85 and 160 gm (0. 19 to 0. 35 lb) resulted in model velocities between 4. 0 and 5. 5 km/sec. The launch velocity for a given powder charge was repeat- able within ±0. 3 km/sec.
A very important characteristic of the launcher system for counter- flow operation is the repeatability of the time interval between the launcher fire signal and the model arrival in the test section. This is illustrated in Fig. 11 for a series of medium-velocity runs (130-gm launcher powder change), where a delay of 2. 5 msec was used between the shock tunnel diaphragm rupture and the launcher fire signal. The model bow shock wave can be seen to affect the pitot-pressure trace during passage (Fig. 11a), and the model impacting in the tunnel throat area produced a spike on the total pressure trace (Fig. lib). Model positioning in the test section was repeatable within ±0. 5 msec. The delay period was varied from 0(85-gm powder) to 4 msec (160-gm powder) to position the model in the test section during the middle por- tion of the shock tunnel run.
The radiation data which have been obtained are presented in Fig. 12 along with equilibrium air data from the Ames counterflow tun- nel (Ref. 8) and the shock tube facility at the Ohio State University (Ref. 9). Also shown are the predictions of Kivel and Bailey (Ref. 4) and Nardone et al. (Ref. 5), but they are oriented in a slightly different manner than in Fig. 3. The curves are for either constant free-stream pressure, p^,, or for constant initial shock tube pressure, pl, as indicated in the figure. The two sets of constant px curves are repre- sentative of the manner in which the present data were obtained, while the shock tube data may be compared to the sets of constant p, curves.
It was recognized that different sources of air properties and use of different shock-crossing charts could contribute significant differ- ences between various sets of data. Therefore, the parameter ht was chosen to make the measurements as independent of properties and theoretical shock crossings as possible. One set of shock-crossing charts, those of Laird and Heron, Ref. 18, was used for all the data.
10

AEDC-TR-65-132
The two most recent sets of shock-crossing charts, those of Laird and Heron and those of Lewis and Burgess, Ref. 15, were compared and found generally to agree within the reading accuracy. However, differ- ences as large as 15% were noted in density ratio at low shock Mach numbers and high pressures. The charts of Laird were chosen because they include higher shock velocities.
The enthalpy, h2, was determined for the free-flight data by taking one-half the square of the flight velocity. The shock-cap enthalpy was determined for the shock tube data from the shock velocity and pt. using the charts of Laird. Thus, ha is one of the better known flow parameters of either facility. The shock-cap densities associated with the data were obtained from the charts of Laird using either flight velocity and p,,, or shock velocity and Pt ■
The conclusions of both Page and Kerem concerning their data relative to the theories are supported by Fig. 12. Page's data are in general agreement with the theories, but the scatter is too large to identify the better of the predictions. This may be seen by comparing his points at p, = 1. 03, 1. 0, 0. 98 and 0. 89 amg with the pM =0.1 atm (p2 = 1. 0 amg) curves and his points at p± = 0. 13, 0. 11, 0. 092, and 0. 19 amg with the v% = 0. 1 cm Hg (p, - 0. 12 amg) curves, etc. Nerem's data lie slightly below Kivel's curves and tend to support Nardone's predictions, falling below either curve at the highest enthalpies.
The significant point is that the apparent disagreement noted by Nerem between the free-flight tunnel and the shock tube data is not evident in this figure. Within the experimental scatter, the measure- ments at Ames and the Ohio State University are in agreement.
The present data contribute little to the above discussion since they are below the velocity regime of greatest interest. However, they do provide an extension of the experimental data in the low velocity regime. The present launcher-only data at the high density, p2 * 1.0 amg, are in reasonable agreement with the theories. The lower density data, p2 = 0.25 amg, obtained during launcher-only and counterflow modes of operation agree with each other in the range of overlap, at 5. 5 km/sec. The mean of the low density data, however, is a factor of about two above the closest theory. This increased radiation is attributed to a significant contribution from the nonequilibrium portion of the gas in the shock-cap. This is supported by the results of Page and Arnold. They present a graph of the effect of density upon shock-cap radiation at a constant velocity of 6. 4 km/sec. Their data are also a factor of two to three above theory at the same freestream conditions used during the present lower density experiments.
11

AEDC-TR.*5*132
Efforts in the near future will be applied toward a shock tunnel calibration at a condition which will provide high density flow for counter - flow operation. Measurements with more spectral resolution would con- tribute to the better determination of the influence of airstream contam- ination upon radiation measurements. Relatively fine spectral resolution may allow determination of the radiating species and thereby point out possible weaknesses in the theoretical calculations.
SECTION V SUMMARY OF RESULTS
Results of the shock tunnel calibrations at Mach 10. 8 and reservoir conditions of 1900°K and 550 atm have been presented. These results show that the pitot pressure distribution is uniform within ±15 cm of the tunnel centerline. In addition, the total flow enthalpy inferred from hemisphere, stagnation-point, heat transfer measurements agrees with the total enthalpy calculated from measurements of shock tube conditions.
The launcher system is capable of subjecting 0. 95-cm-diam alumi- num sphere models to velocities between 4. 0 and 5. 5 km/sec. The velocity was repeatable within ±0. 3 km/sec. During counterflow runs, relative velocities up to 7. 5 km/sec were obtained. The model could be positioned in the tunnel test section within a satisfactory time tolerance of ±0. 5 msec.
Measurements of total shock-cap radiation at velocities from 4. 0 to 5. 5 km/sec and a shock-cap density of 1 amg were in reasonable agreement with theoretical predictions. Radiation data obtained during both launcher-only and counterflow operations, at velocities between 4. 5 and 7. 5 km/sec and a shock-cap density of 0. 25 amg, agree in the region of overlapping velocity. The lower density data, however, are a factor of two above theory for equilibrium flow, indicating a significant contribution of radiation from the nonequilibrium portion of the shock layer.
The radiation measurements were compared to data from the NASA-Ames counterflow tunnel and the Ohio State University shock tube at equal total flow enthalpies; and the most current, theoretical shock-crossing charts were used. The present high density data and the data from the other two facilities agree within the scatter of the measurements.
12
AEDCTR-65-132
REFERENCES
1. Hall, J. G. , Eschenroder, A. Q. , and Marrone, P. V. "Blunt- Nose Inviscid Airflows with Coupled Nonequilibrium Processes, M
Journal of the Aerospace Sciences, Vol. 29, No. 9, Sept. 1962, pp. 1038-1051.
2. Harney, Donald J. "Chemical Kinetic Regimes of Hypersonic Flight Simulation." AEDC-TDR-63-3, January 1963.
3. Staff of von Karmän Gas Dynamics Facility, ARO, Inc. "Mollier Diagram for Equilibrium Air. " The Parthenon Press, Nashville, Tenn. , March 1964.
4. Kivel, B., and Bailey, K. ''Tables of Radiation From High Tempera- ture Air. " AVCO Research Report 21, December 1957.
5. Nardone, M. C. , Breene, R. G., Zeldin, S. S., Reithof, T. R. "Radiance of Species of High Temperature Air. " General Electric Report R63SD3, June 1963.
6. Gilmore, F. R. "Approximate Radiation Properties of Air Between 2000 and 8000BK. " Memorandum RM-3997-ARPA, March 1964.
7. Meyerott, R. E. , Sokoloff, J. and Nicholls, R. W. "Absorption Coefficients of Air, " Geophysical Research Papers, No. 68, July 1960.
8. Page, William A. and Arnold, James O. "Shock-Layer Radiation of Blunt Bodies at Reentry Velocities. " Ames Research Center, NASA TR R-193. April 1964.
9. Nerem, Robert M. "Stagnation Point Heat Transfer in High Enthalpy Gas Flows, Part II: Shock Layer Radiative Emission During the Hypervelocity Re-entry. " FDL-TDR-64-41, March 1964.
10. Primich, R. I. , and Steinberg, M. "A Broad Survey of Free- Flight Range Measurements From the Flow About Spheres and Cones." General Motors Corp. TR63-224, September 1963.
11. Hansen, C. F. and Leak, W. R. "Equilibrium Stagnation-Region Radiation From Pure Air For the 0. 2 - l.Oju Band. " General Motors Corporation, TR62-209F, December 1962.
12. Sadowski, C. M. , Dionne, J. G. G., and Trottier, G. "A Study of Shock-Cap Radiation From 1. 0 Inch Diameter Hypersonic Spheres." CARDE T. R. 491/64, April 1964.
13
AEDC-TR-.55.132
13. Stephenson, W. B. "Performance of a Small Two-Stage, Light- Gas Gun Used For Impact Testing. " AEDC-TN-61-166, January 1962.
14. Mirels, H. , "Shock Tube Test Time Limitation Due To Turbulent- Wall Boundary Layer. " American Institute of Aeronautics and Astronautics Journal, Vol. 2, No. 1, Jan. 1964, pp. 84-93.
15. Lewis, Clark H. and Burgess, E. G. , III "Charts of Normal Shock Wave Properties in Imperfect Air. " AEDC-TDR-64-43, March 1964.
16. Seiff, Alvin, "Recent Information on Hypersonic Flow Fields. " NASA SP-24, September 1962.
17. Fay, J. A. and Riddell, F. R. "Theory of Stagnation Point Heat Transfer in Dissociated Air. " Journal of the Aeronautical Sciences, February 1958, pp. 73-85. ~
18. Laird, J. D. , Heron, K., "Shock Tube Gas Dynamic Charts, Part 1; Equilibrium Argon-Free Air From 3, 000 to 40,000 °K. " RAD TM 64-12, April 1964.
14
AEDC-TR-65-132
— Present Test Regime Boundary Approximate Boundary with Future Launcher ooo Chemical Kinetic Regime Boundary {R~0.3-m, Ref. 2)
x Approximate Point of Maximum Heat Rate (0.8 u^ max)
-v°-*> Nonequilibrium Chemistry
80 r- Chemical v 0
Effects >o Negligible °
Launcher
60 U
Mercury Apollo Mars Probe
E
0> -a
€ 40 <
c a
20
Counterflow
Velocity, um, km/sec
Fig. 1 Test Unit I Chemical Kinetic Flight Simulation Regimes and Typical Re-entry Trajectories
15

AEDCTR-65-132
Present Test Regime Boundary (L = 1 cm) —— Approximate Boundary with Future Launcher ooo Chemical Kinetic Regime Boundary (Ref. 2)
x Approximate Point of Maximum Heat Rate 10.8 u. co max
10"
E i
ia
8 _r 10"
y 10"
t> ro
■a c
10 r4
'S in-5 o ■e
'S
10"
10"
o^-e-fquilibrium Chemistry
Chemical Effects Negligible
T 30
40
50
CVJ
60 2J
£
- 70
-- 80
, Mercury o (L - 2ml
Q [
Apollo (L = 4m)
j I
Mars Probe <L - lm)
-I 1 12 14 2 4 6 8 10
Velocity, U&, km/sec
Fig. 2 Comparison of the Test Unit I Chemical Kinetic Regimes and
Typical Re-entry Trajectories in Binary-Sealing Coordinates
90
100
16

105 .-
i_ a>
+->
i
E o
3
*> 101 a. s 2
Of
AEDCTR.65-132
10° = P2> amg
io* L
103 L
IO2 L
10u |-
10"1 l-
80 100
Shock-cap Enthalpy, fy km2/sec2
.1 | i i i I i i I | 4
|
6 8 10
Velocity, u^, km/sec i i i i i i
12
1 1
14
5 6 7 8 9 10 12 1415
Shock-cap Temperature for p2 = 10 amg, T2, °K
Fig. 3 Comparison of Theoretical Calculations of Radiance
of High Temperature Equilibrium Air
17
cc m O n
a. Shock Tunnel
Fig. 4 Photographs of Test Unit I

b. Model Launcher
Fig. 4 Concluded
A E D C ■ -21Ü5-L BE
K
CO
> m a n ■ H
10 o
on
c o
.—
E
E
> m O n u s. —• M
Driver
49-cm Diam Test Section
Launcher VelocityV220 cm System Ports Diam
All Dimensions in cm
Fig, 5 Time-Distance Diagram for Counterflow Operation
High Pressure Section
37-mm Casing
Piston (120 gm)
Pump Tube
All Dimensions in cm
Fig. 6 Sketch of »he Test Unit I Model Launcher
> rn O O • -I
rO u

AEDCTR-65.132
a. Photograph of the Sphere Model and Sabot
Model
Sabot Dimensions in mm, Typical Weight:
Sphere 1.2gm Sabot 1.0 gm
b. Sketch of the Sphere Model and Sabot
Fig. 7 The Aluminum Model and Polycarbonate Sabot
22
AEDC-TR-65.132
-Neutral Density Filter
Radiometer
Slit 0.76 x 0.76 cm
I-
Quartz Window
Model
-80 cm
Slit 0.76 x 9 cm
- 30 cm—|
a. Sketch of Radiometer and Slits
0.76 cm — -1.3 cm—■
Region of Total View Region of Partial View
b. Sketch of Radiometer Field of View
■a I
to
~5 E
cr\
U
!/> .a o
UQQ = 4.3 km/sec
PQO = 0.091 amg
—I h—1.7 Msec-0.76cm-
Time, 2 |Jsec/div ■* c. Typical Traces from Two Radiometers
Fig. 8 Radiometer System
23
AEDOTR-65-132
fe M Equilibrium Air 03 8000OK, 10"1 amg
PI Gil more, Ref. 6
= JJ 20 n |L
- E
•■5 - 10 to *<■ - [
\r ££ «*f i , , z nj k.
3 I ./l 1 1 H 1 L U 1
0.2 0.4 0.6 0.8
Wavelength, X, p
a. Typical Spectral Distribution ol Air Radiation
1.0
Wavelength, X, [i
b. Relativ« Spectral Response of 1P-28 Photomultiplier Tube
Fig. 9 Spectral Sensitivity of the Radiometer
24
AEDC-TR.65-132
2.0-1- r. 0> a r* I
±10%
aj
in t/i
■s a.
ft—9
±
ff—$—0- -S0L
1.0--
1—uv*
■er-e—0 Mach
—a 10.6 *—*Q—n. 2
-15 15 -10 -5 0 5 10
Distance from Tunnel Center line, cm
a. Pitot Pressure Distribution in the Vertical Plane of the Test Section
CM E u
15 a;
to c
'S
S
200 r-
100 -
Symbol Run No.
o 1 a 2 o 3 & 4
Note: Stag. Temp. ~ 1900°K Stag. Press, a 550 atm
Model Nose Radius -1.27 cm
0 100 200
Theoretical Heat Transfer Rate, w/cmz
b. Measured and Theoretical Hemisphere-Cylinder Stagnation Point Heat Transfer Rates
Fig. 10 Shock Tunnel Calibration Results for Tailored Interface Operation at Mach 10.8
25
AEDC-TR-65-132
.2 "t/i
S3
Model in Test Section from Shadowgraph (7 Runs)
nun
_L
Normal Pitot Trace
2 4 6 8 10 12 14
Time from Shock Tunnel Diaphragm Rupture, msec
a. Typical Pitot Pressure Trace
16
.2 8000 IS)
| 4000
o £ o 0 J I
Shock Tunnel Diaphragm Rupture (0)
Model at Throat
UJUI (7 Runs)
r ! Mode? Impact at Nozzle Throat
10 12
Fire Launcher (2.5 msec)
b. Typical Total Pressure Trace
Fig. 11 Events During a Counterflew Run
14 16
26

AEDC-TR-6S-132
Source
-L
Pj - 0.1 cm Hg,
P2~ 0.12 amg
= 0.03 amg
1.0 amg
0.006 cm Hg, : 0.01 amg
Shock-cap Enthalpy, r^, km^/sec2
_L J L J L 12 14 16 4 6 8 10
Velocity, uw, km/sec
Fig. 12 Comparison of the Radiation Measurements with Theory and Data from Other Facilities
27
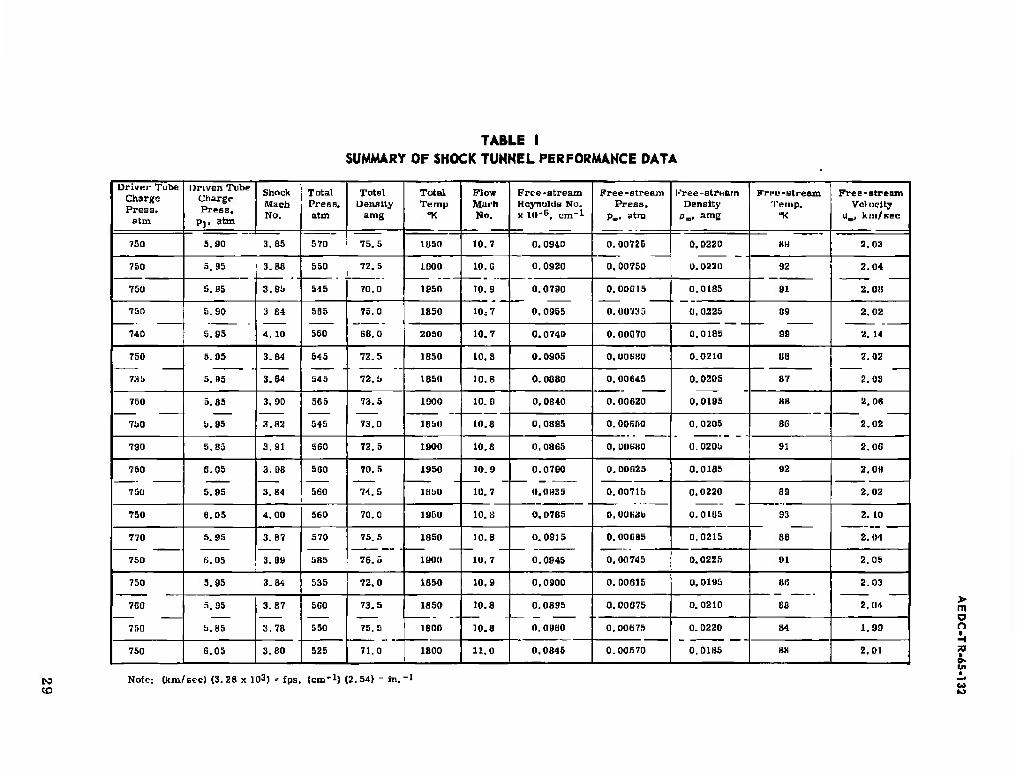
TABLE I SUMMARY OF SHOCK TUNNEL PERFORMANCE DATA
DriwHi- Tube Charge Presa.
atm
Driven Tube Charge Press,
pp atm
Shock Mach No.
. if
Total Liens ity
amg
Total Temp
"K
Flow Miii'h No.
Free-stream Reynolds No. x HI"5, cm"1
Free-stream Press.
P„. »tm
h'ree-stream Density
pm, amg
Fri-u-stream Temp.
Free-stream Velocity
U„J km/Bee
750 5.90 3.85 570 75.5 1850 10.7 0. 0940 0.00725 0. 0220 KM 2.03
750 5. 95 3. 88 550 72.5 1300 10. 0 0.0920 0.00750 0.0220 92 2.04
2.08 750 5. 95 3.95 545 70.0 1950 10.9 0.0790 0. 00015 0.01S5 91
750 5.90 3 84
4. 10
5S5 75. 0
68.0
1850 10; 7 0.0955 0. 00735 0.0225 09 2.02
740 5.95 560 2050 10.7 0.0740 0.00G70 0.0185 9B 2. 14
750
735
5.95 3.84 545
545
72.5 1850 10.8 0.0905 0.006BU 0.0210 U!i 2.02
2.03 5.95 3.84 72.5 185(1 10.8 0.0880 0.00645 0. 0205 87
750 5.85
Si. 95
3.90 565
545
73.5
73.0
1000 10. D 0, 0840 0.00620 0.0195 HH 2.06
750 3.82 1650 10.8 0,0895 0. 00650 0.0205 8G 2.02
790 5.85 3.91 560 72.5 1900 10.8 0.0865 0. OD6H0 0.0205 91 2.0G
750 6.05
5.95
3. 98
3.84
560
560
70.5
74.5
1950 10.9 0.0790 0.00 025 0.0185 92 2. OH
750 1850 10.7 0.0 »3 5 0.00715 0.0220 89 2.02
750 6.05 4.00 560 70.0 1950 10.8 0.0785 0. OOHMii 0.01U5 S3 2. 10
2.0-1 770 5.95 3. B7
3.09
5 70
585
75.5 1850
1900
10.8 0.0915 0.00GS5 0.0215 B8
750 6.05 76.5 10.7 0.0945 0.00745 0.0225 91 2.05
750 5.95 3.84 535 72.0 1850 10.9 0,0900 0. 00615 0.0190 86 2.03
700
750
5. 9a
5.05
3.87
3.78
560
550
73.5
75,5
1850 10.8
10.8
0.0895
0.0960
0. 00G75 0.0210 88 2.04
ionn 0.00675 0.0220 84 1.99
750 6,05 3.80 525 71.0 1800 11.0 0.0845 0.00570 0.0185 m 2.01
CO CO
Note: (km/sec) (3. 28 x 103) = fpa, {cm*1} (2. 54) - in. ">
> m n

o TABLE II
SUMMARY OF LAUNCHER PERFORMANCE AND RADIATION DATA
Lftunchrr Powdor Charge, Velocity,
uB, km/scc
FrcD-Mreuin or Hiingc PreBb.
pm, atm
Holatlvc Much
No.
Relative Reynolds No. X 1U-6. oiTi-1
Shock-Cup UoriRlty.
t>2, amg
Shock Cap Shock-Cd|J Temp, l,,nthalp%r
T2.*K h?. km2/sut:2
■'ohs' wutt/et
K .1. *atl/ut
VU(T, watt/ em* -st
lljO 7. 3B 0.00725 38.0 0.340 0,315 82IIII 1 27 2 0.54 0, G8 0.79 0.0072 110
100 7. 16 0.00750 37.4 0.325 0.310 Sllbcl 25.8 0.55 0.6S 0.79 110
130 6,77 0.00B15 35.4 0.255 0.250 7630 22.9 0. 14 0,67 0.21 29
130 6.70 0.00735 35.4 0.315 0,305 7650 22.0 0. 15 0.G0 0.23 32
130 6.64 0.00070 33.3 0.230 0.250 7550 22.2 0.21 (1.G7 0.31 43
130 B. 61 0. OUtflO 35.1 0.295 0.285 7550 21.9 0, 17 0.66 0.2C 0. 0072 3G
120 6.59 0. OOfMb 35 4 0. 2S5 0.271 7550 21. B 0.41 0.66 0.62 86
130 8.58 0.00520 :i5.o 0.270 0.260 75 0U 21.7 0.16 0.86 0.27 38
120 6.54 0. 00650 3S.0 0.290 0.275 75110 21.6 0.16 0.66 0.27 38
120 6.54 0. 00 680 34.3 0.275 0.270 7500 21.6 0.24 0.66 0.36 50
130 0. 40 I). Du[>25 33.3 0.240 0.24ft 7350 20.5 0.087 0. 65 0. 13 0.0072 IB
120 tt. 18 0.00715 32.9 0.290 0.285 72 50 19.3 0.0B7 n. 65 0.13 16
130 6.03 0. 00635 31.2 0.225 0. 23i 7050 16.4 0.074 0.63 0, 12 17
110 5,72 0. OO68I1 30.4 0.255 o. a (in 7000 16.4 0.057 0. 63 0.090 1\
100 5. 67 0. 00745 29.7 0.260 0.270 0750 16.2 0.096 0.62 0. 15 21
100 5.34 O.OD615 29. 8 0.235 0.235 HKOO 15.4 0.037 0.61 0.061 0.0072 8.5
no 5.46 0.00675 28.9 0.240 0.245 6550 15.0 0.042 0.61 0.069 9.6
85 5.27 0.00675 26.5 0.165 0.250 6350 14.0 0.030 0.60 0.050 6.9
100 5.27 0.00570 28. 8 0.185 0.213 6300 13.9 0.014 0. 58 0.024 3.3
160 5. 48 0.020 15.8 0.0695 0.210 6500 15.0 0.DG3 0.61 0.10 14
160 5.:w 0. 020 15.4 0. 0680 0.205 G35D 14.3 0.033 0.60 0.055 0.0072 7.6
ICQ 5.32 15.3 0.0675 0.205 6350 14.2 0.020 0.61 0.033 4.C
160 5.29 15.3 0.0675 0.205 6300 14.0 0.02a 0.61 0.046 6,4
160 5.29 15.3 0.0075 0.20b 6300 14.0 0.025 0,60 0.042 5.8
ICO 5.23 15. 1 0.0665 0.205 6250 13.7 0.028 a GO 0 047 6.!>
> m o o ■ H X A.
Kl
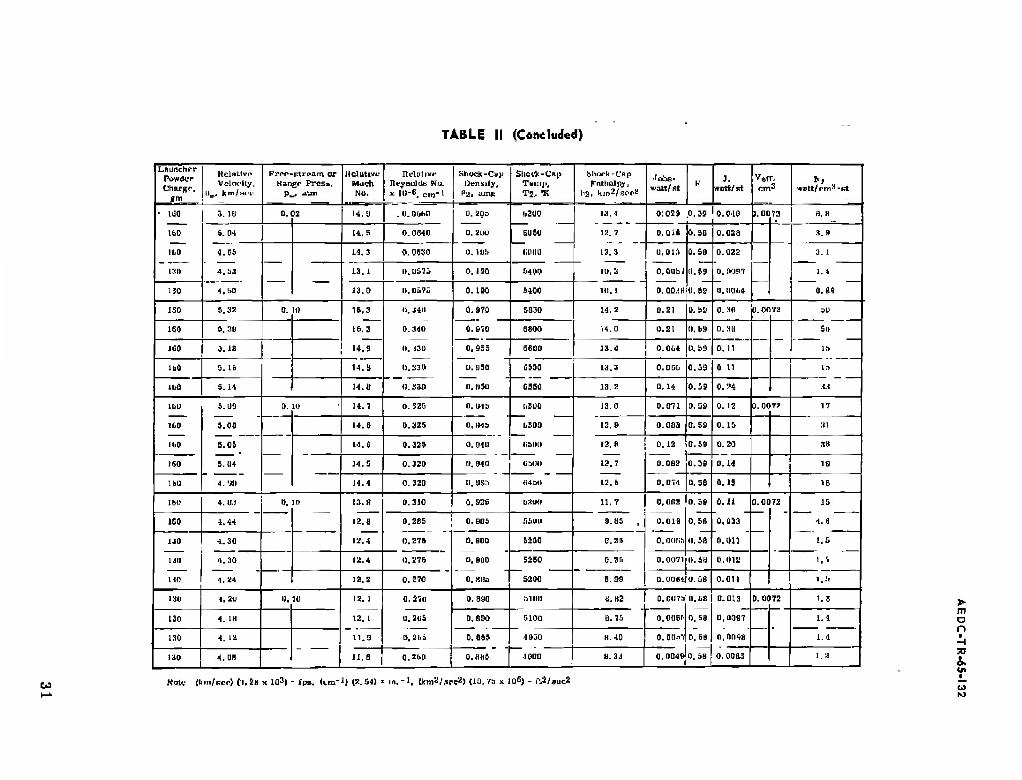
TABLE II (Concluded)
LBuncher Powder Charge.
Kclatlvp Velncity,
llm, km/spi-
Frnn-rtrpam or Hangr Prosa.
Jlcllltivc Mach Nu.
Ilelative IleyiiultlB Nu.
x 10-8. ein-1
Shock -Chjj Densely,
Pa. am*
Shock-Cup Teiiiji, T2, "K
Fnthalpj.
I13. kiri2/scr2 watt/ st
K J.
wntt/rf
verr, cm» WBtt/rm^-st
' 1J0
160
11.0
mo
3. IB 0.02 14. ü . U.OdhD 0. 200
0, 21)1)
U. lU!r
4>20U
60 50
MIDI)
13.4 0:029 .0.39 0.0 IS >. 0072 6.8
S. 04 14.5 0.0640 12. 7 0.01G 0.58 0.020 3. B
4.D5
4. 53
11. S 0.0B30 12.3 0,011
O.OObf
0.00.1H
0.50
(I.S9
(1.55
0.022
U.0097
0.001.4
3. 1
13.1 a.0&7; 0.190 0400 111, a 1. 4
0.Ä9 130 4. ill) 13.0 D.057Ü 0.190 5400 10.1
160 S. 32 0. m IS. 3
18. 3
14.3
U. J4II
0.340
II. (31)
U.S30
0.870 5030 14.2 0.21 0. bit 0.30 0. 0072 31)
51) ~
13
ISO 5. 3D 0.670 S300 14.0 0.21 0. »9 D. 3Ü
- 100 3. 10 0.955 S600 13.4 0.064 0. !>«J 0. 11
IbO 5. IB 14.a 1). 5)50
O, »ill
G550 13.3 0.06b o.sa 0 11 13
liiU S. 14 14. it 0.330 C550 13. a 0. 14 0. r.9 O.'M 33
IbU
160
ll.tl
5.09 B. 10 14.T 0.325 O. U43 1,500
bSOO
liaon
13.0 0.071 0.59 0. 12 0.OO7H 17
5.011 14. a 0.325 0.H43 12,9 o.ooa 0.59 0. 15 SI
5.0s
5.1)4
4. <><>
14.6 0.32? 0. [140 12.» ! 0.12 0.59 0.20 28
mo 14. 5 0.320 O, (Mil (ilHH) 12.7
12.5
0.093 0.39 0.11 IS
16U 14.4 0.320 11. U3:> «4 al 0.074 0.58 0.13 IB
ldO 4.8.1 0. ID 1.1.9
12. a
12.4
0.310 0.930 ü£«fl 11.7 0,002
0.019
0. nwiii
0.59
0.58
(i. 5a
0.11
0,033
0.011
O.O0T2 IB
4.8
1.5
150 4.44 0.285 0. 805 551III 9.85
1.(0
1.11!
11D
4.30 0.276 0.900 5250 G.2!i
1.30
4,24
12.4 U.27R 0, »QO
O.KIIa
5250 9.25 0. 0O71 11. 5« ((.Uli; 1. ''
12.2 0.270 5200 8.90 0. 0064|0. ÜB 0.011 !.■■
I:;I.I 4. 211 1). m -12. 1
12. 1
11.0
0. 270
0,205
[), 2b5
0. SSW .11 ill) li. K2 D.0O75
0. 0(16 b
0.58 0.013 0.0072 1.8
130 4. IB 0.R9O 5100 a. 7!> 0.58 0,0097
1.1
130 4. 12
- — o.ons 4030 8.40 0. DDn7 D. SB
0. 58
0,0098 1.4
ISO 4. OB 11. B 0.200 ■ 0. Htii 4000 8. 3J 0.0040 1
O.O0B3 1. a
u Note (Im/scr) (!.2B X 103| - fps. tun"1) (2.54) « irt.-l. tkm2lr.ee'*) (111.7s * 10^) - n.2/suc2
> m □ n * -1 70 A.
u

UNCLASSIFIED Security Classification
DOCUMENT CONTROL DATA • R&D (Security classification of title, body of abstract and mderttng annotation must b» amend whan the overall report la classified)
I ORIGINATING ACTIVITY (Corporals author) Arnold Engineering Development Center ARO, Inc., Operating Contractor Arnold Air Force Station, Tennessee
Za REPORT SECURITY CLASSIFICATION
UNCLASSIFIED 2 b GROUP
N/A 3 REPORT TITLE
INITIAL OPERATION OF THE PILOT COUNTERFLOW TEST UNIT (I)
4 DESCRIPTIVE NOTES (Type ot report and Inclusive date»)
N/A S AUTKORfSJ (Last name, tint name, Initial)
Ball, Henry W,
6. REPORT DATE
July 1965 la. TOTAL NO. OF PAGES
36 7b. NO OF REPS
18 da CONTRACT OR GRANT NO.
b. PROJECT NO.
AF 40(600)-1000 9a. ORISINATOR'S REPORT NUMBHR/S.)
AEDC-TR-65-132
«Program Element 62405334/8952
«fTask 895201
9b. OTHER. REPORT NOfSj (Any otherBumbere that may ba assigned Ala report)
N/A 10. AVAILABILITY/LIMITATION NOTICES
Qualified requesters may obtain copies of this report from DDC.
11 SUPPLEMENTARY NOTES
N/A
12. SPONSORING MILITARY ACTIVITY
Arnold Engineering Development Center Air Force Systems Command Arnold AF Station, Tennessee
13 ABSTRACT
A small counterflow test unit which consists of a shock tunnel and a hypervelocity launcher is being evaluated at the VKF, AEDC. The results of the shock tunnel calibration, the performance of the model launcher system, counterflow operating experiences, and some pre- liminary measurements of shock-cap radiation are reported. The shock tunnel calibration data for a room-temperature, helium driver gas are shown to confirm theoretical calculations and indicate clean uniform flow during a 4- to 5-msec run time. Aluminum spheres of 0.95-cm diam (0.375 in.) were launched with a 2-stage, light-gas gun at ve- locities between 4.0 and 5.5 km/sec (13,000 and 18,000 fps) . During counterflow runs, relative velocities up to 7.5 km/sec (25,000 fps) were attained. Measurements of total radiation from the shock-caps of the small spheres are in reasonable agreement with theories and previous measurements from free-flight and shock-tube facilities.
DD FORM 1 JAN «4 1473 UNCLASSIFIED
Security Classification

UNCLASSIFIED Security Classification
14- KEY WORDS
LINK A
ROLE
LINK B MOLE
LINK C
counterflow tunnel
radiation heat transfer rates facilities
environmental tests
hypersonic flow
launcher
aerodynamic testing
INSTRUCTIONS
1. ORIGINATING ACTIVITY: Enter the name and address of the contractor, subcontractor, grantee, Department of De- fense activity or other organization (corporate author) Issuing the report.
2a. REPORT SECURITY CLASSIFICATION: Enter the over- all security classification of the report. Indicate whether "Restricted Data" is included. Harking is to be In accord- ance with appropriate security regulations»
2b. GROUP: Automatic downgrading is specified in DoD Di- rective 5200^ 10 and Armed Forces Industrial Manual. Enter the group number. Also, when applicable, show that optional markings have been used for Group 3 and Group 4 as author- ized.
3. REPORT TITLE: Enter the complete report title In all capital letters. Titles in all cases should be unclassified. If a meaningful title cannot be selected without classifica- tion, show title classification in all capitals in parenthesis immediately following the title.
4. DESCRIPTIVE NOTES If appropriate, enter the type of report, e.g., interim, progress, summery, annual, or final. Give the inclusive dates when a specific reporting period is covered. 5. AUTHOR(S): Enter the name(s) of authoKs) as shown on or in the report. Entej last name, first name, middle initial. If military, show rank and branch of service. The name of the principal cjthor is an absolute minimum requirement.
6. REPORT DATL: Enter the date of the report as day, month, year; or month, year. If more than one date appears on the report, use date of publication.
la. TOTAL NUMBER OF PAGES: The total page count should follow normal pagination procedures, i.e.. enter the number of pages containing information. 7b. NUMBER OF REFERENCES: Enter the total number of references cited in the report. 8a. CONTRACT OR GRANT NUMBER: If appropriate, enter the applicable number of the contract or grant under which the report was written. 8b, 8c, & 8a*. PROJECT NUMBER: Enter the appropriate military department identification, such as project number, subproject number, system numbers, task number, etc. 9a. ORIGINATOR'S REPORT NUMBER(S): Enter the offi- cial report number by which the document will be identified and controlled by the originating activity. This number must be unique to this report. 9b. OTHER REPORT NUMbER(S): If the report has been ass-gned any other report numbers (either by the originator or by the sponsor), also enter this number(s).
10. AVAILABILITY/LIMITATION NOTICES: Enter any lim- itations on further dissemination of the report, other than those
imposed by security classification, using standard statements such as:
(1) "Qualified requesters may obtain copies of this report from DOC"
(2) "Foreign announcement and dissemination of this report by DDC is not authorized. "
(3} "U. S. Government agencies may obtain copies of this report directly from DDC. Other qualified DDC users shall request through
(4) "U. S. military agencies may obtain copies of this report directly from DDC Other qualified users shall request through
(5) "All distribution of this report in controlled. Qual- ified DDC us STB shall request through
If the report has been furnished to the Office of Technical Services, Department of Commerce, for sale to the public, indi- cate this fact and enter the price, if known.
II. SUPPLEMENTARY NOTES: Use for additional explana- tory notes,
1Z SPONSORING MILITARY ACTIVITY: Enter the name of the departmental project office or laboratory sponsoring (pay- ing for} the research and development. Include address. 13. ABSTRACT: Enter an abstract giving a brief and factual summary of the document indicative of the report, even though it may also appear elsewhere in the body of the technical re- port. If additional space is required, a continuation sheet shall be attached.
It is highly desirable that the abstract of classified reports be unclassified. Eech paragraph of the abstract shall end with an indication of the military security classification of the in- formation in the paragraph, represented as (TS). (S). (C). or ft/;.
There is no limitation on the length of the abstract. How- ever, the suggested length is from 150 to 225 words.
14- KEY WORDS: Key words are technically meaningful terms or short phrases that characterize a report and may be used as index entries for cataloging the report. Key words must be selected so that no security classification is required. Identi- fiers, such as equipment model designation, trade name, military project cade name, geographic location, may be used as key words but will be followed by an indication or technical con- text. The assignment of links, rules, and weights is optional.
UNCLASSIFIED Security Classification