vpm and pom nuclei of the rat somatosensory … and pom nuclei of the rat somatosensory thalamus:...
TRANSCRIPT
VPM and PoM Nuclei of the RatSomatosensory Thalamus: IntrinsicNeuronal Properties and CorticothalamicFeedback
Carole E. Landisman and Barry W. Connors
Department of Neuroscience, Division of Biology and
Medicine, Brown University, Providence, RI 02912, USA
Sensory information originating in individual whisker follicles as-cends through focused projections to the brainstem, then to theventral posteromedial nucleus (VPM) of the thalamus, and finallyinto barrels of the primary somatosensory cortex (S1). By contrast,the posteromedial complex (PoM) of the thalamus receives morediffuse sensory projections from the brainstem and projects to theinterbarrel septa of S1. Both VPM and PoM receive abundant cor-ticothalamic projections from S1. Using a thalamocortical slicepreparation, we characterized differences in intrinsic neuronal prop-erties and in responses to corticothalamic feedback in neurons ofVPM and PoM. Due to the plane of the slice, the majority of ourobserved responses came from activation of layer VI because mostor all of the layer V axons terminating in PoM are cut.We found that VPM neurons exhibit higher firing rates than PoM
neurons when stimulated with injected current. Stimulation of cor-ticothalamic fibers evoked monosynaptic excitation, disynaptic inhi-bition, or a combination of the two in both nuclei. A few differencesin the feedback responses emerged: purely excitatory postsynapticpotentials (EPSPs) in VPM were smaller and facilitated more thanthose in PoM, and only the EPSPs in VPM had a strong NMDA com-ponent. For both nuclei, some of the feedback responses were purelydisynaptic inhibitory postsynaptic potentials (IPSPs) from the tha-lamic reticular nucleus (TRN). This was due to EPSP failures withinVPM and PoM combined with greater reliability of S1-originatingsynapses onto TRN. These findings suggest that despite theexclusively excitatory nature of corticothalamic fibers, activationof cortex can trigger excitation or inhibition in thalamic relayneurons.
Keywords: electrophysiology, excitation, higher order nucleus, inhibition,relay nucleus
Introduction
Sensory systems of the brain have hierarchical features, but
there are also parallel pathways of sensory information. Within
the parallel hierarchies of the forebrain lie enormous feedback
connections. That is, each area of primary sensory cortex sends
efferent fibers back to the relay area of thalamus from which it
receives feedforward input. These corticothalamic feedback con-
nections often greatly outnumber the thalamocortical feedfor-
ward connections, in some cases by 40 to 1 (Sherman and Koch
1990). Despite the dramatic scale of these anatomical findings,
the functional significance of corticothalamic connections is
poorly understood. Speculations about the function of cortico-
thalamic connections include sharpening and/or amplifying re-
ceptive field responses, focusing attention, and modulating
receptive field properties based on contextual information (Ster-
iade et al. 1993; Sherman andGuillery 2002; Sillito and Jones 2002).
Corticothalamic synapses are glutamatergic and can activate
a-amino-3-hydroxy-5-methyl-4-isoxazolepropionic acid,N-methyl-
D-aspartate (NMDA), and metabotropic glutamate postsynaptic
receptors (Bromberg et al. 1981; De Biasi and Rustioni 1990;
Deschenes and Hu 1990; Scharfman et al. 1990; McCormick and
vonKrosigk 1992; Long et al. 2004; Landisman and Connors 2005).
Thus, the activation of corticothalamic fibers can cause a general
increase in excitability of thalamic relay neurons. Though both
feedforward and feedback fibers make glutamatergic synapses
onto thalamic neurons, only the feedback fibers contact the
metabotropic glutamate receptors (mGluRs; Martin et al. 1992;
Godwin et al. 1996; Liu et al. 1998; Vidnyanszky et al. 1996).
Activation of mGluRs can shift the state of thalamic neurons from
burst firing to single spiking mode (McCormick and von Krosigk
1992). These 2 neuronal states are often associated with sleep and
arousal, respectively (Steriade et al. 1993), although bursting may
occur duringwakefulness aswell (Ramcharan et al. 2000; Swadlow
and Gusev 2001).
In order to understand the functions of corticothalamic con-
nections more completely, it is important to consider aspects of
the anatomy as well as the physiological behavior of the local
circuitry. In the rat whisker barrel system, the cortical barrel
fields project onto several nuclei in somatosensory thalamus.
Neurons in 2 of these nuclei exhibit very different receptive field
sizes, and the projections they receive from primary somato-
sensory cortex (S1) differ in their source, number, and synapse
characteristics (Hoogland et al. 1987; Chiaia et al. 1991; Diamond,
Armstrong-James, Budway, and Ebner 1992; Diamond, Armstrong-
James, Ebner 1992; Lu and Lin 1993, though see Alloway et al.
2003). The ventroposteromedial nucleus (VPM) and the medial
portion of the posterior complex (PoM) are somatotopically
organized in a mirror image fashion about their common border
(Nothias et al. 1988). Under surgical levels of anesthesia, vibrissal
neurons in the PoM have an average receptive field size of 5
whiskers (Chiaia et al. 1991; Diamond, Armstrong-James, Ebner
et al. 1992).Neurons inVPM are clustered into discrete barreloids.
Each barreloid contains neurons most sensitive to one particular
whisker and receives input from (and sends output to) one
particular S1 barrel (Senft and Woolsey 1991; Diamond, Arm-
strong-James, Ebner et al. 1992; Agmon et al. 1995; Land et al.
1995). By contrast, the anatomy and connectivity of PoM is more
diffuse (Bourassa et al. 1995). Responses of PoM cells to whisker
movement can be largely suppressed by inactivation of cortical
inputs, whereas VPM neurons continue to respond briskly under
similar conditions (Diamond, Armstrong-James, Budway, Ebner
et al. 1992). The effects of silencing cortical input on PoM
responses are large, yet the synaptic mechanisms of feedback
onto PoM or VPM neurons are not known.
Dramatic differences in the anatomy of the corticofugal syn-
apses onto PoM and VPM neurons suggest that the 2 pathways
are functionally very different. The upper portion of layer VI of
S1 sends projections to VPM, and the lower portion of layer VI
Cerebral Cortex December 2007;17:2853--2865
doi:10.1093/cercor/bhm025
Advance Access publication March 26, 2007
� The Author 2007. Published by Oxford University Press. All rights reserved.
For permissions, please e-mail: [email protected]
at Pennsylvania State University on February 20, 2013
http://cercor.oxfordjournals.org/D
ownloaded from
sends themajority of its projections to PoM, though a small num-
ber of these neurons also send collaterals to VPM (Hoogland
et al. 1987; Bourassa et al. 1995; Killackey and Sherman 2003).
Furthermore, corticothalamic axons originating in layer V project
exclusively to PoM. All of the axons originating from layer VI
neurons are thin, and they terminate in small synaptic boutons
on thalamic relay neurons. By contrast, the layer V terminals
arise from large caliber axons and form large synaptic boutons.
As a general rule, large synaptic terminals have more active
zones, release transmitter more reliably, and are thus more ef-
ficacious (Pierce and Lewin 1994). It has been proposed that
the layer VI inputs play a more modulatory role, whereas the
layer V inputs serve as the primary ‘‘driver’’ of PoM cells
(Sherman and Koch 1990; Feig and Harting 1998; Sherman
and Guillery 1998; Reichova and Sherman 2004).
In this study, we first compare the intrinsic membrane prop-
erties of VPM and PoM neurons; differences in physiological
properties could help to explain the response properties of
these 2 neuronal groups in vivo. We then compare the con-
sequences of activating corticothalamic feedback fibers on VPM
and PoM neurons.
Materials and Methods
Slice PreparationSprague-Dawley rats aged P14--P21 were anesthetized using thiopental
sodium (50 mg/kg). The rats were then decapitated, and the brains
removed and quickly placed in ice-cold artificial cerebrospinal fluid
(ACSF) bubbled with 95% CO2/5% O2. The composition of the ACSF
was (in mM) 126 NaCl, 3 KCl, 2.0 MgSO4, 1.25 NaH2PO4, 26 NaHCO3,
2 CaCl2, and 10 dextrose. Thalamocortical slices were obtained as
described previously (Agmon and Connors 1991) using a Vibroslice
(Campden Instruments, Lafayette, IN). Three 400-lm sections (from
each hemisphere) containing the somatosensory thalamus and cortex
were prepared and placed either onto pieces of vinyl mesh in an
interface holding chamber or into a submersion chamber. The chambers
contained oxygenated ACSF, and slices were incubated for 1 h at 33 �Cand subsequently at room temperature. All experiments were carried
out in accordance with National Institutes of Health (NIH) guidelines.
Electrophysiological RecordingsAfter incubation in the holding chamber, an individual slice was trans-
ferred to either an interface recording chamber or a submersion chamber
held at 32--33 �C. Whole-cell patch recordings were made using glass
microelectrodes (5--7 MX) filled with internal solution (in mM: 138 K
gluconate, 4 KCl, 2 NaCl, 10 4-(2-hydroxyethyl)-1-piperazineethane-
sulfonic acid, 0.2 ethyleneglycol-bis(2-aminoethylether)-N,N,N 9,N 9-tet-
raacetic acid (EGTA), 4 ATP-Mg, 0.3 GTP--Tris, and 7
phosphocreatine--Tris; final pH 7.25). An Axoprobe--1A amplifier (Axon
Instruments, now Molecular Devices, Sunnyvale, CA) was used
in conjunction with a Labview A/D board and software (National
Instruments, Austin, TX) and a PC computer (Dell, Austin, TX) for data
acquisition. Data were digitized and collected at 20 kHz. A small
concentric bipolar stimulating electrode (FHC cat#CBBRC75; outer
diameter [OD] 200 lm, inner diameter [ID] 12.5 lm, Bowdoin, ME)
was placed either in deep layer VI or the internal capsule (IC)
containing fibers of passage from cortex to thalamus. Stimulation
currents ranging from3 to400lA,200lsecduration,wereused to evoke
synaptic responses. Train data consisted of 4 shocks at a frequency
of 40 Hz, unless otherwise noted. Individual illustrations of cell
responses to single-shock stimulation or train stimulation to the IC
are averaged traces (10--20 sweeps per trace). Latency analyses did
not take into consideration the many failures observed after the first
shock in a train of stimulation. Instead, all latencies were measured
for the first pulse that generated a postsynaptic potential (PSP). Spike
widths were measured at half height in milliseconds (see Table 1).
Data were analyzed using Labview and Origin (Microcal Software
produced by OriginLab, Inc., Northampton, MA) software. Where
indicated, drugs were bath applied via the ACSF that perfused the
slice at 2 ml/min. Drug doses (in lM) were 50 bicuculline
methiodide (BMI), 20 picrotoxin, 50 DL-2-amino-5-phosphonovaleric
acid (APV), 20 6,7-dinitroquinoxaline-2,3-dione (DNQX), and 1 CGP-
62349 (a c-aminobutyric acid B [GABAB] blocker from Ciba-Geigy,
now Novartis International AG, Basle, Switzerland).
Anatomy and HistologyAnatomical tracer injections were made using dextran tetramethylrhod-
amine (10,000 MW), lysine fixable (Molecular Probes, now Invitrogen,
Carlsbad, CA). Dry tracer crystals were placed on the end of a broken
glass microelectrode, and the tip was lowered into the target region of
the slice (deep layer VI of S1 cortex). Slices were then left in the holding
chamber at room temperature for 8--12 h. After tracer incubation, slices
were placed in 4% paraformaldehyde with 20% sucrose overnight.
Finally, slices were resectioned on a freezing microtome into 80-lmsections, mounted on gelatinized slides, and fixed using a cover slip with
a solution made from 100 ml of 1 part 0.1 M phosphate-buffered saline, 3
parts glycerin, and 1 ml of saturated aqueous purpurogallin (a free
radical scavenger; recipe courtesy of Dr Stewart Hendry, Johns Hopkins
University).
Results
Anatomical Confirmation of the CorticothalamicPathway and Localization of Nuclei
To confirm that the corticothalamic fibers were intact in the
thalamocortical slice preparation, injections of the anterograde
tracer rhodamine--dextran were made into layer VI and in-
cubated for several hours (see Materials and Methods). Rhoda-
mine labeling (Fig. 1A,B) confirmed that individual cells in layer
VI sent axons to the thalamus via the internal capsule. In the
example shown, fibers can be seen both in the TRN as well as
the ventrobasal complex (VB) nuclei (Fig. 1B). However, trans-
port to PoM was not seen, probably because we were unable to
maintain the slice long enough to get full transport. This inter-
pretation is supported by our subsequent observation of mono-
synaptic excitation of the thalamic nuclei from stimulation of
corticothalamic fibers (see below).
To distinguish VPM from PoM cells, we first made sure we
could accurately localize each nucleus in living slices cut in the
thalamocortical plane (Agmon and Connors 1991). Under bright
field illumination in the recording chamber, the PoM appears as
a darker (in the interface chamber, lit from above) or lighter (in
the submersion chamber, transilluminated; see Fig. 1C), triangle-
shaped region medial to the arc-shaped band of VPM that, in
turn, is medial to the ventral posterolateral nucleus (VPL) and
the TRN. The clear distinction seen in the recording chamber
assured proper targeting of each nucleus. Cresyl violet staining
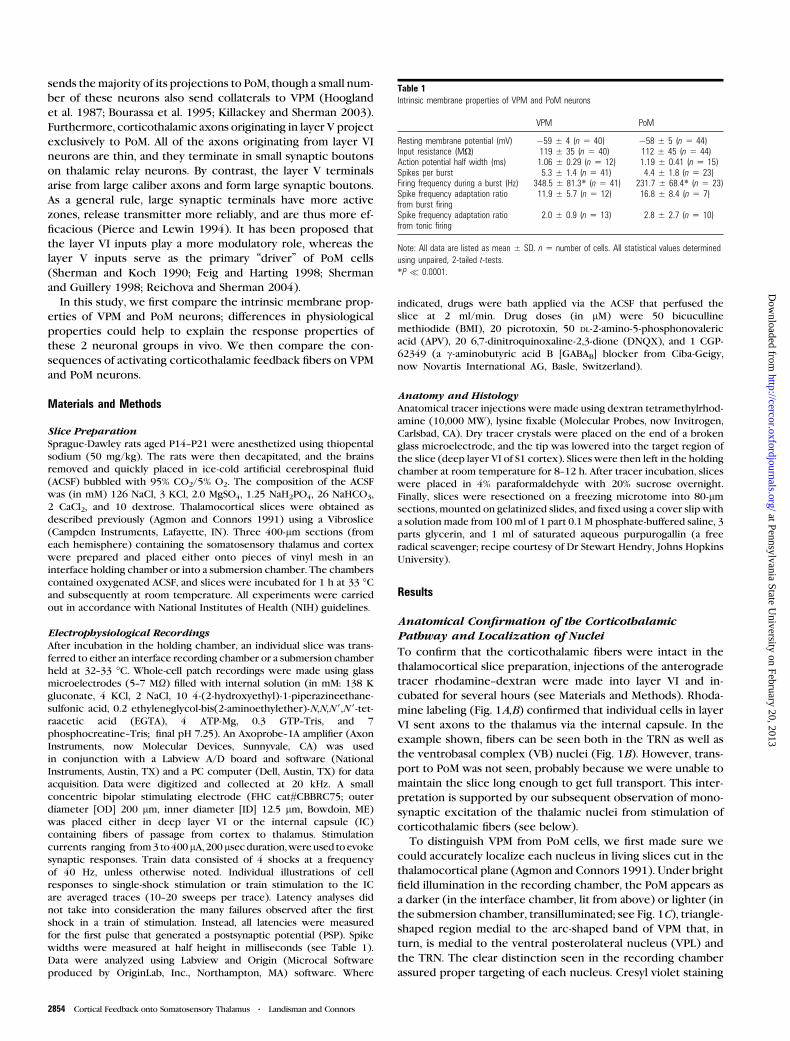
Table 1Intrinsic membrane properties of VPM and PoM neurons
VPM PoM
Resting membrane potential (mV) �59 ± 4 (n 5 40) �58 ± 5 (n 5 44)Input resistance (MX) 119 ± 35 (n 5 40) 112 ± 45 (n 5 44)Action potential half width (ms) 1.06 ± 0.29 (n 5 12) 1.19 ± 0.41 (n 5 15)Spikes per burst 5.3 ± 1.4 (n 5 41) 4.4 ± 1.8 (n 5 23)Firing frequency during a burst (Hz) 348.5 ± 81.3* (n 5 41) 231.7 ± 68.4* (n 5 23)Spike frequency adaptation ratiofrom burst firing
11.9 ± 5.7 (n 5 12) 16.8 ± 8.4 (n 5 7)
Spike frequency adaptation ratiofrom tonic firing
2.0 ± 0.9 (n 5 13) 2.8 ± 2.7 (n 5 10)
Note: All data are listed as mean ± SD. n 5 number of cells. All statistical values determined
using unpaired, 2-tailed t-tests.
*P � 0.0001.
2854 Cortical Feedback onto Somatosensory Thalamus d Landisman and Connors
at Pennsylvania State University on February 20, 2013
http://cercor.oxfordjournals.org/D
ownloaded from
of resectioned slices confirmed the borders of VPM and PoM as
previously defined from unstained visualization of live slices
(data not shown).
Intrinsic Membrane Properties of VPM and PoMNeurons
We characterized the intrinsic membrane properties of indi-
vidual cells by applying depolarizing and hyperpolarizing current
steps. Both VPM cells and PoM cells exhibited intrinsic firing
properties typical of most thalamic neurons (Llinas and Jahnsen
1982). They fired intrinsic bursts when activated from relatively
hyperpolarized resting potentials (Vrest more negative than --58
to --60 mV) and tonic spikes when activated from more depo-
larized potentials (more positive than --58 mV) (Fig. 2A,C). Both
cell types fired only a single burst following a depolarizing step
from hyperpolarized holding potentials (see above). If a long
(several hundred milliseconds), strong depolarizing step was
delivered from a holding potential equal to or more hyper-
polarized than –60 mV, both cell types fired a fast burst of action
potentials followed by tonic spikes (Fig. 2B,D, right).
When stimulated with the same intensity current pulses from
Vrest, VPM cells fired at much higher frequencies than PoM cells
during tonic firing. Figure 2B,D show examples of responses to
current stimulation of a VPM neuron and a PoM neuron re-
corded from the same slice. Compared with PoM cells, cells
from VPM had lower spike thresholds and much higher firing
frequencies at every stimulus intensity tested (Fig. 2E). The
differences in tonic firing frequency were not due to differences
in Vrest or input resistance, which were nearly identical in the 2
cell types (Table 1). The average widths of individual action
potentials from the 2 nuclei were also indistinguishable, with
means of 1.06 ms for VPM cells and 1.19 ms for PoM cells.
Bothcell typesgenerated aburst of actionpotentials after sudden
release from hyperpolarization (Fig. 2B,D). The mean number of
spikes per rebound burst was indistinguishable for the 2 cell types
(Table 1). However, as was the case with tonic firing, VPM cells
fired much faster than PoM neurons during each burst (Table 1).
Both VPM and PoM cells showed spike frequency adaptation
during repetitive spiking. We calculated the adaptation rates as
Fi/Ff, where Fi is the initial firing frequency and Ff is the final
firing frequency for the minimum depolarizing step that elicited
a regular train of action potentials (Beierlein et al. 2003). Fi was
the inverse of the interval between the first 2 spikes in the train,
and Ff was the inverse of the interval between the last 2 spikes in
the train during a 600-ms depolarizing step. Because both VPM
and PoM cells adapt differently depending on whether they
are in bursting or tonic firing modes, we calculated the firing
frequencies and adaptation values from burst initiated as well as
tonic firing. The mean adaptation ratios for VPM cells were 11.9
from holding potentials that evoked bursts and 2.0 during
purely tonic firing (Table 1). Adaptation rates of PoM neurons
were 16.8 from bursting trials and 2.8 from tonic firing trials.
The small differences in adaptation rates between the 2 cell
types were not statistically significant.
Corticothalamic Response Heterogeneity of VPM andPoM Cells
Stimulation of the internal capsule evoked heterogeneous
synaptic responses in both VPM and PoM cells. These included
pure excitation (Fig. 3A), pure inhibition (Fig. 3B), and combi-
nations of excitation and inhibition (Fig. 3C). As these examples
also show, the strength and balance of EPSPs and IPSPs evoked
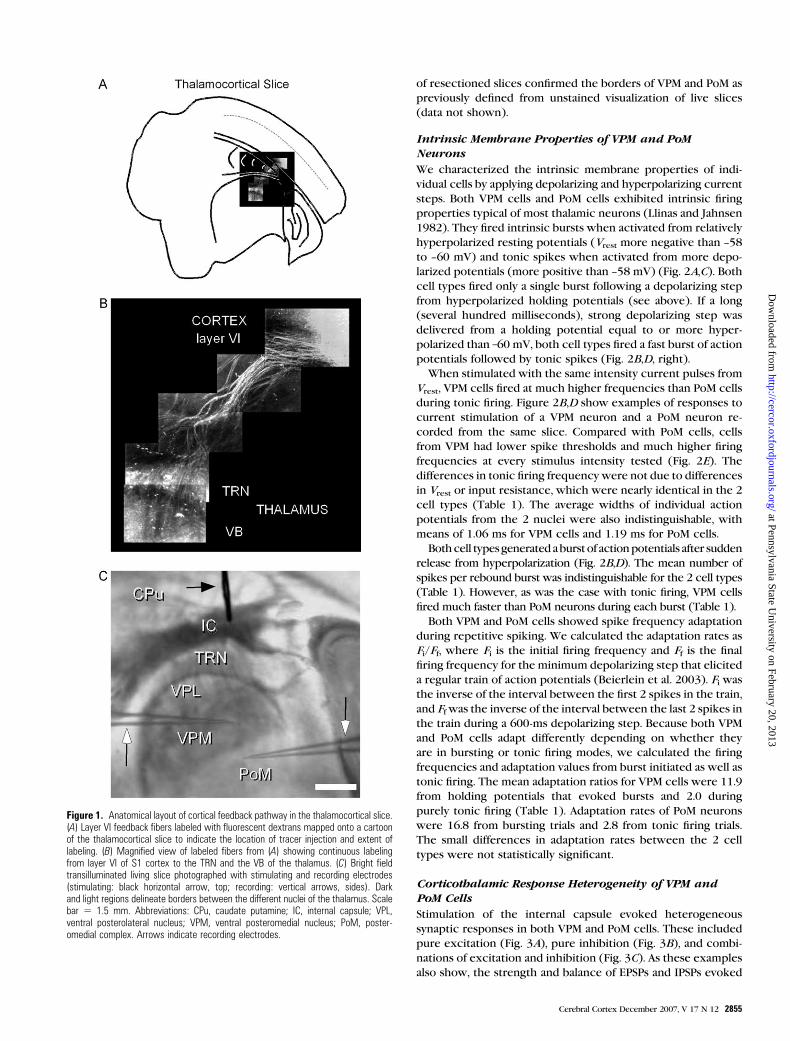
Figure 1. Anatomical layout of cortical feedback pathway in the thalamocortical slice.(A) Layer VI feedback fibers labeled with fluorescent dextrans mapped onto a cartoonof the thalamocortical slice to indicate the location of tracer injection and extent oflabeling. (B) Magnified view of labeled fibers from (A) showing continuous labelingfrom layer VI of S1 cortex to the TRN and the VB of the thalamus. (C) Bright fieldtransilluminated living slice photographed with stimulating and recording electrodes(stimulating: black horizontal arrow, top; recording: vertical arrows, sides). Darkand light regions delineate borders between the different nuclei of the thalamus. Scalebar 5 1.5 mm. Abbreviations: CPu, caudate putamine; IC, internal capsule; VPL,ventral posterolateral nucleus; VPM, ventral posteromedial nucleus; PoM, poster-omedial complex. Arrows indicate recording electrodes.
Cerebral Cortex December 2007, V 17 N 12 2855
at Pennsylvania State University on February 20, 2013
http://cercor.oxfordjournals.org/D
ownloaded from

from a single stimulus location could also vary widely as the
stimulus intensity and number were varied. A comparison of the
excitatory responses in Figure 3A to the inhibitory responses in
Figure 3B shows that the amplitudes of both increased gradually
with changes in stimulus intensity and both response types
exhibited facilitation to 40 Hz train stimuli at low to moderate
current intensities (up to 4 times threshold, or 4T for Fig. 3B and
for all stimulus values for Fig. 3C). However, at higher stimulus
intensities, the IPSPs in Figure 3B also exhibit evidence of
depression.
Not surprisingly, responses that combined excitation and
inhibition were more complex than the purely excitatory or in-
hibitory ones. As seen in Figure 3C, IPSPs could dominate and even
completely obscure EPSPs. The source of these IPSPs is the
thalamic reticular nucleus (TRN), whose GABAergic neurons
directly contact both VPM and PoM neurons (see below). At low
stimulus intensities, evidence of small monosynaptic EPSPs from
corticothalamic sources can be seen in the responses of the PoM
cell in Figure 3C, but these EPSPs were overwhelmed by
concurrent IPSPs. In addition, the reliability of EPSPs in response
to the first stimulus was very low, and thus they were not even
evident following thefirst stimulus atmoderate stimulus strengths.
Only with very high stimulus intensities (>32T) or repetitive
activation (>4T) could the EPSPs generate detectable responses.
However, in all 3 categories large increases in stimulus
intensity make it harder to distinguish the synaptic origins of
the responses because mixed fiber recruitment is likely. For this
reason, characterizations of feedback responses throughout the
paper are based on stimulus intensities between T and 2T.
Responses consisting of IPSPs alone or weak EPSPs together
with strong, low-threshold IPSPs were common in both VPM and
PoM cells in response to corticothalamic stimulation (Fig. 3D).
In 60% of VPM cells (15 of 25) and 69% of PoM cells (9 of 13),
the response profiles were strongly dominated by IPSPs: that is,
Figure 2. Firing properties of VPM and PoM cells. (A) Transition from tonic firing to burst firing in a VPM neuron at different holding potentials (þ50 pA stimulation). (B) Example ofa typical VPM neuron response to intracellular depolarizing and hyperpolarizing pulses (�100, þ100, and þ300 pA stimuli). (C) Transition from tonic firing to burst firing in a PoMneuron at different holding potentials (þ50 pA stimulation). (D) Example of a typical PoM neuron response to intracellular depolarizing and hyperpolarizing pulses (�100,þ100, andþ300 pA stimuli). (E) Plot of firing rates (mean ± standard error) for VPM and PoM neurons to different positive current injections from Vrest. Values are the final steady-statefrequencies from tonic firing during 600 ms depolarizing current pulses. N 5 8 VPM cells, and 15 PoM cells. See Table 1 for Vrest values.
2856 Cortical Feedback onto Somatosensory Thalamus d Landisman and Connors
at Pennsylvania State University on February 20, 2013
http://cercor.oxfordjournals.org/D
ownloaded from
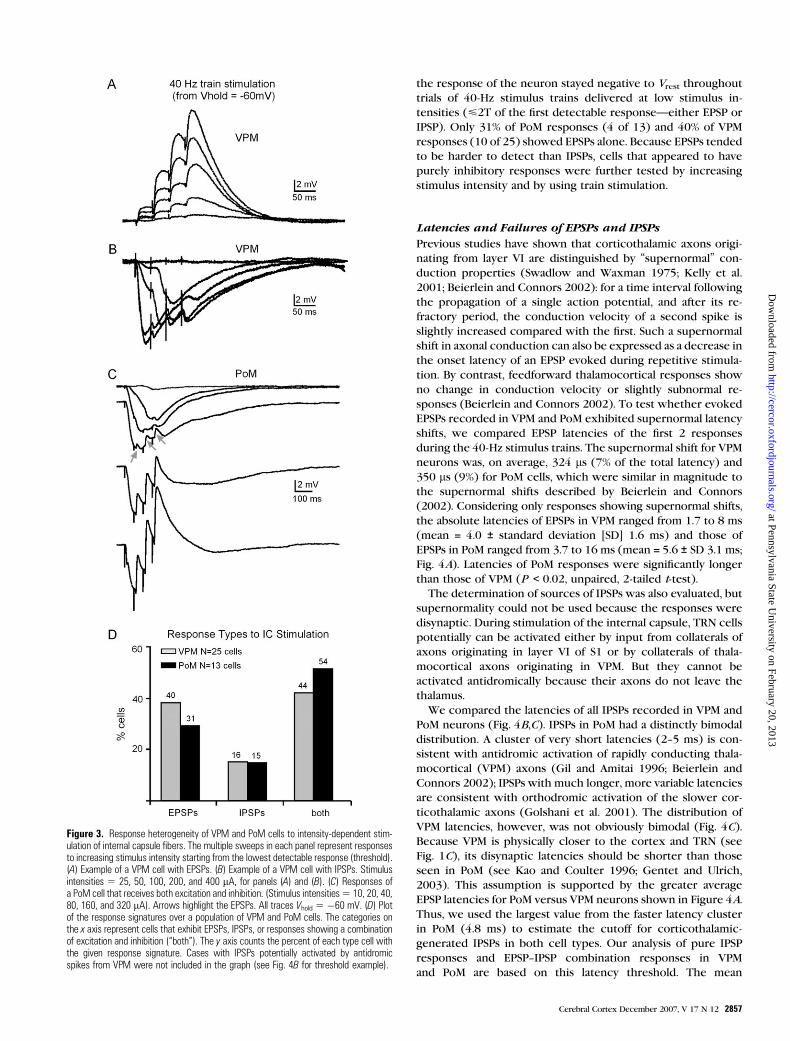
the response of the neuron stayed negative to Vrest throughout
trials of 40-Hz stimulus trains delivered at low stimulus in-
tensities (<2T of the first detectable response—either EPSP or
IPSP). Only 31% of PoM responses (4 of 13) and 40% of VPM
responses (10 of 25) showed EPSPs alone. Because EPSPs tended
to be harder to detect than IPSPs, cells that appeared to have
purely inhibitory responses were further tested by increasing
stimulus intensity and by using train stimulation.
Latencies and Failures of EPSPs and IPSPs
Previous studies have shown that corticothalamic axons origi-
nating from layer VI are distinguished by ‘‘supernormal’’ con-
duction properties (Swadlow and Waxman 1975; Kelly et al.
2001; Beierlein and Connors 2002): for a time interval following
the propagation of a single action potential, and after its re-
fractory period, the conduction velocity of a second spike is
slightly increased compared with the first. Such a supernormal
shift in axonal conduction can also be expressed as a decrease in
the onset latency of an EPSP evoked during repetitive stimula-
tion. By contrast, feedforward thalamocortical responses show
no change in conduction velocity or slightly subnormal re-
sponses (Beierlein and Connors 2002). To test whether evoked
EPSPs recorded in VPM and PoM exhibited supernormal latency
shifts, we compared EPSP latencies of the first 2 responses
during the 40-Hz stimulus trains. The supernormal shift for VPM
neurons was, on average, 324 ls (7% of the total latency) and
350 ls (9%) for PoM cells, which were similar in magnitude to
the supernormal shifts described by Beierlein and Connors
(2002). Considering only responses showing supernormal shifts,
the absolute latencies of EPSPs in VPM ranged from 1.7 to 8 ms
(mean = 4.0 ± standard deviation [SD] 1.6 ms) and those of
EPSPs in PoM ranged from 3.7 to 16 ms (mean = 5.6 ± SD 3.1 ms;
Fig. 4A). Latencies of PoM responses were significantly longer
than those of VPM (P < 0.02, unpaired, 2-tailed t-test).
The determination of sources of IPSPs was also evaluated, but
supernormality could not be used because the responses were
disynaptic. During stimulation of the internal capsule, TRN cells
potentially can be activated either by input from collaterals of
axons originating in layer VI of S1 or by collaterals of thala-
mocortical axons originating in VPM. But they cannot be
activated antidromically because their axons do not leave the
thalamus.
We compared the latencies of all IPSPs recorded in VPM and
PoM neurons (Fig. 4B,C). IPSPs in PoM had a distinctly bimodal
distribution. A cluster of very short latencies (2--5 ms) is con-
sistent with antidromic activation of rapidly conducting thala-
mocortical (VPM) axons (Gil and Amitai 1996; Beierlein and
Connors 2002); IPSPs with much longer, more variable latencies
are consistent with orthodromic activation of the slower cor-
ticothalamic axons (Golshani et al. 2001). The distribution of
VPM latencies, however, was not obviously bimodal (Fig. 4C).
Because VPM is physically closer to the cortex and TRN (see
Fig. 1C), its disynaptic latencies should be shorter than those
seen in PoM (see Kao and Coulter 1996; Gentet and Ulrich,
2003). This assumption is supported by the greater average
EPSP latencies for PoM versus VPM neurons shown in Figure 4A.
Thus, we used the largest value from the faster latency cluster
in PoM (4.8 ms) to estimate the cutoff for corticothalamic-
generated IPSPs in both cell types. Our analysis of pure IPSP
responses and EPSP--IPSP combination responses in VPM
and PoM are based on this latency threshold. The mean
Figure 3. Response heterogeneity of VPM and PoM cells to intensity-dependent stim-ulation of internal capsule fibers. The multiple sweeps in each panel represent responsesto increasing stimulus intensity starting from the lowest detectable response (threshold).(A) Example of a VPM cell with EPSPs. (B) Example of a VPM cell with IPSPs. Stimulusintensities 5 25, 50, 100, 200, and 400 lA, for panels (A) and (B). (C) Responses ofa PoM cell that receives both excitation and inhibition. (Stimulus intensities5 10, 20, 40,80, 160, and 320 lA). Arrows highlight the EPSPs. All traces Vhold 5 �60 mV. (D) Plotof the response signatures over a population of VPM and PoM cells. The categories onthe x axis represent cells that exhibit EPSPs, IPSPs, or responses showing a combinationof excitation and inhibition (‘‘both’’). The y axis counts the percent of each type cell withthe given response signature. Cases with IPSPs potentially activated by antidromicspikes from VPM were not included in the graph (see Fig. 4B for threshold example).
Cerebral Cortex December 2007, V 17 N 12 2857
at Pennsylvania State University on February 20, 2013
http://cercor.oxfordjournals.org/D
ownloaded from
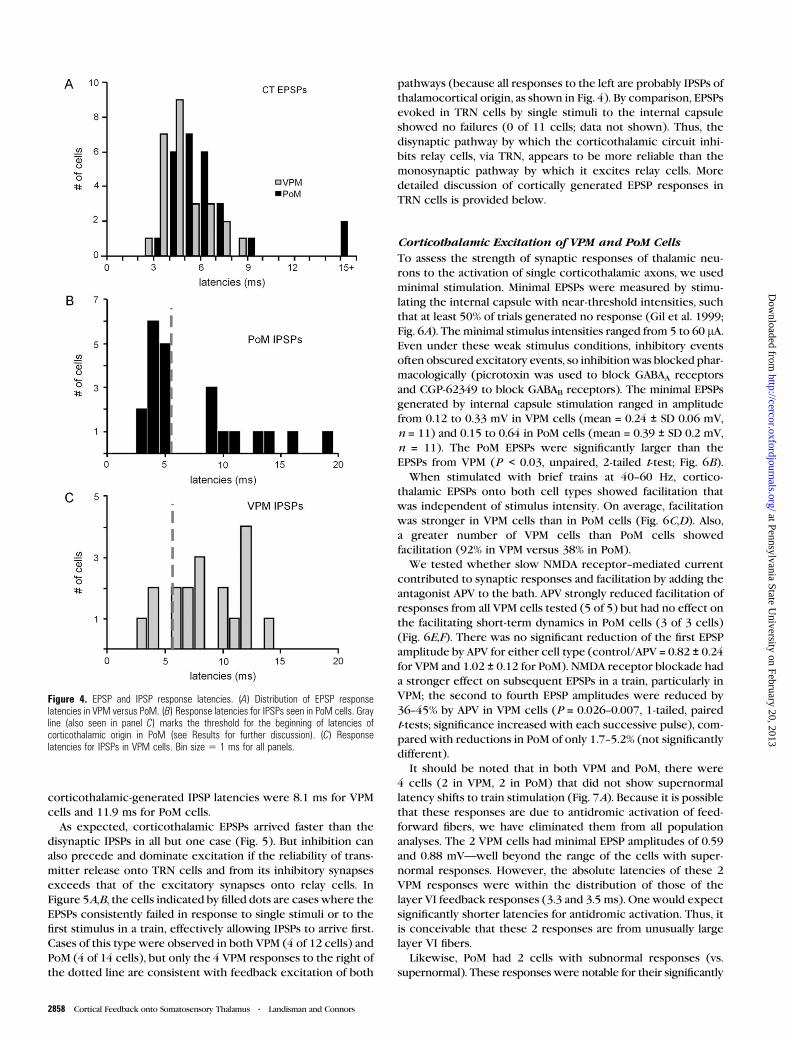
corticothalamic-generated IPSP latencies were 8.1 ms for VPM
cells and 11.9 ms for PoM cells.
As expected, corticothalamic EPSPs arrived faster than the
disynaptic IPSPs in all but one case (Fig. 5). But inhibition can
also precede and dominate excitation if the reliability of trans-
mitter release onto TRN cells and from its inhibitory synapses
exceeds that of the excitatory synapses onto relay cells. In
Figure 5A,B, the cells indicated by filled dots are cases where the
EPSPs consistently failed in response to single stimuli or to the
first stimulus in a train, effectively allowing IPSPs to arrive first.
Cases of this type were observed in both VPM (4 of 12 cells) and
PoM (4 of 14 cells), but only the 4 VPM responses to the right of
the dotted line are consistent with feedback excitation of both
pathways (because all responses to the left are probably IPSPs of
thalamocortical origin, as shown in Fig. 4). By comparison, EPSPs
evoked in TRN cells by single stimuli to the internal capsule
showed no failures (0 of 11 cells; data not shown). Thus, the
disynaptic pathway by which the corticothalamic circuit inhi-
bits relay cells, via TRN, appears to be more reliable than the
monosynaptic pathway by which it excites relay cells. More
detailed discussion of cortically generated EPSP responses in
TRN cells is provided below.
Corticothalamic Excitation of VPM and PoM Cells
To assess the strength of synaptic responses of thalamic neu-
rons to the activation of single corticothalamic axons, we used
minimal stimulation. Minimal EPSPs were measured by stimu-
lating the internal capsule with near-threshold intensities, such
that at least 50% of trials generated no response (Gil et al. 1999;
Fig. 6A). The minimal stimulus intensities ranged from 5 to 60 lA.Even under these weak stimulus conditions, inhibitory events
often obscured excitatory events, so inhibitionwas blocked phar-
macologically (picrotoxin was used to block GABAA receptors
and CGP-62349 to block GABAB receptors). The minimal EPSPs
generated by internal capsule stimulation ranged in amplitude
from 0.12 to 0.33 mV in VPM cells (mean = 0.24 ± SD 0.06 mV,
n = 11) and 0.15 to 0.64 in PoM cells (mean = 0.39 ± SD 0.2 mV,
n = 11). The PoM EPSPs were significantly larger than the
EPSPs from VPM (P < 0.03, unpaired, 2-tailed t-test; Fig. 6B).
When stimulated with brief trains at 40--60 Hz, cortico-
thalamic EPSPs onto both cell types showed facilitation that
was independent of stimulus intensity. On average, facilitation
was stronger in VPM cells than in PoM cells (Fig. 6C,D). Also,
a greater number of VPM cells than PoM cells showed
facilitation (92% in VPM versus 38% in PoM).
We tested whether slow NMDA receptor--mediated current
contributed to synaptic responses and facilitation by adding the
antagonist APV to the bath. APV strongly reduced facilitation of
responses from all VPM cells tested (5 of 5) but had no effect on
the facilitating short-term dynamics in PoM cells (3 of 3 cells)
(Fig. 6E,F). There was no significant reduction of the first EPSP
amplitude by APV for either cell type (control/APV = 0.82 ± 0.24for VPM and 1.02 ± 0.12 for PoM). NMDA receptor blockade had
a stronger effect on subsequent EPSPs in a train, particularly in
VPM; the second to fourth EPSP amplitudes were reduced by
36--45% by APV in VPM cells (P = 0.026--0.007, 1-tailed, paired
t-tests; significance increased with each successive pulse), com-
pared with reductions in PoM of only 1.7--5.2% (not significantly
different).
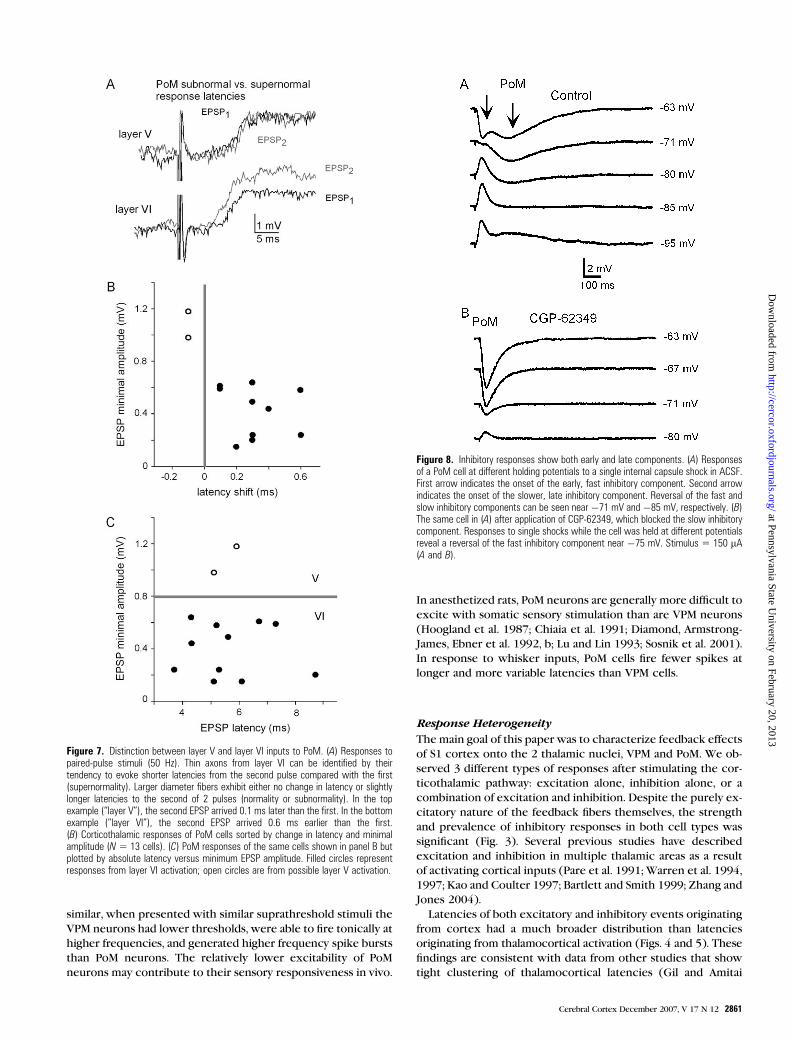
It should be noted that in both VPM and PoM, there were
4 cells (2 in VPM, 2 in PoM) that did not show supernormal
latency shifts to train stimulation (Fig. 7A). Because it is possible
that these responses are due to antidromic activation of feed-
forward fibers, we have eliminated them from all population
analyses. The 2 VPM cells had minimal EPSP amplitudes of 0.59
and 0.88 mV—well beyond the range of the cells with super-
normal responses. However, the absolute latencies of these 2
VPM responses were within the distribution of those of the
layer VI feedback responses (3.3 and 3.5 ms). One would expect
significantly shorter latencies for antidromic activation. Thus, it
is conceivable that these 2 responses are from unusually large
layer VI fibers.
Likewise, PoM had 2 cells with subnormal responses (vs.
supernormal). These responses were notable for their significantly
Figure 4. EPSP and IPSP response latencies. (A) Distribution of EPSP responselatencies in VPM versus PoM. (B) Response latencies for IPSPs seen in PoM cells. Grayline (also seen in panel C) marks the threshold for the beginning of latencies ofcorticothalamic origin in PoM (see Results for further discussion). (C) Responselatencies for IPSPs in VPM cells. Bin size 5 1 ms for all panels.
2858 Cortical Feedback onto Somatosensory Thalamus d Landisman and Connors
at Pennsylvania State University on February 20, 2013
http://cercor.oxfordjournals.org/D
ownloaded from

larger minimal amplitude (Fig. 7B), but they too had absolute
latencies similar to the layer VI--generated EPSPs (5.1 and 5.9 ms;
Fig. 7C). Although these responses might also be either from
antidromic activation or from unusually large layer VI axons,
another possibility also exists for their origin. Layer V sends
feedback to PoM characterized by large-diameter axons termi-
nating in big proximal boutons. Previously, Li et al. (2003) have
shown that EPSPs from cortical layer V to thalamus do not
display supernormal responses. But in our preparation, these
layer V axons mostly traverse a pathway that is not conserved in
the slice. However, a small subset of these fibers does travel
ventrally with the layer VI fibers (Vienante et al. 2000).
Corticothalamic Axon--Mediated Inhibition of VPM andPoM Cells
As shown previously for VPM neurons, stimulation of the
corticothalamic pathway evokes both slow and fast inhibitory
responses (Kao and Coulter 1997). Similar responses can also be
seen in PoM neurons (Fig. 8). The timing of the 2 inhibitory
components as well as their different reversal potentials
suggests that these are GABAA and GABAB receptor--mediated
IPSPs (Crunelli and Leresche 1991; Ulrich and Huguenard,
1996). The first IPSP (Fig. 8A) had a faster rise time and reversed
near –71 mV, consistent with the predicted chloride reversal
potential for these cells. The second IPSP (Fig. 8A) had a slower
rise time and reversed near –85 mV, consistent with the more
negative reversal potential of potassium. Blockade with a GABAB
receptor--specific antagonist completely eliminated the second
IPSP (Fig. 8B) and left the faster GABAA component intact. We
used IPSP latency and the rate of rise as criteria to distinguish
GABAA from GABAB responses in VPM and PoM cells and/or
blockade of either component with the antagonists BMI (for
GABAA) or CGP-62349 (for GABAB). All PoM cells (20/20) and all
but one VPM cell (16/17) showing inhibition had a GABAA-like
component. The average GABAA-IPSP amplitudes from Vrest
were –3.1 mV for PoM cells and –2.4 mV for VPM cells. VPM cells
were much less likely than PoM cells to have a GABAB receptor--
like component as part of their inhibitory responses: 7 of 17
VPM cells and 20 of 22 PoM cells had IPSPs with a GABAB
component. The average amplitudes of the GABAB-IPSP com-
ponents for PoM and VPM cells were similar (–1.3 mV vs. –1.4
mV, respectively).
Corticothalamic Activation of the TRN
Our measurements of evoked IPSPs in VPM and PoM neurons
suggested that corticothalamic axons induce strong, reliable
excitation of TRN neurons, as described above. We recorded
directly from TRN cells to test this possibility. Figure 9A
illustrates an example of the response of a TRN neuron to
minimal corticothalamic stimulation. The test for supernormal-
ity was used to determine the origin of activation (see above),
and all data shown in Figure 9 were consistent with activation
by corticothalamic axons. The corticothalamic EPSPs in TRN
cells were relatively strong, and half of the cells studied showed
clear facilitation in response to 40 Hz train stimulation; EPSPs in
the other half were stable (n = 10 cells; Fig. 9A,B).
The minimal EPSPs from cortical feedback onto TRN cells
were of much larger amplitude than those onto VPM and PoM
cells (Fig. 9C). The average minimal EPSP for TRN cells was 1.41
mV compared with 0.24 and 0.39 mV for VPM and PoM, re-
spectively. There was almost no overlap among the EPSP ampli-
tudes of TRN responses and those of the other 2 thalamic nuclei.
These data suggest that corticothalamic feedback excites TRN
neurons much more strongly than it does VPM or PoM neurons.
Discussion
The VPM and PoM nuclei provide distinctly different spatial and
temporal features of somatosensory information to the neo-
cortex (Sosnik et al. 2001; Trageser and Keller 2004; Golomb
et al. 2006). Our measurements showed that the neurons in the
2 nuclei differ in their intrinsic membrane properties and
excitability and in the nature of the synaptic feedback they
receive from corticothalamic connections.
We initially characterized the axonal connectivity of our slice
preparation, which had previously been used primarily for
studies of thalamocortical pathways but only rarely for exam-
ining corticothalamic pathways. Jones et al. (1979) found that
focal injection of a cocktail of retrograde and anterograde tracer
Figure 5. Comparison of EPSP and IPSP latencies for individual VPM (A) and PoM (B)cells showing mixed responses (both excitation and inhibition). Each circle representsthe EPSP and IPSP latency from the response of a single cell. Black dots indicate cellresponses where the EPSP failed on the first shock during train stimulation but showedEPSPs to the second shock, which was used to calculate the EPSP latency. Diagonallines indicate the location for EPSPs and IPSPs with equal latencies. Thus, circles abovethe lines indicate IPSP latencies faster than EPSP latencies, and circles below the lineindicate IPSPs with longer latencies than EPSPs. Dotted vertical lines indicate theseparation of thalamocortical-evoked IPSPs (latencies\5.5 ms) from corticothalamic-evoked IPSPs (latencies[5.5 ms). N 5 12 VPM cells, and N 5 14 PoM cells.
Cerebral Cortex December 2007, V 17 N 12 2859
at Pennsylvania State University on February 20, 2013
http://cercor.oxfordjournals.org/D
ownloaded from

into sensorimotor cortex in vivo yielded superimposed labeled
cells in cortex and thalamus (i.e., feedforward and feedback
neurons). Our labeling study in slices showed that at least some
of the layer VI projections from primary somatosensory cortex
(S1) to thalamus are intact in the slice. Anatomical confirmation
of this pathway in the slice makes it very likely that the
responses we and others (Kao and Coulter 1997; Reichova and
Sherman 2004) recorded indeed had a corticothalamic origin.
Distinguishing the VPM and PoM nuclei in both the submersion
and interface chambers was clear and unambiguous due to
differences in their optical properties, as seen in Figure 1C, and
by comparison with nuclear positions in standard atlases
(Paxinos and Watson 1998).
Intrinsic Membrane Properties
The membrane properties of a neuron largely determine how it
transforms its synaptic inputs into output patterns of action
potentials. Relay neurons of the dorsal thalamus tend to have
certain electrophysiological characteristics in common, regard-
less of their nucleus of origin. Most notably, they display 2 modes
of spiking: when activated from a relatively negative resting po-
tential, they generate bursts of spikes driven by low-threshold
calcium currents and when activated from more depolarized
resting potentials, they generate tonic trains of spikes (Llinas
and Jahnsen 1982; Jahnsen and Llinas 1984).
We compared the intrinsic firing properties of VPM and PoM
neurons. Although their passive membrane properties were
Figure 6. Characterization of EPSPs. (A) Response of a VPM cell to single minimal shocks to the internal capsule (10 lA; 20 sweeps). (B) Plot of the distribution of minimal EPSPsfor the population of VPM and PoM neurons tested. Bin size5 0.1 mV, range5 0.1--0.7 mV. N5 11 VPM cells and 11 PoM cells. Comparison of VPM (C) and PoM (D) cell EPSPresponse amplitudes to train stimulation (40 Hz). The x axes plot the stimulus number, and y axes plot the EPSP response amplitude normalized to the first EPSP, plotted on a logscale. Each line represents the response of one cell. For pulse numbers 2--4, values[1 indicate facilitation and values\1 indicate depression. Solid gray lines at y value 1 indicatesthe location of unchanging EPSP amplitudes. Dotted lines in each graph show the population average for the given cell type. (E) and (F): Examples of a VPM cell (E) and a PoM cell (F)EPSP responses before and after application of the NMDA blocker APV. Black responses are before APV application, and gray superimposed responses are during APV application.All EPSPs for this were recorded in ACSF with full inhibitory blockade using BMI and CGP-62349 (see Materials and Methods).
2860 Cortical Feedback onto Somatosensory Thalamus d Landisman and Connors
at Pennsylvania State University on February 20, 2013
http://cercor.oxfordjournals.org/D
ownloaded from
similar, when presented with similar suprathreshold stimuli the
VPM neurons had lower thresholds, were able to fire tonically at
higher frequencies, and generated higher frequency spike bursts
than PoM neurons. The relatively lower excitability of PoM
neurons may contribute to their sensory responsiveness in vivo.
In anesthetized rats, PoM neurons are generally more difficult to
excite with somatic sensory stimulation than are VPM neurons
(Hoogland et al. 1987; Chiaia et al. 1991; Diamond, Armstrong-
James, Ebner et al. 1992, b; Lu and Lin 1993; Sosnik et al. 2001).
In response to whisker inputs, PoM cells fire fewer spikes at
longer and more variable latencies than VPM cells.
Response Heterogeneity
The main goal of this paper was to characterize feedback effects
of S1 cortex onto the 2 thalamic nuclei, VPM and PoM. We ob-
served 3 different types of responses after stimulating the cor-
ticothalamic pathway: excitation alone, inhibition alone, or a
combination of excitation and inhibition. Despite the purely ex-
citatory nature of the feedback fibers themselves, the strength
and prevalence of inhibitory responses in both cell types was
significant (Fig. 3). Several previous studies have described
excitation and inhibition in multiple thalamic areas as a result
of activating cortical inputs (Pare et al. 1991; Warren et al. 1994,
1997; Kao and Coulter 1997; Bartlett and Smith 1999; Zhang and
Jones 2004).
Latencies of both excitatory and inhibitory events originating
from cortex had a much broader distribution than latencies
originating from thalamocortical activation (Figs. 4 and 5). These
findings are consistent with data from other studies that show
tight clustering of thalamocortical latencies (Gil and Amitai
Figure 8. Inhibitory responses show both early and late components. (A) Responsesof a PoM cell at different holding potentials to a single internal capsule shock in ACSF.First arrow indicates the onset of the early, fast inhibitory component. Second arrowindicates the onset of the slower, late inhibitory component. Reversal of the fast andslow inhibitory components can be seen near �71 mV and �85 mV, respectively. (B)The same cell in (A) after application of CGP-62349, which blocked the slow inhibitorycomponent. Responses to single shocks while the cell was held at different potentialsreveal a reversal of the fast inhibitory component near �75 mV. Stimulus 5 150 lA(A and B).
Figure 7. Distinction between layer V and layer VI inputs to PoM. (A) Responses topaired-pulse stimuli (50 Hz). Thin axons from layer VI can be identified by theirtendency to evoke shorter latencies from the second pulse compared with the first(supernormality). Larger diameter fibers exhibit either no change in latency or slightlylonger latencies to the second of 2 pulses (normality or subnormality). In the topexample (‘‘layer V’’), the second EPSP arrived 0.1 ms later than the first. In the bottomexample (‘‘layer VI’’), the second EPSP arrived 0.6 ms earlier than the first.(B) Corticothalamic responses of PoM cells sorted by change in latency and minimalamplitude (N 5 13 cells). (C) PoM responses of the same cells shown in panel B butplotted by absolute latency versus minimum EPSP amplitude. Filled circles representresponses from layer VI activation; open circles are from possible layer V activation.
Cerebral Cortex December 2007, V 17 N 12 2861
at Pennsylvania State University on February 20, 2013
http://cercor.oxfordjournals.org/D
ownloaded from

1996) and a broad range of corticothalamic latencies (Golshani
et al. 2001).
Excitatory Synaptic Responses
The direct effect of corticothalamic feedback on the VPM and
PoM is excitation. The amplitudes of minimal EPSPs from cortex
were significantly larger in PoM cells than in VPM cells. One of
the most important aspects of characterizing these EPSPs is
distinguishing their points of origin: whether the larger PSPs
seen in PoM come from layer V or from layer VI inputs.
Anatomically, the axons and terminals from layer V appear to
be much larger than those from layer VI. The distinction
between these 2 pathways is consistent with the idea that layer
V inputs serve as ‘‘drivers’’ to the PoM, and those from layer VI
provide a modulatory effect on activity both in VPM and PoM
(Sherman and Koch 1990; Feig and Harting 1998; Sherman and
Guillery 1998; Reichova and Sherman 2004). We think the dif-
ferences we have observed in EPSP magnitude in VPM versus
PoM largely arise from axons originating in layer VI, despite the
existence of the large layer V terminations in PoM. First, we saw
no bimodal distribution of PoM response amplitudes that would
indicate activation from layer V versus VI. This is not surprising
because the majority of layer V fibers traverse an anatomical
plane that is not preserved in the thalamocortical slice
(Veinante et al. 2000). Second, there is a large overlap in EPSP
response amplitudes (Fig. 6B), which is not consistent with
anatomical findings showing large synaptic boutons from layer
V (up to 5 lm in diameter) and very small ones from layer VI
( <1.5 lm; Bourassa et al. 1995; also see Vienante et al. 2000).
This difference in terminal size is more consistent with previous
studies of responses in higher order thalamic nuclei originating
from layer V versus VI (Li et al. 2003; Reichova and Sherman
2004). In both of those studies, the EPSPs from layer V axons
were reported to be 4--10 times the amplitude of those from
layer VI.
We did observe 2 PoM responses that may have had layer V as
their origin (Fig. 7). These 2 neurons had noticeably larger
minimal EPSP amplitudes and showed no evidence of latency
supernormality. However, their amplitudes were only modestly
larger than those observed by Li et al. (2003) and Reichova and
Sherman (2004). Another difference between our study and
that of Reichova and Sherman is that they observed no sig-
nificant difference in the amplitude of layer VI EPSPs in VPM
versus PoM. This could be due to different stimulation methods
because we used minimal stimulation and they reported am-
plitudes based on 1.5T stimulus intensities. This would also
explain why their observed EPSPs (presumably from layer VI)
were significantly larger than ours (~1.5 mV vs. ~0.2 mV).
Short-term facilitation of excitatory responses was present in
both cell types, but much stronger and more common for VPM
cells (Fig. 6C,D). In fact, the average PoM response showed no
facilitation because there were virtually equal numbers (and
equal amplitudes) of facilitating and depressing responses from
the 40-Hz train stimulation. The combination of larger EPSPs
and less facilitation suggests that layer VI terminations onto PoM
may be more reliable and thus have a stronger influence, than
those onto VPM cells.
In many cases, it was virtually impossible to elicit an EPSP
after one shock in both VPM and PoM cells (see Fig. 5A,B, filled
circles), suggesting a low probability of release from cortico-
thalamic synapses onto both cell types. This idea is supported by
the findings of Golshani et al. (2001) who have recorded pairs of
layer VI and VPM neurons. They reported a 68% failure rate of
VPM EPSPs in response to the first spike in a train from a cell in
layer VI. Our observations of such failures were slightly more
common in VPM than PoM neurons (33% vs. 20%, respectively),
further supporting our suggestion that layer VI terminations
onto PoM are more reliable than those onto VPM. We attribute
these differences to the fact that PoM cells receive input only
from lower layer VI, whereas VPM cells receive most of their
input from upper layer VI along with sparse input from lower VI
(Bourassa et al. 1995; Killackey and Sherman 2003). But it is
also possible that a single axon can have different effects on
Figure 9. Cortical feedback responses of TRN neurons to internal capsule stimulation.(A) Example response of a single TRN neuron to1.53 threshold stimulus train (40 Hz),showing strong facilitation. (B) Summary of the population of TRN responses to 40-Hztrain stimulation. All EPSP amplitudes are normalized to the response to the first pulse.The y axis is plotted on a log scale. Each line represents the responses of a singleneuron. Solid gray line indicates unchanging EPSP amplitude. Lines below solid grayshow response depression, and lines above solid gray show response facilitation.Dotted gray line indicates population average (N 5 10 cells). (C) Distribution ofminimal EPSP amplitudes for the 3 thalamic cells types: VPM, PoM, and TRN. Binsize 5 0.5 mV, range 5 0.5--4 mV. All EPSPs smaller than 0.5 mV are pooled in thefirst bin. (N 5 11 VPM, 11 PoM, and 10 TRN cells).
2862 Cortical Feedback onto Somatosensory Thalamus d Landisman and Connors
at Pennsylvania State University on February 20, 2013
http://cercor.oxfordjournals.org/D
ownloaded from

separate postsynaptic targets, as seen in neocortex (Markram
et al. 1998).
Inhibitory Synaptic Responses
GABA released onto VPM and PoM neurons activated both
GABAA and GABAB responses, as determined by their time
courses (early and late), reversal potentials, and effects of
receptor-specific antagonists. Almost all cells of both nuclear
types had a GABAA component in their inhibitory responses.
However, many more PoM cells than VPM cells showed GABAB
responses (91% vs. 37%, respectively). As with the intrinsic
firing properties, the increased prevalence of GABAB-IPSPs may
contribute to the in vivo sluggishness of PoM neurons compared
with VPM neurons. That is, the GABAB responses may keep the
cells more hyperpolarized for longer periods of time during
a similar level of TRN activation (Roy et al. 1984; Bloomfield and
Sherman 1988; Salt and Eaton 1990; Crunelli and Leresche 1991;
Pare et al. 1991; Huguenard and Prince 1994; Kao and Coulter
1997; Kim et al. 1997; Warren et al. 1997; Kim and McCormick
1998; Bartlett and Smith 1999; Ziburkus et al. 2003). In fact,
strong inhibitory input from zona incerta (ZI) has been dem-
onstrated to robustly reduce PoM responses to whisker stimu-
lation in vivo (Trageser and Keller 2004). Furthermore, it has
recently been proposed that stronger GABAB-mediated inhibi-
tion in PoM compared with that in VPM may be a key factor in
the temporal coding of information in PoM (Golomb et al.
2006). More generally, the strength of IPSPs in both VPM and
PoM could also be due, in part, to strong electrical coupling of
clusters of TRN cells (Landisman et al. 2002; Long et al. 2004;
Landisman and Connors 2005).
Corticothalamic Activation of TRN
To substantiate our conclusions of strong inhibitory activation
in the corticothalamic pathway, we made direct recordings
from a population of TRN cells and characterized their re-
sponses to internal capsule stimulation (Fig. 9). As expected,
stimulation elicited responses consistent with both feedforward
and feedback activation, based on latency analysis. However, the
majority of responses (10 of 11) had properties consistent with
a cortical origin (i.e., exhibited supernormal response latencies).
This finding further supports our earlier attempt to differentiate
IPSPs in VPM and PoM based on latency threshold (Figs. 4 and
5). The presumptive feedback-activated EPSPs in TRN were
significantly larger in amplitude compared with those seen in
VPM and PoM (Fig. 9C; also see Golshani et al. 2001) and tended
to facilitate. The strength of these connections could be due to
a very large number of terminations of layer VI--originating
axons onto individual TRN cells (Cox et al. 1997; Liu and Jones
1999; Alexander et al. 2006).
It has been shown that the ZI as well as the anterior
pretectum (APT) exhibit strong inhibitory influence on the
PoM (ZI: Lavallee et al. 2005; APT: Bokor et al. 2005). Although
both of these nuclei are present in the thalamocortical slice, the
pathway from cortex via the internal capsule to the ZI (or APT)
to PoM does not appear to be intact. Along these lines, both ZI
and APT receive their cortical excitation from layer V. As
mentioned previously, the pathway from layer V to thalamus is
mostly or completely cut in our slice plane. In fact, the prep-
aration that preserves the pathway from APT to PoM is almost
perpendicular to the thalamocortical slice used here (horizontal
vs. 10� from vertical). Taken together with our data showing
direct activation of TRN, and with previous literature showing
connectivity between relay cells and TRN cells in this prepara-
tion (Bourassa et al. 1995; Kao and Coulter 1997; Gentet and
Ulrich 2003), we consider it likely that the inhibitory events we
observed in PoM were mediated by the TRN.
Implications for Thalamic Processing
Temereanca and Simons (2004) found that feedback from
cortex is somatotopically organized in the thalamus, probably
to enhance both excitatory centers of receptive fields as well as
their inhibitory surrounds. Our observation that corticothalamic
activation can evoke excitation alone, inhibition alone, or both
provides a mechanistic framework for these in vivo findings.
There are 3 possible ways to activate a predominantly inhibitory
response in VPM and PoM cells: 1) weaker activation of
corticothalamic synapses onto relay neurons compared with
TRN neurons and 2) faster activation of the disynaptic pathway:
cortex / TRN / VB compared with the monosynaptic
pathway: cortex / VB, or 3) an ‘‘open loop’’ anatomical
organization with feedback axons that activate only the
disynaptic inhibitory pathway and do not activate direct
excitation onto certain VPM and PoM neurons (Deschenes
et al. 1998; Pinault and Deschenes 1998a, 1998b). Our data
strongly support the first idea, but at least one case (Fig. 5B) also
supports the second possibility.
More specifically, we propose a model of how the feedback
circuit achieves these varied responses originating from a purely
excitatory set of corticothalamic synapses (Fig. 10). The third
possibility has been demonstrated anatomically and is also con-
sistent with our electrophysiological findings (see Fig. 3B,D). By
providing different strengths of activation to VPM, TRN, and
PoM, cortex can differentially modulate these areas over space
and time and thus change the balance of activity in each thala-
mic nucleus. In addition to varying the strength of activation,
indicated by EPSP amplitudes, cortical inputs to thalamus can
also vary in their reliability and speed. The disynaptic inhibitory
pathway from cortex, to TRN, to VPM or PoM may ‘‘win out’’
over direct monosynaptic excitation by gaining speed and reli-
ability at the second synapse.
Finally, differences in the balance of excitation and inhibition
to VPM and PoM suggest a mechanism for maintaining a rela-
tively quiet baseline in PoM compared with VPM in vivo. The
Figure 10. A model of the mono- and disynaptic feedback pathways from cortex layerVI to VPM, PoM, and TRN neurons in the thalamus. Line thickness is ranked by PSPamplitude and reliability, which is also consistent with the ranking of the anatomicalaxon arbor thickness: Thin lines indicate the slow-conducting fine fibers from layer VI,and thick lines indicate the fast-conducting larger fibers from the TRN to VPM andPoM.
Cerebral Cortex December 2007, V 17 N 12 2863
at Pennsylvania State University on February 20, 2013
http://cercor.oxfordjournals.org/D
ownloaded from

fact that a feedback inhibitory circuit from cortex may be
involved in quieting PoM suggests the possibility that feedfor-
ward modulation by PoM is triggered very selectively and
possibly very little during periods of high activity in cortex.
Thus, feedback from cortex can actually trigger net inhibitory
effects in both VPM and PoM cells of the thalamus—effectively
changing the sign of the strictly excitatory fibers from primary
cortex.
Notes
We thank Saundra Patrick for outstanding technical help and Michael
Beierlein for helpful comments on the manuscript. This research was
supported by the NIH (NS25983, NS40528, and DA125000), the Helen
Hay Whitney Foundation (C.E.L.), and the Shore Scholars in Medicine
Program (C.E.L.). Conflict of Interest : None declared.
Address correspondence to Carole E. Landisman, Center for Brain
Science, Harvard University, 16 Divinity Avenue, Biolabs 3038,
Cambridge, MA 02138, USA. Email: [email protected].
References
Agmon A, Connors BW. 1991. Thalamocortical responses of mouse
somatosensory (barrel) cortex in vitro. Neuroscience. 41:365--379.
Agmon A, Yang LT, Jones EG, O’Dowd DK. 1995. Topological precision
in the thalamic projection to neonatal mouse barrel cortex.
J Neurosci. 15:549--561.
Alexander GM, Fisher TL, Godwin DW. 2006. Differential response
dynamics of corticothalamic glutamatergic synapses in the lateral
geniculate nucleus and thalamic reticular nucleus. Neuroscience.
137(2):367--372.
Alloway KD, Hoffer ZS, Hoover JE. 2003. Quantitative comparisons of
corticothalamic topography within the ventrobasal complex and the
posterior nucleus of the rodent thalamus. Brain Res. 968(1):54--68.
Bartlett EL, Smith PH. 1999. Anatomic, intrinsic, and synaptic properties
of dorsal and ventral division neurons in rat medial geniculate body.
J Neurophysiol. 81:1999--2016.
Beierlein M, Connors BW. 2002. Short-term dynamics of thalamocortical
and intracortical synapses onto layer 6 neurons in neocortex.
J Neurophysiol. 88:1924--1932.
Beierlein M, Gibson JR, Connors BW. 2003. Two dynamically distinct
inhibitory networks in layer 4 of the neocortex. J Neurophysiol.
90:2987--3000.
Bloomfield SA, Sherman SM. 1988. Postsynaptic potentials recorded in
neurons of the cat’s lateral geniculate nucleus following electrical
stimulation of the optic chiasm. J Neurophysiol. 60:1924--1945.
Bokor H, Frere SG, Eyre MD, Slezia A, Ulbert I, Luthi A, Acsady L. 2005.
Selective GABAergic control of higher-order thalamic relays. Neuron.
45(6):929--940.
Bourassa J, Pinault D, Deschenes M. 1995. Corticothalamic projections
from the cortical barrel field to the somatosensory thalamus in rats:
a single-fibre study using biocytin as an anterograde tracer. Eur
J Neurosci. 7:19--30.
Bromberg MB, Penney JB Jr, Stephenson BS, Young AB. 1981. Evidence
for glutamate as the neurotransmitter of corticothalamic and
corticorubral pathways. Brain Res. 215:369--374.
Chiaia NL, Rhoades RW, Fish SE. Killackey HP. 1991. Thalamic process-
ing of vibrissal information in the rat: II. Morphological and
functional properties of medial ventral posterior nucleus and
posterior nucleus neurons. J Comp Neurol. 314:217--236.
Cox CL, Huguenard JR, Prince DA. 1997. Nucleus reticularis neurons
mediate diverse inhibitory effects in thalamus. Proc Natl Acad Sci
USA. 94:8854--8859.
Crunelli V, Leresche N. 1991. A role for GABAB receptors in excitation
and inhibition of thalamocortical cells. Trends Neurosci. 14:16--21.
De Biasi S, Rustioni A. 1990. Ultrastructural immunocytochemical
localization of excitatory amino acids in the somatosensory system.
J Histochem Cytochem. 38:1745--1754.
Deschenes M, Hu B. 1990. Electrophysiology and pharmacology of the
corticothalamic input to lateral thalamic nuclei: an intracellular
study in the cat. Eur J Neurosci. 2:140--152.
Deschenes M, Vienante P, Zhang Z-W. 1998. The organization of
corticothalamic projections: reciprocity versus parity. Brain Res
Rev. 28:286--308.
Diamond ME, Armstrong-James M, Budway MJ, Ebner FF. 1992. Somatic
sensory responses in the rostral sector of the posterior group (POm)
and in the ventral posterior medial nucleus (VPM) of the rat
thalamus: dependence on the barrel field cortex. J Comp Neurol.
319:66--84.
Diamond ME, Armstrong-James M, Ebner FF. 1992. Somatic sensory
responses in the rostral sector of the posterior group (POm) and in
the ventral posterior medial nucleus (VPM) of the rat thalamus.
J Comp Neurol. 318:462--476.
Feig S, Harting JK. 1998. Corticocortical communication via the thalamus:
ultrastructural studies of corticothalamic projections from area 17 to
the lateral posterior nucleus of the cat and inferior pulvinar nucleus of
the owl monkey. J Comp Neurol. 395(3):281--295.
Gentet LJ, Ulrich D. 2003. Strong, reliable and precise synaptic
connections between thalamic relay cells and neurones of the
nucleus reticularis in juvenile rats. J Physiol. 546:801--811.
Gil Z, Amitai Y. 1996. Properties of convergent thalamocortical and
intracortical synaptic potentials in single neurons of neocortex.
J Neurosci. 16:6567--6578.
Gil Z, Connors BW, Amitai Y. 1999. Efficacy of thalamocortical and
intracortical synaptic connections: quanta, innervation, and reliabil-
ity. Neuron. 23:385--397.
Godwin DW, Van Horn SC, Erisir A, Sesma M, Romano C, Sherman SM.
1996. Ultrastructural localization suggests that retinal and cortical
inputs access different metabotropic glutamate receptors in the
lateral geniculate nucleus. J Neurosci. 16(24):8181--8192.
Golomb D, Ahissar E, Kleinfeld D. 2006. Coding of stimulus frequency by
latency in thalamic networks through the interplay of GABAB-
mediated feedback and stimulus shape. J Neurophysiol. 95(3):
1735--1750.
Golshani P, Liu XB, Jones EG. 2001. Differences in quantal amplitude
reflect GluR4-subunit number at corticothalamic synapses on two
populations of thalamic neurons. Proc Natl Acad Sci USA. 98:
4172--4177.
Hoogland PV, Welker E, Van der Loos H. 1987. Organization of the
projections from barrel cortex to thalamus in mice studied with
Phaseolus vulgaris-leucoagglutinin and HRP. Exp Brain Res. 68:
73--87.
Huguenard JR, Prince DA. 1994. Clonazepam suppresses GABAB-
mediated inhibition in thalamic relay neurons through effects in
nucleus reticularis. J Neurophysiol. 71:2576--2581.
Jahnsen H, Llinas R. 1984. Electrophysiological properties of guinea-pig
thalamic neurones: an in vitro study. J Physiol. 349:205--226.
Jones EG, Wise SP, Coulter JD. 1979. Differential thalamic relationships
of sensory-motor and parietal cortical fields in monkeys. J Comp
Neurol. 183:833--881.
Kao CQ, Coulter DA. 1997. Physiology and pharmacology of cortico-
thalamic stimulation-evoked responses in rat somatosensory tha-
lamic neurons in vitro. J Neurophysiol. 77:2661--2676.
Kelly MK, Carvell GE, Hartings JA, Simons DJ. 2001. Axonal conduction
properties of antidromically identified neurons in rat barrel cortex.
Somatosens Mot Res. 18:202--210.
Killackey HP, Sherman SM. 2003. Corticothalamic projections from
the rat primary somatosensory cortex. J Neurosci. 23(19):
7381--7384.
Kim U, McCormick DA. 1998. The functional influence of burst and
tonic firing mode on synaptic interactions in the thalamus.
J Neurosci. 18:9500--9516.
Kim U, Sanchez-Vives MV, McCormick DA. 1997. Functional dynamics of
GABAergic inhibition in the thalamus. Science. 278:130--134.
Land PW, Buffer SA Jr, Yaskosky JD. 1995. Barreloids in adult rat
thalamus: three-dimensional architecture and relationship to so-
matosensory cortical barrels. J Comp Neurol. 355:573--588.
Landisman CE, Connors BW. 2005. Long-term modulation of electrical
synapses in the mammalian thalamus. Science. 310:1809--1813.
Landisman CE, Long MA, Beierlein M, Deans MR, Paul DL, Connors BW.
2002. Electrical synapses in the thalamic reticular nucleus. J Neuro-
sci. 22:1002--1009.
2864 Cortical Feedback onto Somatosensory Thalamus d Landisman and Connors
at Pennsylvania State University on February 20, 2013
http://cercor.oxfordjournals.org/D
ownloaded from
Lavallee P, Urbain N, Dufresne C, Bokor H, Acsady L, Deschenes M. 2005.
Feedforward inhibitory control of sensory information in higher-
order thalamic nuclei. J Neurosci. 25(33):7489--7498.
Li J, Guido W, Bickford ME. 2003. Two distinct types of corticothalamic
EPSPs and their contribution to short-term synaptic plasticity.
J Neurophysiol. 90(5):3429--3440.
Liu XB, Jones EG. 1999. Predominance of corticothalamic synaptic
inputs to thalamic reticular nucleus neurons in rat. J Comp Neurol.
414.
Liu XB, Munoz A, Jones EG. 1998. Changes in subcellular localization of
metabotropic glutamate receptor subtypes during development of
mouse thalamus. J Comp Neurol. 395:450--465.
LongMA, Landisman CE, Connors BW. 2004. Small clusters of electrically
coupled neurons generate synchronous rhythms in the thalamic
reticular nucleus. J Neurosci. 24:341--349.
Lu SM, Lin RC. 1993. Thalamic afferents of the rat barrel cortex: a light-
and electron-microscopic study using Phaseolus vulgaris leucoag-
glutinin as an anterograde tracer. Somatosens Mot Res. 10:1--16.
Markram H, Wang Y, Tsodyks M. 1998. Differential signaling via the same
axon of neocortical pyramidal neurons. Proc Natl Acad Sci USA. 95:
5323--5328.
Martin LJ, Blackstone CD, Huganir RL, Price DL. 1992. Cellular
localization of a metabotropic glutamate receptor in rat brain.
Neuron. 9(2):259--270.
McCormick DA, von Krosigk M. 1992. Corticothalamic activation
modulates thalamic firing through glutamate ‘‘metabotropic’’ recep-
tors. Proc Natl Acad Sci USA. 89:2774--2778.
Nothias F, Peschanski M, Besson JM. 1988. Somatotopic reciprocal
connections between the somatosensory cortex and the thalamic Po
nucleus in the rat. Brain Res. 447:169--174.
Pare D, Dossi RC, Steriade M. 1991. Three types of inhibitory post-
synaptic potentials generated by interneurons in the anterior
thalamic complex of cat. J Neurophysiol. 66:1190--1204.
Paxinos G, Watson C. 1998. The rat brain in stereotaxic coordinates. San
Diego (CA): Academic Press.
Pierce JP, Lewin GR. 1994. An ultrastructural size principle. Neurosci-
ence. 58:441--446.
Pinault D, Deschenes M. 1998a. Anatomical evidence for a mechanism of
lateral inhibition in the rat thalamus. Eur J Neurosci. 10:3462--3469.
Pinault D, Deschenes M. 1998b. Projection and innervation patterns of
individual thalamic reticular axons in the thalamus of the adult rat:
a three-dimensional, graphic, and morphometric analysis. J Comp
Neurol. 391:180--203.
Ramcharan EJ, Gnadt JW, Sherman SM. 2000. Burst and tonic firing in
thalamic cells of unanesthetized, behaving monkeys. Vis Neurosci.
17:55--62.
Reichova I, Sherman SM. 2004. Somatosensory corticothalamic projec-
tions: distinguishing drivers from modulators. J Neurophysiol. 92(4):
2185--2197.
Roy JP, Clercq M, Steriade M, Deschenes M. 1984. Electrophysiology of
neurons of lateral thalamic nuclei in cat: mechanisms of long-lasting
hyperpolarizations. J Neurophysiol. 51:1220--1235.
Salt TE, Eaton SA. 1990. Postsynaptic potentials evoked in ventrobasal
thalamus neurones by natural sensory stimuli. Neurosci Lett.
114:295--299.
Scharfman HE, Lu SM, GuidoW, Adams PR, Sherman SM. 1990. N-methyl-
D-aspartate receptors contribute to excitatory postsynaptic poten-
tials of cat lateral geniculate neurons recorded in thalamic slices.
Proc Natl Acad Sci USA. 87:4548--4552.
Senft SL, Woolsey TA. 1991. Growth of thalamic afferents into mouse
barrel cortex. Cereb Cortex. 1:308--335.
Sherman SM, Guillery RW. 1998. On the actions that one nerve cell can
have on another: distinguishing ‘‘drivers’’ from ‘‘modulators’’. Proc
Natl Acad Sci USA. 95(12):7121--7126.
Sherman SM, Guillery RW. 2002. The role of the thalamus in the flow of
information to the cortex. Philos Trans R Soc Lond B Biol Sci.
357:1695--1708.
Sherman SM, Koch C. 1990. Thalamus. In: Shepherd GM, editor. The
synaptic organization of the brain. 3rd ed. New York: Oxford
University Press. p. 246--278.
Sillito AM, Jones HE. 2002. Corticothalamic interactions in the transfer
of visual information. Philos Trans R Soc Lond B Biol Sci. 357:
1739--1752.
Sosnik R, Haidarliu S, Ahissar E. 2001. Temporal frequency of whisker
movement. I. Representations in brain stem and thalamus. J Neuro-
physiol. 86:339--353.
Steriade M, McCormick DA, Sejnowski TJ. 1993. Thalamocortical
oscillations in the sleeping and aroused brain. Science. 262:
679--685.
Swadlow HA, Gusev AG. 2001. The impact of ‘bursting’ thalamic
impulses at a neocortical synapse. Nat Neurosci. 4:402--408.
Swadlow HA, Waxman SG. 1975. Observations on impulse conduction
along central axons. Proc Natl Acad Sci USA. 72:5156--5159.
Temereanca S, Simons DJ. 2004. Functional topography of cortico-
thalamic feedback enhances thalamic spatial response tuning in the
somatosensory whisker/barrel system. Neuron. 41:639--651.
Trageser JC, Keller A. 2004. Reducing the uncertainty: gating of
peripheral inputs by zona incerta. J Neurosci. 24(40):8911--8915.
Ulrich D, Huguenard JR. 1996. GABAB receptor-mediated responses in
GABAergic projection neurones of rat nucleus reticularis thalami in
vitro. J Physiol. 493(3):845--854.
Veinante P, Lavallee P, Deschenes M. 2000. Corticothalamic projections
from layer 5 of the vibrissal barrel cortex in the rat. J Comp Neurol.
424(2):197--204.
Vidnyanszky Z, Gorcs TJ, Negyessy L, Borostyankio Z, Knopfel T, Hamori
J. 1996. Immunocytochemical visualization of the mGluR1a
metabotropic glutamate receptor at synapses of corticothalamic
terminals originating from area 17 of the rat. Eur J Neurosci. 8(6):
1061--1071.
Warren RA, Agmon A, Jones EG. 1994. Oscillatory synaptic interactions
between ventroposterior and reticular neurons in mouse thalamus in
vitro. J Neurophysiol. 72:1993--2003.
Warren RA, Golshani P, Jones EG. 1997. GABA(B)-receptor-mediated
inhibition in developing mouse ventral posterior thalamic nucleus.
J Neurophysiol. 78:550--553.
Zhang L, Jones EG. 2004. Corticothalamic inhibition in the thalamic
reticular nucleus. J Neurophysiol. 91(2):759--766.
Ziburkus J, Lo FS, Guido W. 2003. Nature of inhibitory postsynaptic
activity in developing relay cells of the lateral geniculate nucleus.
J Neurophysiol. 90:1063--1070.
Cerebral Cortex December 2007, V 17 N 12 2865
at Pennsylvania State University on February 20, 2013
http://cercor.oxfordjournals.org/D
ownloaded from