w. e. ricker department of fisheries and oceans
TRANSCRIPT

w~(~ j 0 0~~ 1 .... __ ,. +--'~-· · g: i6~ 1
-o.:~ l
~ n t auses of the Decrease in Age and ~ : iSize of Chinook Salmon <0 ! j Oncorhynchus Tshawytscha)
SH 223
W. E. Ricker
Department of Fisheries and Oceans Resource Services Branch Pacific Biological Station Nanaimo, British Columbia V9R 5K6
May 1980
Canadian Technical Report of Fisheries and Aquatic Sciences No.944
.A3-473 no.9o4-4
d Canada Gouvemement c1J Canada es and Oceans PflcheS et Oceans

Canadian Technical ~eport of
Fisheries and. Aqri'atic Sciences
These reports contain scientific and technical information that represents an important contribution to existing knowledge but which for some reason may not be appropriate for primary scientific (i.e. Journal) publication. Technical Reports are directed primarily towards a worldwide audience and have an international distribution. No restriction is placed on subject matter and the series reflects the broad interests and policies of the Department of Fisheries and Oceans, namely, fisheries management, technology and development, ocean sciences, and aquatic environments relevant to Canada.
Technical Reports may be cited as full publications. The correct citation appears above the abstract of each report. Each report wilL be abstracted in Aqua"tic Sciences and Fisheries Abstracts and will be indexed annually il1 the Department's' index to scientific and technical publications. .
Numbers 1-456 in this series were issued as Technical Reports of the Fisheries Research Board of Canada. Numbers 457-714 were issued as Department of the Environment, Fisheries and Marine Service, Research and Dev,elopment Directorate Technical Reports. Numbers 715-924 were issued as Department of Fisheries and the. Environment, Fisheries and Marine Service Technical Reports. The current series name was changed with report number 925.
Details on the availability of Technical Reports in hard copy may be obtained from the issuing establishment indicated on the front cover.
Rapport technique canadien des
sciences halieutiques et aquatiques
Ces rapports contiennent des .. renseignements scientifiques et techniques qui constituent une contribution importante aux connaissances actuelles mais qui; pour une raison ou pour une autre, ne semblent pas appropries pour la publication dans un journal scientifique. Il n'y a aucune restric;:tion quantau sujet, de fait, Ia serie reflete Iii vaste gamme des interets et des poliiiques du Ministere· des Peches et des Oceans; notamment gestion des peches, techniques et developpement, sciences oceaniques et environnements aquatiques, au Canada.
Les Rapports techniques peuvent etre consideres comme des publications completes. Le titre exact paraitra au haut du resume de chaque rapport, qui sera pub lie dans Ia revue Aquatic Sciences and Fisheries Abstracts et qui figurera dans !'index annuel des publications scientifiques et techniques du Ministere.
Les numeros l-456 de cette serie ont ete pub lies ii titre de Rapports techniques de !'Office des recherches sur les pecheries du Canada. Les numeros 457-714, a !itre de Rapports techniques de Ia Direction generale de Ia recherche et du developpement, Service des peches et de Ia mer, ministere de I'Environnement. Les numeros 715-924 ont ete publies ii titre de Rapports techniques du Service des peches et de Ia mer, Ministere des Peches et de I'Environnement. Le nom de Ia serie a ete modifie ii partir du numero 925.
La page couverture porte le nom de 1 'etablissement auteur oil !'on peut se procurer les rapports sous couverture cartonnee.
ARblS Alaska Reso,U!'ges
. Library & Infohriatlon Servtces AITcHO'rage; Alaska

Canadian Technical Report of Fisheries
and Aquatic Sciences No. 944
May 1980
CAUSES OF THE DECREASE IN AGE AND SIZE
OF CHINOOK SALMON
(ONCORHYNCHUS TSHAWYTSCHA)
by
W. E. Ricker
Department of Fisheries and Oceans
Resource Services Branch
Pacific Biological Station
Nanaimo, British Columbia V9R 5K6

- ii -
(c) Minister of Supply and Services Canada 1980
Cat. no. Fs 97-6/944 ISSN 0706-6457

- iii -
CONTENTS
Abstract iv
Resume v
1. Introduction 1
2
2
2
3
2. Evidence for decrease 1n age and size
2.1 California
2.2 Oregon and Washington
2.3 British Columbia: changes s1nce the 1910s and 1920s
2.4 British Columbia: size trends since 1951
2.5 Alaska
3. Causes of changes 1n age and size
4
5
5
4.
5.
6.
3.1 Eight possible causes 5
3.2 Direct effects of fishing (Causes 1 and 2) 7
3.3 Selective reduction of runs containing mainly large fish (Cause 3) 8
3.4 Changes in ocean climate (Cause 4) 8
3.5 Changes 1n genetic composition related to age of maturity (Cause 5) 9
3.6 Change in genetic composition related to rate of growth (Cause 6) 11
3.7 Effects of fishing regulations (Cause 7) 11
3.8 Effects of hatcheries
What can be done about it?
4.1 The disease
4.2 The remedies
Acknowledgments
References
(Cause 8) 12
13
13
14
14
15
- iv -
ABSTRACT
Ricker, W. E. 1980. Causes of the decrease in age and size of chinook salmon (Oncorhynchus tshawytscha). Can. Tech. Rep. Fish. Aquat. Sci. 944: 25 p.
The average size of chinook salmon (Oncorhynchus tshawytscha) caught in the eastern Pacific Ocean has been declining since at least 1920, and continues to decline. Present average weights are half or less than half of those obtained 50 years ago. Part of the decrease is due to the increase in use of trolling gear, which now captures more fish early in the season while they are growing rapidly, which leaves fewer to be caught later on at a larger size. Also, in some areas the trolls capture many chinooks that would not mature in the year of capture, thus reducing the number that are caught at older ages and much larger sizes. More important still, this reduces the average age of the spawning fish, which now average a year or more younger than formerly. Age of maturity has been shown to be partly heritable and modifiable by selection, so there has been a progressive deterioration of the genetic basis for maturation at older ages. This is cumulative in effect, and by now is probably the most important cause of reduced size. In addition, selective fishing by both gillnets and trolls may have reduced disproportionately the abundance of certain stocks of large-sized fish, and the Grand Coulee dam exterminated all the Canadian stocks of big Chinooks in the Columbia River. There is no evidence that trends in the ocean environment have contributed to the downward trend in size of chinook salmon. Size has decreased during a regime of ocean warming up to 1940, and during a cooling regime since that time.
- v -
/ / RESUME
Ricker, W. E. 1980. Causes of the decrease in age and size of chinook salmon (Oncorhynchus tshawytscha). Can. Tech. Rep. Fish. Aquat. Sci. 944: 25 p .
• Depuis 1920 au moins, la taille moyenne du saumon quinnat
(Oncorhynchus tshawytscha) capture dans l'est de l'ocean Pacifique ne cesse de diminuer. Actuellement, le poids moyens des prises est inferieur de moitie ou plus a celles d'il y a 50 ans. Cette baisse est due en partie a !'utilisation de plus en plus frequente des lignes tra!nantes, qui prennent beaucoup plus de poissons en debut de saison pendant que la periode de croissance rapide de ces derniers, de sorte qu'un moins grand nombre a le temps de cro!tre encore et d'~tre capture a une plus grande taille. En outre, dans certaines zones, les lignes trainantes attrapent de nombreux saumons qui ne parviendraient pas a maturite au cours de l'annee de capture, ce qui reduit le nombre de sujets plus ages et plus gros susceptibles d'etre captures. Fait plus important encore, on assiste a une diminution de l'age moyen du reproducteur, qui est inferieur d'un an ou plus a ce qu'il etait autrefois. Des etudes ont montre que l'~ge de la maturite 6tait en partie hereditaire et pouvait etre modifie par selection, de sorte qu'il y a eu une deterioration progressive du patrimoine genetique occasionnant une maturation a un age plus avance. Cet effet est cumulatif et il s'agit la probablement de la cause la plus importante de la diminution de la taille. En outre, la peche selective pratiquee a l'aide des filets maillants et des lignes trainantes peut avoir r~duit de facon disproportionnee certaines populations de poissons de grande taille,,et la construction du barrage de Grande Coulee s'est soldee par !'extermination de tous les stocks canadiens de gros saumons quinnats dans le fleuve Columbia. Aucun signe n'indique que !'evolution du milieu marin a contribue ~ la diminution de la taille du saumon quinnat. Le phenomene s'est poursuivi au cours d'une periode de rechauffemeaf des oceans jusqu'en 1940, et de refroidissement depuis cette date.
1. INTRODUCTION
This is the third of a series of accounts of changes in size of the salmons on the east side of the Pacific Ocean. The first of these concerned pink salmon (Ricker, Bilton and Aro 1978), which species was selected for first consideration because its invariable age structure made it possible to focus directly on changes in rate of growth. The second species was the chum salmon (Ricker 1980), in which the fish mature at more than one age, but it is only the maturing individuals that are harvested (from Canadian stocks). Chinook salmon present an even more complex situation, in that there is more than one age of maturity, while the catch includes fish that would mature in the current year and also some that would mature a year or more later. Partly for this reason, the decrease in size of chinook salmon began early and has gone farther than that of the other salmon species.
Ages in this work have been expressed as the number of years completed, starting from the newly fertilized egg or zygote as time zero. An adult that reaches its spawning river or hatchery 4 years (practically) after it was a zygote is called age 4. The same fish, if caught in a fishery a few weeks or months earlier, is designated age 3. This latter usage is contrary to the usual system used in the accounts from which ages are taken, where such a fish is called age 4. However, this leads to confusion when average ages are computed.
Chinook salmon may mature at ages from 1 to 7 or more. Mature fish of age 1 are usually less than 30 em long, are all males, and are scarce and rarely seen. Mature chinooks of age 2 are called jacks or grilse, are almost all male, and are large enough to be of interest for food or sport. Mature chinooks of older ages include both sexes, with females usually predominating.
Different stocks of chinooks differ in respect to mean age of maturity, rate of growth, and various morphological characters (Ricker 1972). Within a single stock, later-maturing fish will, on the average, have grown more slowly than those of any earlier age of maturity, right from the first year of life. But there is much overlap in growth rate between fish maturing at different ages; that is, the negative correlation between growth rate and age of maturity is far from perfect.
That British Columbia chinook salmon have been decreasing in s1ze was noted by Milne (1957, p. 27), and the evidence for this in British Columbia and in other parts of the coast was reviewed briefly by Ricker (1972, Section 19.3). This paper presents additional and more detailed evidence, reviews the causes of the decline, and suggests possible remedies.

- 2 -
2. EVIDENCE FOR DECREASE IN AGE AND SIZE
2.1. CALIFORNIA
As far as I know, the first published comment on a decline 1n size or age of chinook salmon was by Snyder (1931). He compared the age composition of rather large samples of chinooks landed in 1919-21 at Monterey, California, with the same in 1928-29. The average ages, in years completed, were as follows:
1919 1920 1921 Mean
2.71 2.84 2.95 2.83
1928 1929
Mean
1.56 2.06
1.81
The 1929 sample was larger than that of 1928 and apparently better distributed throughout the season, but in any event there had been a decrease of almost a year in the average age of the chinooks being landed. Part of this, of course, might be due to changes in gear or fishing pr.actices, but if the older and larger fish had retained their original abundance, it is very unlikely that fishermen would shift to methods favoring smaller ones.
The decrease did not stop in 1930. For more recent years, Warner et al. (1961) state that 4-year-old chinook spawners used to be the most common type on the Sacramento River, but 11 there are indications that the proportion of 3-year-old spawners has been increasing and may now exceed the 4,...year-olds."
2.2. OREGON AND WASHINGTON
Junge and Phinney (1963) reported that since 1955 chinooks completing their 3rd year of life (age 3) had begun to predominate at the Spring Creek Hatchery on the Columbia River, whereas formerly age 4 had been dominant.
Cleaver (1969) compared the ages of chinooks caught off the mouth of the Columbia River and found a rather modest decrease, as follows:
Years 1919-20 1964 1965
Mean age 2.36 2.13 2.24

- 3 -
2.3. BRITLSH COLUMBIA: CHANGl'~S SlNCl'~ THE 1910s AND 1920s
Wt•ightH of Fr11Her's 1917 cnlch samples
McLean Fraser (1921) measured and weighed chinook salmon delivered to a cannery at Nanaimo in 1917. Although he was interested principally in age and in rate of growth computed from scales, he published complete length distributions by sex for all age categories, and the average weight at each half-inch of length. From this it is possible to reconstruct the mean weight of the fish landed, which was 12.35 lb. For comparison with recent commercial catches the 17 fish less than the present commercial limit of 3 lb must be omitted; this increases the average to 12.69 lb.
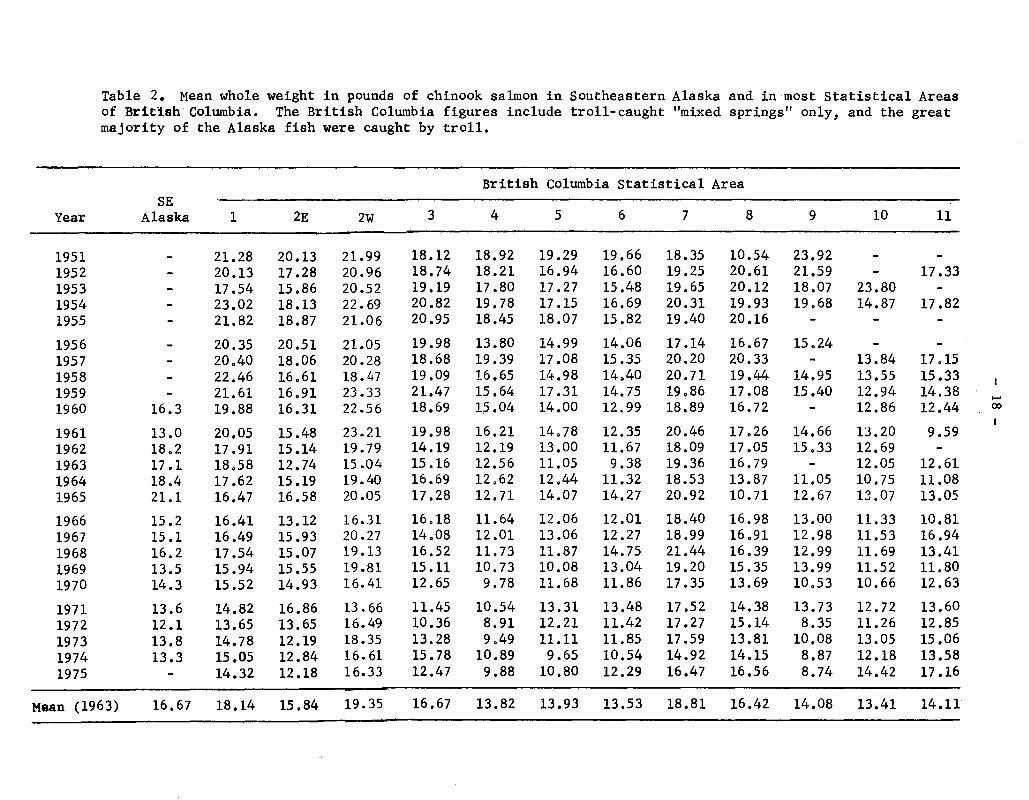
Recent mean sizes of chinooks caught commercially by troll are shown in Table 2. In Area 17, which includes Nanaimo, the average was 10.3 lb in 1951-55 and 6.2 lb during 1971-75. Thus some decrease may have occurred between 1917 and the 1950's. However, there is no information on the date the 1917 fish·were caught, or on what gear was used to capture them, both of which can affect mean weight, so the comparison is only suggestive.
Ages of samples taken for tagging from the 1920s to the 1960s
Table 1 compares the ages of chinook salmon taken for tagging in 1926 (Mottley 1929, Table 1), in 1929 and 1930 (Pritchard 1940, Table 3), and in 1949 (Neave 1951, Table 2) with those sampled in 1964 and 1965 (Cleaver 1969, Table 27).
The 1926 specimens were taken in Area 23, off Ucluelet, and most of the 1949 ones were from that Area. However, in both cases, many of the larger fish caught were not included in the scale sample (Mottley 1929, Clemens 1931, Neave 1951), so the older ages are underrepresented. The reason, in the earlier years, was simply economy; the fish were bought by the pound from the trollers, and budgets for tagging were limited. This underrepresentation is indicated in Table 1 by plus signs. The 1964 and 1965 samples were from "southwest Vancouver Island", almost certainly mainly from Area 23.
While Table 1 shows clearly that there has been a decrease in age of chinooks caught in Area 23, the incompleteness of the 1926 and 1949 samplings makes a quantitative estimate impossible.
For the west coast of the Queen Charlotte Islands (Area 2W), Table 1 indicates a major decrease in the age and hence the size of the chinook salmon being caught. The decrease in mean age from 1929-30 to 1964-65 is more than 2 years. In the 1960s, fish of age 5 and older had become very scarce, whereas formerly they made up more than half of the catch.
Again we should recognize that part of this decrease must be ascribed to changes in gear and procedures that favour taking smaller fish as they become the dominant sizes present.

- 4 -
Weights of samples taken for tagging during the 1920s and 1940s
The weight distribution of chinooks caught at several localities 1n years from 1925 to 1930 is given by Clemens (1931), by intervals of 10 lb, and Pritchard (1940) indicates that whole weights were used. Neave (1951, Table 1) gives information on weights in 1949 in Areas 23 and 27; and, unlike the case of his scale sample, the larger fish were not selected against. The intervals are in terms of "dressed" weights (=0.85 of round weight) so are not the same as those Clemens used, but it is clear that the fish in both Areas were much smaller than during the 1920s. This is indicated by the following comparison, which is in terms of round weight:
Percentage more than 19.5 lb.
Percentage more than 16.5 lb.
Area 23 Ucluelet
26.4+ (1925) 43.1+ (1926)
15.0 (1949)
2.4. BRITISH COLUMBIA: SIZE TRENDS SINCE 1951
Area 27 Quat sino
61.1+ (1927)
54.1 (1949)
In 1951 the sales-slip system of obtaining catch statistics was introduced. The slips give the number and total weight of the fish in each delivery, from which average weight can be computed. Various tests and comparisons with other data show that the sales-slip statistics provide a representative picture of mean weights in the catch (Ricker 1980). While for some species numbers of fish in large deliveries may be estimated, this is unlikely to occur with chinook salmon because the number in even the larger deliveries is only moderate, so that counting them is not a chore. Weights are tabulated as dressed weight (head on), but here these have been converted to whole weight by multiplying by 100/85.
Table 2 shows the mean size of "mixed springs" taken by trolling in the various statistical Areas, while Table 3 summarizes their rate of decrease in s1ze. (For a map of the Areas see Fig. 1 of Ricker et al., 1978). All Areas show a decrease in size, the average rate being 0.23 lb/yr, or 5.5 lb over the 24-year period. In Table 3 the Areas within each group are arranged in order from north to south. The computed sizes of the fish tend to decrease from north to south, both for 1951 and for 1975, although with some irregularities. Also, the absolute rate at which chinooks became smaller between 1951 and 1975 tends to decrease from north to south. The result is that by 1975 there was somewhat less difference 1n size between north and south than there was formerly, but the northern chinooks are still substantially larger. Areas 27-21, on the west coast of Vancouver Island, have unusually consistent north-south trends in 1951 and 1975 sizes (Table 3).
- 5 -
In Fig. 1 are plotted chinook sizes in 4 Areas where large catches are made, with the corresponding regression lines. In the lower Strait of Georgia (Area 17) there is some indication that the decrease in size has been arrested, since about 1961, at a level of about 6 lb (2.7 kg). The other southern Areas, 18 and 20, have similar patterns, Area 21 being intermediate (Table 2). In all the remaining Areas of Fig. 1 and Table 2 size continued to decrease up to 1975. The fastest estimated rate of decline was 1n Area 9, almost half a pound per year, and 0.3 lb/yr was not unusual (Table 3).
The size decreases observed from 1951 to 1975 were of course superimposed on the decreases that had occurred previously. For easy comparison with the recent trends, Table 4 shows mean sizes computed from the distributions of Clemens (1931). The middle of each weight range in his paper is taken to be the mean weight of the fish it includes; and the plus signs indicate that the true mean was larger because of the underrepresentation of the larger fish.
Of course even 1926 does not represent the primitive situation. Commercial fishing for chinooks began in the last century and was well developed by 1900. Most of the recaptures of chinooks tagged in 1926 were from the Columbia River, whose stocks, particularly of the large-sized summer runs, had already been much reduced by an intensive river fishery.
2.5. ALASKA
There is a major troll fishery for chinook salmon in Southeastern Alaska, for which size statistics have been published since 1960 in the Statistical Yearbook of the International North Pacific Fisheries Commission (Table 2). The size of the chinooks taken has fallen off significantly (r = -0.560*) in Southeastern Alaska, in the same manner as those of British Columbia. The mean rate of decrease is 0.31 lb/yr, or from computed values of 17.6 lb in 1960 to 13.3 lb in 1974.
Much smaller quantities of chinooks are taken in other parts of Alaksa, but the gears are not standardized and the data exhibit irregularities that make them of little use for comparative purposes.
3. CAUSES OF CHANGE IN AGE AND SIZE
3.1. EIGHT POSSIBLE CAUSES
I can think of eight causes that may have changed the average size and age of the chinooks being caught.

- 6 -
The first cause is simply the fact that for some stocks troll fishing has increased in waters where the fish are feeding and growing. As more trolling is done, more chinooks of any given age are caught earlier in the season and fewer are left for later on. The result is a decrease in the averge size of chinooks caught during the season as a whole.
A second cause of reduced size is the well-known "fishing-up effect", first described by Baranov (1916). The troll fishery for chinooks in some areas takes both maturing fish and those that will not mature in the current year. The fish that mature at greater ages are exposed to capture for 2, 3, or 4 years, whereas the youngest group (age 1 or "jacks") are exposed during only one year, apart from occasional age 0 individuals taken incidentally to other fisheries. Hence as fishing effort increases, relatively more fish are caught at younger ages and fewer survive to be caught at older ages.
A third cause of decreasing size might be the reduction in relative abundance of stocks that were of a large average size or large average age under natural conditions - either because they were more heavily fished, or because they were more vulnerable to environmental deterioration, particularly dams.
The fourth possible reason is that there may have been a change in the ocean environment that has reduced either the growth rate or the age of maturity of chinook stocks, or both.
The fifth possible reason for a decrease in mean s1ze is a slow change in the genetic makeup of a stock because of the tendency to take more of the older fish in the catch. This is partly for the reason indicated under Cause 2 above, but also because the larger (hence older) fish tend to be taken in greater numbers even by fisheries that attack only maturing specimens. The result is that there is increased representation of younger fi~h among breeding individuals, and continued over many years this can cause a gradual decline in the average age of the stock as a whole -- both catch and spawners.
The sixth cause of a change in mean size is also genetic, due to s~lection of larger fish of any given age by the fishery. This tends to decrease the stock of genes that favour fast growth; but, as explained in Section 3.6, at present this effect is opposed by the fact that early-maturing chinooks, which are favoured by Cause 5, grow faster than those that mature at an older age.
A seventh cause of change in size of chinook salmon is the presence or absence of fishing regulations. In the broadest sense, restrictions on the time, place and kind of fishing, and catch quotas, can affect the size of the fish caught by way of several of the Causes described above. More direct effects on the size of fish caught are exerted by limits on the size of mesh used in gillnets, or on the size of fish that can be landed.
An eighth possible cause of change in size of our chinooks might be some aspect of artificial propagation. For example, there could be faster (or slower) marine growth as a result of early life in the hatchery, or there may have been conscious or inadverent selection of hatchery spawners for either large or small size.

- 7 -
3.2. DIRECT EI<'FECTS OF FISHING (CAUSES 1 AND 2)
The first two casues of decrease in size of chinooks are self-evident. They are undoubtedly responsible for a good share of the decrease that has been observed. Cause 2 is very important in places, like Area 23 or the Strait of Georgia, where large numbers of non-maturing chinooks are caught. In Areas such as 1, 2W and 27 the early tagging experiments showed that the fish being caught were nearly all in their final year of life, although this may have changed somewhat now that the average size is much smaller. In any event, if there are stocks living in places where they are not exposed to capture until they undertake their homeward migration, they are of course not affected by Cause 2.
Both Cause 1 and Cause 2 of decrease could be self-adjusting, in the sense that if they alone were operating, and if the fishing conditions of (say) 1920 were to be restored, the size of fish being caught would adjust itself to that of 1920 within a time period equal to the maximum age of the species.
Table 5 is a model illustrating the quantitative effectiveness of Cause 2. Lines 2 and 3 show the age of the chinooks, older than age 1, that were tagged in 1926 and 1927 off Vancouver Island (Mottley 1929, Tables 1 and 3). As noted earlier, few of the larger fish were tagged, so there is a deficiency of ages 6, 5, and to some extent 4, in comparison with their true representation in the catch. On the other hand, the catch obviously does not adequately represent the number of fish of age 2 in the population, because they cannot be fewer than the next older age; they were evidently less vulnerable to the gear or fishing procedures then in vogue, probably partly because they had a somewhat different distribution by depth or area. Line 4 of Table 5 shows the number of tags from fish of each age that were returned in the same year as tagged (Mottley 1929, Tables 2 and 4), and line 5 gives the percentages returned. Because of tagging mortality, loss of tags (strap tags on the tail were used), and non-reporting of some recaptures, these percentages are several times too low to represent a true rate of recapture, but they are more or less comparable among themselves. They serve as a basis for approximate estimates of the percentage of each age-group that will mature in the current year, shown in line 6.
The instantaneous natural mortality rate of large salmon (age 2 and older) in the sea has been estimated as about M = 0.1 per year (Ricker 1976). In lines 8-12 of Table 5 this is combined with a series of instantaneous rates of ocean fishing (F = 0-1.5) to calculate equilibrium age distributions of mature fish, using each year's maturation percentage shown in line 6. Note that the F values apply to troll fishing only, because the gillnet, seine and (formerly) trap fisheries for the most part take individuals that are about to enter the rivers, after they have separated from non-maturing individuals. Interpolation shows that the modal age of spawners shifts from 4 to 3 when the ocean rate of exploitation (including that part of those that are hooked and escape which die of their injuries) reaches about 55% per annum. As described earlier, such a shift in age had occurred in certain Sacramento and Columbia River stocks by about 1955, so that by now the ocean rate of exploitation of those stocks is probably in the range of 60% to 75%. With such a fishery, large old chinooks become very scarce, as indicated in lines 11 and 12 of Table 5.

- 8 -
3.3. SELECTIVE REDUCTION OF RUNS CONTAINING MAINLY LARGE FISH (CAUSE 3)
The only evidence for this effect that I know of pertains to the Columbia River. The chinooks there have been divided into 4 runs: early spring chinooks, spring chinooks, summer chinooks and fall chinooks (Ricker, 1972). Since the 1920's there have been seasonal maxima in spring and fall, with fewer fish taken in the summer. Prior to 1912, however, the largest catches were taken in the summer months of June and July, and these were also the largest fish -- particularly those of late June. Thus the average size of Columbia chinooks has been decreased by selective reduct~on of the stocks that contained the largest fish.
The early reduction of the large summer runs of big fish on the Columbia was probably mostly a result of selective removal of large fish by large-meshed gillnets -- both by simple over-fishing and by the cummulative genetic deterioration described under Cause 5. Later on, ocean trolling became important enough to add its effect by way of Cause 2. In 1938 the Grand Coulee dam eliminated the surviving Canadian stocks of Columbia River su.mer chinooks at one blow, and numerous later dams have made life very difficult for stocks that migrate any distance up that river.
Any change in regulations that reduces removals of non-maturing chinooks, or gives the larger fish relief from capture by gillnets, should start a gradual restoration of affected stocks of large old fish, but the damage done by major dams is likely to be permanent.
3.4. CHANGES IN OCEAN CLIMATE (CAUSE 4)
The large effects produced by the other causes, particularly No. 2 and 5, make it difficult to detect the much smaller changes that might reasonably result from ocean conditions. That the major trend toward smaller size has nothing to do with a trend in ocean temperature is indicated by the fact that it started during a regime of ocean warming, up to 1940, and has continued during the cooling phase that has existed since that time (Ricker et al. 1978, Fig. 9 and 10).
Linear regressions on time were fitted to temperatures and to chinook weights over the period 1951-75, and the "residuals" were obtained for both -- that is, the difference between the observed and the computed value for each year. Table 6 shows correlations between temperature residuals and size residuals for three Areas and for three coastal surface temperature stations. There is only one "significant" value, and it could easily occur by chance in 14 tries. The preponderance of negative entries might suggest that lower temperatures (or associated factors) favour either a more rapid growth rate or a greater average age of maurity; but if this is real, it has tended to make the fish larger, not smaller, during the recent period of decreasing temperature.

- 9 -
The year to year changes in mean size shown in Table 2 are consistent enough between adjacent Areas that they cannot be entirely a result of random imperfections of the data. Most probably they mainly reflect variations in the strength of successive year-classes of chinooks. It is of course very probable that year-to-year variations in ocean conditions affect the growth rate of chinooks, but they tend to be averaged out over the 2, 3 or more years of their life.
3.5. CHANGES IN GENETIC COMPOSITION RELATED TO AGE OF MATURITY (CAUSE 5)
The possibility of genetic change in mean age of maturity of chinook stocks requires that age of maturity be susceptible to change by selection. There is direct evidence for this from the State of Washington. Work done by the Department of Fisheries is summarized in Table 11 of Ricker (1972), while that done by Dr. Lauren Donaldson and associates is in Table 12 of that paper. An unexpected aspect of both series is a suggestion that heritability of age is to some extent sex-limited, each sex being more influenced by the parent of the same sex.
Estimates of the heritability (h2) of age in chinooks can be made from those of Donaldson's experiments in which the male and female parents we~£ of the same age. Mean ages of the progeny were as follows:
Mean progeny ages Parental age
Year-class (both sexes) Male Female Mean
1955 3 2.63 3.59 3.11 1963 3 2.83 3.63 3.23 1964 4 3.05 3.82 3.44
Progeny ages are of the individuals that returned to their home at the University of Washington. If the catch could be included, with each fish projected to its natural age of maturity, the mean progeny ages would be greater because a larger percentage of the later-maturing individuals had been harvested (Cause 2). This might increase the mean progeny ages by up to 0.2-0.3 yr, and it would affect later-maturing individuals somewhat more than earlier-maturing ones because they are vulnerable for a longer time. In any event, the mean progeny age is less for males than for females, as expected; and also as expected, the mean age of the two sexes (with or without the adjustment above) in each case "regresses" toward a value intermediate between age 3 and age 4.
The heritability (h2) of a quantitative character 1s estimated as:
where R is the response to selection (in our case, the difference between the mean ages of the progeny produced by the two ages of parents), and S is

- 10 -
the selection differential (the difference between the parental ages, which is 1 year). Ideally a comparison should be made between the progeny of fish of different ages spawned in the same year, so that the progeny would be exposed to the same environmental conditions. We do not have this situation, but can average two comparisons from different years. Comparing the 1955 and 1964 year-classes in the schedule above, h2 = 0.42 for males and 0.23 for females; comparing 1963 and 1964, h2 = 0.22 for males and 0.19 for females. A grand average value is 0.27. This must have a small negative bias from Cause 2, as explained in the previous paragraph, so that 0.30 may be the best available estimate. This heritability estimate is similar to values that have been obtained for heritability of size at a g1ven age, in wild salmonids (Ricker et al. 1978, Section 9.3)~
Obviously the change in the genetic basis for age at maturity can be rather rapid. For example, suppose that in a given generation Cause 2 and selective fisheries reduce the mean age of spawners to 0.3 yr less than what it would be if there were no fishing that year, which is quite a modest amount (cf. Table 5). Then the progeny will be 0.3 x 0.30 = 0.09 yr younger than their parental generation, on the average. Over the 13 generations, ~roximately, from 1925 to 1976 mean age will have decreased 13 x 0.09 = 1.2 years from this cause. The actual decrease, up to 1965 only, is estimated in Table 1 as more than 0.5 yr in Area 23 and more than 2.3 yr in Area 2W. Hence an average decrease of 1.5 to 2 years seems likely for the longer period from 1925 to 1975. Part of this is to be ascribed to the direct effect of Cause 2, and perhaps Cause 3, so that the calculated decrease of 1.2 yr from the genetic effect can be of the right order of magnitude. Notice that the absolute rate of decrease in age due to genetic change will have been increasing somewhat because the mean generation time has gradually become shorter.
The serious aspect of the situation is that effects of Cause 5 are long-lasting. Even if completely non-selective fishing gear were to be adopted tomorrow and only maturing individuals were captured, it would take many generations of natural selection -- perhaps 50 to 100 years -- before stocks could completely readjust their ages of maturity to their previous optimum positions.
With continued selection favoring the survival of younger ages, a limit to the cumulative decrease in mean age of chinooks will probably be encountered when almost all the female spawners are of age 3, and the males are mostly jacks of age 2. This is on the assumption that chinook salmon cannot produce any substantial body of mature age 2 females, although even this might occur given severe enough selection.
Other limits may come into operation for particular stocks. For example, stocks whose females have to build nests in the heavy gravel of swift rivers, such as the Harrison River rapids, the Owikeno Lake outlet, or Campbell River, may have to be age 4 or even older in order to be large enough to cope adequately with their reproductive environment. If so, there is a danger that such stocks will disappear after a few more generations of selection against the older spawners.

- 11 -
3.6. CHANGE IN GENETIC COMPOSITION RELATED TO RATE OF GROWTH (CAUSE 6)
Donaldson (1970) has shown that rate of growth of chinook salmon can be changed by artificial selection. As computed by Ricker (1972, p. 63), age 3 spawners were increased in size by about 3.3 lb in 2 generations. The intensity of selection employed is not in the record, so heritability cannot be calculated. However, heritability of size has been found to be about 0.3 for other wild adult salmonids (Ricker et al. 1978), and the above amount of change is consistent with such a figure, or one a little larger. That is, a 1. 6 lb change per generation would imply that the spawners used were 1.6/0.3 = 5 lb heavier than the average for their age group. If the standard deviation in weight of the age-group were say 4 lb, the intensity of selection would be 5/4 = 1.2.
Such an intensty of selection is of course much greater than anything likely to be imposed by our fisheries. Ricker et al. (1978) estimated the fisheries' intensity of selection for size in pink salmon to be only 0.2-0.3. If we apply the mean value 0.25 to chinooks, the expected amount of change would be 1.6 x 0.25/1.2 = 0.3 lb per generation in the age-group that matures at age 3. Projecting this over the 13 generations from 1925 to 1975, it amounts to 4 lb. This of course is only a ball-park figure, illustrating the potential for change in rate of growth.
However, it does not necessarily follow that the genetic makeup of today's chinook stocks favours a slower growth rate than did the primitive one. Fraser (1921), Parker and Larkin (1959, Fig. 14) and others have shown that in chinook salmon, as in other Oncorhynchus, later-maturing individuals grow more slowly than the early-maturing ones. Thus today's selection by the fishery that favours early maturity tends to increase the relative abundance of genes favouring more rapid growth. This opposes the direct effect of selection against rapid growth by trolls and gillnets when they take more of the large fish of any given age. The net result may be a standoff, or the genes for more rapid growth may even be on the increase. This latter would mean that chinooks of any given age were tending to become larger than formerly, even while the average size of the fish in both catch and escapment continued to decrease because older fish were becoming scarcer. But in the future, when Cause 5 has reduced average age about as far as it can, the direct effect of Cause 6 will come to the fore and growth rate wi 11 eithe,r start to decrease, or the then prevailing rate of decrease will be accelerated.
3.7. EFFECTS OF FISHING REGULATIONS (CAUSE 7)
Fishing regulations, or their absence, are an obvious possible cause of change in size of chinook salmon caught, or landed. Considered in the broadest sense, to include potential control over both the kinds and amounts of different gears that are used, and when and where they are to be deployed, it is obvious that either the existence ~the absence of restrictions on any type of gear can profoundly affect the average age and size of the fish that are caught. In this sense, most of the decline in

- 12 -
size of chinooks can be blamed on regulations, and especially on the failure to regulate. For example, the present ascendancy of ocean trolling, which takes non-maturing as well as maturing fish, is the most important single cause of the decrease in chinook size, working through Causes 1, 2, 5, and possibly 6. The elimination of the relatively unselective trap fisheries was another unfavourable move from this point of views, however desirable it may have been for other reasons.
There has been one regulation of a more traditional sort that has directly affected the mean size and age of chinooks in the Canadian Statistics -- the imposition of a size limit. During the 1960s Canada adopted a minimum length of 2"6 inches ( 66 em) overall, equivalent to about 3 lb ( 1. 4 kg), for chi nooks taken on commercial gear off the open coast, outside of the "Surf line". This was extended to the Straits of Georgia and Juna de Fuca iG 1977. This measure tends to increase the mean size of chinooks being landed and, by inducing trollers to avoid places where small chinooks congregate, should also tend to increase the mean size of the chinooks that are caught. The latter is important because of a rather large mortality rate among fish that are hooked and released (Ricker 1976). Without this regulation, the mean sizes in Table 2 would have decreased even more than they have.
3.8. EFFECT OF HATCHERIES (CAUSE 8)
Chinooks reared from hatcheries have become an increasing component of the British Columbia catch, particularly in the south. This may afffect the size of fish caught in two general ways. If the artificaially reared fish are larger than native fish of the same stock at time of release, they might continue to grow faster in salt water. Equall1; a smaller size at release, or infections obtained in the hatchery, might make for slower growth in salt water. The other possibility is that stocks that have been increased by artificial propagation may grow at a different rate, or mature at a different average age, from the mean for wild stocks captured in a given region. In addition there is a possibility of either conscious or inadvertent selection of brood stock by size in hatcheries, which could gradually alter the average age and size of the fish they produce.
I know of no direct information on these points. Hatchery procedure would be unlikely to consciously select the smaller fish for breeding, but selection for large size seems quite possible. One might speculate that the slower rate of decrease in size of chinooks in southern British Columbia, and the apparent stabilization of size in the Strait of Georgia, could result from the larger contribution that these areas receive from hatchery stocks. Another possible reason for a temporary stabilization of chinook sizes in the Strait might be an increase in general productivity as a consequence of the increase in organic materials received from the Fraser and other rivers.

- 13 -
4. WHAT CAN Bg DONE ABOUT IT?
4.1. THE DISEASE
Of the eight possible causes of change in size of chinook salmon, the first three tend to be self-limiting. Sooner or later the rate of fishing must level off if chinook salmon are to survive at all. Overall, indeed, this may already have happened. However, commercial trolling was increasing up to very recently, at least in British Columbia, and sport trolling continues to increase all along the coast. If trolling increases further at the expense of other gears, we may expect the average size of chinooks to continue to decrease from Causes 1, 2, and possibly 3. But sooner or later the effects of Causes 1 and 2 will be stabilized as the trolling effort levels off, the fish then being of some average size smaller than today' s.
Considering Causes 5 and 6, the genetic effects, it is clear that Cause 5 will continue to operate as long as any fishery catches immature chinooks -- that is, those that would not mature in the current year; and also as long as any gear selectively takes the larger fish. Thus continuation of the present troll fishery, or selection of large fish by the gillnet fishery, can lead to a situation where practically the only chinooks left in the catch will be jacks and age 2 individuals, maturing at ages 2 and 3 respectively, and chinooks weighing more than 15 lb will be practically unheard of.
Cause 6 tends to make chinooks smaller by reducing their mean size at a given age. At present this is being opposed by some transfer of genes for rapid growth from younger-maturing fish up into the older ages, and the net result is uncertain. But even if growth rates are in fact increasing at present, when ages become nearly stabilized the direct effect of Cause 6 will prevail and will reduce the size of chinooks on into the indefinite future.
Cause 4, environmental effects, is beyond our control, and in any event there is no evidence that changes in the ocean have contributed to the decrease 1n size of chinook salmon.
There remain causes 7 and 8, which are directly under man's control. Fishing regulations, considered in the broadest sense to include the kinds and amounts of gear that are permitted, can of course have a decisive effect on future trends in size and age of chinooks. As regards Cause 8, there is no evidence that present hatchery procedures favour smaller fish, and the reverse may be true. However, all phases of hatchery operations might be reviewed with this in mind.

- 14 -
4.2. THE REMEDIES
Several possible remedies are apparent now that the causes of decreasing chinook size have been diagnosed.
(1) Stabilize or, if possible, reduce the s1ze and/or the efficiency of the trolling fleet, so that it takes a smaller percentage of the allowable catch of chinooks. Apart from its effect on size of the fish, this should increase the total poundage harvested, because fewer fish will be taken early in the season when they are still growing rapidly, and because the "shaker" wastage will be reduced. A closed season on trolling early in the season would be particularly effective fr~ every point of view.
(2) In any event, trolling should be eliminated as far as possible at places and times where many non-maturing individuals are caught.
(3) In gillnet fishing, use a size of net whose maximum catching power is for fish considerably less than average size, so that those which escape the nets and become spa~ will be larger than average.
(4) Where hatchery operations are conducted, or any other kind of artificial assistance to propagation, breed selectively from the larger and older fish that arrive at the spawning site.
In these ways present trends can at least be slowed down, ·perhaps even reversed. Implementing measures No. 1-3 above will be anything but popular among the people affected, but responsible commercial and sport fishermen should come to realize that it will be in their own long-term interests. Measure No. 4 should be easier to put into practice, and all kinds of "enhancement" facilities for chinooks in British Columbia should be planned with this in mind. At the moment most of the hatchery-reared chinooks captured in Canadian waters are from establishments in Puget Sound or on the Columbia River. Selective breeding for larger sizes is especially urgent wherever hatcheries supply an important part of the catch, for an interesting reason. Successful artificial propagation makes it possible to maintain higher rates of exploitation of the stocks in question; this means that Causes 1, 2, and 5 of decrease in age and size are exacerbated, so that strong counter-measures become essential.
5. ACKNOWLEDGMENTS
Again it is a pleasure to acknowledge assistance received from present and former staff members of the Pacific Biological Station, particularly K. V. Aro, R. Barns, H. T. Bilton, H. Godfrey and W. P. Wickett. The final draft of the manuscript was typed by L. Mako, G. Ludvigson, and K. Richards.

- 15 -
6. REFERENCES
Baranov, F. I. 1916. On the question of the biological basis of fisheries. Nauch. Issled. Ikhtiologicheskii Inst., Izv. 1: 81-128. (In Russian).
Cleaver, F. C. 1969. Effects of ocean fishing on 1961-brood fall chinook salmon from Columbia River hatcheries. Res. Repts. Fish Comm. Oregon 1(1): 3-76.
Clemens, W. A. 1931. Analysis of the catches of spring salmon captured by troll off west coasts of Vancouver Island and Queen Charlotte Islands. Proc. 1930 Annual Meeting, Intern. Pacific Salmon Federation, at Stanford University, p. 14-15.
Donaldson, L. R. 1970. Selective breeding of salmonid fishes. Pages 65-74 in Marine Aquiculature. Oregon State Univeristy, Corvallis.
Fraser, C. McLean. 1921. Further studies on the growth rate in Pacific salmon. Cont. Can. Biol. for 1918-20: 7-27.
Junge, C. 0., and L. A. Phinney. 1963. Factors influencing the return of fall chinook salmon (Oncorhynchus tshawytscha) to Spring Creek Hatchery. U.S. Fish Wildlife Serv., Spec. Sci. Rept. -Fisheries, No. 455, p. 32.
Milne, D. J. 1957. Recent British Columbia spring and coho salmon tagging experiments and a comparison with those conducted from 1925 to 1930. Bull. Fish. Res. Bd. Canada, No. 113, p. 56.
Mottley, C. McC. 1929. Pacific salmon migrations. Report on the study of the scales of the spring salmon, (Oncorhynchus tshawytscha), tagged 1n 1926 and 1927 off the west coast of Vancouver Island. Contr. Can. Biol. Fish. 4: 473-493 and 3 plates.
Neave, F. 1951. Observations on troll-caught salmon of the west coast of Vancouver Island. Bull. Pacific Marine Fish. Comm. 2: 93-101.
Parker, R. R., and P. A. Larkin. 1959. A concept of growth in fishes. J. Fish. Res. Board Can. 16: 721-745.
Pritchard, A. L. 1940. Studies on the age of the coho salmon (Oncorhynchus kisutch) and the spring salmon (Oncorhynchus tshawytscha) in British Columbia. Trans. Royal Soc. Canada, Section 5, p. 99-120 + 2 plates.
Ricker, W. E. salmonid Salmon:. Columbia.
1972. Hereditary and environmental factors affecting certain populations. Pages 27-160 in "The Stock Concept in Pacific H. R. MacMillan Lectures in Fisheries, University of British
1976. Review of the rate of growth and mortality of Pacific salmon in salt water, and noncatch mortality caused by fishing. J. Fish. Res. Board Can. 33: 1483-1524.

- 16 -
1980. Changes in the age and s1ze of chum salmon. Can. Tech. Rep. Fish. Aquat. Sci. (In press).
Ricker, W. E., H. T. Bilton, and K. V. Aro. 1978. Causes of the decrease in size of pink salmon (Oncorhynchus gorbuscha). Fish. Mar. Ser. Can. Tech. Rep. 820: 93 p.
Snyder, J. 0. 1931. Tagging and marking. 5. Report from California Division of Fish and Game. Proc. 1930 Ann. Meeting, Int. Pacific Salmon Federation, at Stanford Univ., p. 13-14 and 1 figure.
Warner, G. H., D. H. Fry, and A. N. Culver. 1961. salmon marked and released at Nimbus Hatchery. 47(4): 343-355.
History of yearling king Calif. Fish. Game

- 17 -
Table 1. Percentages of chinook salmon of different ages taken by trolling in different years and in different statistical areas of British Columbia. For sources, see the text.
Age in years completed
Area Year N 1 2 3 4 5 6 7 8
23a 1926 1117 3.2 28.4 50.0 17.5+ 0.9+ 0.0+
Mainly 23h 1949 737 3.1 83.6 12.9+ 0.4+ 0.0+
21-24C 1964 9285 3.3 60.5 32.6 3.5 0.1
1965 7284 4. 8 57.6 34.1 3.4 0.1
2Wd 1929 326 o.o 0.9 7. 7 31.0 47.9+ 11. 6+ 0.6+ 0.3+
1930 145 o.o 0.7 2.1 56.6 37.9+ 2.8+ 0.0+
1964 2186 0.2 42.3 46.4 10.8 0.3 0.1
1965 1330 0.8 41.9 39.0 8.2 0.1
a hOff Ucluelet.
About 6% of these fish were from Area 27. c d"Southwestern Vancouver Island".
Islands. Off the west coast of the Queen Charlotte
Mean
2.84+
2.11+
2.37
2.36
4.65+
4.40+
2. 69
2.35
Year
1951 1952 1953 1954 1955
1956 1957 1958 1959 1960
1961 1962 1963 1964 1965
1966 1967 1968 1969 1970
1971 1972 1973 1974 1975
Table 2. Mean whole weight in pounds of chinook salmon in Southeastern Alaska and in most Statistical Areas of British·columbia. The British Columbia figures include troll-caught "mixed springs" only, and the great majority of the Alaska fish were caught by troll.
British Columbia Statistical Area SE
Alaska 1 2E 2W 3 4 5 6 7 8 9 10 11
21.28 20.13 21.99 18.12 18.92 19.29 19.66 18.35 10.54 23.92 20.13 17.28 20.96 18.74 18.21 16.94 16.60 19.25 20.61 21.59 17.33 17.54 15.86 20.52 19.19 17.80 17.27 15.48 19.65 20.12 18.07 23.80 23.02 18.13 22.69 20.82 19.78 17.15 16.69 20.31 19.93 19.68 14.87 17.82 21.82 18.87 21.06 20.95 18.45 18.07 15.82 19.40 20.16
20.35 20.51 21.05 19.98 13.80 14.99 14.06 17.14 16.67 15.24 20.40 18.06 20.28 18.68 19.39 17.08 15.35 20.20 20.33 13.84 17.15 22.46 16.61 18.47 19.09 16.65 14.98 14.40 20.71 19.44 14.95 13.55 15.33 21.61 16.91 23.33 21.47 15.64 17.31 14.75 19.86 17.08 15.40 12.94 14.38
16.3 19.88 16.31 22.56 18.69 1;> 0 04 14.00 12.99 18.89 16.72 12.86 12.44
13.0 20.05 15.48 23.21 19.98 16.21 14.78 12.35 20.46 17.26 14.66 13.20 9.59 18.2 17.91 15.14 19.79 14.19 12.19 13.00 11.67 18.09 17.05 15.33 12.69 17.1 18.58 12.74 15.04 15.16 12.56 11.05 9.38 19.36 16.79 12.05 12.61 18.4 17.62 15.19 19.40 16.69 12.62 12.44 11.32 18.53 13.87 11.05 10.75 11.08 21.1 16.47 16.58 20.05 17.28 12.71 14.07 14.27 20.92 10.71 12.67 13.07 13.05
15.2 16.41 13.12 16.31 16.18 11.64 12.06 12.01 18.40 16.98 13.00 11.33 10.81 15.1 16.49 15.93 20.27 14.08 12.01 13.06 12.27 18.99 16.91 12.98 11.53 16.94 16.2 17.54 15.07 19.13 16.52 11.73 11.87 14.75 21.44 16.39 12.99 11.69 13.41 13.5 15.94 15.55 19.81 15.11 10.73 10.08 13.04 19.20 15.35 13.99 11.52 11.80 14.3 15.52 14.93 16.41 12.65 9.78 11.68 11.86 17.35 13.69 10.53 10.66 12.63
13.6 14.82 16.86 13.66 11.45 10.54 13.31 13.48 17.52 14.38 13.73 12.72 13.60 12.1 13.65 13.65 16.49 10.36 8.91 12.21 11.42 17.27 15.14 8.35 11.26 12.85 13.8 14.78 12.19 18.35 13.28 9.49 11.11 11.85 17.59 13.81 10.08 13.05 15.06 13.3 15.05 12.84 16.61 15.78 10.89 9.65 10.54 14.92 14.15 8.87 12.18 13.58
14.32 12.18 16.33 12.47 9.88 10.80 12.29 16.47 16.56 8.74 14.42 17.16
Mean (1963) 16.67 18.14 15.84 19.35 16.67 13.82 13.93 13.53 18.81 16.42 14.08 13.41 14.11
...... 00
I

Table 2 (coot 'd)
British Columbia Statistical Area
Year 12 13 17 18 20 21 23 24 25 26 27
1951 12.72 13.14 11.74 14.69 13.56 15.72 14.01 15.80 19.19 19.40 19.96 1952 16.21 12.29 10.44 17.06 16.04 16.08 15.00 18.48 19.73 20.66 22.15 1953 16.58 11.91 9.38 13.79 16.42 15.65 14.53 17.16 19.66 20.49 19.11 1954 18.86 11.16 10.73 14.40 13.06 12.78 15.86 18.13 16.88 19.11 1955 14.41 10.94 9.22 12.65 11.76 14.41 18.01 18.82 19.46
1956 13.37 9.88 8.51 12.56 13.07 12.00 14.29 18.08 18.60 17.87 1957 15.05 10.89 11.28 10.24 14.35 12.52 12.01 14.45 17.91 18.11 20.19 1958 15.01 10.31 7.99 9.80 14.75 11.31 11.22 13.29 15.91 15.66 17.19 1959 15.14 10.64 8.05 11.24 14.72 11.27 12.07 14.48 15.35 16.39 17.52 1960 14.64 9.65 10.93 10.65 12.65 12.22 12.32 14.68 13.75 16.20 15.87
1961 13.01 11.09 6.52 8.41 11.80 11.72 12.14 15.78 15.29 16.35 16.26 -\0
1962 12.20 9.64 5.78 6.99 9.74 10.41 12.92 17.45 16.54 17.68 17.27 1963 11.27 10.58 6.00 7.40 9.33 11.22 12.34 14.48 15.88 17.20 15.32 1964 10.81 10.24 6.04 7.79 8. 72 10.86 11.67 15.13 15.18 17.87 17.20 1965 11.94 9.89 5.52 6.58 10.68 11.20 11.60 13.33 13.88 15.65 17.68
1966 10.11 9.78 6.60 8.05 11.42 9.93 12.20 15.20 15.73 18.14 17.87 1967 12.55 10.06 6.28 8.35 11.81 10.58 12.34 14.99 16.91 17.96 17.22 1968 13.68 10.51 6.91 8.69 10.91 11.46 11.95 14.28 16.08 17.95 17.91 1969 12.28 10.16 6. 72 7.76 8.86 11.25 11.99 14.04 14.39 16.21 16.41 1970 11.84 7.79 7.74 8.00 10.21 11.04 11.78 14.33 15.61 16.71 15.60
1971 12.52 8.11 5.74 7.01 10.71 11.55 12.72 14.34 14.91 17.34 14.99 1972 11.98 8.31 6.09 6.46 11.69 10.68 11.73 13.42 15.73 17.29 15.32 1973 11.44 8.42 6.88 6.60 10.72 11.41 13.20 13.96 14.65 16.35 1974 11.51 8.59 6.25 6.54 10.33 10.87 11.11 12.38 13.52 14.60 14.08 1975 10.69 7.35 5.94 7.53 10.06 10.98 11.61 13.46 15.76 15.54
Mean (1963) 13.19 10.05 7.73 9.56 11.86 11.88 12.26 14.68 16.11 17.30 17.38

- 20 -
Table 3. Trends in mean whole weight in pounds of chinook salmon caught by trolling. N =number of years' data used; r =linear correlation coefficient; b =regression coefficient (lb/yr); 1951 and 1975 =computed sizes (lb) in the years indicated; decrease = computed decrease in size between 1951 and 1975.
Region Area N r b 1951 1975 Decrease
Mainland coast and straita Northern 3 25 -0.817** -0.3501 20.87 12.47 8.40
4 25 -0.926** -0.4378 19.08 8.57 10.51
Hecate Strait 2E 25 -0.769** -0.2388 18. 7l 12.98 5.73 5 25 -0.893** -0.3320 17.91 9.94 7.97 6 25 -0. 728** -0.2265 16.25 10.81 5.44
Central 7 25 -0.507** -0.1059 20.08 17.54 2.54 8 25 -0.477** -0.1795 18.57 14.26 4.31 9 21 -0.905** -0.4853 20.30 8.65 11.65
10 21 -0.521* -0.2174 16.02 10.80 5.22 11 20 -0.259 -0.0920 15.22 13.01 2.21
John11tone Strait 12 25 -0.717** -0.2046 15.65 10.74 4.91 13 25 -0.868** -0.1655 12.03 8.06 3.97
s. Georgia and Juan 17 25 -0.769** -0.2078 10.23 5.24 4.99 de Fuca Straits 18 25 -0.863** -0.3559 13.83 5.29 8.54
20 20 -0.671** -0.2291 14.61 9.11 5.50
Fraser 29A+B 18 -0.517* -o .1480 9.19 5.62 3.57
Outer coasts of the big isbnds Queen Charlotte Is. 1 25 -0.875** -0.3315 22.13 14.17 7.96
2W 25 -0.687** -0.2451 22.30 16.42 5.88
Vancouver Island 27 25 -0.805** -0.2132 19.94 14.82 5.12 26 25 -0.645** -0.1378 18.95 15.65 3.30 25 25 -0.804** -0.2078 18.60 13.62 4.98 24 25 -0.666** -0.1382 16.33 13.01 3.32 23 25 -0.643** -0.0861 13.29 11.23 2.06 21 25 -0.783** -0.1813 14.07 9. 72 4.35
Means -0.2299 16.84 11.32 5.52 Percentage decrease 32.8%

- 21 -
Table 4. Comparison of mean whole weights in pounds of troll-caught chinooks in early years, from Clemens (1931), with the computed sizes in 1951 and 1975, from Table 3.
Early Period 1951 1975
Area Year Weight Weight Weight
1 1929 20.7 22.1 14.2
2W 1929 26.2 22.3 16.4
27 1927 22.5+ 19.9 14.8
26 1927 26.3+ 19.0 15.6
23 1925-26 16.8+ 13.3 ll.2

- 22 -
Table 5. Computation of effects of troll fishing on the age composition of spawning stocks of chinook salmon. (See the text)
A. Data from the 1926-27 tagging experiments off Vancouver Island.
1. Age 2 3 4 5
2. Total fish tagged 374 769 394 43
3. Same, as percentage 23.7 48.6 24.9 2.7
4. Recaptures same year 13 82 53 5
5. Same, as percentage 3.5 10.7 18.0 11.6
6. Estimated percentage maturing 10 30 50 80
B. Equilibrium age structure of spawning stock for different rates of
fishing (F) and rates of exploitation (u) when M = 0.1, as percentages
7. Age
8. F = 0, u = 0
9. F = O. 1, u = O. 09
10. F = 0.5, u = 0.38
11. F = 1.0, u = 0.61
12. F = 1.5, u = 0.75
3
12.0
14.3
25.6
42.6
59.1
4
29.4
31.7
37.9
38.2
32.2
5
31.0
30.3
24.3
14.8
7. 6
6
22.5
19.8
10.7
4.0
1. 2
6
1
o.o
0
0
100
7
5.1
4.0
1.4
0.4
o.o

- 23 -
Table 6. Correlations between residuals of weight of chinook salmon in three Areas and the residuals of August through July mean surface temperatures at three coastal stations. S = weights compared with temperature in the year ending in July of the same year as the weights were obtained; P = comparisons with temperatures of the previous year; A = comparisons with temperatures of the year before that.
British Columbia Southeastern
Area 1 Area 2 Alaska
Station N r N r N r
Langara s 15 -0.100
Cape St. James s 24 -0.383 24 -0.164 15 -0.105 p 24 -0.192 24 -0.119 A 24 -0.015 24 -0.159
Amphitrite s 25 -0.457* 25 -0.255 p 25 +0.177 25 -0.103 A 25 +0.009 25 -0.172


- 25 -
• • 22 • • •
AREA 20 • ••
0
18 (/) • • 0 0 z AREA 24 :J 0 16 0 a_
0 0 0 z o 0 o I- 14 I 0 0 <9 • w • 0 3: 12
AREA 13 0 0 z :J 0 0 10 • • 0:: •
0
8 AREA •
0 0 0
6 000 0 0
4 1950 1955 1965 1970
Fig. 1. Mean weights of troll-caught chinook salmon in 4 statistical Areas of British Columbia. Data from Table 2.